Chart Color Schemes
This analysis uses ABS Statistical Areas Level 2 (SA2) boundaries, which can materially differ from Suburbs and Localities (SAL) even when sharing similar names.
SA2 boundaries are defined by the Australian Bureau of Statistics and are designed to represent communities for statistical reporting (e.g., census and ERP).
Suburbs and Localities (SAL) represent commonly-used suburb/locality names (postal-style areas) and may use different geographic boundaries. For comprehensive analysis, consider reviewing both boundary types if available.
est. as @ -- *
ABS ERP | -- people | --
2021 Census | -- people
Sales Activity
Curious about local property values? Filter the chart to assess the volume and appreciation (including resales) trends and regional comparisons, or scroll to the map below view this information at an individual property level.
Find a Recent Sale
Sales Detail
Population
Berwick - North is positioned among the lower quartile of areas assessed nationally for population growth based on AreaSearch's assessment of recent, and medium term trends
Berwick - North's population is approximately 23,851 as of November 2025. This figure represents an increase of 888 people since the 2021 Census, which recorded a population of 22,963. The growth is inferred from ABS estimates: 23,797 in June 2024 and an additional 111 validated new addresses since the Census date. This results in a population density of 1,207 persons per square kilometer, higher than the average seen across national locations assessed by AreaSearch. Berwick - North's growth rate of 3.9% since the census is within 2.2 percentage points of the SA3 area (6.1%). Overseas migration was the primary driver of population gains during recent periods.
AreaSearch uses ABS/Geoscience Australia projections for each SA2 area, released in 2024 with a base year of 2022. For areas not covered by this data, AreaSearch employs VIC State Government's Regional/LGA projections released in 2023, adjusted using weighted aggregation methods to SA2 levels. Growth rates by age group are applied across all areas for years 2032 to 2041. Based on these projections, Berwick - North is expected to increase by approximately 1,847 persons by 2041, reflecting a gain of around 7.5% in total over the 17-year period.
Frequently Asked Questions - Population
Development
AreaSearch assessment of residential development drivers sees a low level of activity in Berwick - North, placing the area among the bottom 25% of areas assessed nationally
Berwick - North has seen approximately 54 new homes approved annually over the past five financial years ending June 2021, totalling 273 homes. As of August 2021 in FY-26, 51 approvals have been recorded. Despite population decline during this period, development activity has been relatively adequate, which is positive for buyers. The average expected construction cost value of new homes is $689,000, indicating developers are targeting the premium market segment with higher-end properties.
In FY-26, commercial development approvals totalled $78.0 million, suggesting strong commercial development momentum in Berwick - North. Compared to Greater Melbourne, Berwick - North has significantly less development activity, 62.0% below the regional average per person as of August 2021. This scarcity typically strengthens demand and prices for existing properties. The new dwelling approvals ratio is also lower than the national average, reflecting market maturity and possible development constraints. New development in Berwick - North consists of 56.0% detached dwellings and 44.0% attached dwellings, with a growing mix of townhouses and apartments offering options across different price points. This shift from the current housing mix (currently 82.0% houses) reflects reduced availability of development sites and addresses shifting lifestyle demands and affordability requirements.
As of August 2021, Berwick - North indicates a mature market with around 543 people per approval. Looking ahead, AreaSearch's latest quarterly estimate projects Berwick - North to grow by 1,793 residents through to 2041. Building activity is keeping pace with growth projections, but buyers may experience heightened competition as the population grows.
Frequently Asked Questions - Development
Infrastructure
Berwick - North has moderate levels of nearby infrastructure activity, ranking in the 47thth percentile nationally
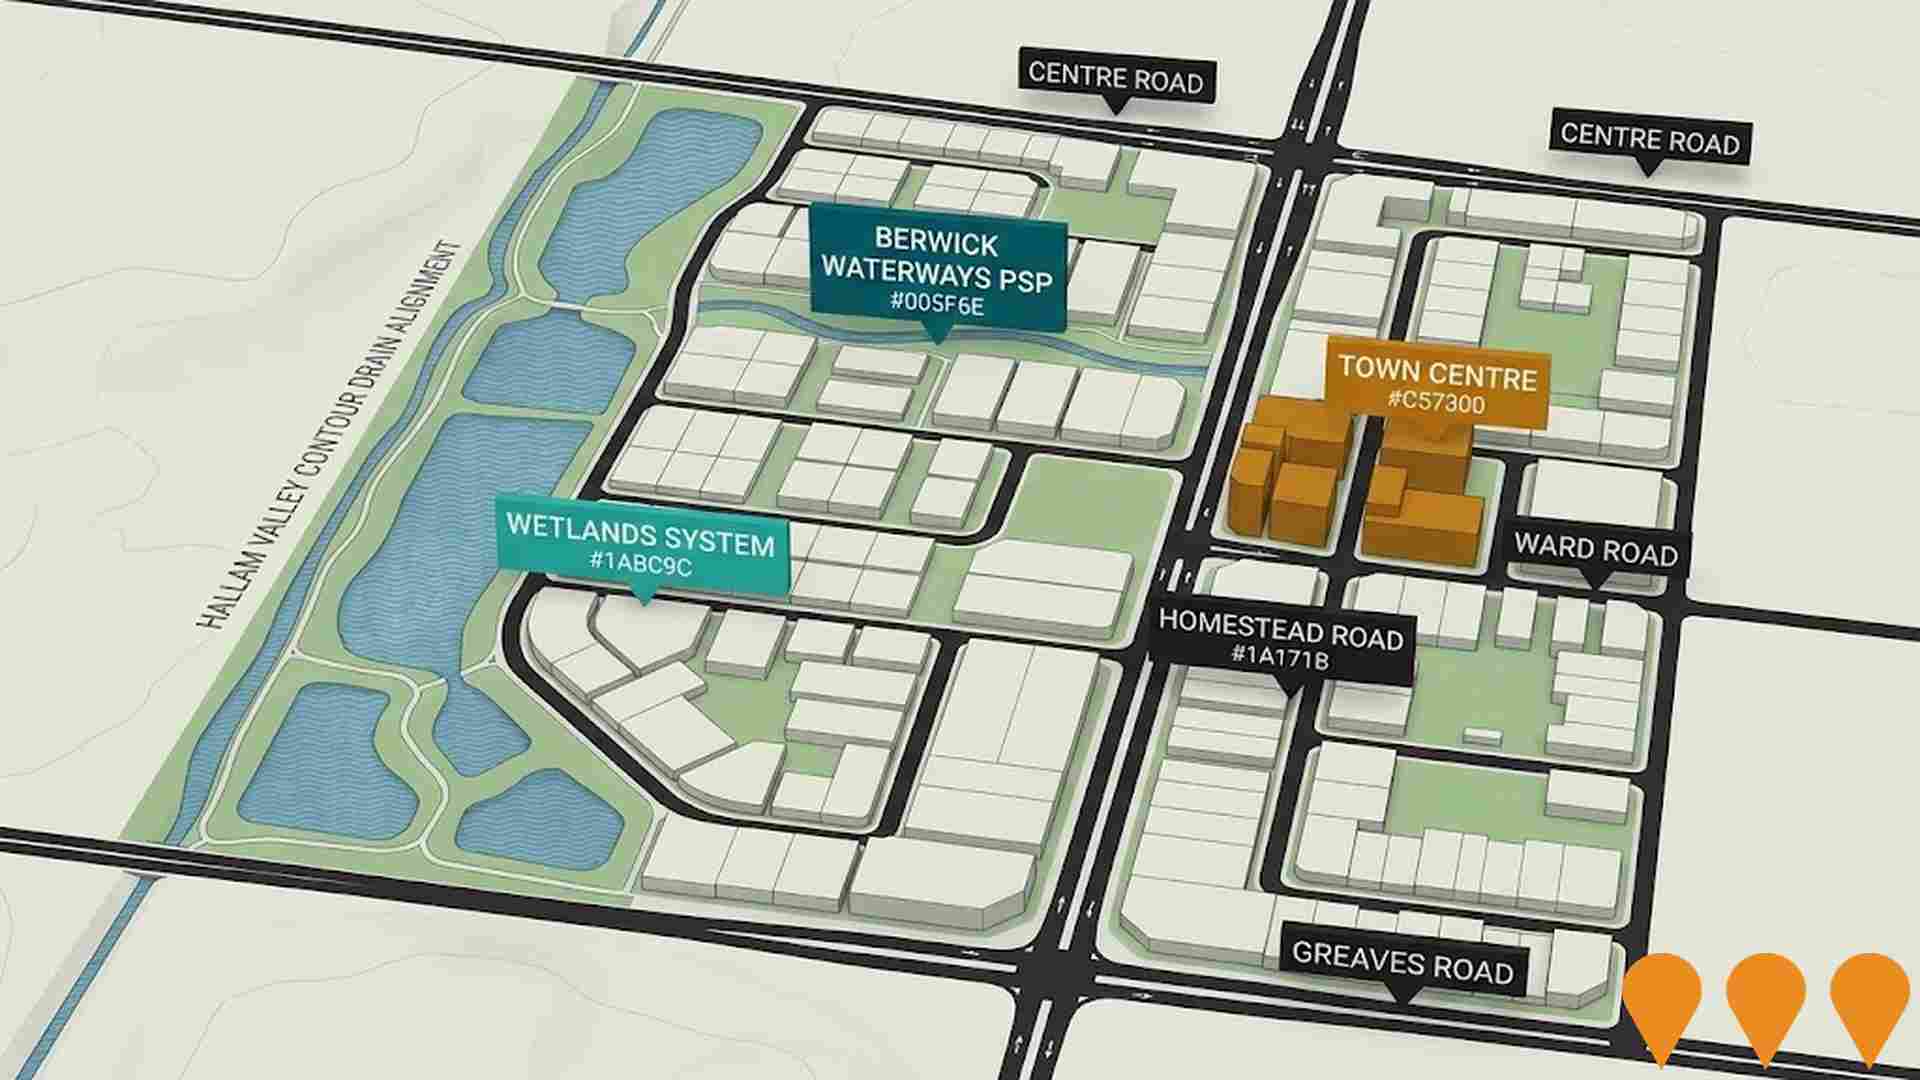
Changes in local infrastructure significantly affect an area's performance. AreaSearch has identified 26 projects that could impact this region. Notable ones include Casey Hospital Emergency Department Expansion, Clyde Road Upgrade, Berwick Waterways Precinct Structure Plan, and Berwick Health and Education Precinct. The following list details those likely to be most relevant.
Professional plan users can use the search below to filter and access additional projects.
INFRASTRUCTURE SEARCH
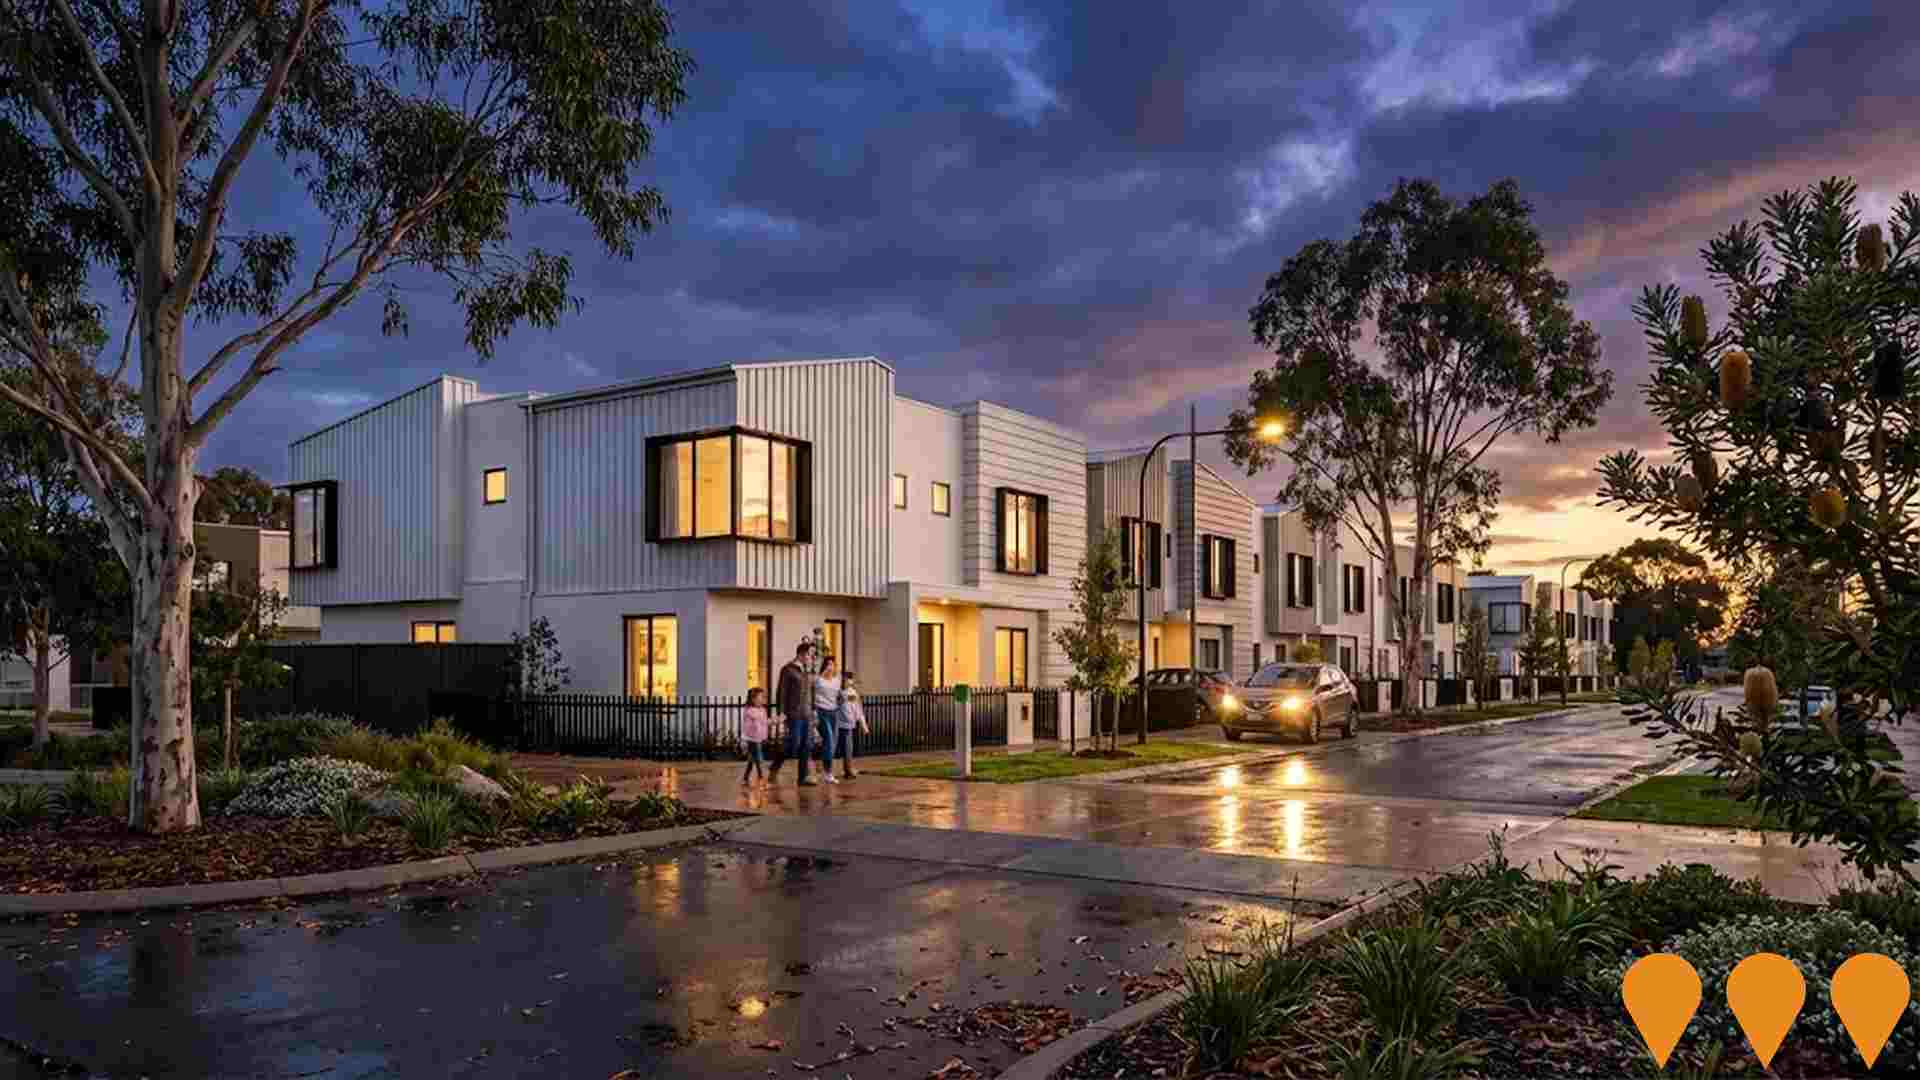
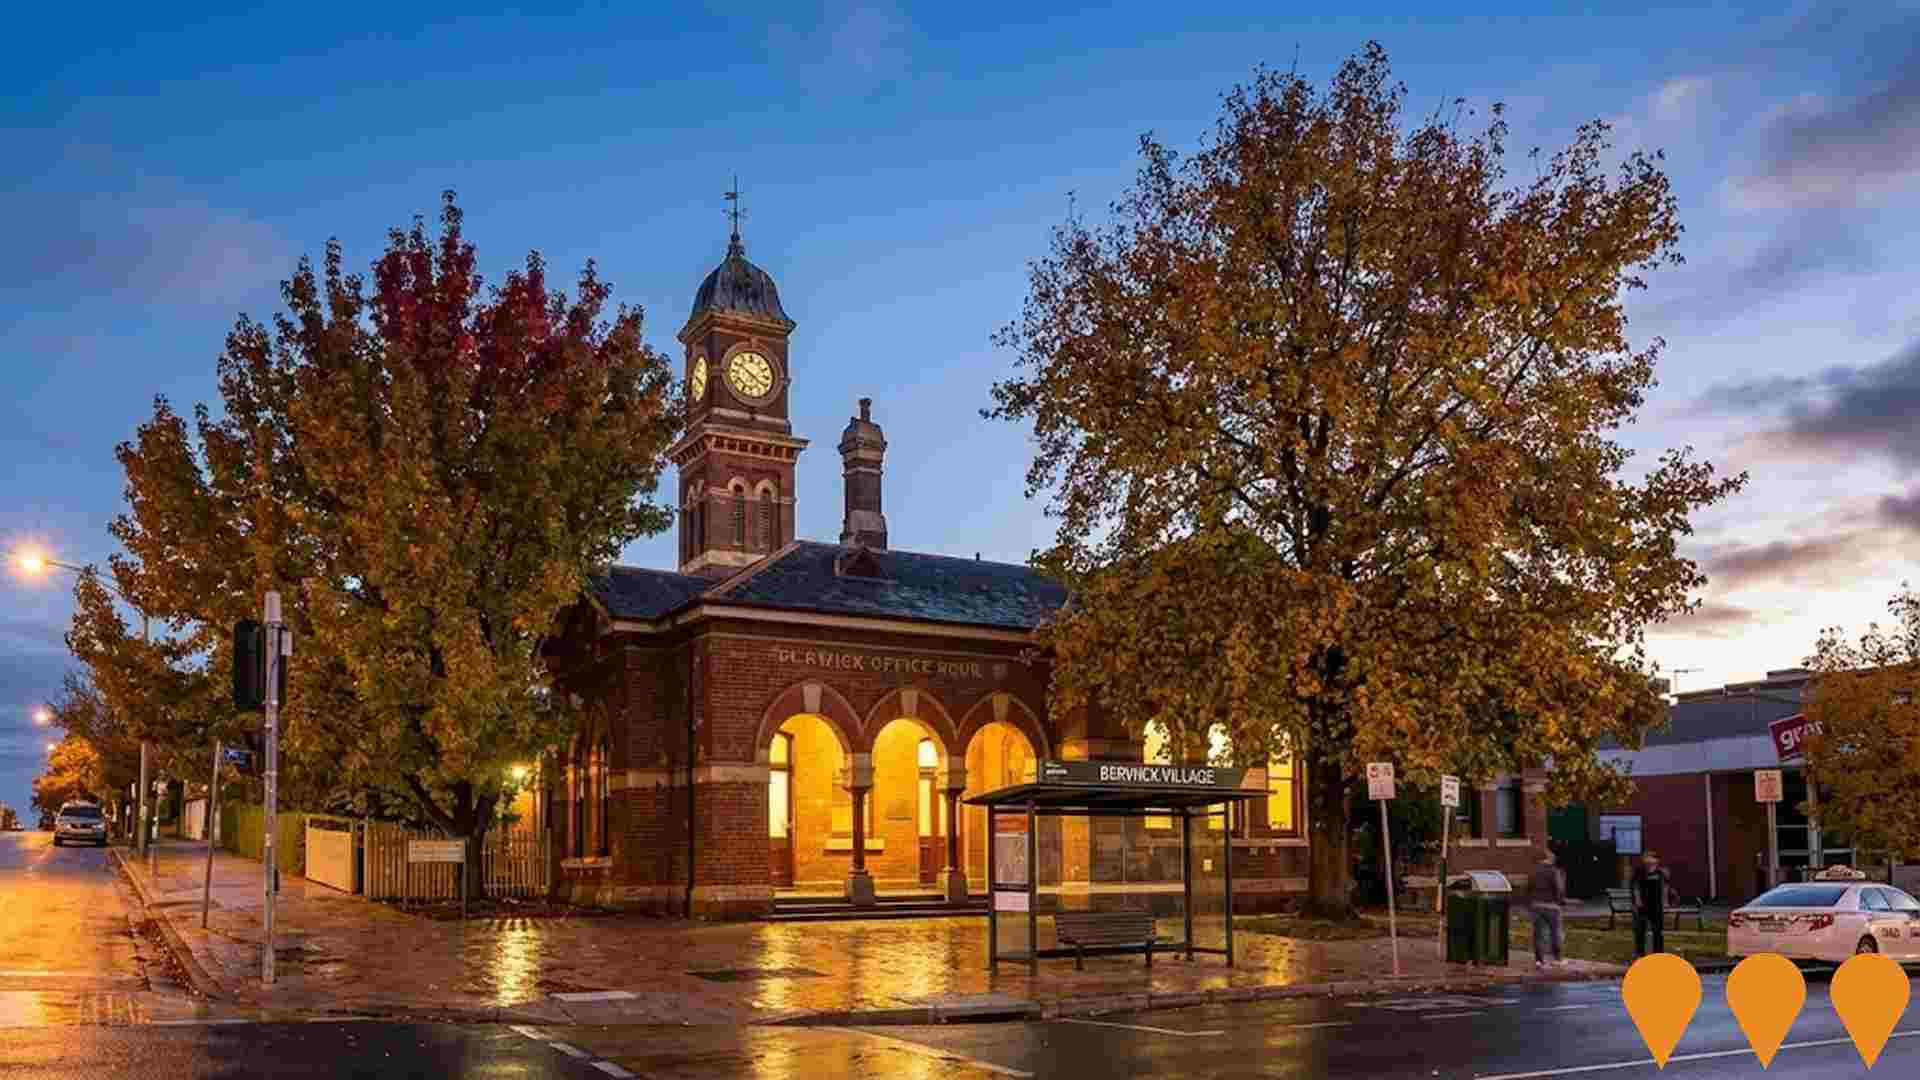
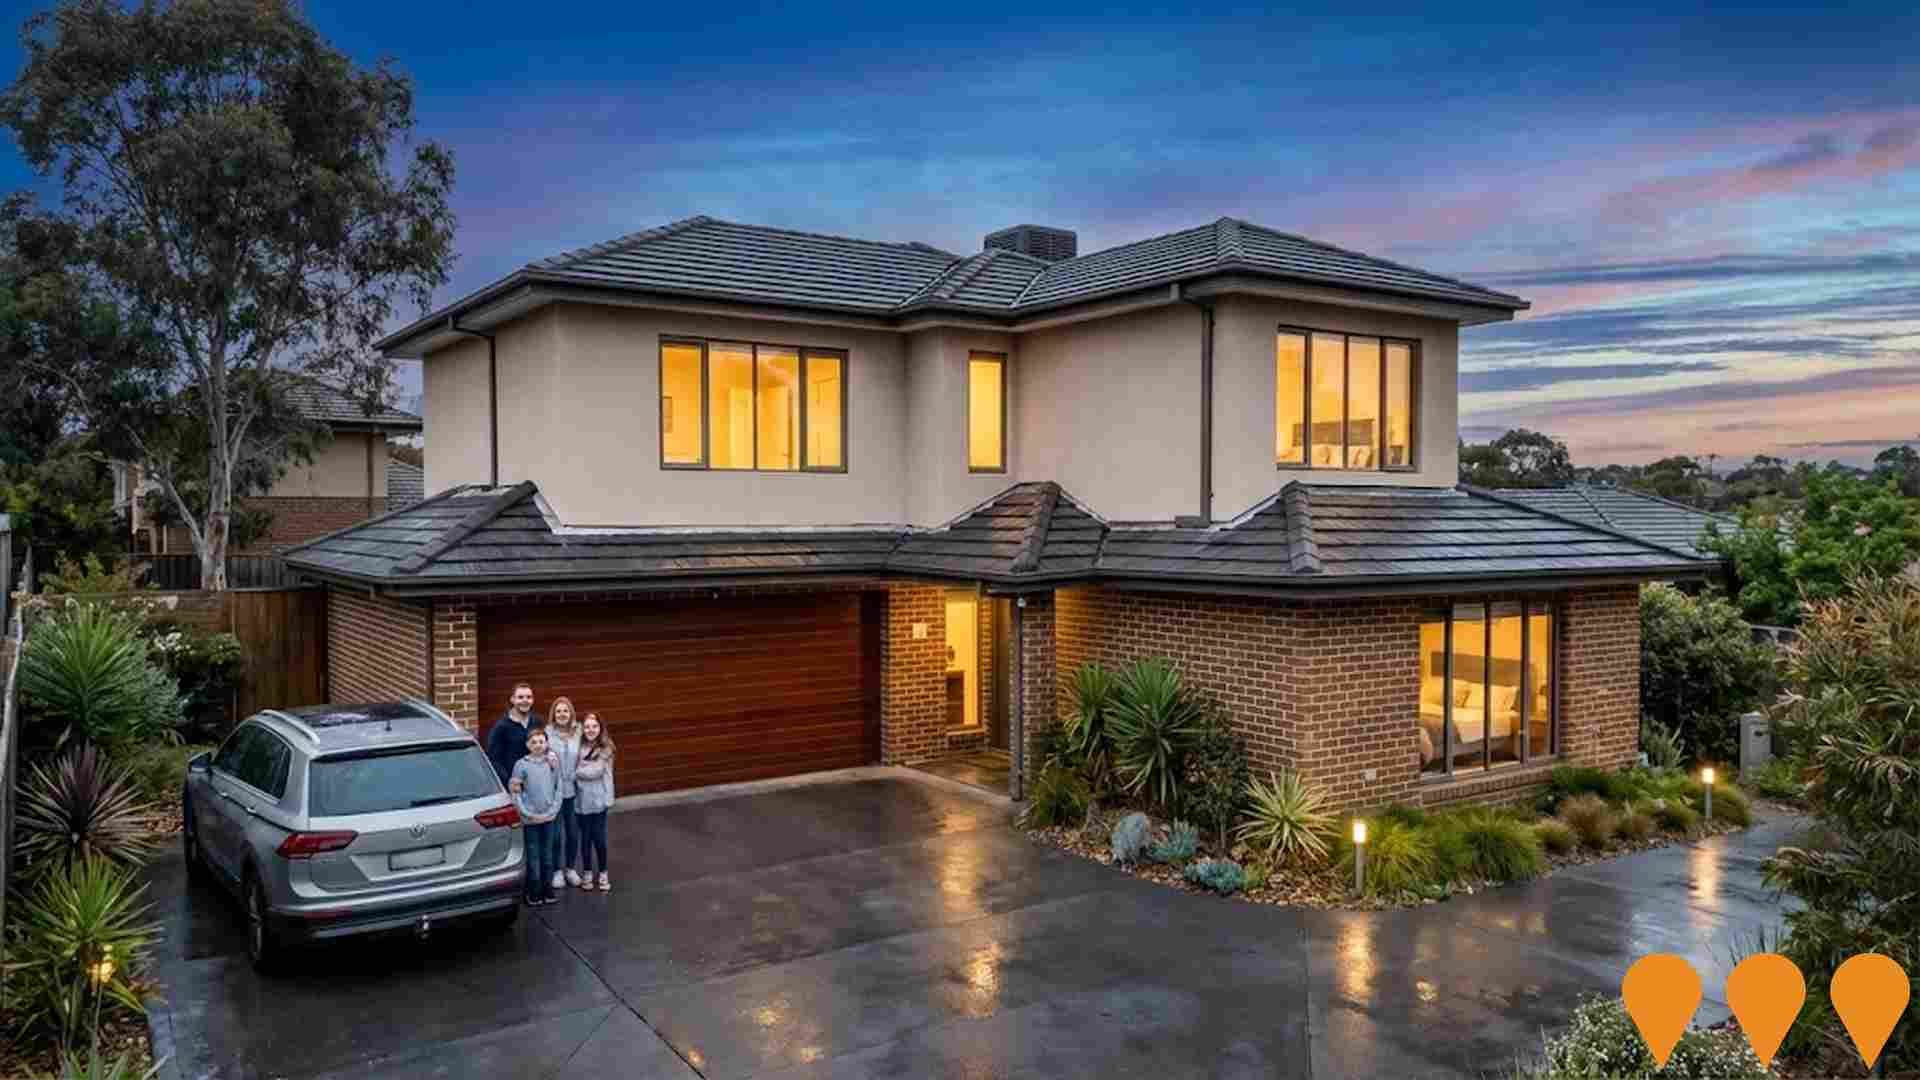
 Denotes AI-based impression for illustrative purposes only, not to be taken as definitive under any circumstances. Please follow links and conduct other investigations from the project's source for actual imagery. Developers and project owners wishing us to use original imagery please Contact Us and we will do so.
Frequently Asked Questions - Infrastructure
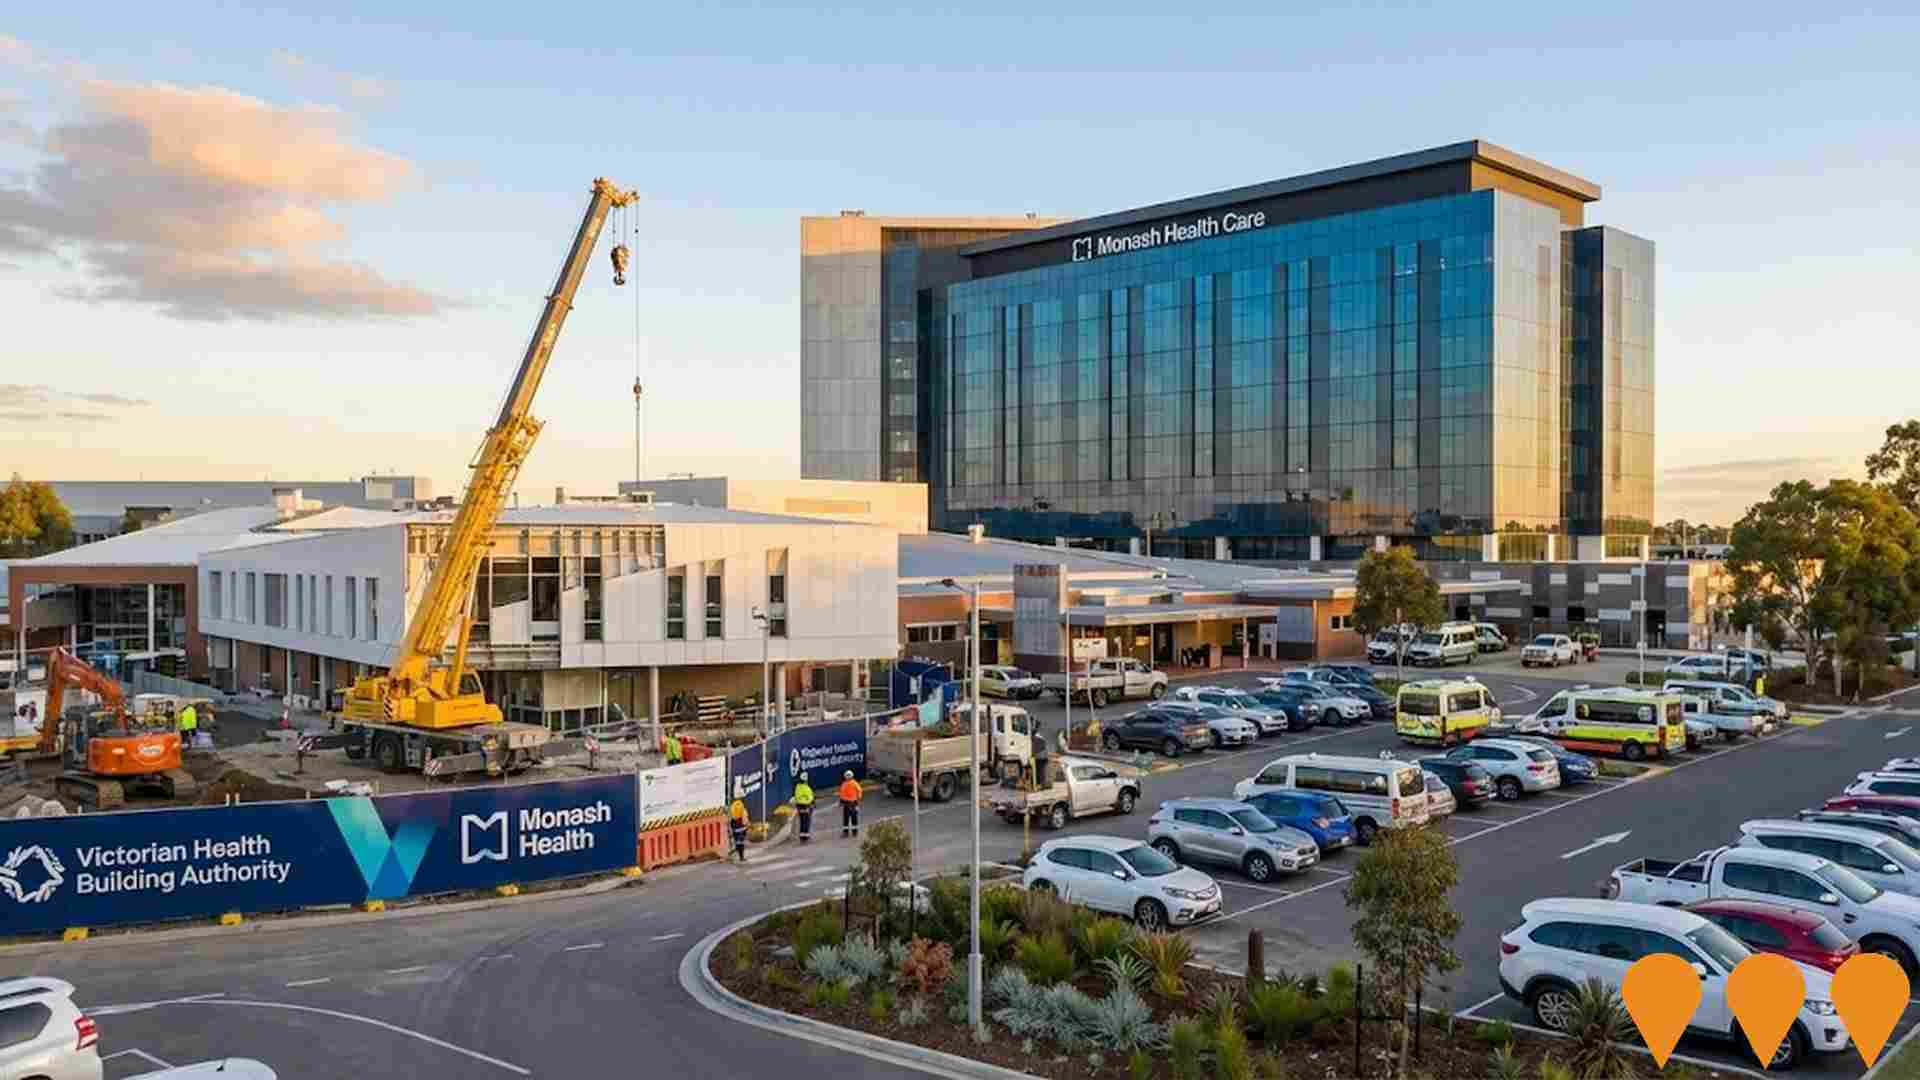
Casey Hospital Emergency Department Expansion
The Casey Hospital Emergency Department Expansion is part of a $280 million investment by the Victorian Government. It will significantly expand the emergency department to treat an estimated extra 52,000 presentations annually. The project includes a specially designed children's emergency zone, improved patient flow systems, additional treatment bays, a mental health zone, and satellite imaging facilities. Construction commenced in 2025 and is expected to be complete in 2027. The project is being delivered by the Victorian Health Building Authority (VHBA) in partnership with Monash Health, and is expected to create over 1,000 jobs during peak construction (combined with Werribee Mercy Hospital expansion).
Berwick Health and Education Precinct
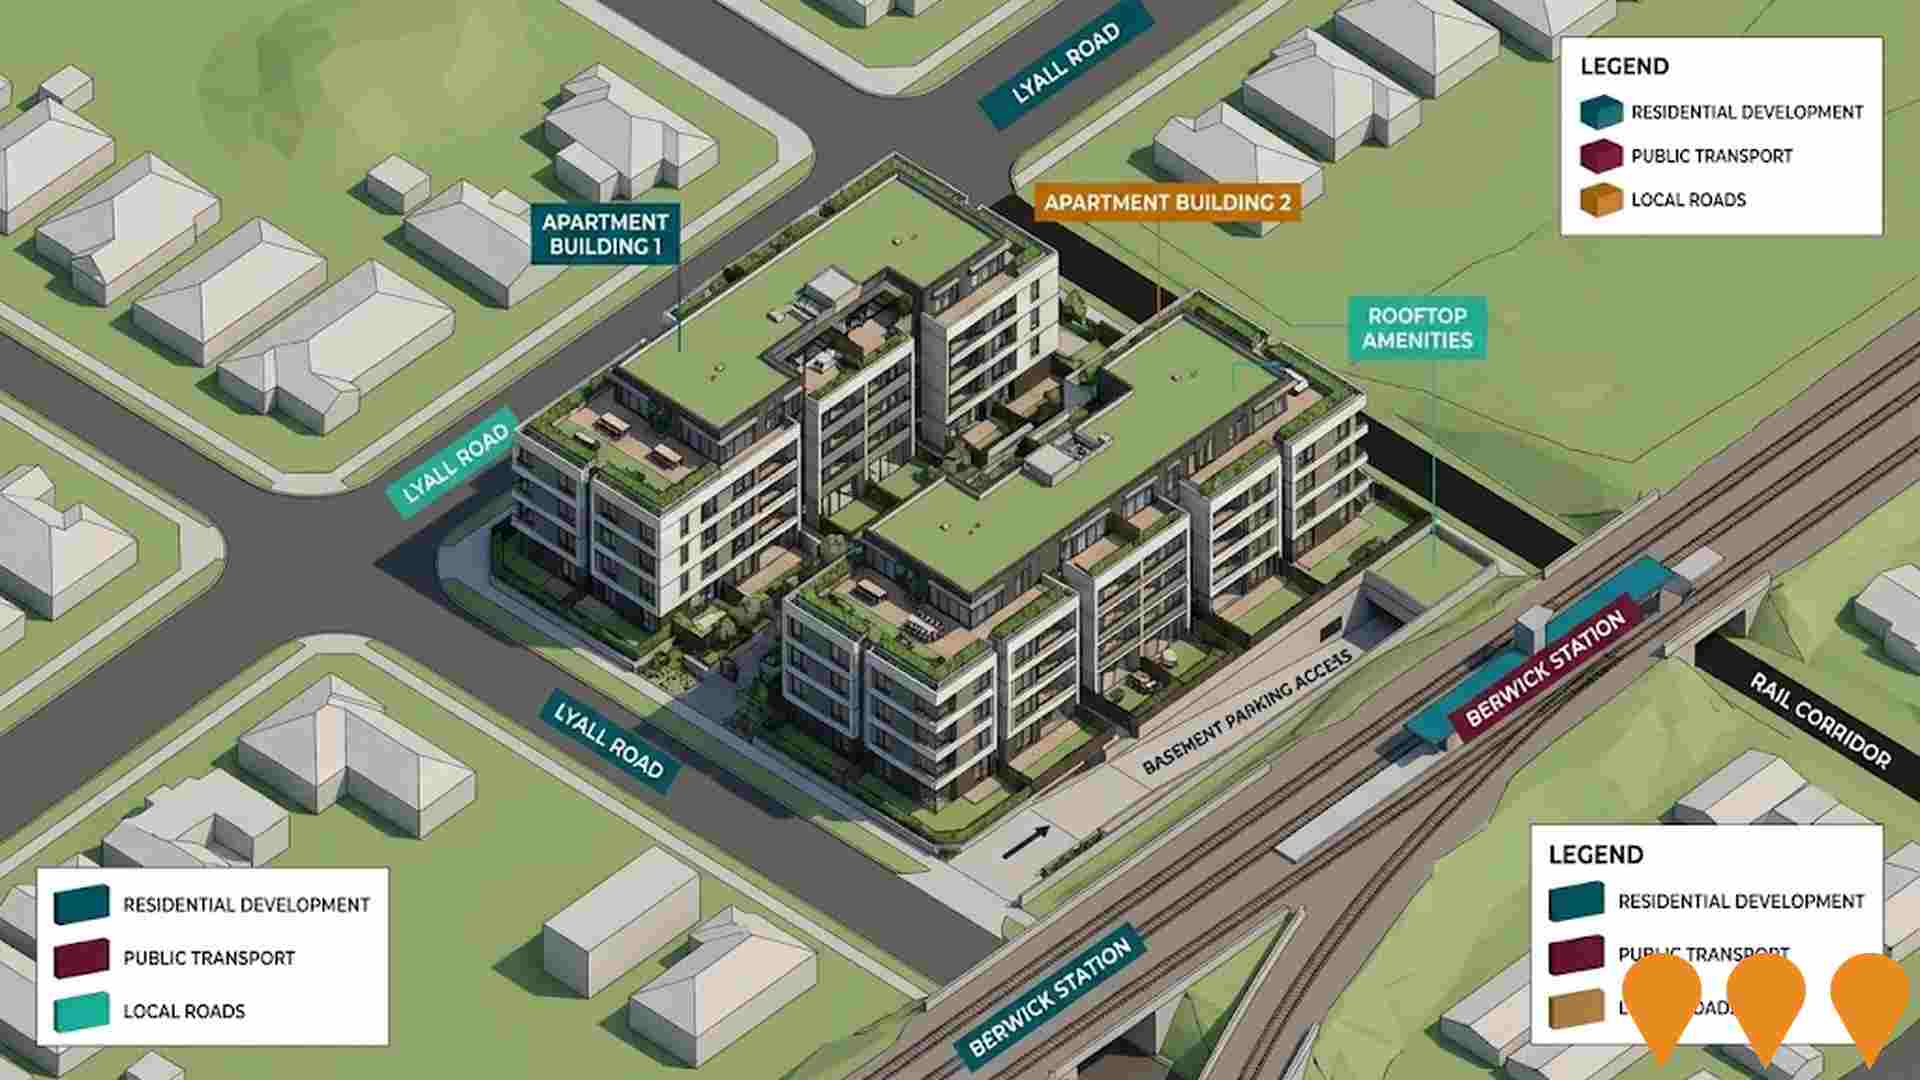
122-hectare master-planned precinct in Berwick delivering a major expansion of Monash Health's Casey Hospital (up to 700 beds), growth of Chisholm Institute and Federation University campuses, new private health and tertiary education facilities, plus approximately 1,030 new dwellings and commercial development centred around Berwick Station.

Minta
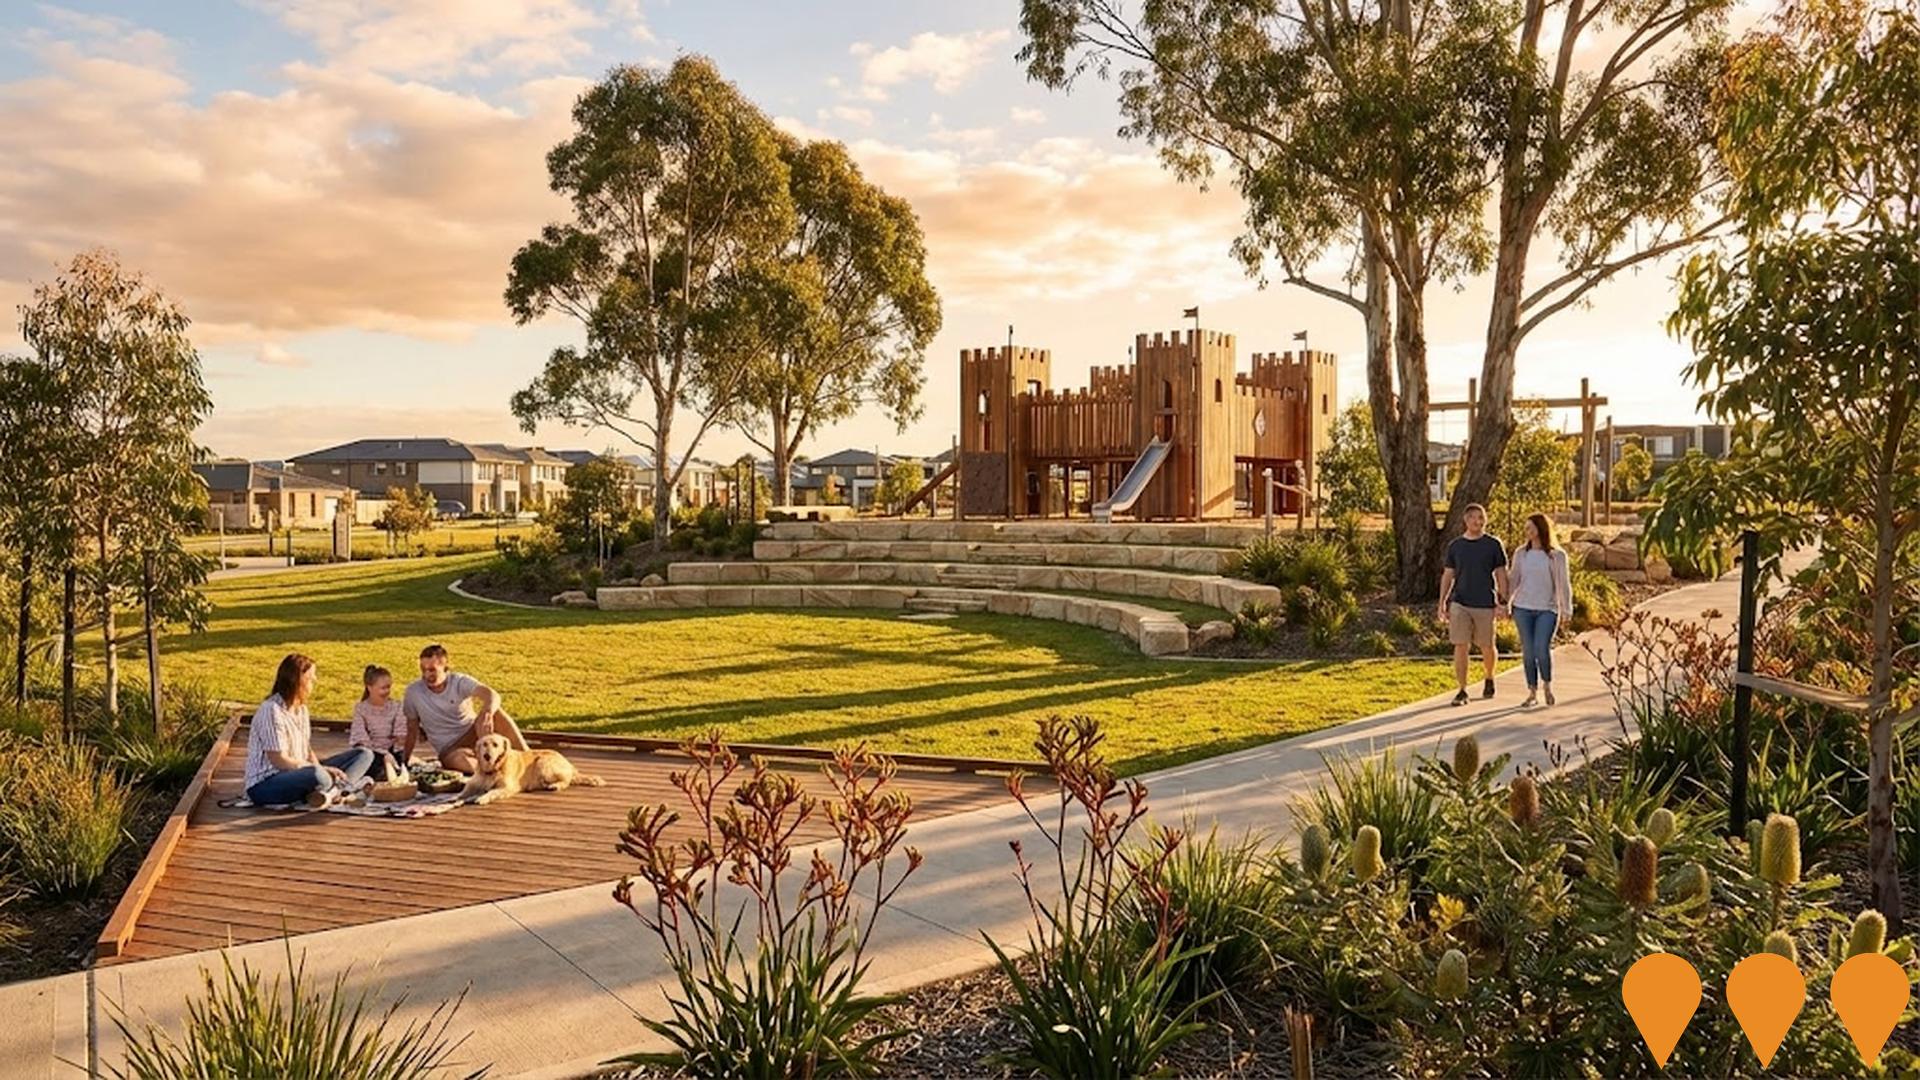
Large-scale masterplanned community by Stockland on the former Minta Farm site, covering approximately 114 hectares and planned to deliver 1,700 homes, a future town centre, schools, parks, and an employment hub that is envisioned to support around 11,000 local jobs. The estate features 22+ hectares of green open spaces and a lake-filled nature reserve, and is located in Berwick, 48km south-east of the Melbourne CBD.
Alira Village
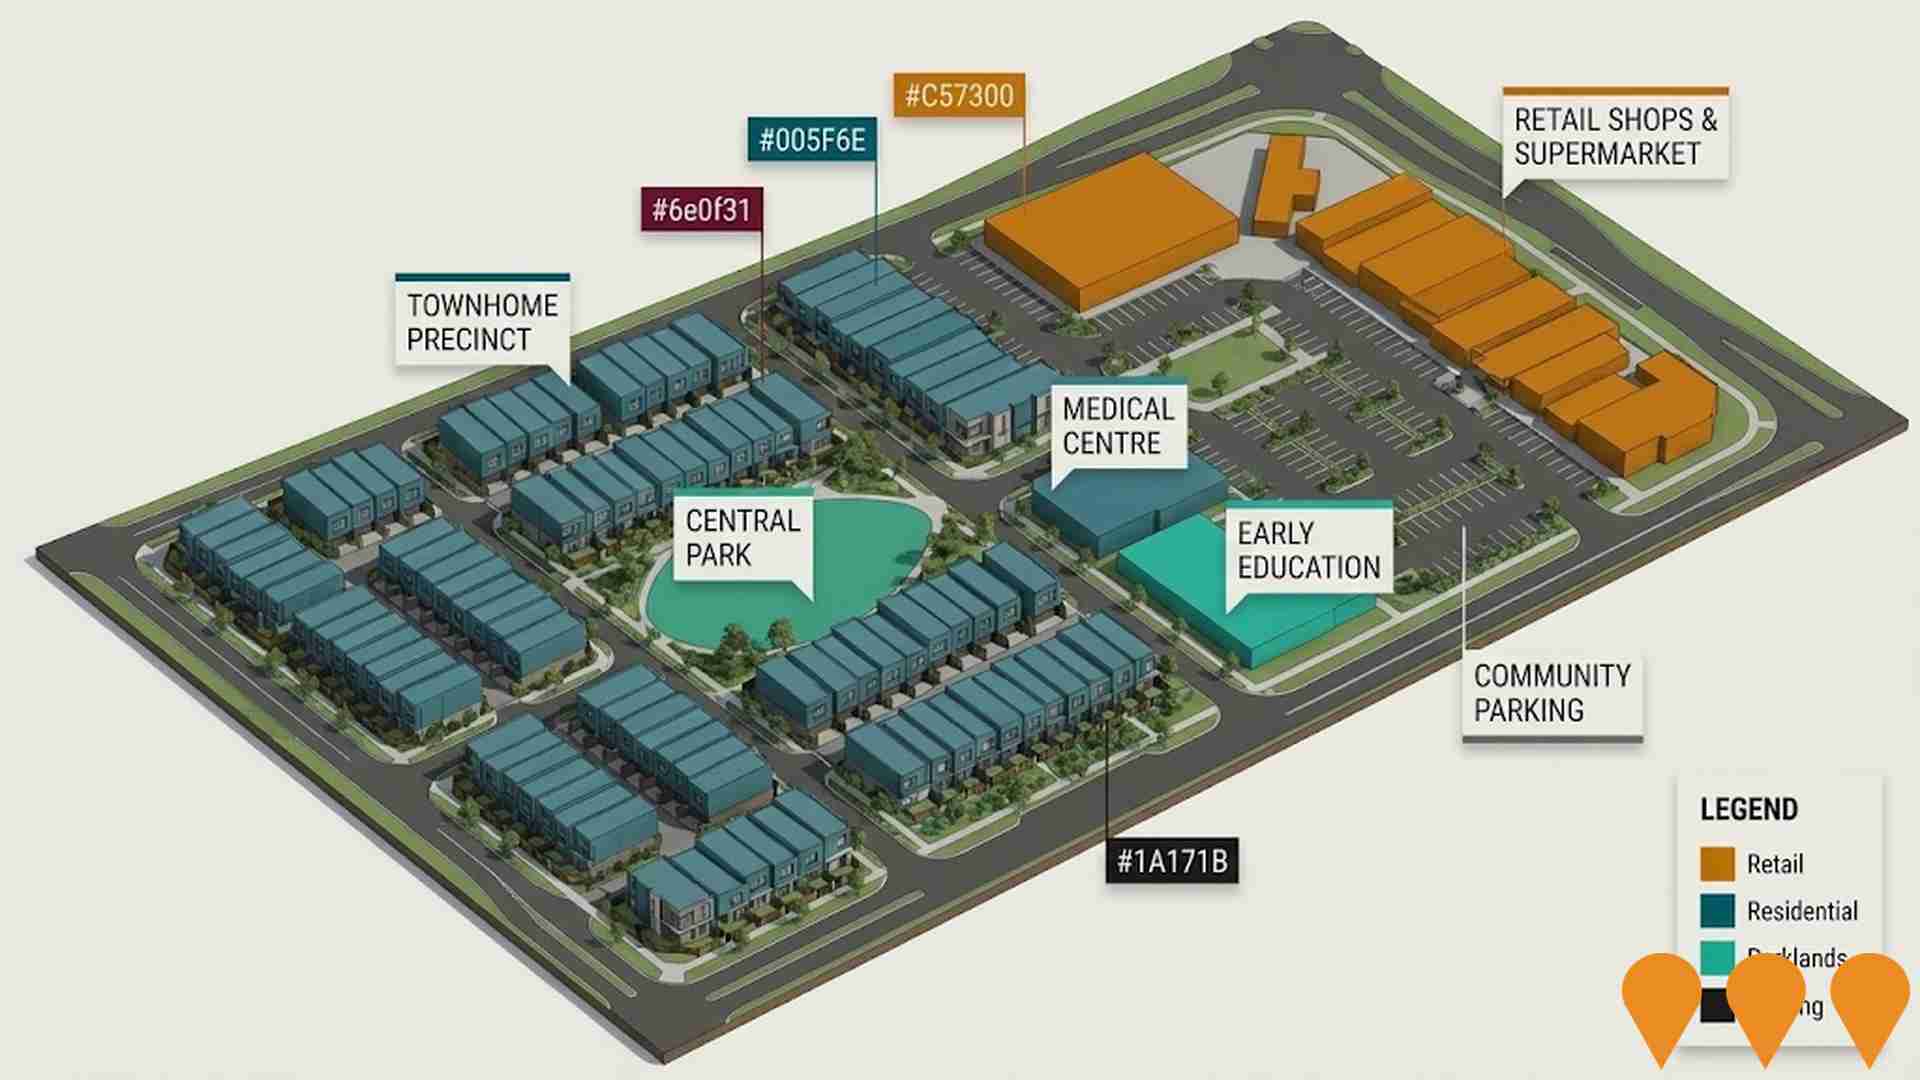
Alira Village is a completed neighbourhood shopping centre and townhome development in the heart of Berwick. The village comprises 17 retail shops spanning 4,825 square metres including a supermarket, medical centre, gym, early education centre, and townhomes. The project is part of the larger 70-hectare Alira masterplanned community featuring wetlands, parklands and walking trails.
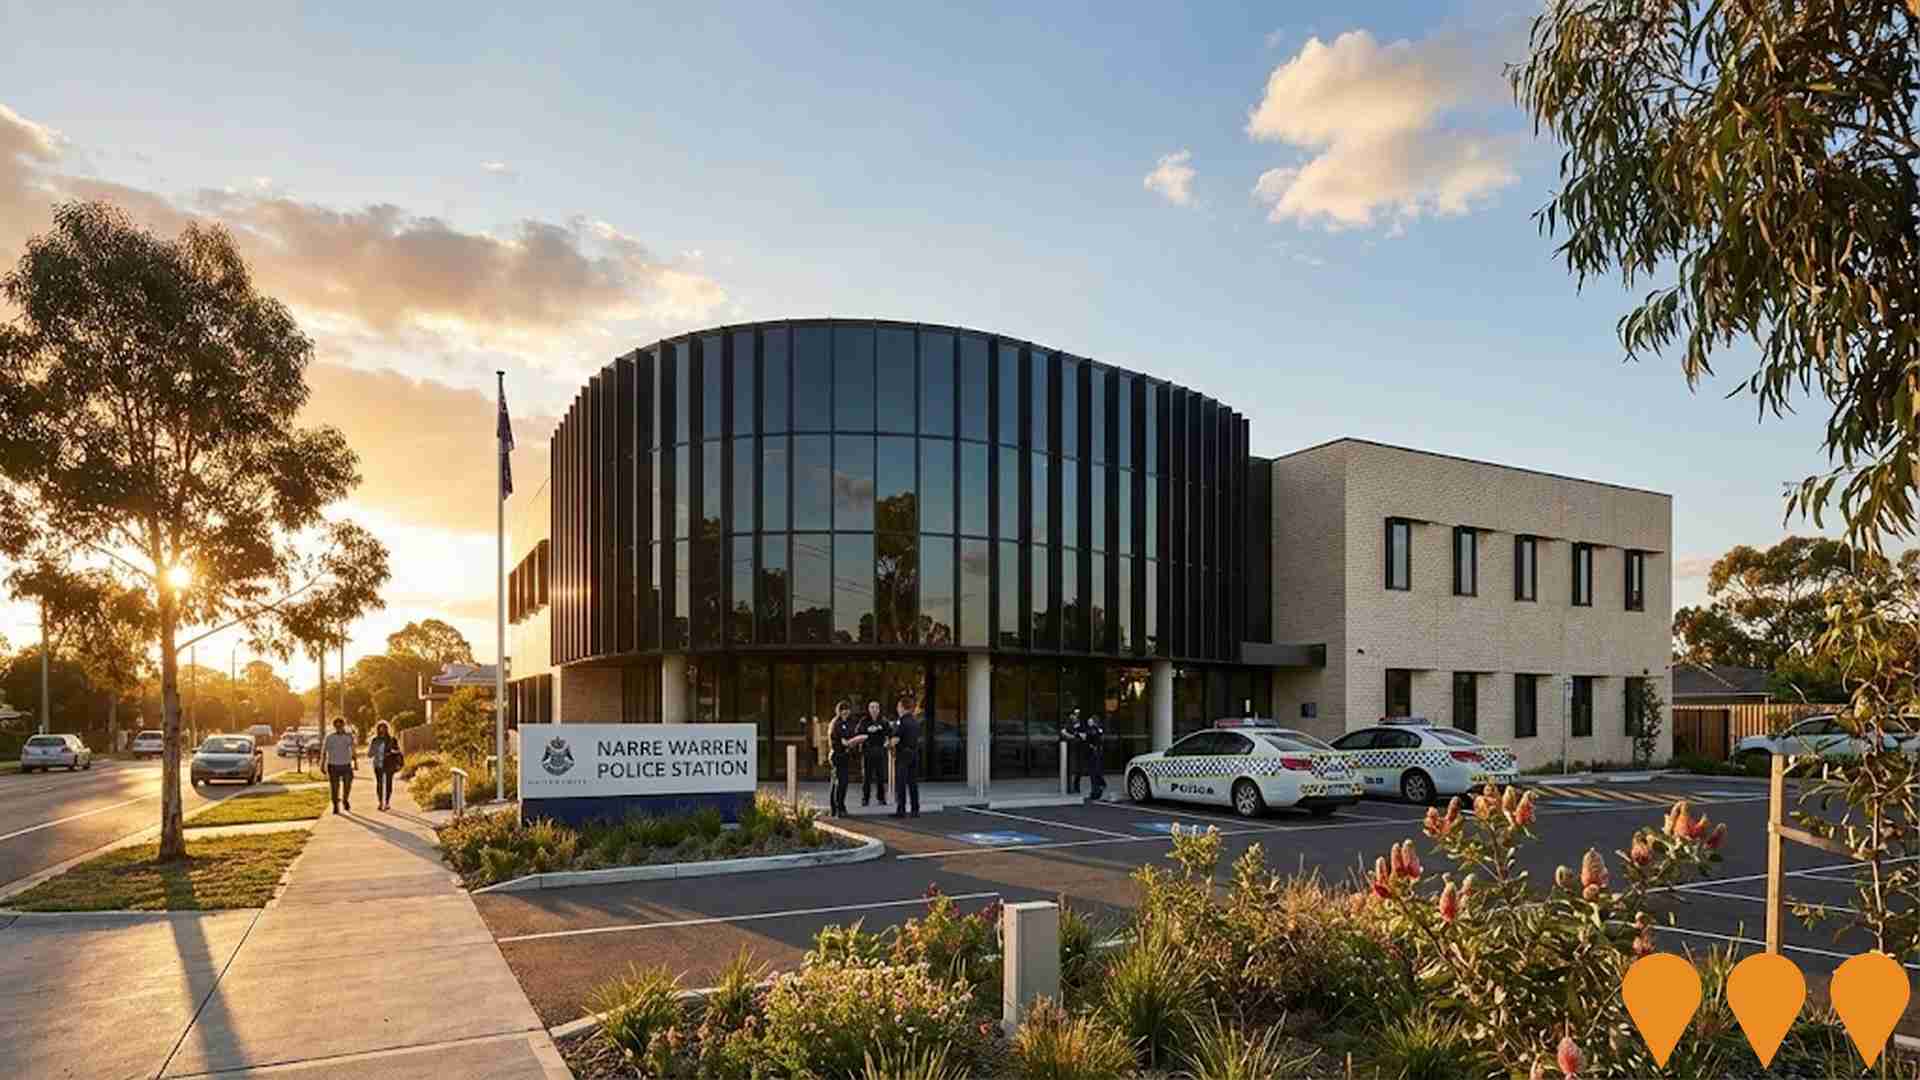
Narre Warren Police Station Upgrade
Comprehensive upgrade and refurbishment of the existing two-storey police station including redesigned internal layout, better public-facing areas, safer prisoner processing areas, interview rooms, upgraded holding cells, modernized police workspaces with new energy-efficient amenities, technology, and security infrastructure. New electrical, plumbing and HVAC systems throughout.
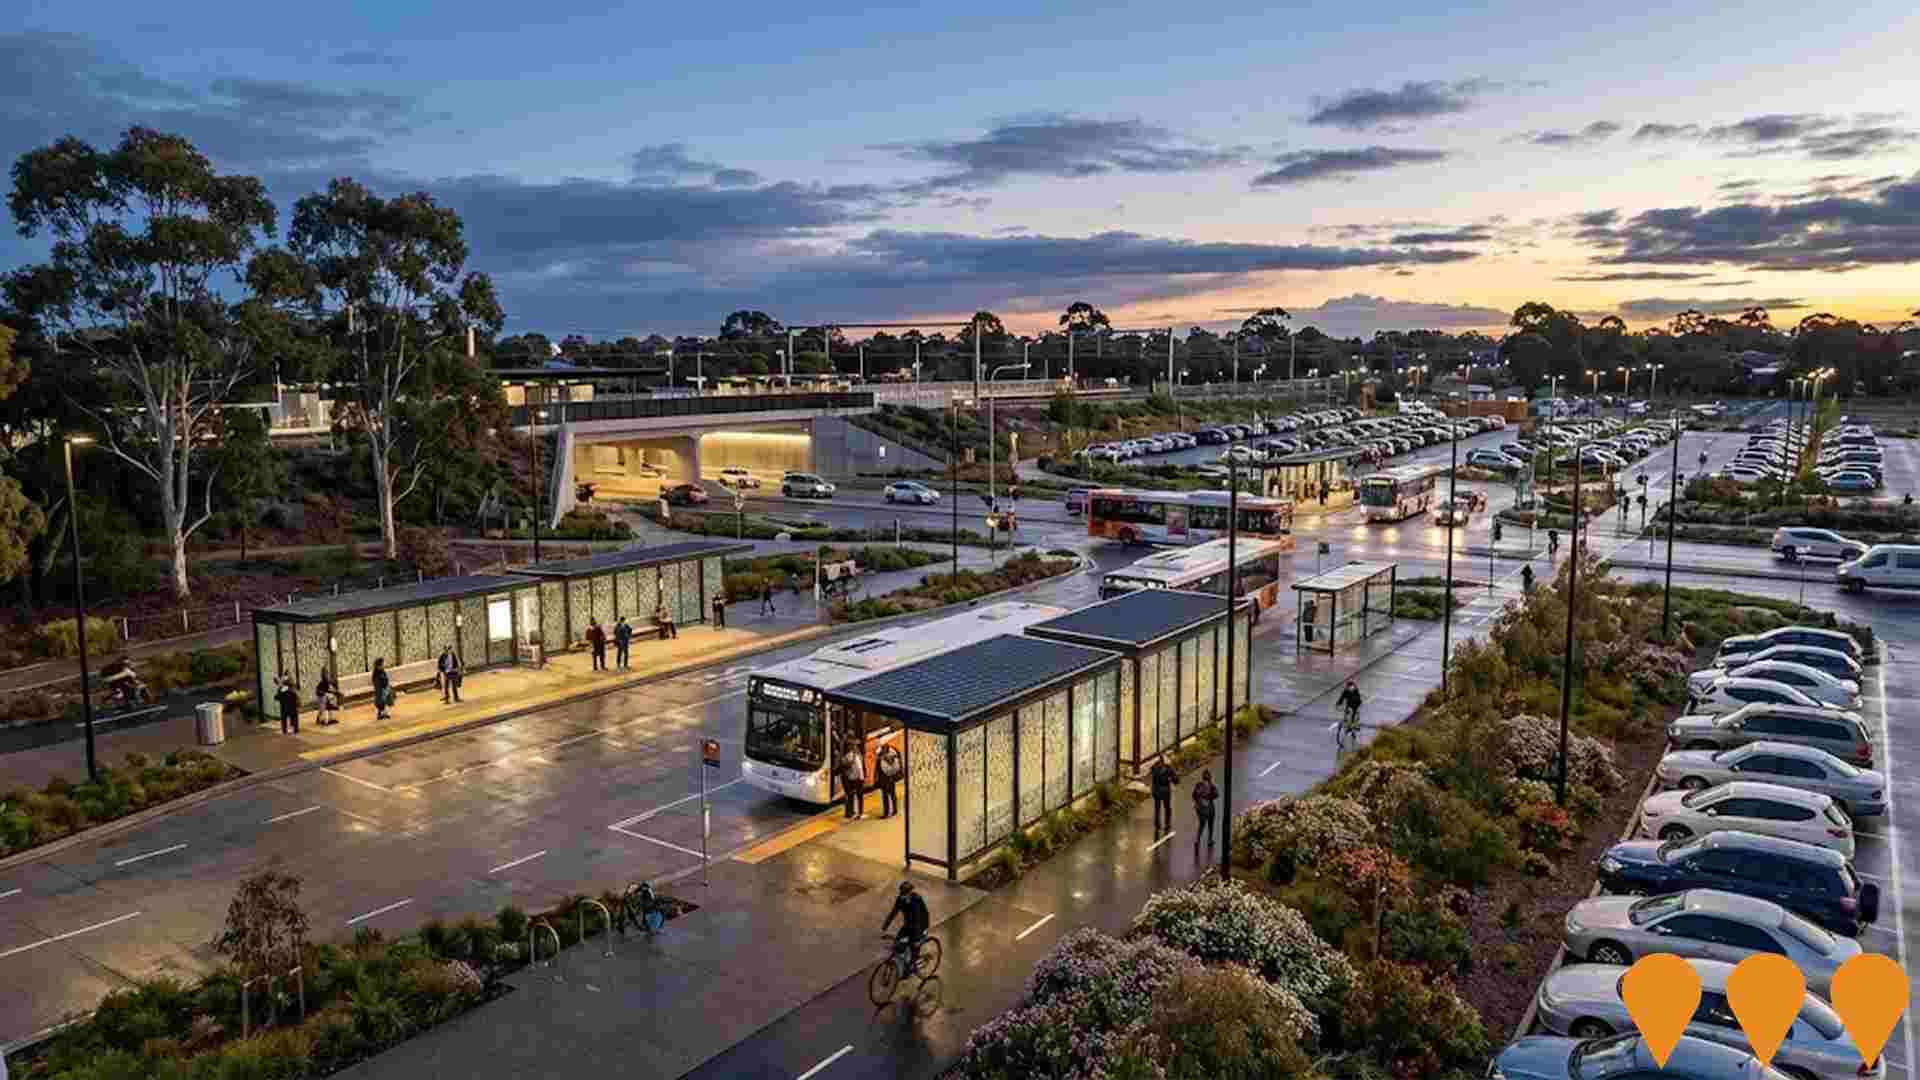
Clyde Road Level Crossing Removal & Berwick Station Upgrade
Completed road underpass beneath rail line, new bus interchange with double capacity, upgraded car parking (1,400+ spaces), and improved pedestrian/cycling connections. Part of making Pakenham Line level crossing-free by 2025.
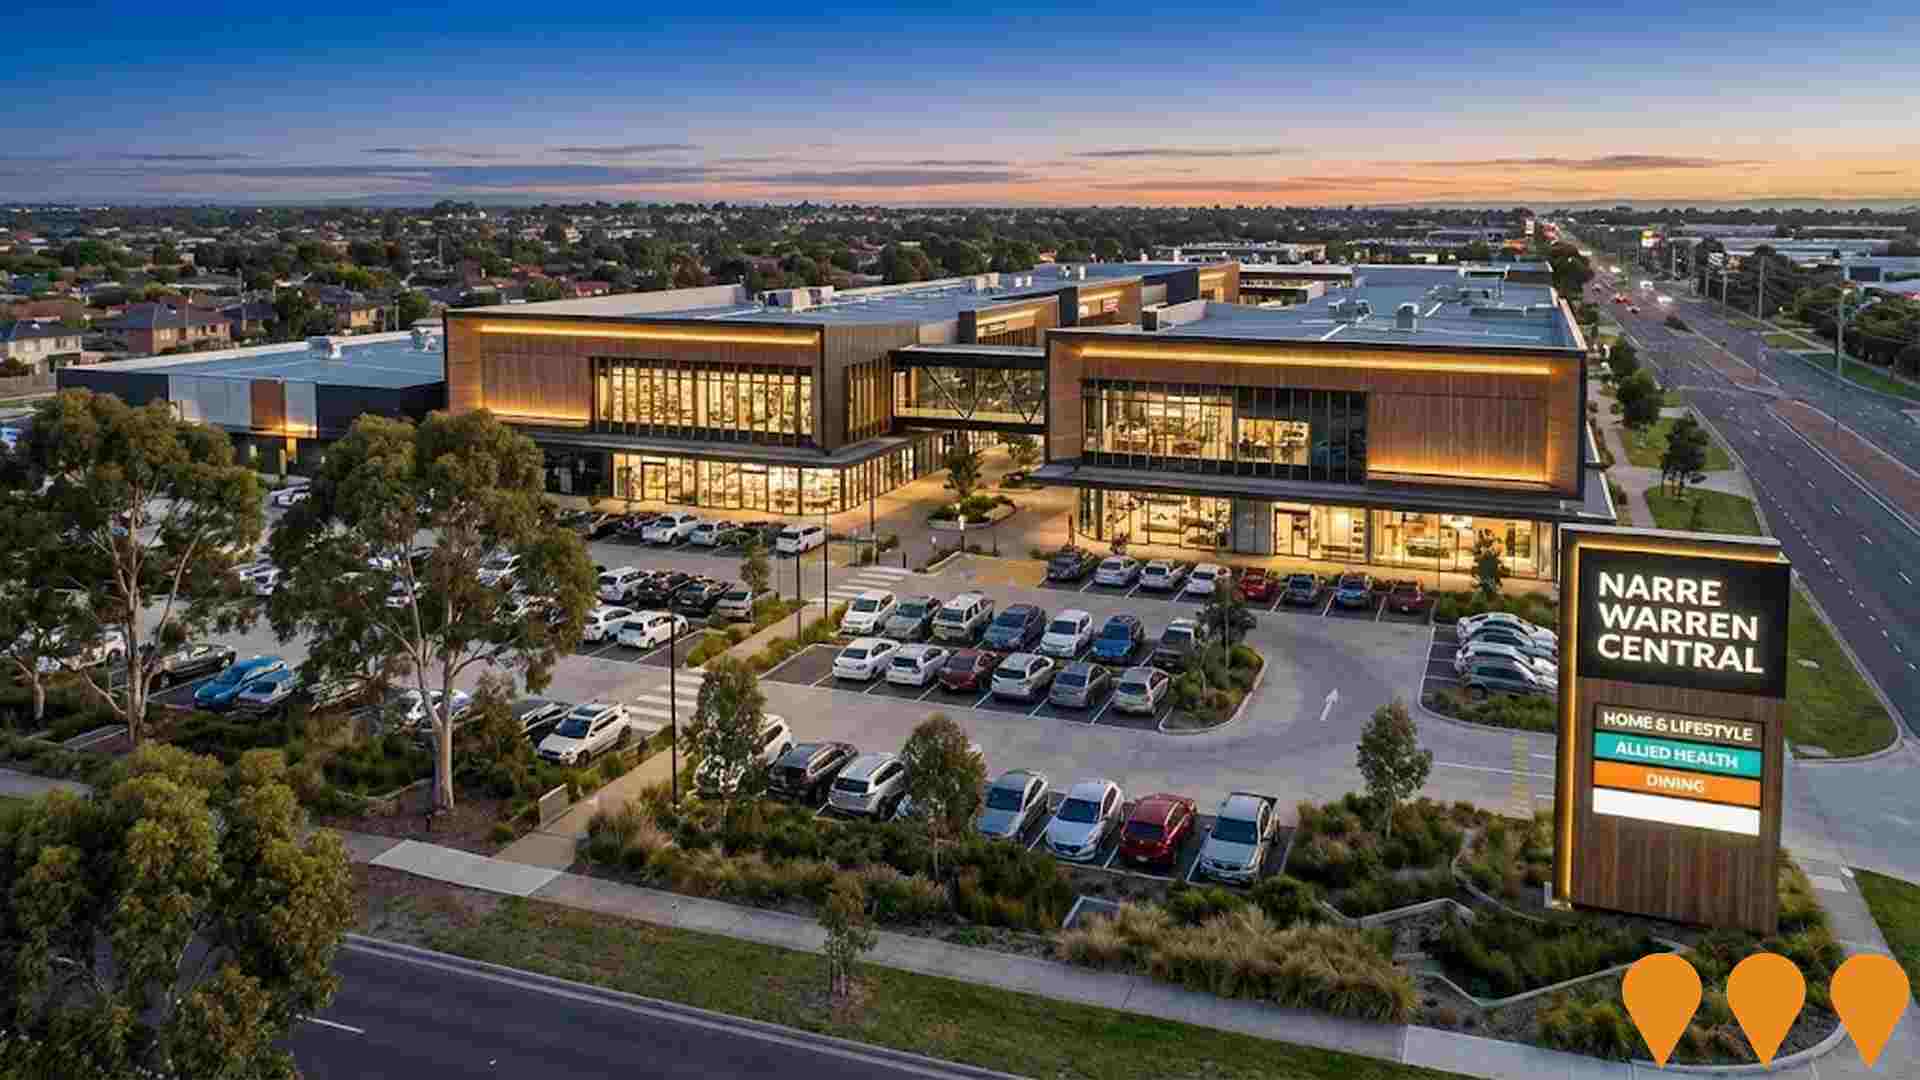
Narre Warren Central
State-of-the-art Large Format Retail (LFR) centre with 17,000 square metres of elevated retail spaces in a landscaped environment. Features flexible tenancies from 300 to 3,500 square metres for retail and allied health needs, with proximity to Westfield Fountain Gate in Melbourne's fastest growing suburb. Development includes convenience restaurants and restricted retail premises with reduced parking requirements.
Clyde Road Upgrade
Widening of Monash Freeway bridge, three through lanes each direction, additional turn lanes and improved traffic signals. Critical infrastructure for south-eastern growth corridor connecting residential areas to employment centers.

Employment
Berwick - North ranks among the top 25% of areas assessed nationally for overall employment performance
Berwick - North has a skilled workforce with 13,152 residents employed as of September 2025. The unemployment rate is 2.7%, lower than Greater Melbourne's 4.7%.
Employment growth over the past year was estimated at 4.6%. Workforce participation in Berwick - North is 61.9%, slightly below Greater Melbourne's 64.1%. Key industries of employment among residents are health care & social assistance, construction, and retail trade. The area specializes in construction, with an employment share 1.3 times the regional level.
However, professional & technical services employ only 7.8% of local workers, below Greater Melbourne's 10.1%. Many residents commute elsewhere for work based on Census data analysis. Between September 2024 and September 2025, employment levels increased by 4.6% while the labour force grew by 4.7%, keeping unemployment relatively stable at 2.0%. In contrast, Greater Melbourne saw employment rise by 3.0%, labour force grow by 3.3%, and unemployment increase to 4.7%. State-wide in Victoria as of 25-Nov-25, employment grew by 1.13% year-on-year, adding 41,950 jobs, with an unemployment rate of 4.7%. Nationally, employment growth was 0.14%, with an unemployment rate of 4.3%. Jobs and Skills Australia's national employment forecasts from May-25 project a 6.6% increase over five years and 13.7% over ten years. Applying these projections to Berwick - North's employment mix suggests local employment should increase by 6.5% over five years and 13.4% over ten years, assuming constant population projections for illustrative purposes.
Frequently Asked Questions - Employment
Income
Income analysis reveals strong economic positioning, with the area outperforming 60% of locations assessed nationally by AreaSearch
According to AreaSearch's aggregation of the latest postcode level ATO data released for financial year 2022, Berwick - North SA2 had a median income among taxpayers of $55,750. The average income stood at $82,924. Nationally, these figures are extremely high compared to the median and average incomes of $54,892 and $73,761 across Greater Melbourne respectively. Based on Wage Price Index growth of 12.16% since financial year 2022, current estimates for Berwick - North would be approximately $62,529 (median) and $93,008 (average) as of September 2025. Census data reveals that household, family, and personal incomes in Berwick - North cluster around the 55th percentile nationally. Income distribution shows that 30.9% of locals (7,369 people) fall into the $1,500 - 2,999 category, which is similar to the broader area where this cohort represents 32.8%. After housing costs, 86.2% of income remains for other expenses. The area's SEIFA income ranking places it in the 7th decile.
Frequently Asked Questions - Income
Housing
Berwick - North is characterized by a predominantly suburban housing profile, with above-average rates of outright home ownership
As of the latest Census, dwelling structures in Berwick - North comprised 82.0% houses and 18.0% other dwellings (semi-detached, apartments, 'other' dwellings). In comparison, Melbourne metro had 88.1% houses and 11.8% other dwellings. Home ownership in Berwick - North was at 40.1%, with the remainder being mortgaged (40.6%) or rented (19.3%). The median monthly mortgage repayment in the area was $2,000, higher than Melbourne metro's average of $1,900 and the national average of $1,863. The median weekly rent figure in Berwick - North was recorded at $380, compared to Melbourne metro's $370 and the national figure of $375.
Frequently Asked Questions - Housing
Household Composition
Berwick - North has a typical household mix, with a lower-than-average median household size
Family households constitute 74.8% of all households, including 36.3% couples with children, 27.7% couples without children, and 10.1% single parent families. Non-family households account for the remaining 25.2%, with lone person households at 23.5% and group households comprising 1.7%. The median household size is 2.6 people, which is smaller than the Greater Melbourne average of 2.9.
Frequently Asked Questions - Households
Local Schools & Education
Berwick - North shows strong educational performance, ranking in the upper quartile nationally when assessed across multiple qualification and achievement indicators
Berwick's residents aged 15+ have a university degree attainment rate of 27.8%, compared to Greater Melbourne's 37.0%. This difference suggests potential for educational development. Bachelor degrees are the most common (18.4%), followed by postgraduate qualifications (6.3%) and graduate diplomas (3.1%). Vocational credentials are also prevalent, with 34.3% of residents holding such qualifications – advanced diplomas at 12.8% and certificates at 21.5%.
Educational participation is high in Berwick, with 28.2% of residents currently enrolled in formal education. This includes 9.1% in primary education, 8.2% in secondary education, and 5.0% pursuing tertiary education.
Frequently Asked Questions - Education
Schools Detail
Nearby Services & Amenities
Transport
Transport servicing is good compared to other areas nationally based on assessment of service frequency, route connectivity and accessibility
Berwick - North has 127 active public transport stops. These are a mix of train and bus stations. They are served by 20 different routes that together facilitate 7,674 weekly passenger trips.
The area's transport accessibility is rated good, with residents located an average of 246 meters from the nearest stop. On average, there are 1,096 trips per day across all routes, which equals approximately 60 weekly trips per individual stop.
Frequently Asked Questions - Transport
Transport Stops Detail
Health
Health performance in Berwick - North is lower than average with common health conditions somewhat prevalent across both younger and older age cohorts
Berwick North faces significant health challenges. Common health conditions are prevalent across both younger and older age cohorts. The rate of private health cover is high at approximately 61% of the total population (14,620 people), compared to 53.6% in Greater Melbourne and a national average of 55.3%.
The most common medical conditions are arthritis and mental health issues, affecting 8.7% and 8.1% of residents respectively. 66.6% of residents declare themselves completely clear of medical ailments, compared to 72.0% in Greater Melbourne. As of March 2021, 22.4% of residents are aged 65 and over (5,330 people), higher than the 15.7% in Greater Melbourne. Health outcomes among seniors present some challenges, broadly in line with the general population's health profile.
Frequently Asked Questions - Health
Cultural Diversity
The level of cultural diversity witnessed in Berwick - North was found to be above average when compared nationally for a number of language and cultural background related metrics
Berwick-North has a higher cultural diversity than most local markets, with 29.3% of its population born overseas and 20.0% speaking a language other than English at home. Christianity is the predominant religion in Berwick-North, comprising 50.8% of the population. However, Buddhism is more prevalent here compared to Greater Melbourne, making up 2.6% of Berwick-North's population versus 1.0%.
The top three ancestry groups are English (25.9%), Australian (22.3%), and Other (9.6%). Notably, Hungarian (0.6%) and Dutch (2.5%) are overrepresented compared to regional averages, while Sri Lankan (1.2%) is underrepresented.
Frequently Asked Questions - Diversity
Age
Berwick - North's median age exceeds the national pattern
The median age in Berwick - North is 43 years, considerably higher than Greater Melbourne's average of 37 years and substantially exceeding the national average of 38 years. The age profile shows that those aged 75-84 are particularly prominent, making up 8.4% of the population, while the 25-34 age group is comparatively smaller at 9.6%. Between 2021 and present, the 15 to 24 age group has grown from 12.3% to 13.1%, while the 25 to 34 cohort has declined from 10.4% to 9.6%. By 2041, demographic projections reveal significant shifts in Berwick - North's age structure. The 85+ age cohort is projected to rise substantially, increasing by 849 people (91%) from 937 to 1,787. Notably, the combined 65+ age groups are expected to account for 76% of total population growth, reflecting the area's aging demographic profile. Conversely, the 25 to 34 and 0 to 4 cohorts are projected to experience population declines.
