Chart Color Schemes
This analysis uses ABS Statistical Areas Level 2 (SA2) boundaries, which can materially differ from Suburbs and Localities (SAL) even when sharing similar names.
SA2 boundaries are defined by the Australian Bureau of Statistics and are designed to represent communities for statistical reporting (e.g., census and ERP).
Suburbs and Localities (SAL) represent commonly-used suburb/locality names (postal-style areas) and may use different geographic boundaries. For comprehensive analysis, consider reviewing both boundary types if available.
est. as @ -- *
ABS ERP | -- people | --
2021 Census | -- people
Sales Activity
Curious about local property values? Filter the chart to assess the volume and appreciation (including resales) trends and regional comparisons, or scroll to the map below view this information at an individual property level.
Find a Recent Sale
Sales Detail
Population
Burpengary - East lies within the top 10% of areas nationally in terms of population growth performance according to AreaSearch analysis of short and medium-term trends
Burpengary - East's population is approximately 8,981 as of November 2025. This figure represents a rise of 2,323 individuals, marking a 34.9% increase since the 2021 Census which reported a population of 6,658. The change is inferred from the estimated resident population of 8,721 in June 2024 and an additional 608 validated new addresses since the Census date. This results in a population density ratio of 330 persons per square kilometer. Burpengary - East's growth rate exceeded both national (8.9%) and state averages, indicating its status as a region leader in terms of population growth. Interstate migration contributed approximately 86.6% to the overall population gains during recent periods.
AreaSearch uses ABS/Geoscience Australia projections for each SA2 area released in 2024 with a base year of 2022. For areas not covered by this data and years post-2032, Queensland State Government's SA2 area projections released in 2023 based on 2021 data are adopted. However, these state projections do not provide age category splits, so AreaSearch applies proportional growth weightings in line with the ABS Greater Capital Region projections for each age cohort. Future demographic trends predict exceptional growth for Burpengary - East, with an expected increase of 8,650 persons by 2041 based on the latest annual ERP population numbers, reflecting a total gain of 93.4% over the 17-year period.
Frequently Asked Questions - Population
Development
The level of residential development activity in Burpengary - East was found to be higher than 90% of real estate markets across the country
Burpengary - East has averaged approximately 192 new dwelling approvals annually over the past five financial years, totalling 961 homes. As of FY-26, 18 approvals have been recorded. On average, 3.5 new residents arrive per year for each dwelling constructed between FY-21 and FY-25, indicating demand outpaces supply, which typically drives price growth and increased buyer competition. The average construction cost of new properties is $253,000, below regional levels, suggesting more affordable housing options for buyers.
This financial year has seen $6.1 million in commercial approvals, reflecting the area's residential character. Compared to Greater Brisbane, Burpengary - East has 130.0% more development activity per person, offering greater choice to buyers, although recent construction activity has slowed. This high level of developer confidence is significantly higher than national averages. New developments consist of 93.0% detached dwellings and 7.0% townhouses or apartments, maintaining the area's low density nature and attracting space-seeking buyers with an average of 60 people per approval. By 2041, Burpengary - East is projected to grow by 8,390 residents, according to AreaSearch's latest quarterly estimate.
Current development appears well-suited to meet future needs, supporting steady market conditions without extreme price pressure.
Frequently Asked Questions - Development
Infrastructure
Burpengary - East has very high levels of nearby infrastructure activity, ranking in the top 20% nationally
Changes to local infrastructure significantly influence an area's performance. AreaSearch has identified 20 projects likely impacting the area. Notable projects include Burpengary East Wastewater Treatment Plant Upgrade, Avaline, Freshwater by Ingenia Lifestyle, and North Harbour. The following list details those most relevant.
Professional plan users can use the search below to filter and access additional projects.
INFRASTRUCTURE SEARCH
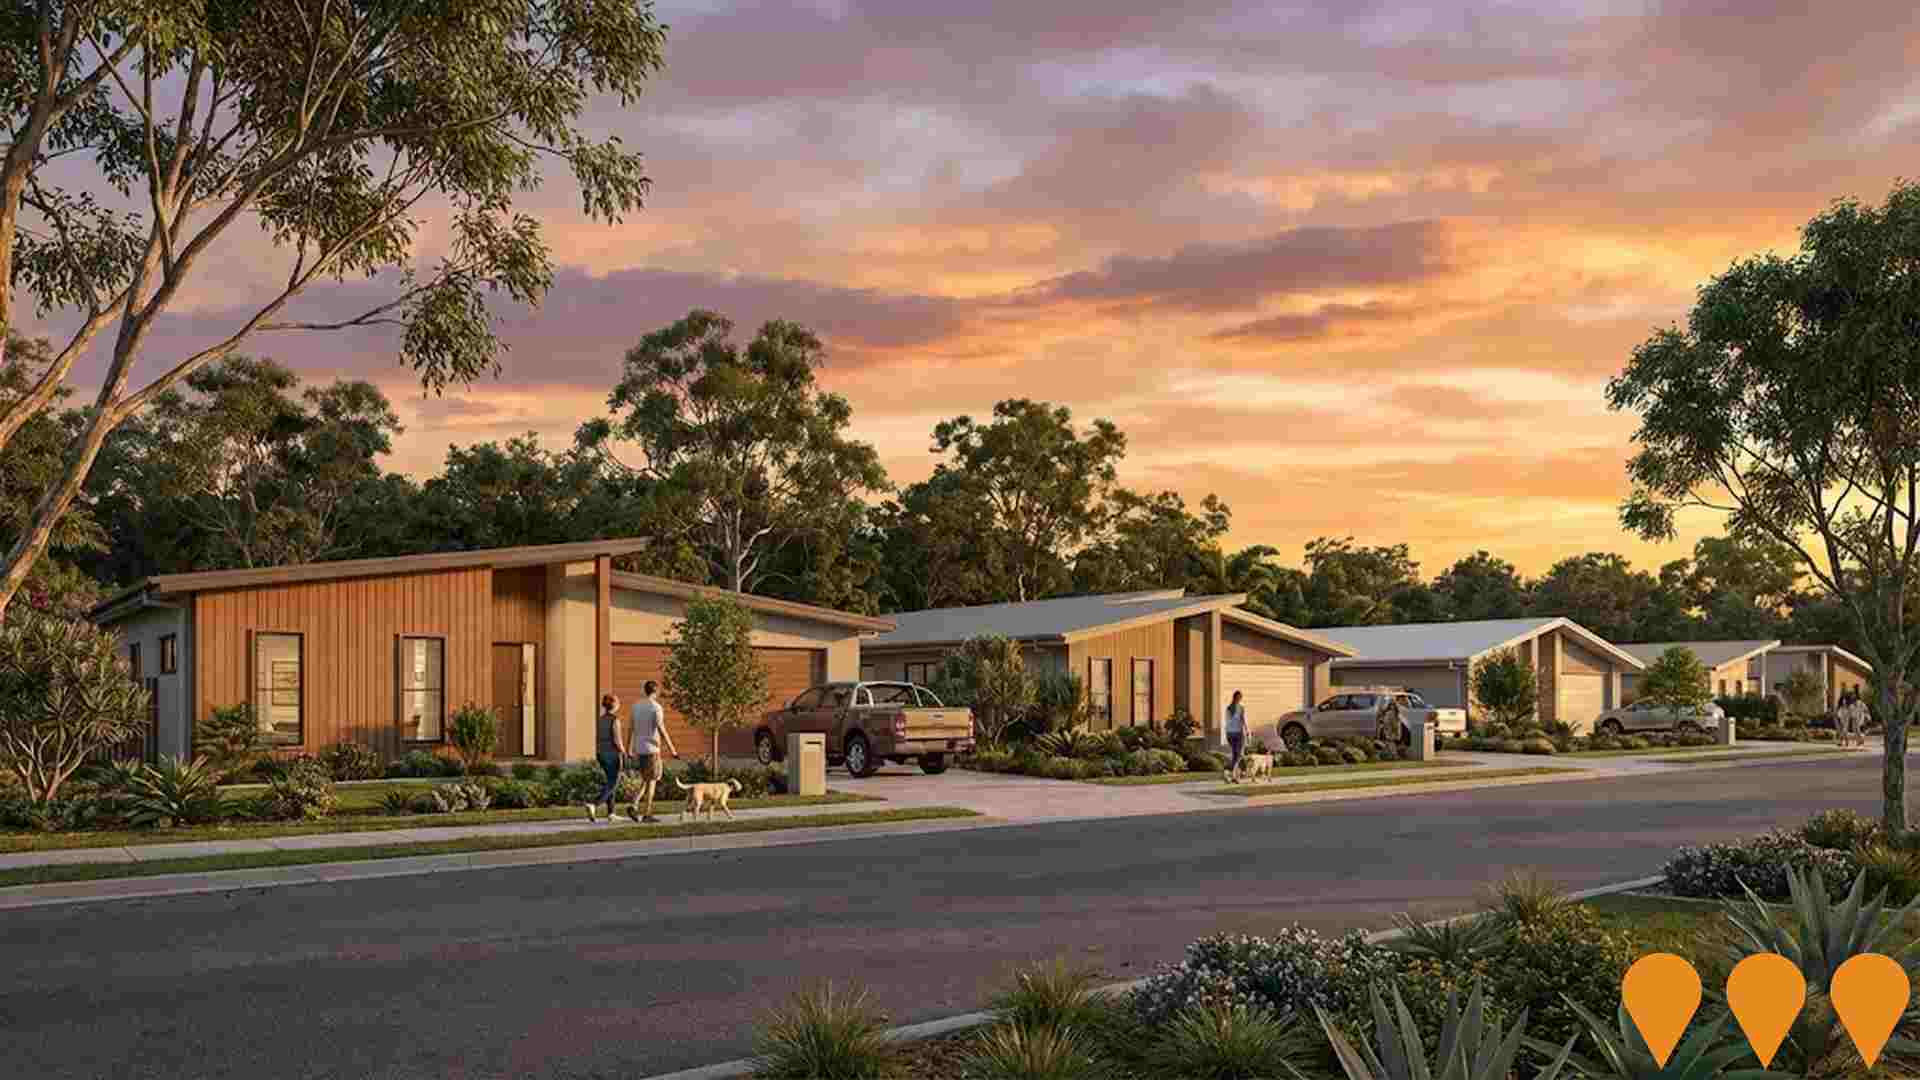
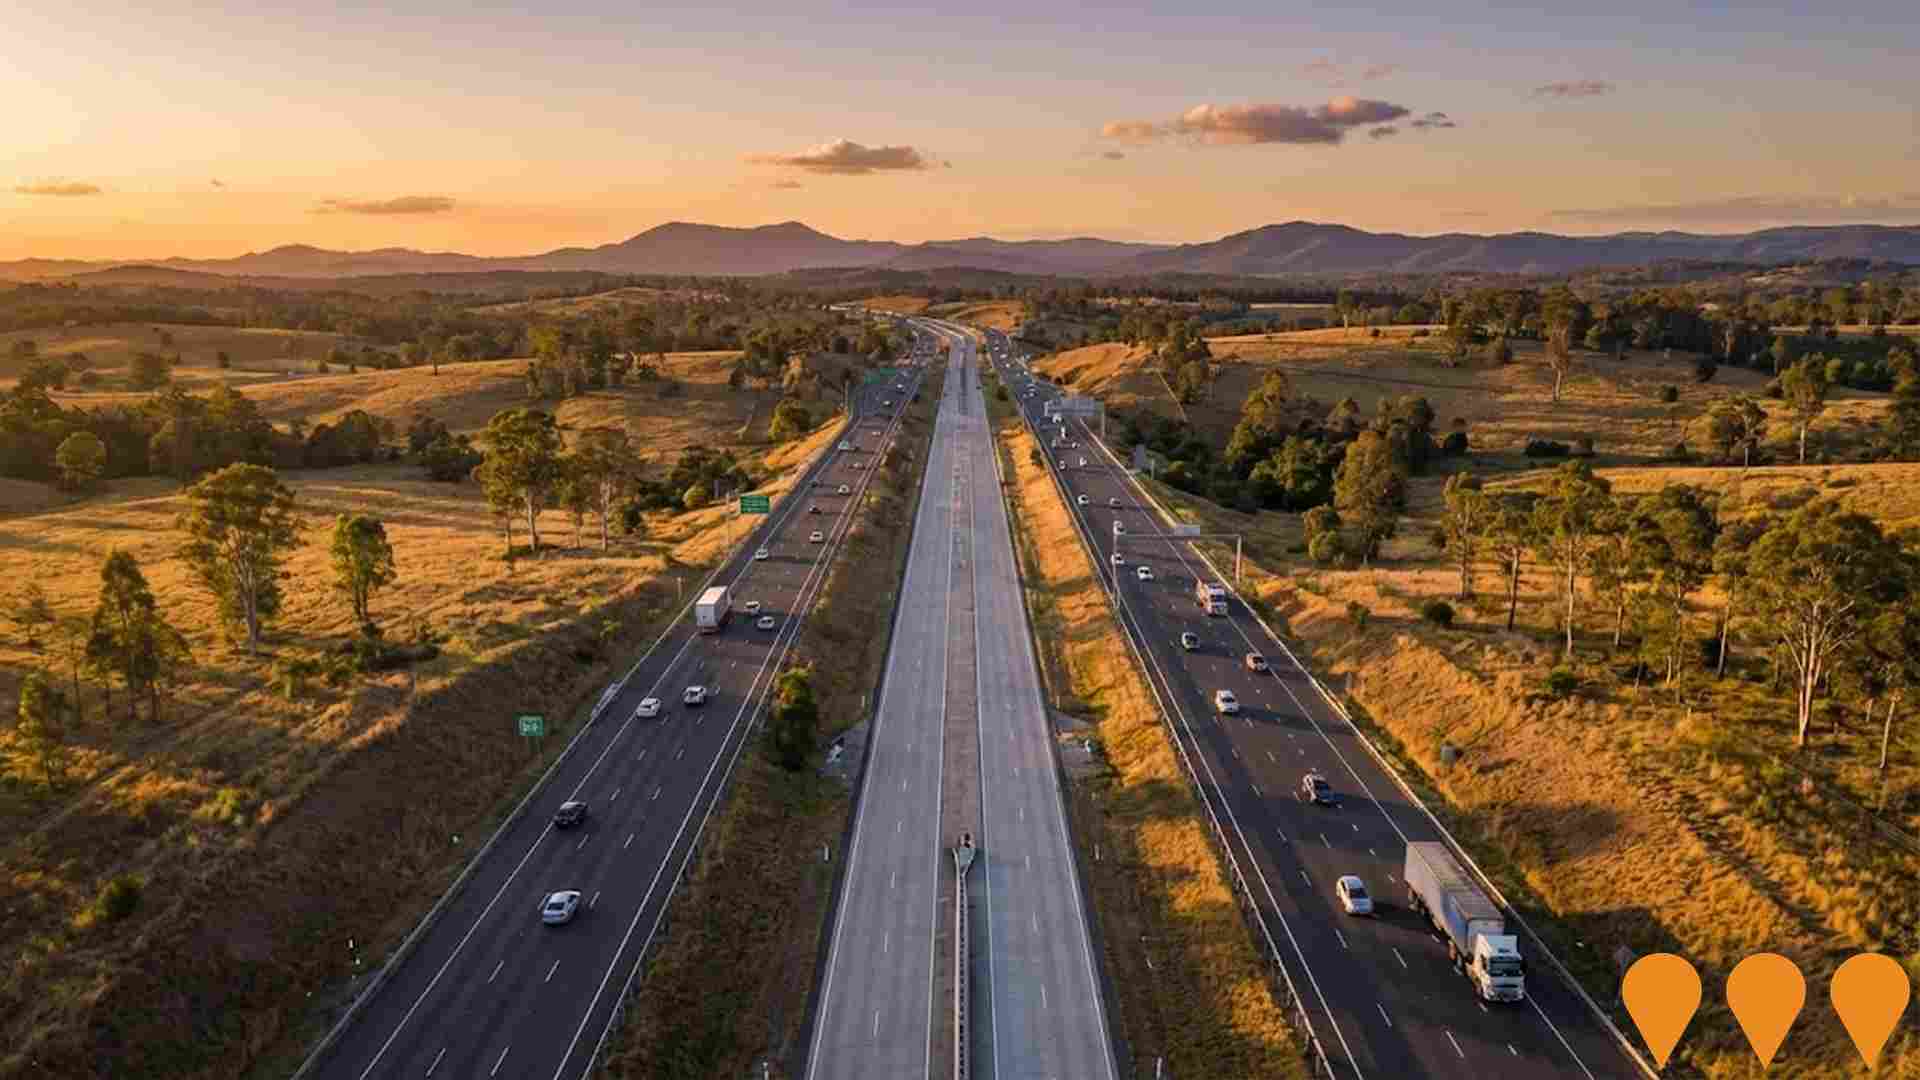
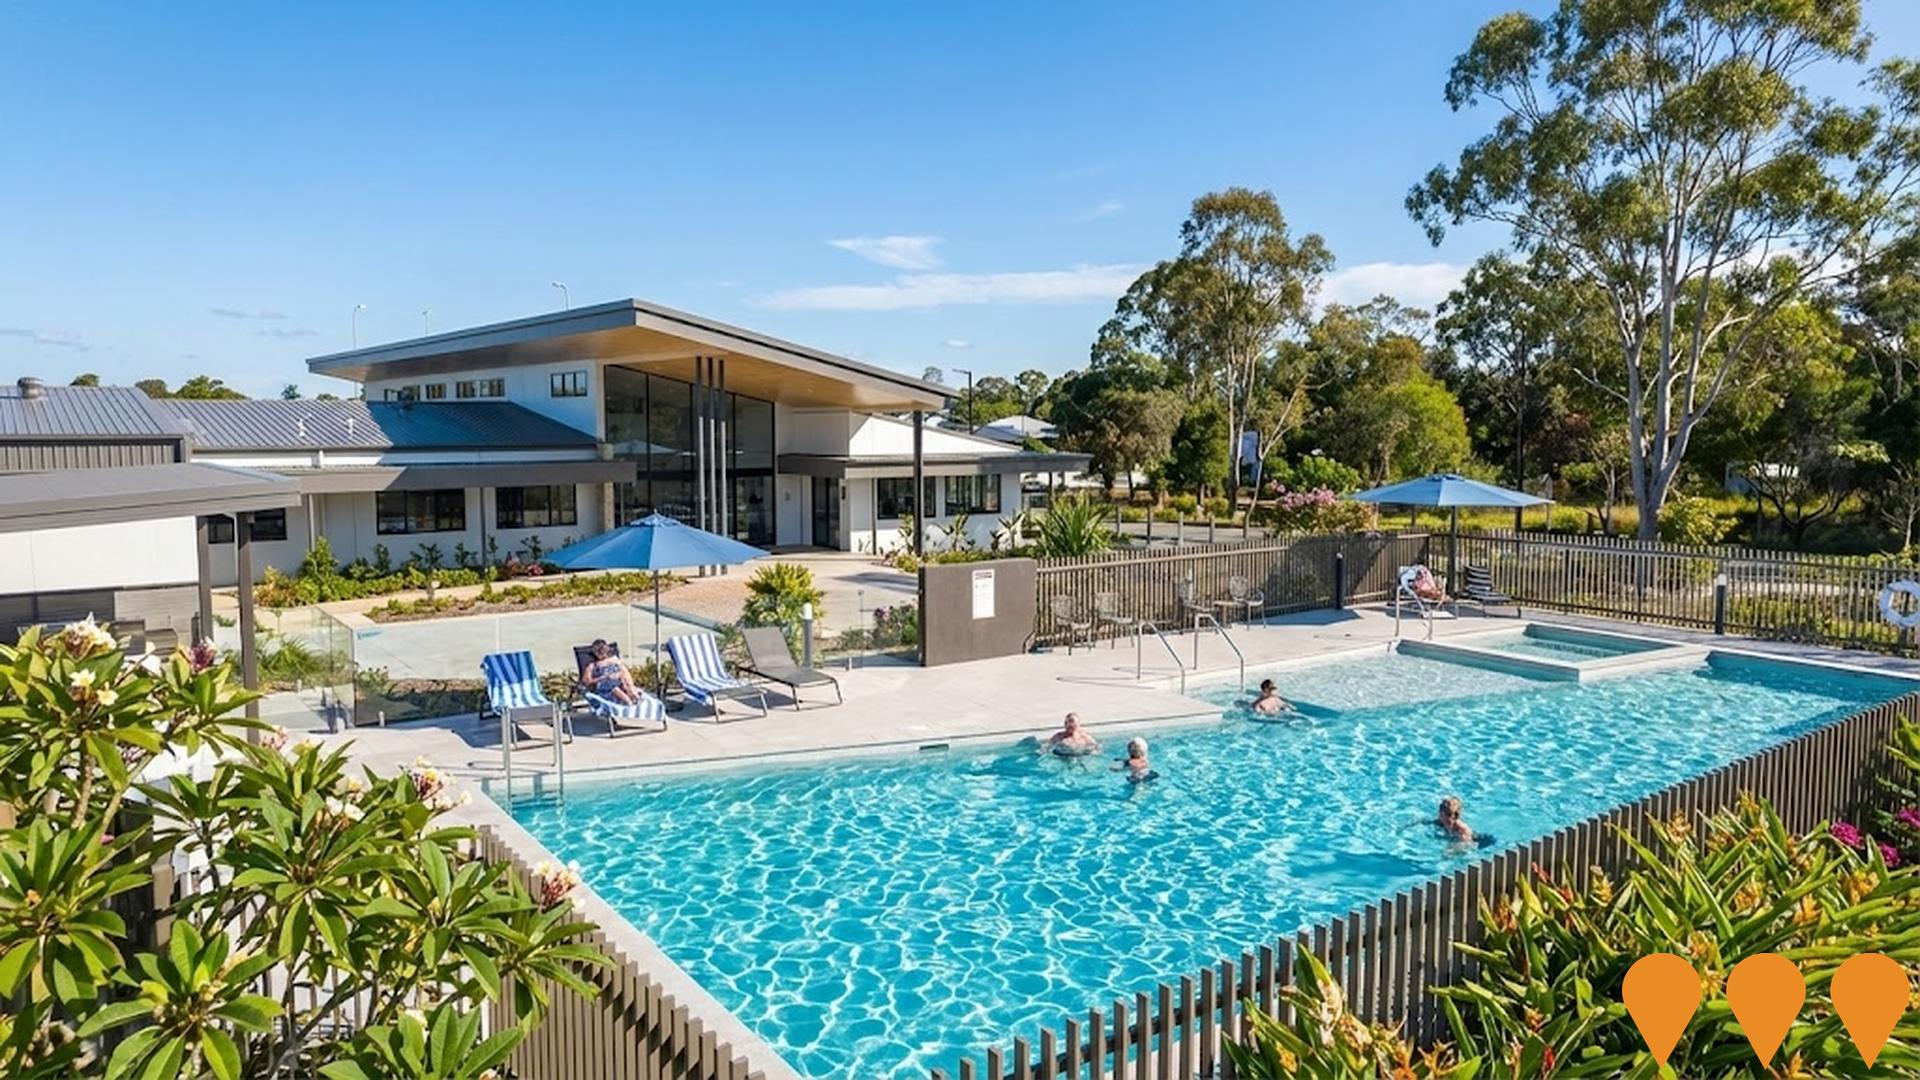
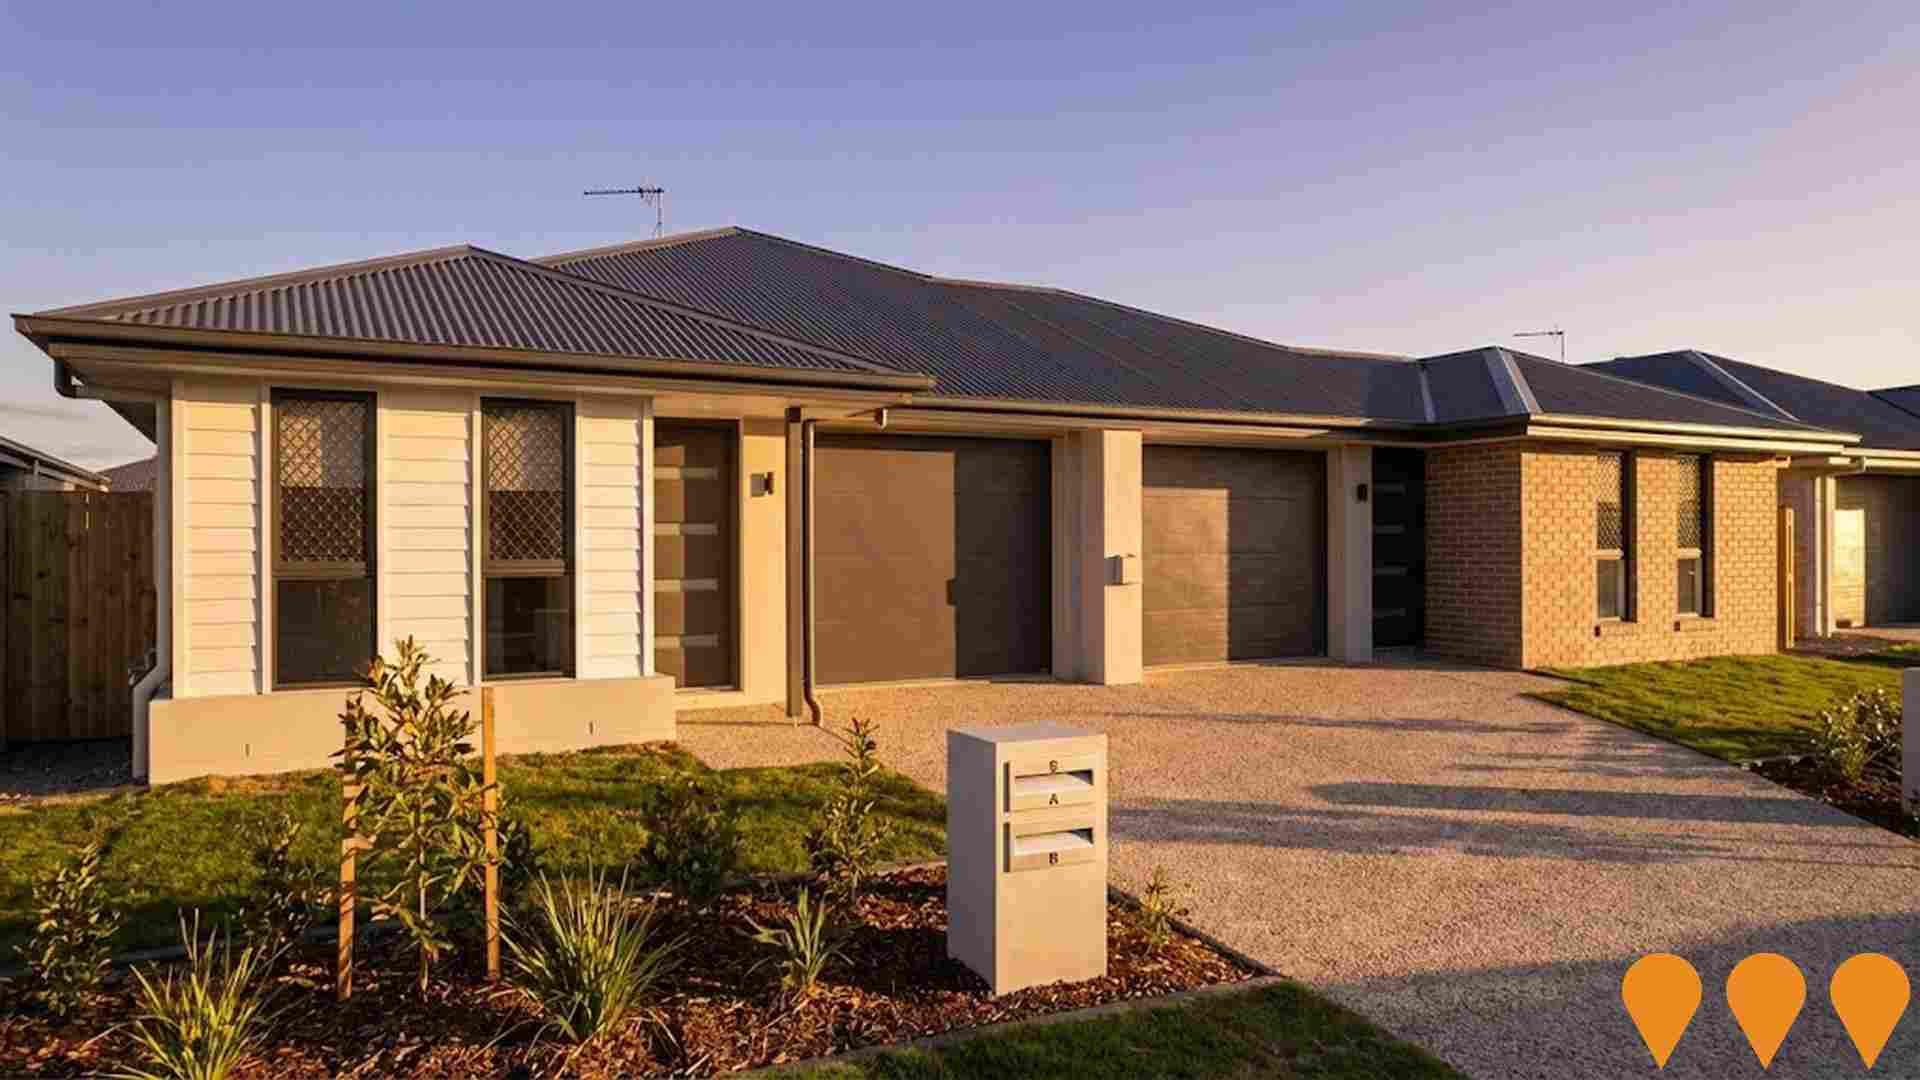
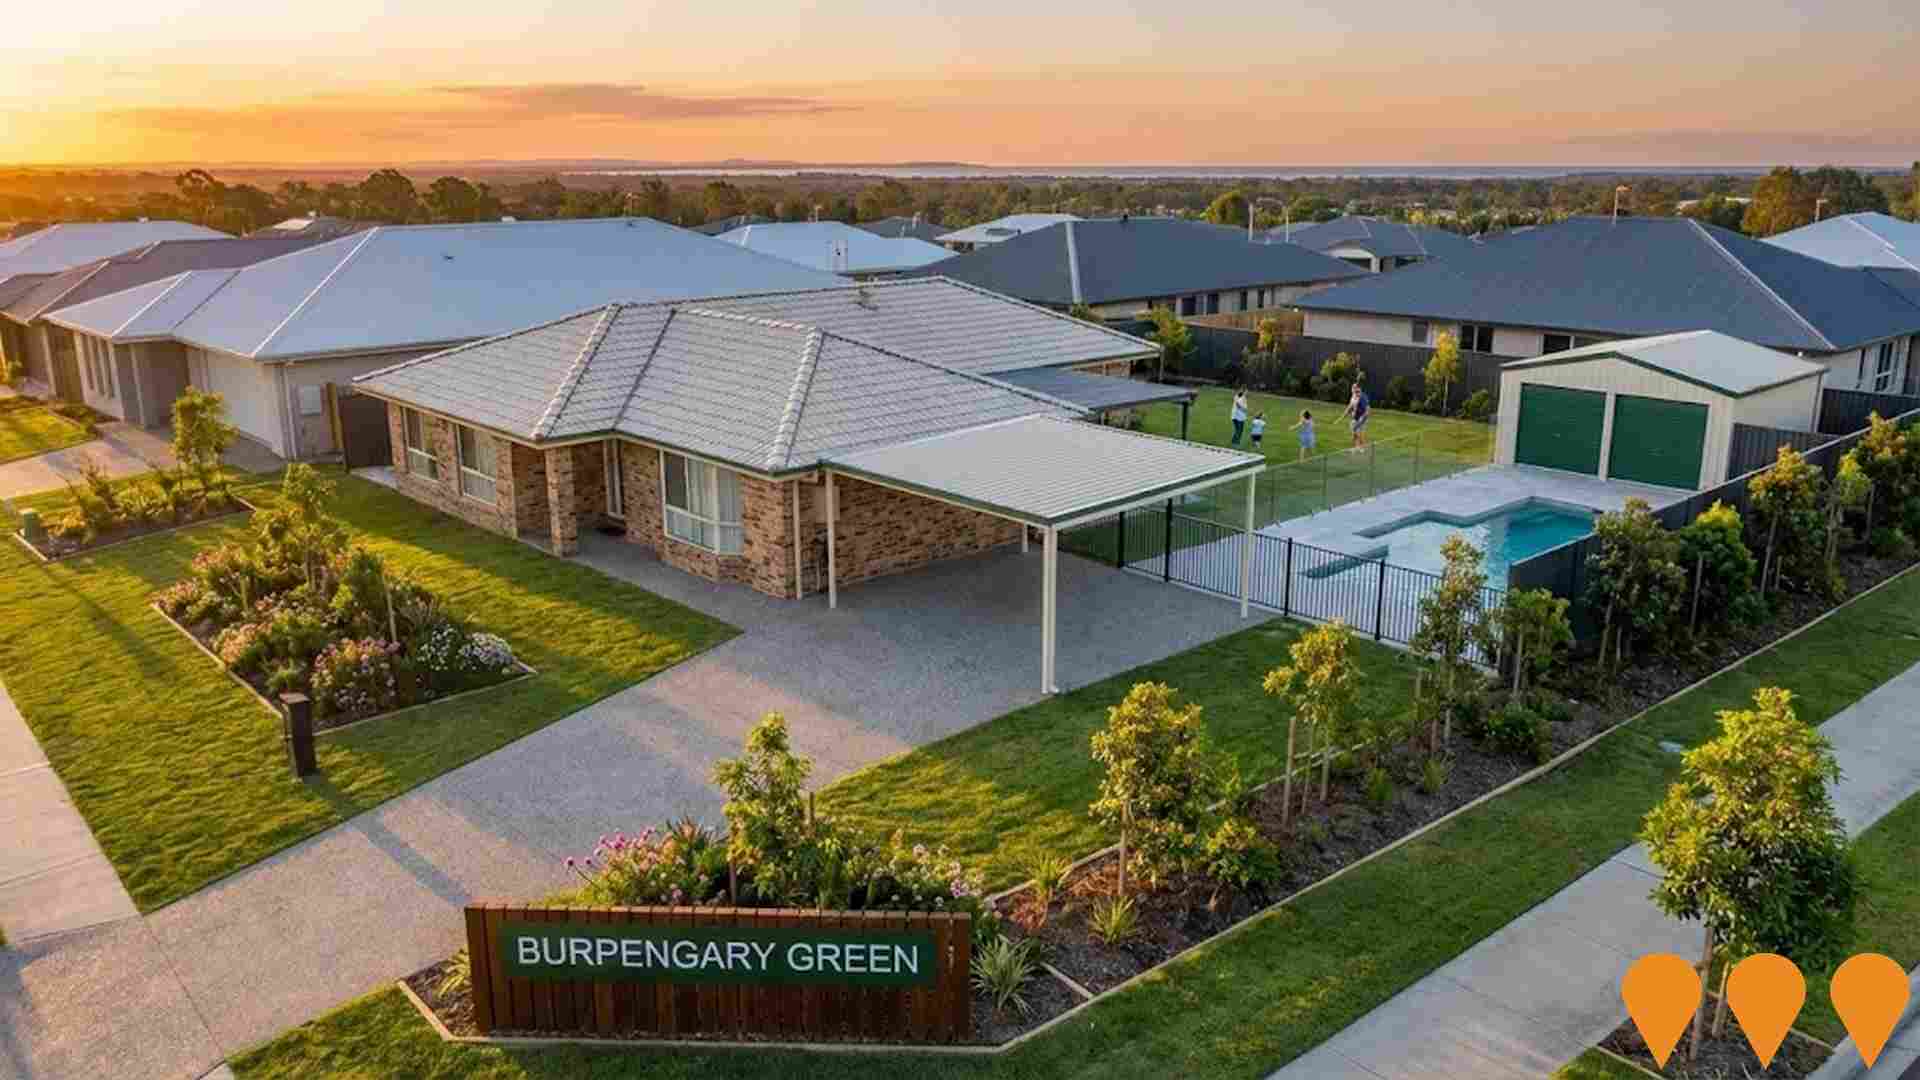
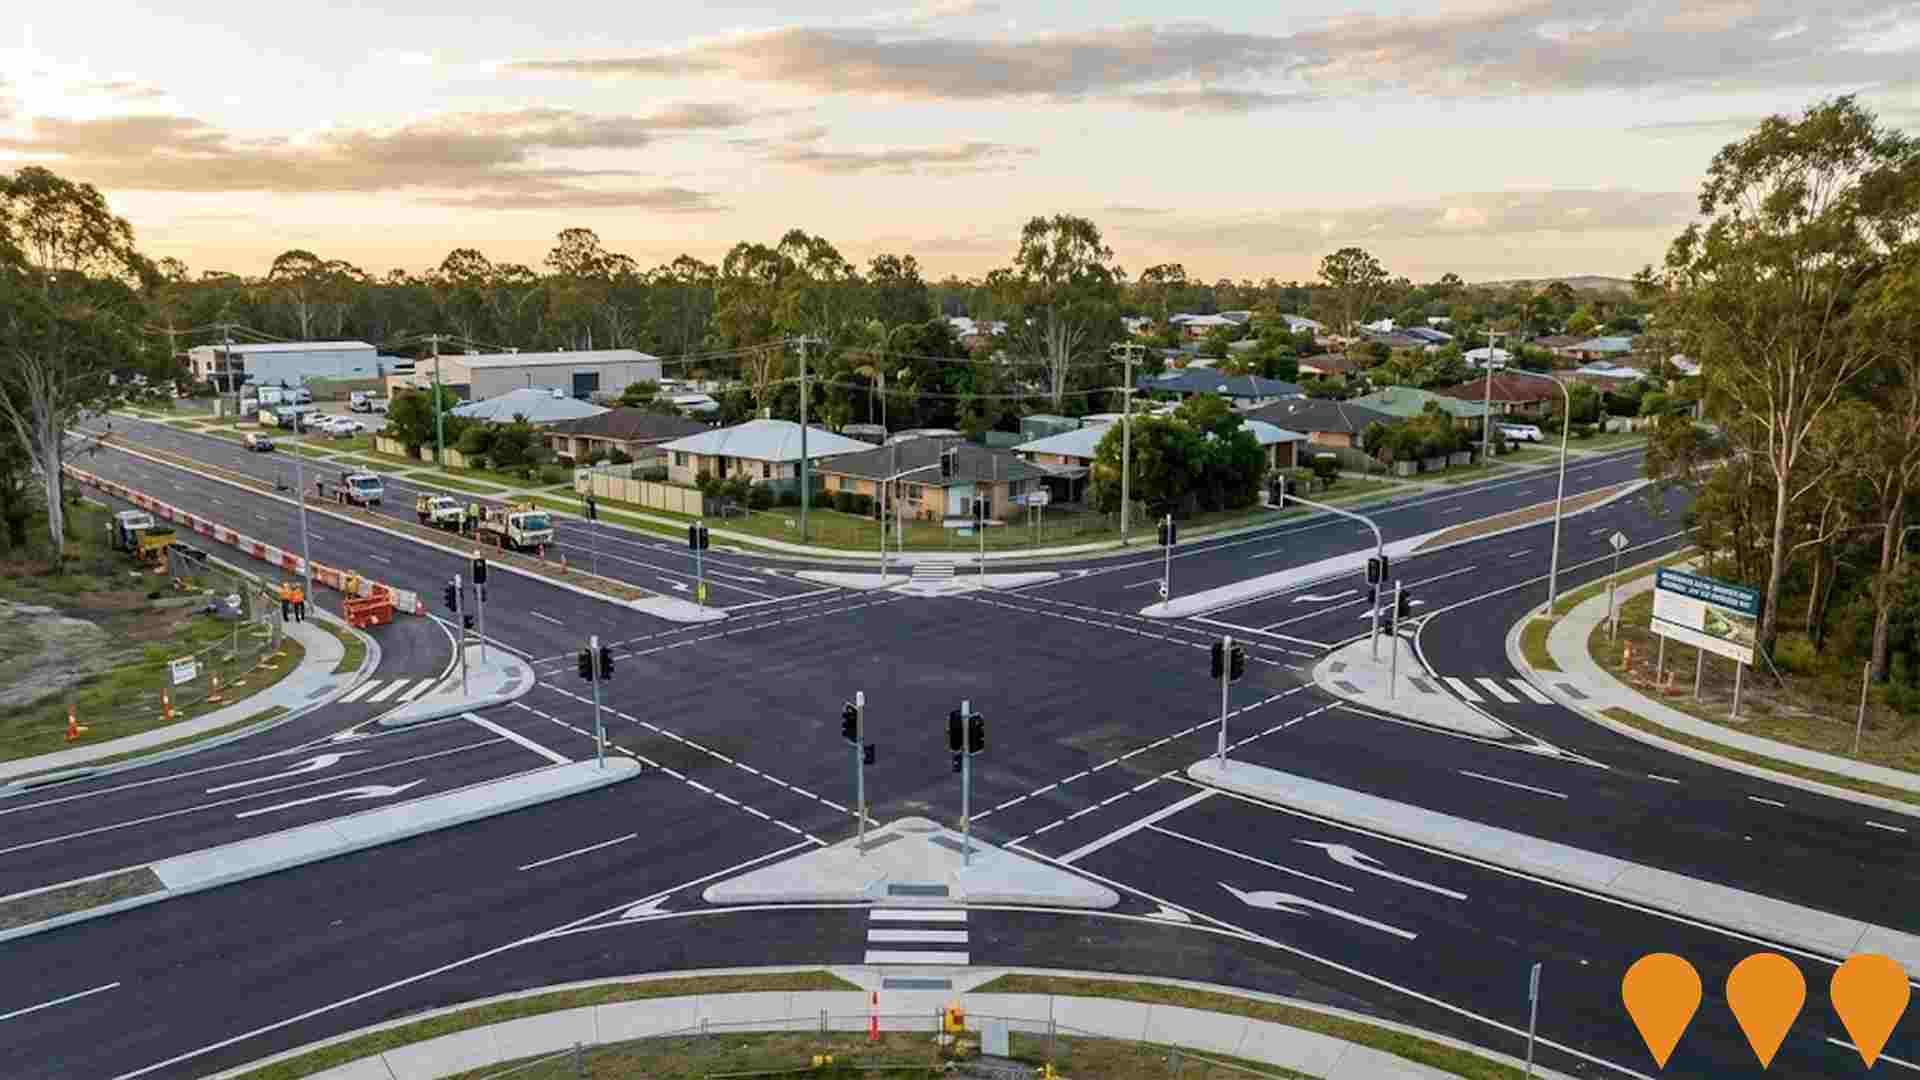
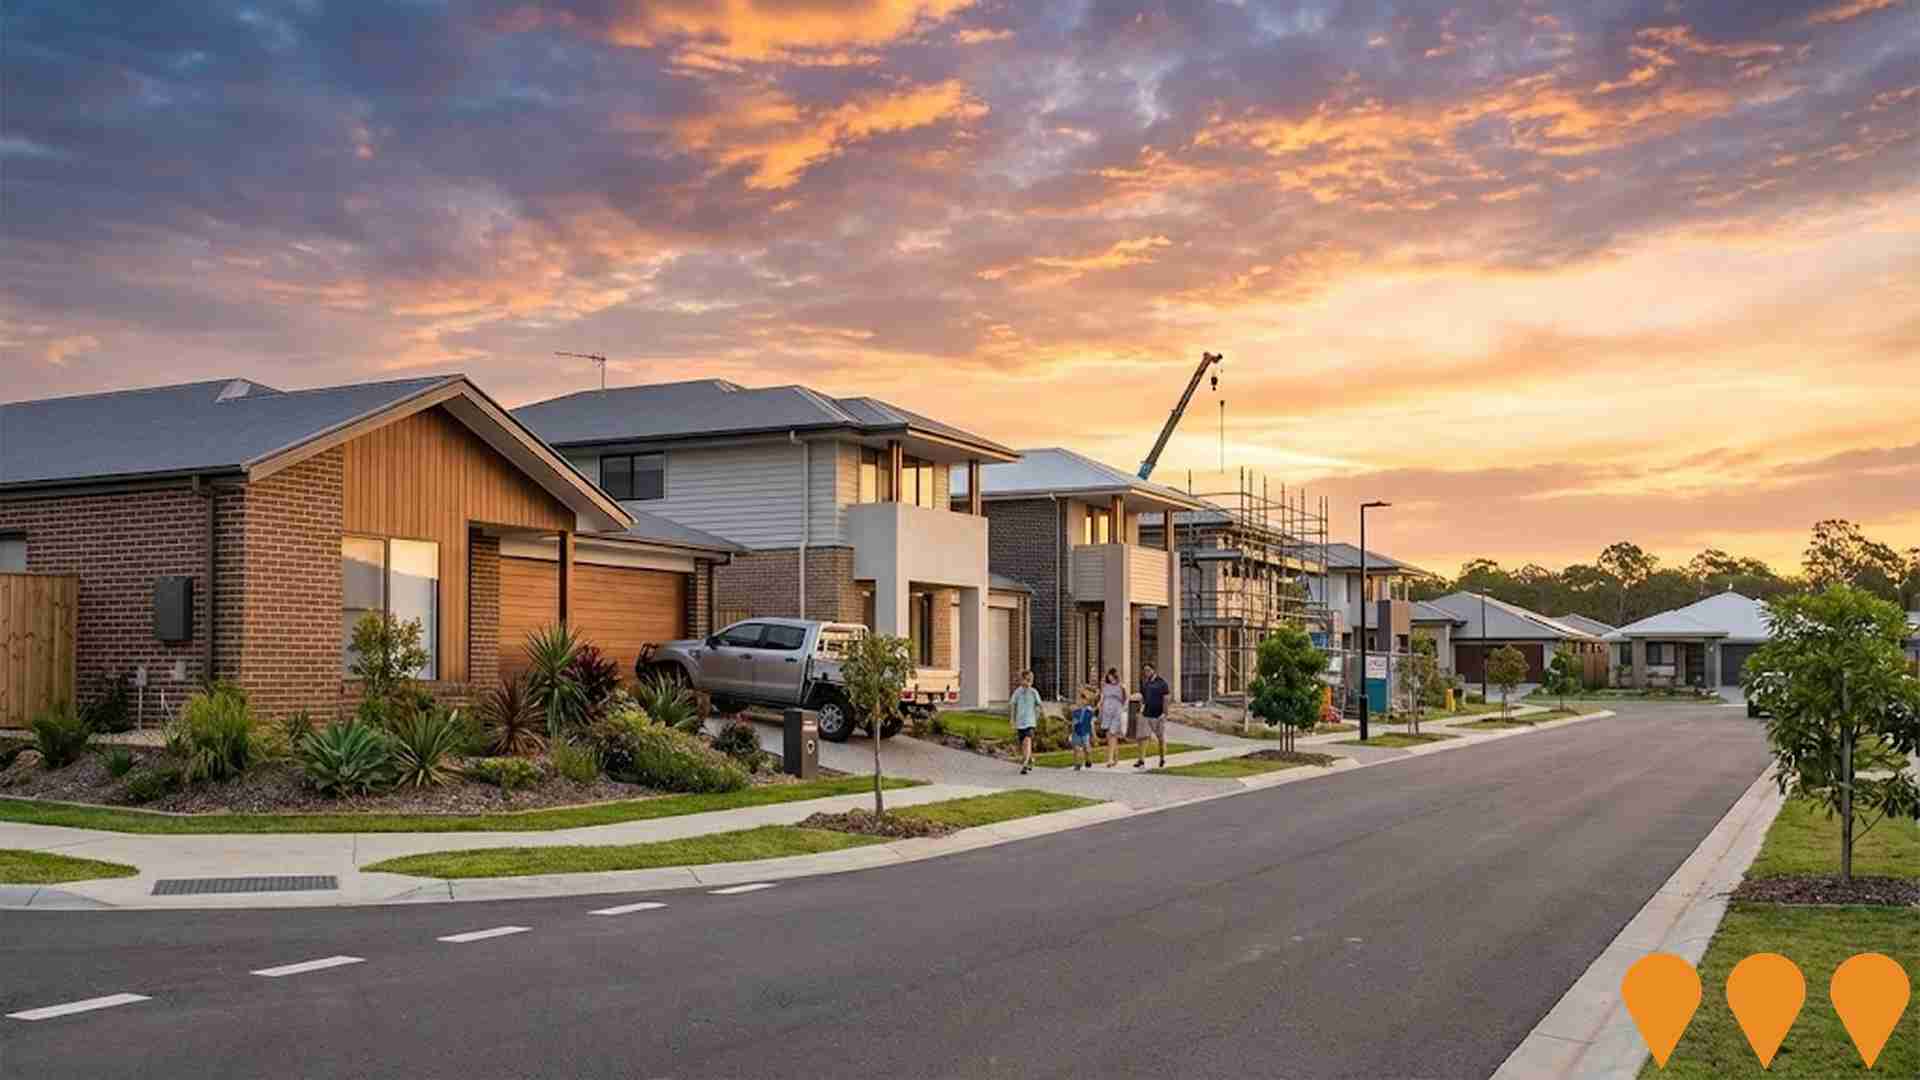
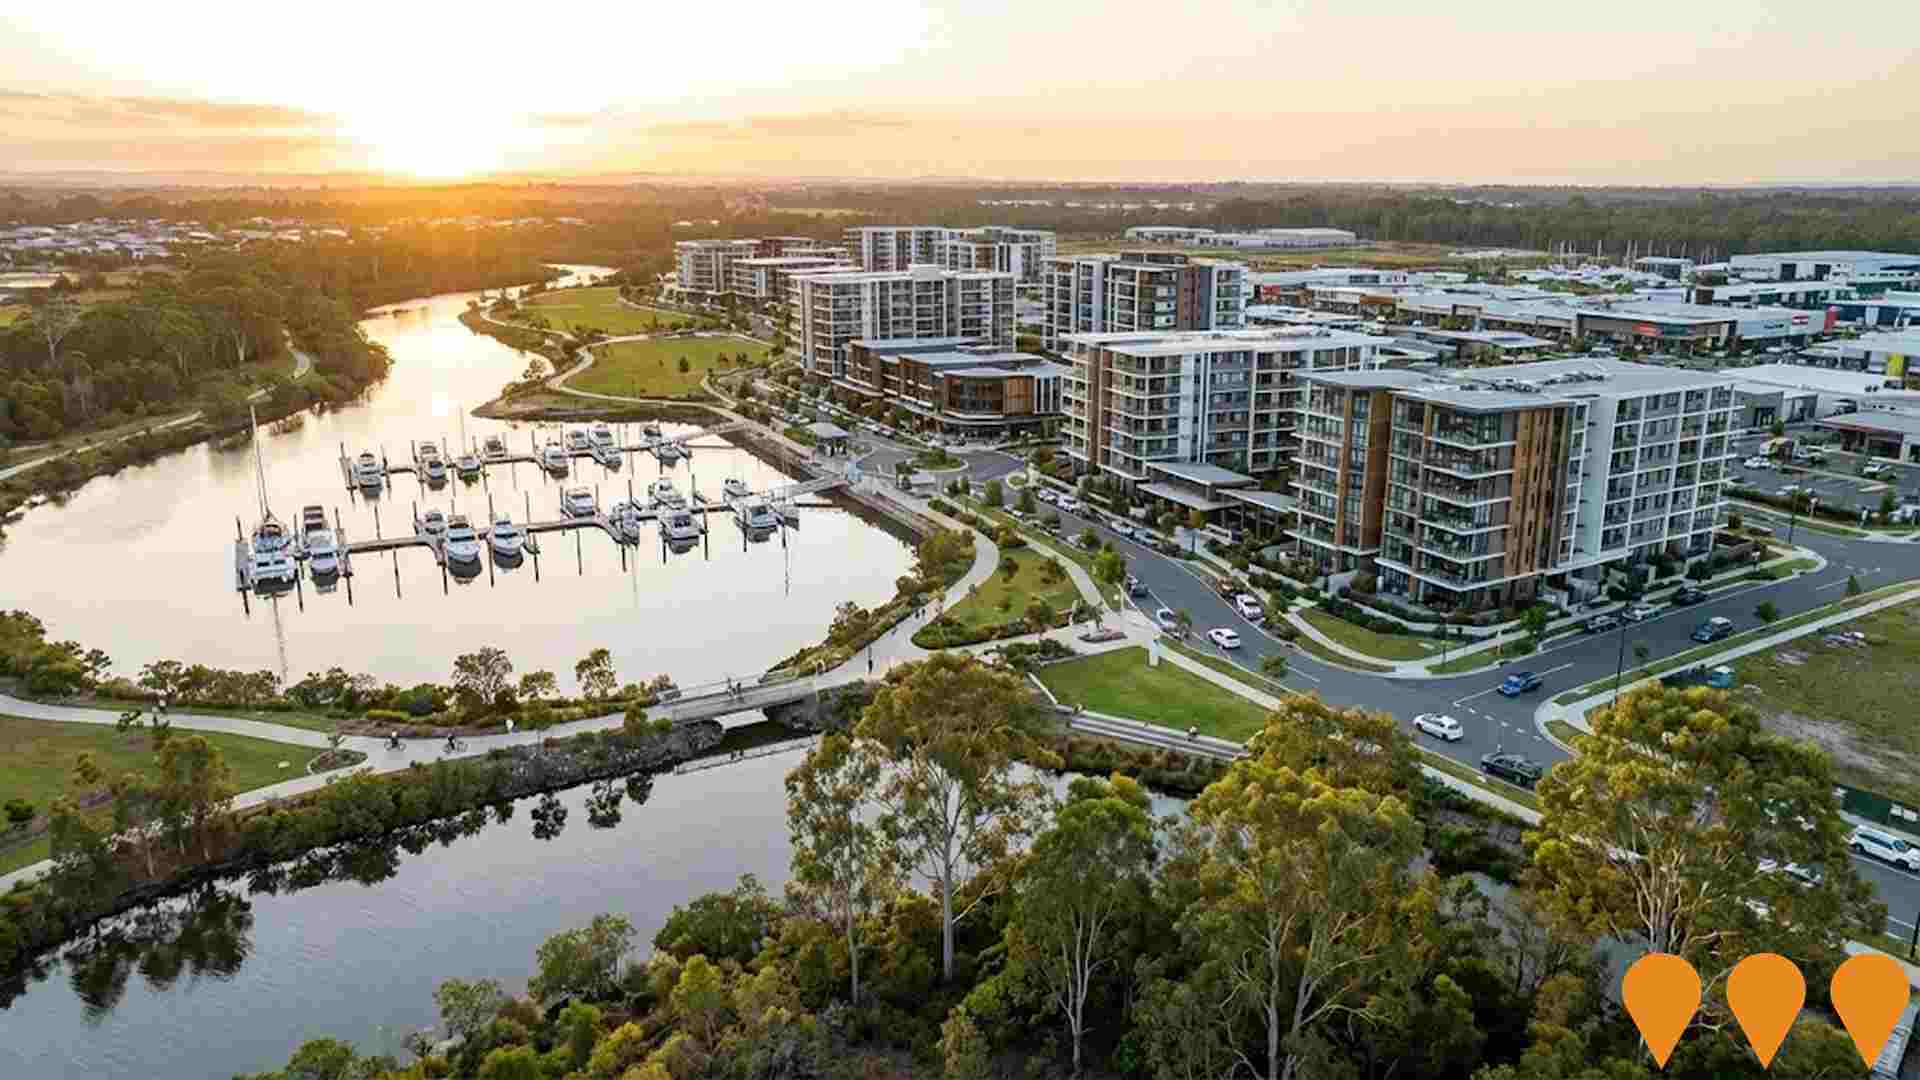
 Denotes AI-based impression for illustrative purposes only, not to be taken as definitive under any circumstances. Please follow links and conduct other investigations from the project's source for actual imagery. Developers and project owners wishing us to use original imagery please Contact Us and we will do so.
Frequently Asked Questions - Infrastructure
North Harbour Priority Development Area
The North Harbour Priority Development Area (PDA) in Burpengary East, declared 30 July 2025, is a $2.74 billion master-planned waterfront community spanning over 1,000 hectares. It incorporates the existing North Harbour residential estate, a new 400-berth marina, marine industry precinct, retail and tourism hubs, hotels, and 319 hectares of public riverfront parkland along 12 km of the Caboolture River. The PDA will deliver approximately 3,700 additional dwellings (on top of existing homes), creating a total community of over 10,000 residents when complete.
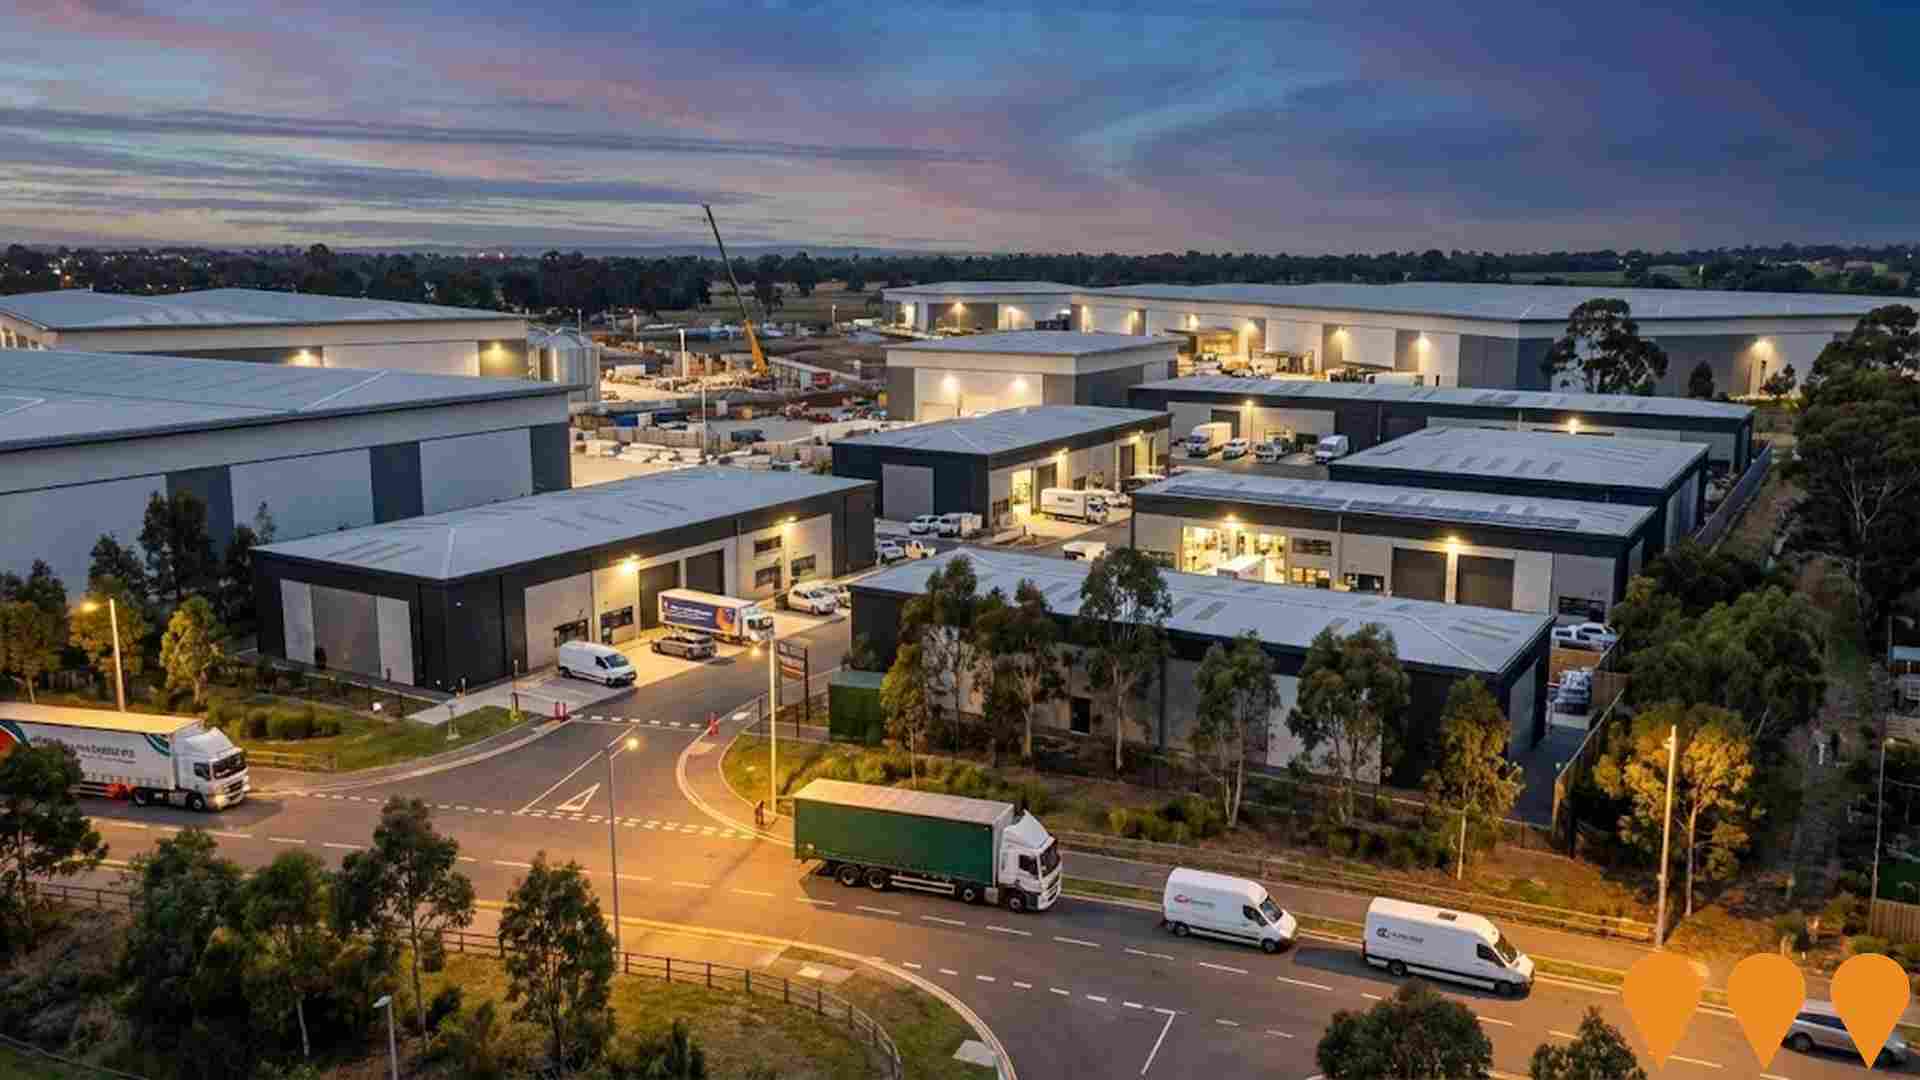
North Harbour Business Park
76-hectare master-planned industrial and business precinct in Burpengary East, forming part of the broader North Harbour community. Offers industrial lots from 1,800 sqm to over 4 ha suitable for manufacturing, marine industry, logistics, warehousing and commercial offices. Multiple stages released, with Stage 1 sold out and fully settled, Stages 2-4 progressively under construction or civil works in 2025. When complete the business park is expected to support thousands of jobs and form a key employment hub between Brisbane and the Sunshine Coast.
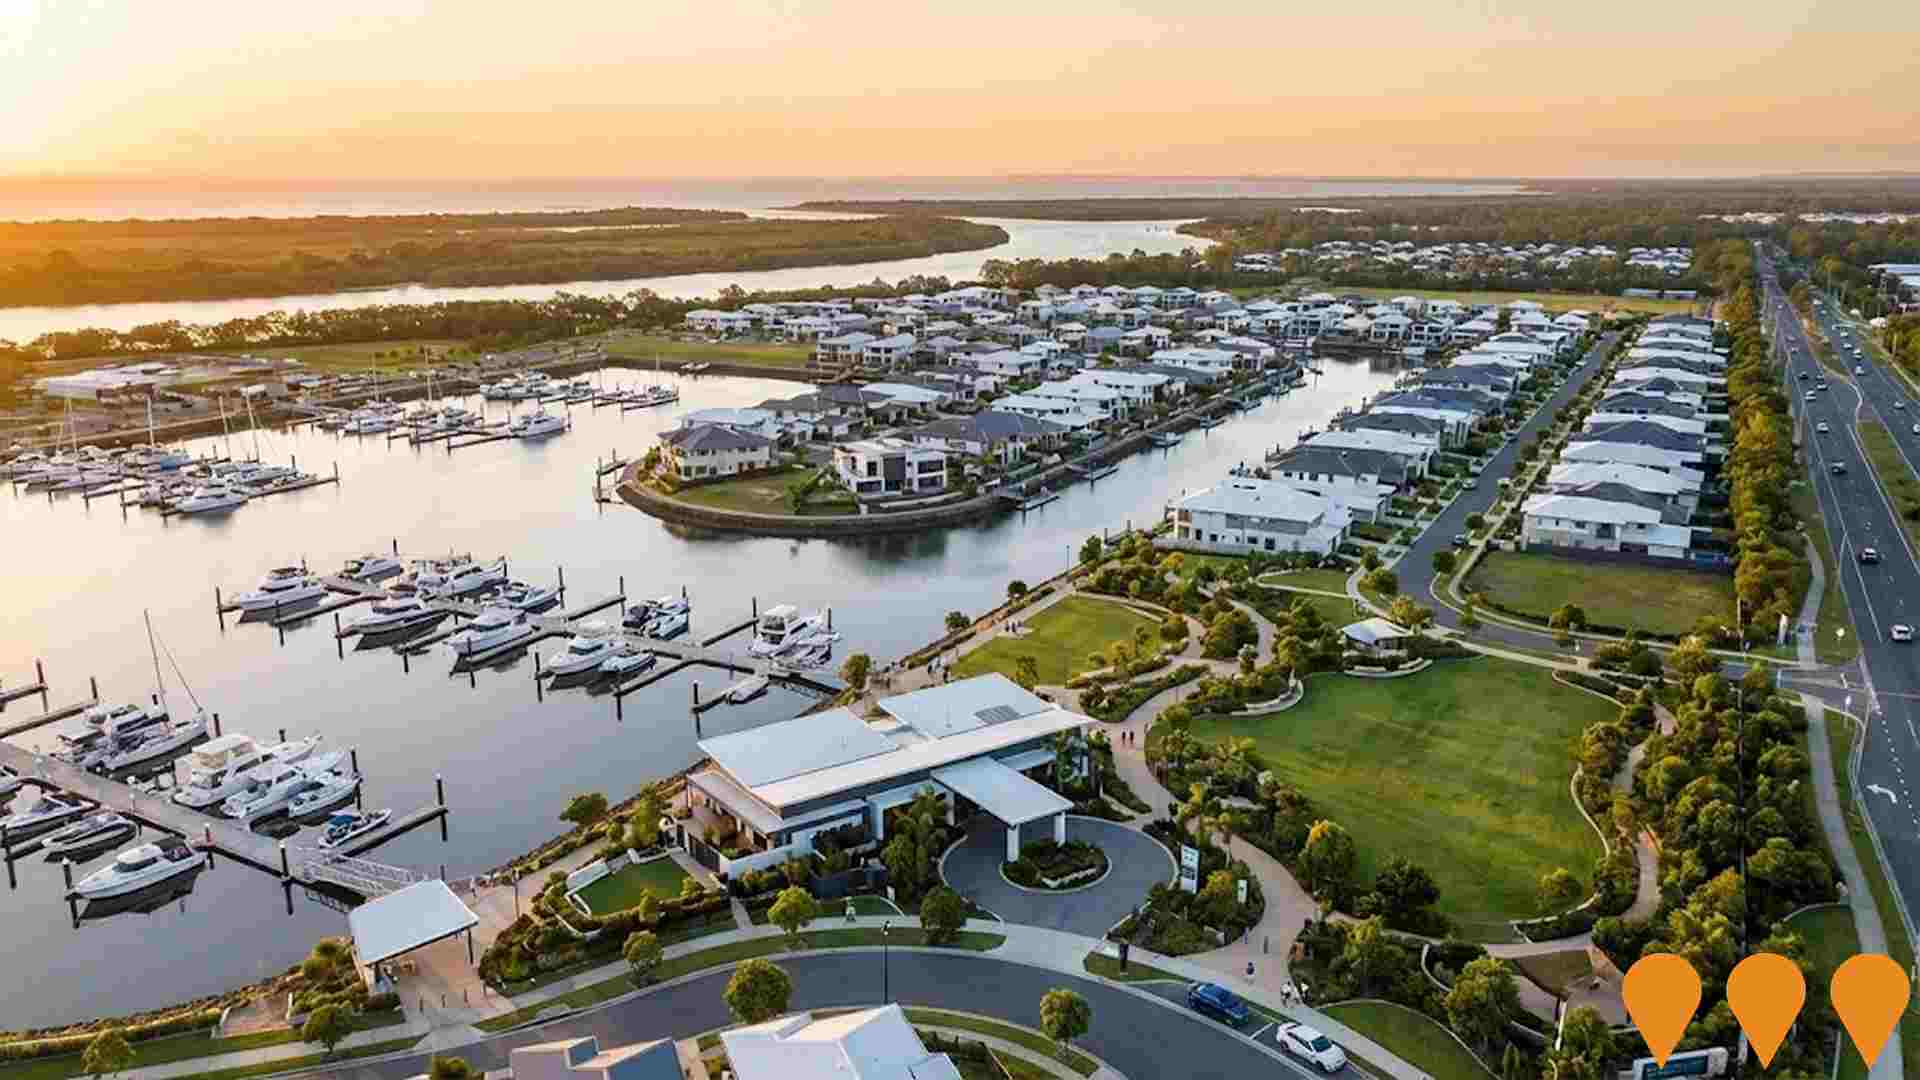
North Harbour
North Harbour is a $2.74 billion masterplanned waterfront community in Burpengary East, delivering up to 3,700 homes across approximately 1,000 acres (~400ha PDA + existing). The development includes a residential precinct (currently under construction), mixed-industry business park, 400-berth marina with 500 dry boat stackers and private pontoons, maritime industry and tourism precincts, retail village, hotel sites, and over 300 hectares of parkland and open space with 12km of public riverfront along the Caboolture River. Declared a Priority Development Area (PDA) on 30 July 2025.
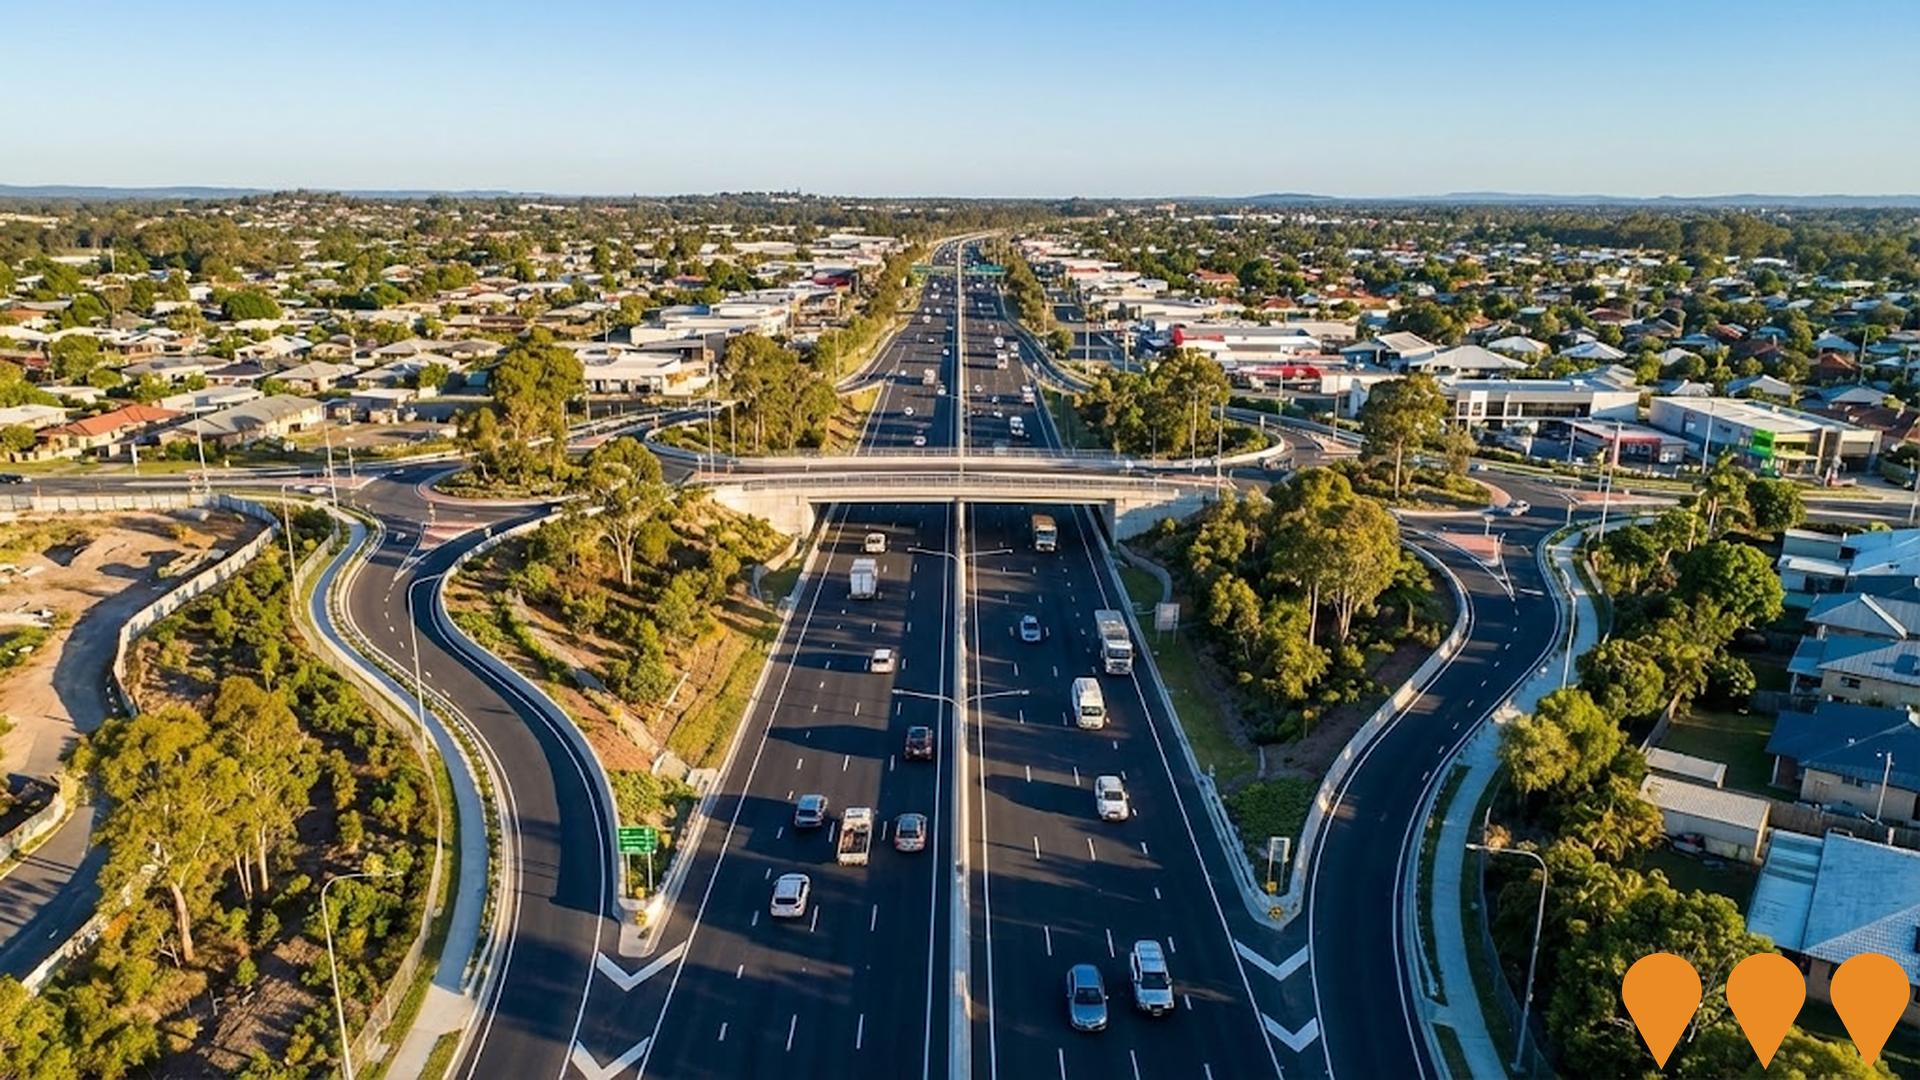
Bruce Highway Upgrade - Anzac Avenue to Caboolture-Bribie Island Road
A major upgrade of the Bruce Highway to widen the corridor from 4 to 6 lanes and separate local and through traffic. The $733 million Anzac Avenue to Uhlmann Road section is committed for detailed design (commencing 2026) and construction. The project includes upgrading interchanges at Uhlmann Road, Buchanan Road, and Caboolture-Bribie Island Road, and constructing collector-distributor roads to improve safety and reduce congestion.
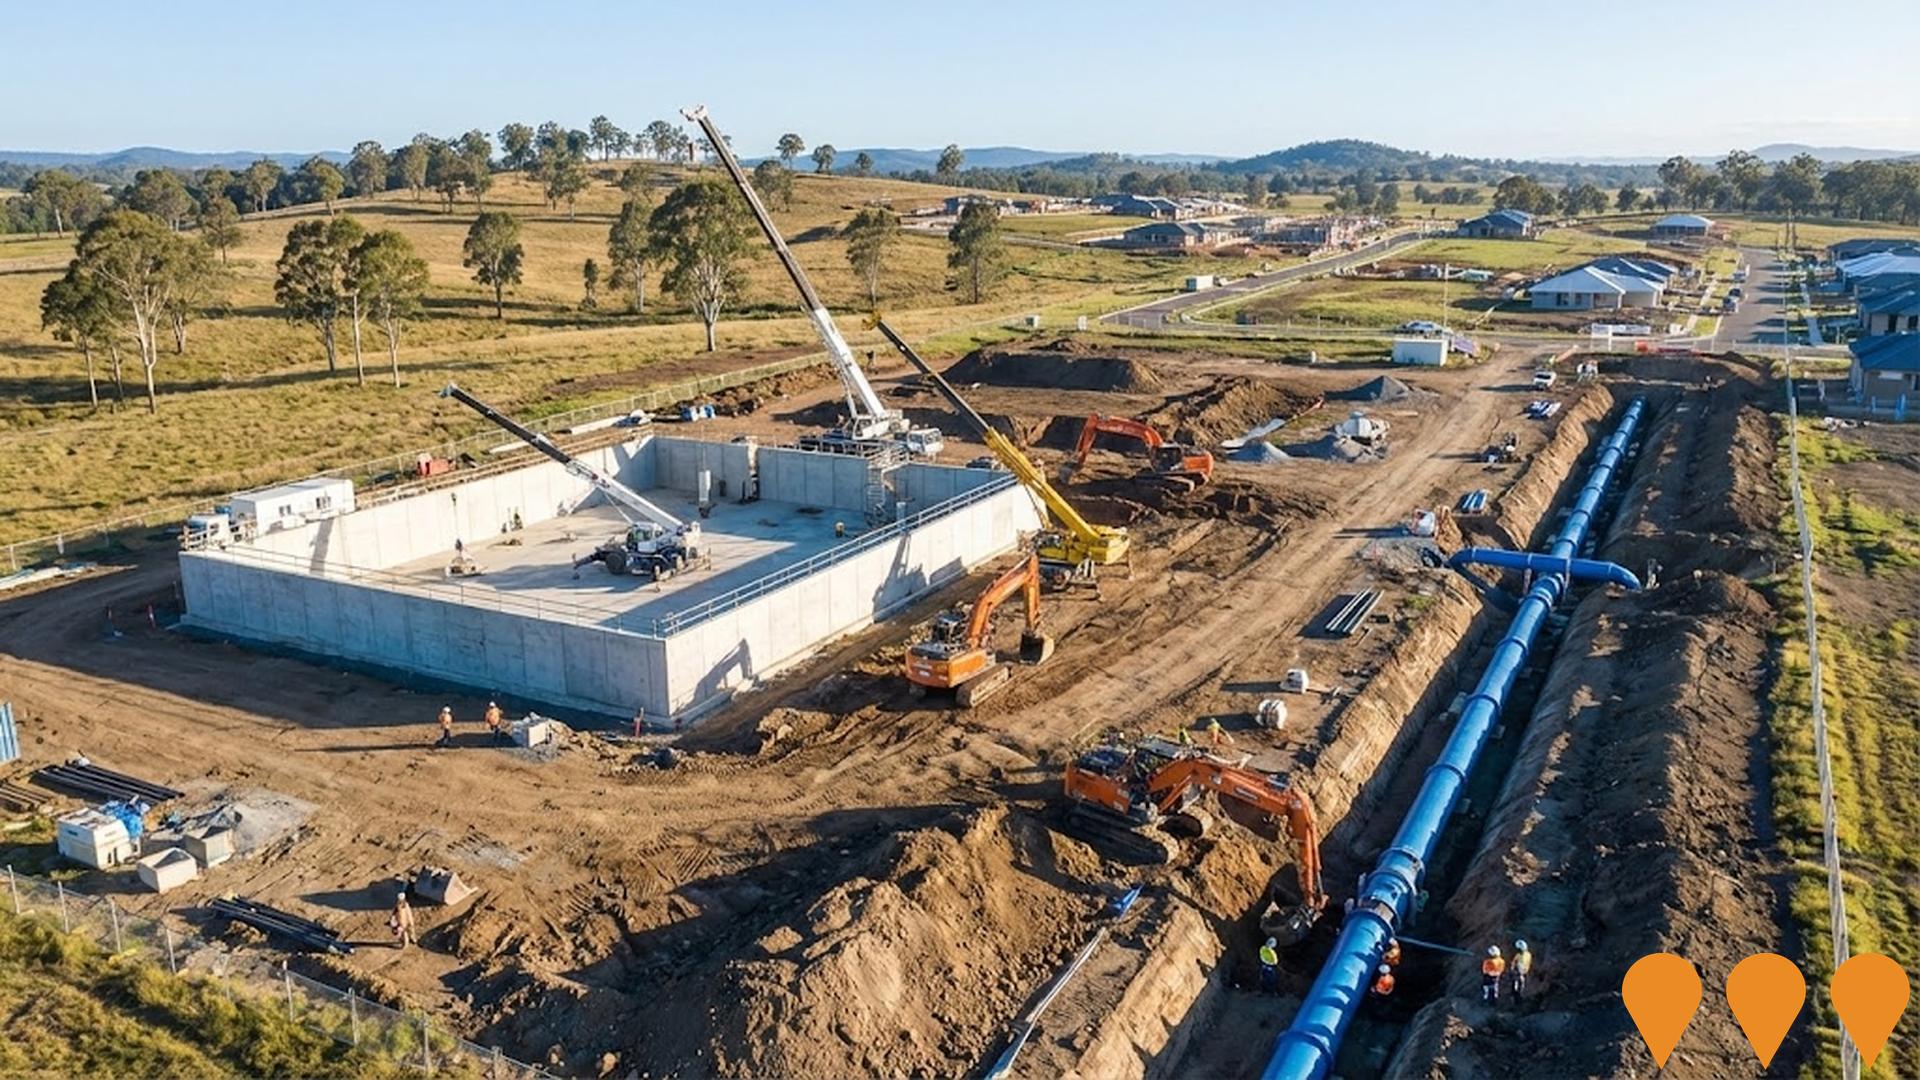
Pine Valley Water Supply Project
Major water infrastructure project delivered by Unitywater in partnership with Downer. Includes a new 15ML reservoir at Jacko Place, Morayfield and over 8km of large-diameter water mains to support rapid population growth in Caboolture West, Morayfield and Narangba. Designed to provide reliable water supply for more than 100,000 new residents over the next 20 years. Construction commenced early 2025 with practical completion expected mid-2027.
Morayfield South Emerging Community Area
900-hectare emerging community precinct in Morayfield, planned for approximately 9,800 new dwellings and a future population of around 26,000 people by 2046. Includes new district sports park, environmental corridors, schools, retail and community hubs. Council endorsed the final Morayfield South Future Directions Report on 13 August 2025, which now guides amendments to the Moreton Bay Planning Scheme to enable higher-density development.

Burpengary East Shopping Centre
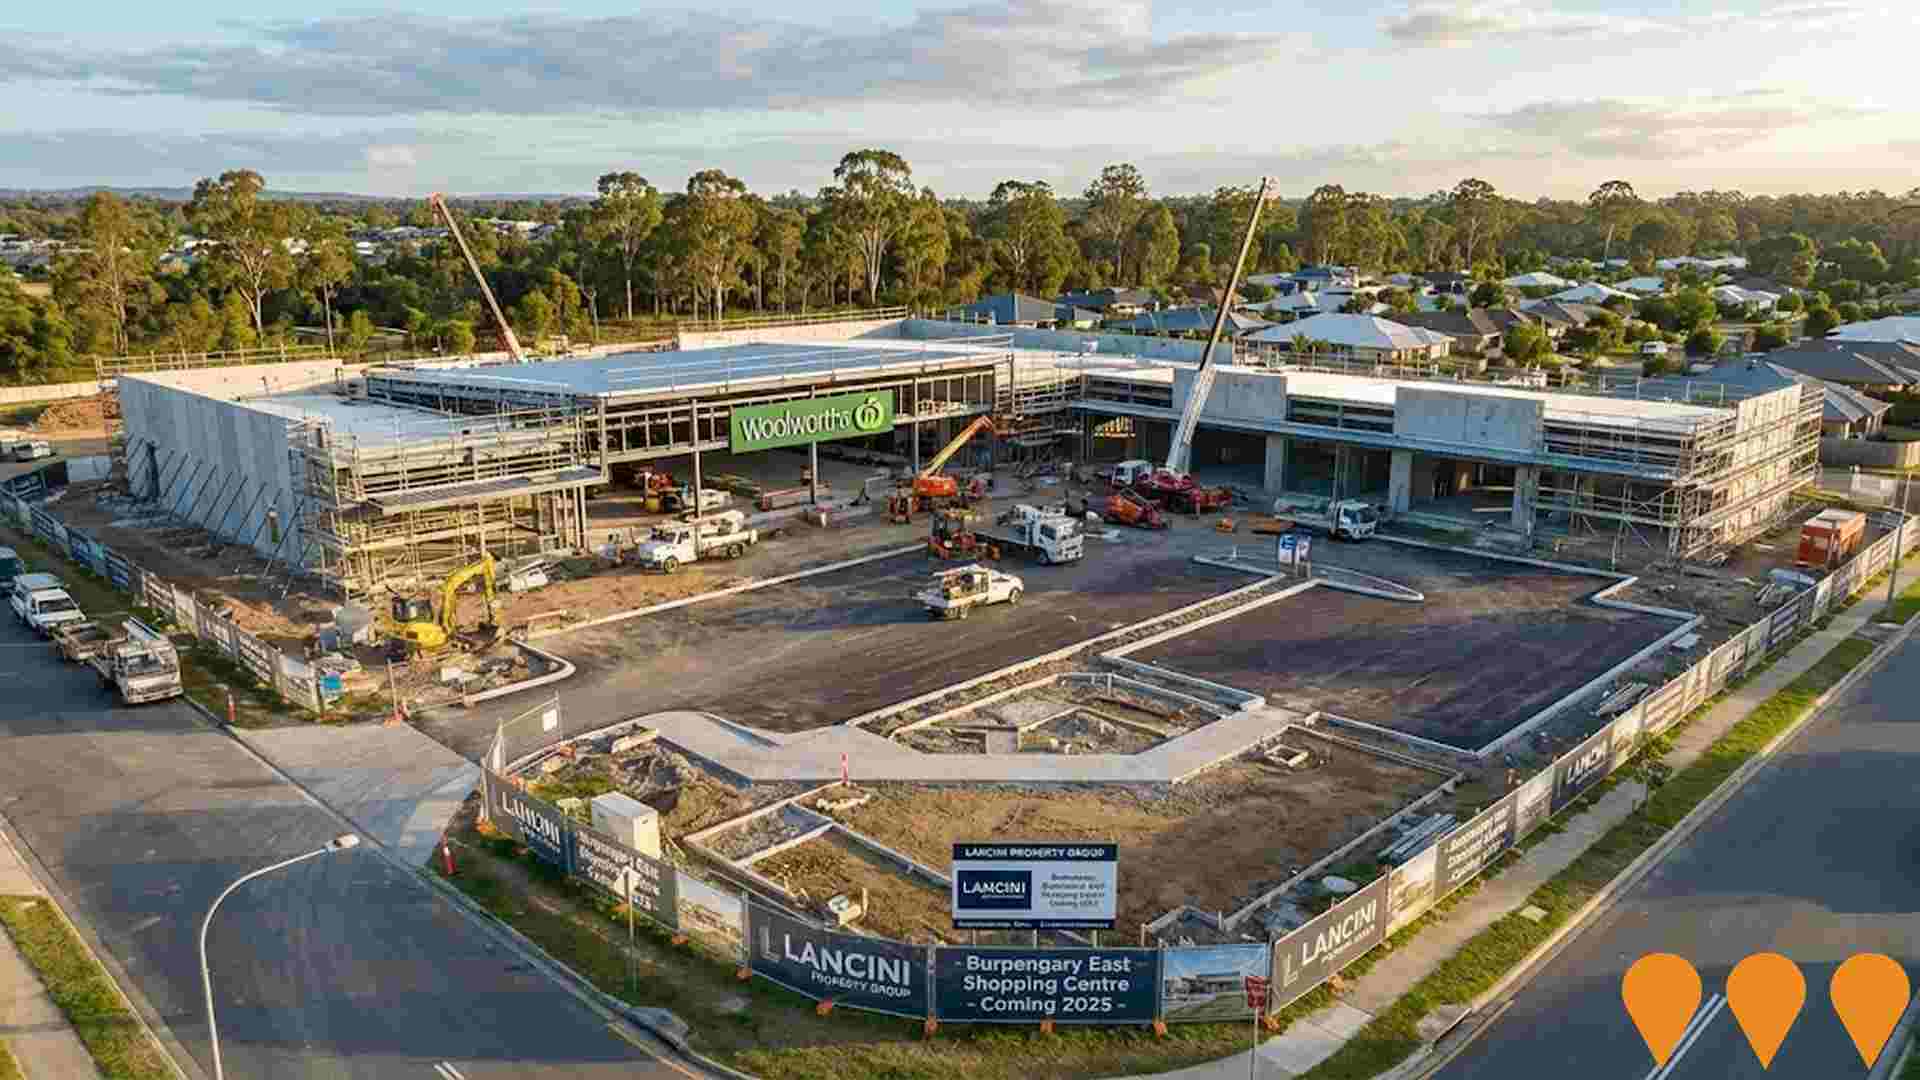
A $25 million neighbourhood shopping centre developed by Lancini Property Group, anchored by a full-line Woolworths supermarket with Direct-to-Boot service, plus 12 specialty stores, alfresco dining, community plaza, children's play area and 235+ car parks. Construction is well underway with practical completion expected late 2025.
Burpengary East Wastewater Treatment Plant Upgrade
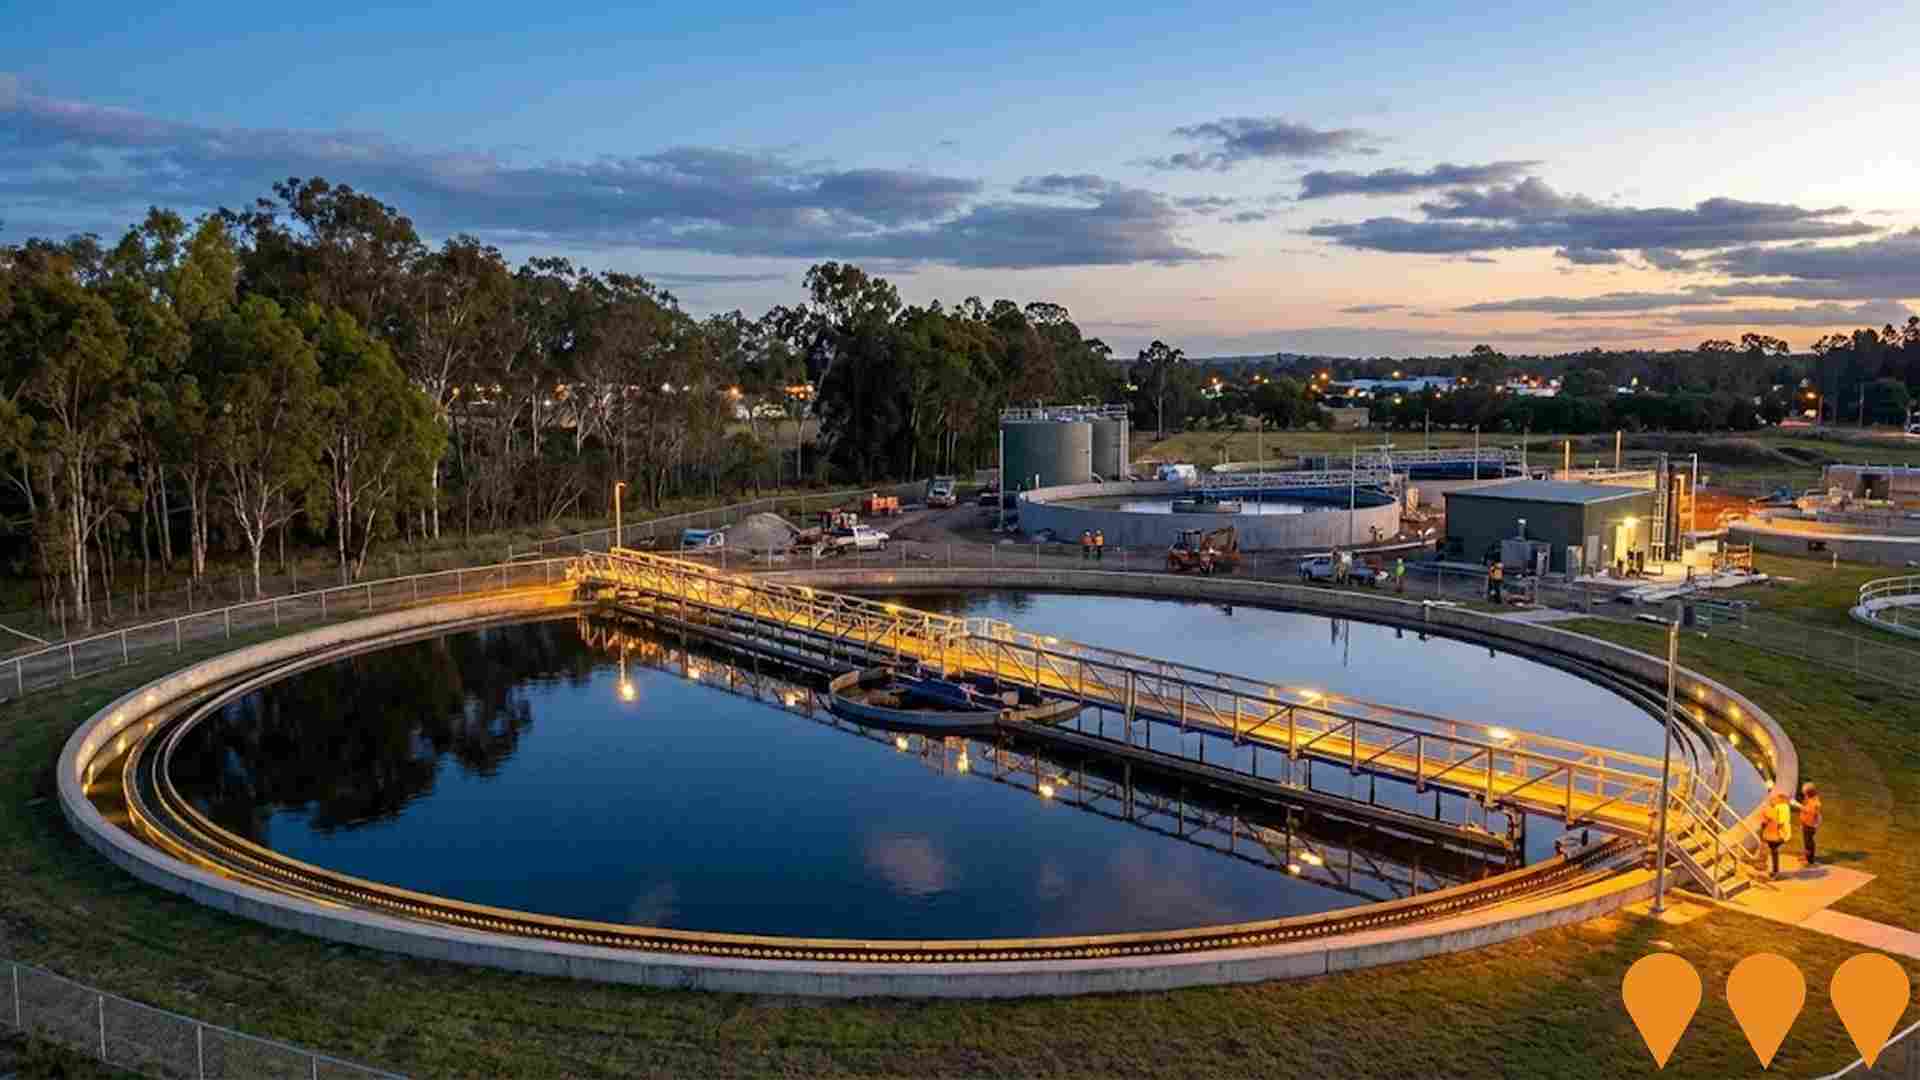
The upgrade to the Burpengary East Wastewater Treatment Plant increases capacity by 30% from 10 million to 14 million litres per day to support regional growth. It includes new inlet works with enhanced odour control, a new bioreactor, a new clarifier, upgraded effluent disinfection, electrical and control upgrades, and an internal plant road upgrade.
Employment
AreaSearch analysis of employment trends sees Burpengary - East performing better than 90% of local markets assessed across Australia
Burpengary - East has a balanced workforce with white and blue collar jobs. The construction sector is prominent, with an unemployment rate of 1.9% as of September 2025.
Employment growth over the past year was estimated at 7.8%. There are 5,108 residents in work, with an unemployment rate of 2.1%, lower than Greater Brisbane's 4.0%. Workforce participation is high at 69.9%. Key employment sectors include health care & social assistance, construction, and retail trade.
Construction employs 1.6 times the regional level. Professional & technical services employ only 4.7% of local workers, below Greater Brisbane's 8.9%. Employment opportunities locally appear limited based on Census data analysis. Over a 12-month period, employment increased by 7.8%, labour force grew by 7.0%, and unemployment fell by 0.7 percentage points. In contrast, Greater Brisbane saw employment rise by 3.8% and unemployment fall by 0.5 percentage points. State-wide in Queensland as of 25-Nov, employment contracted by 0.01% with an unemployment rate of 4.2%. National employment forecasts from May-25 suggest growth of 6.6% over five years and 13.7% over ten years. Applying these projections to Burpengary - East's employment mix indicates local employment should increase by 6.3% over five years and 13.2% over ten years, assuming constant population projections.
Frequently Asked Questions - Employment
Income
Income analysis reveals strong economic positioning, with the area outperforming 60% of locations assessed nationally by AreaSearch
The median taxpayer income in Burpengary - East SA2 was $53,173 and the average was $61,288 according to postcode level ATO data aggregated by AreaSearch for financial year 2022. This is lower than national averages, with Greater Brisbane's median income being $55,645 and average income being $70,520. As of September 2025, estimated incomes are approximately $60,612 (median) and $69,862 (average), based on a 13.99% increase since financial year 2022. According to the 2021 Census, household incomes rank at the 85th percentile with weekly earnings of $2,346. The income distribution shows that 40.1% of residents (3,601 people) fall within the $1,500 - $2,999 bracket, similar to the metropolitan region where this cohort represents 33.3%. Economic strength is evident with 32.6% of households earning over $3,000 weekly, supporting high consumer spending despite housing costs consuming 15.2% of income. Disposable income remains at the 85th percentile, and the area's SEIFA income ranking places it in the 6th decile.
Frequently Asked Questions - Income
Housing
Burpengary - East is characterized by a predominantly suburban housing profile, with above-average rates of outright home ownership
The dwelling structure in Burpengary - East, as per the latest Census, consisted of 94.2% houses and 5.8% other dwellings such as semi-detached homes, apartments, and 'other' dwellings. This compares to Brisbane metropolitan area's figures of 83.4% houses and 16.5% other dwellings. Home ownership in Burpengary - East stood at 24.1%, similar to the Brisbane metro level, with mortgaged properties at 58.1% and rented ones at 17.7%. The median monthly mortgage repayment in the area was $2,100, higher than the Brisbane metro average of $1,625. The median weekly rent figure for Burpengary - East was recorded at $430, compared to the Brisbane metro's $335. Nationally, Burpengary - East's mortgage repayments were significantly higher than the Australian average of $1,863, while rents were substantially above the national figure of $375.
Frequently Asked Questions - Housing
Household Composition
Burpengary - East features high concentrations of family households, with a higher-than-average median household size
Family households account for 88.1% of all households, including 46.0% couples with children, 31.4% couples without children, and 9.5% single parent families. Non-family households constitute the remaining 11.9%, with lone person households at 9.6% and group households making up 2.3% of the total. The median household size is 3.1 people, larger than the Greater Brisbane average of 2.7.
Frequently Asked Questions - Households
Local Schools & Education
Educational attainment in Burpengary - East aligns closely with national averages, showing typical qualification patterns and performance metrics
The area's university qualification rate is 15.7%, significantly lower than Greater Brisbane's average of 30.5%. Bachelor degrees are the most common at 11.6%, followed by postgraduate qualifications (2.1%) and graduate diplomas (2.0%). Vocational credentials are prevalent, with 45.2% of residents aged 15+ holding them - advanced diplomas at 11.8% and certificates at 33.4%. Educational participation is high, with 29.7% of residents currently enrolled in formal education.
This includes 10.7% in primary education, 8.9% in secondary education, and 4.2% pursuing tertiary education.
Frequently Asked Questions - Education
Schools Detail
Nearby Services & Amenities
Transport
No public transport data available for this catchment area.
Frequently Asked Questions - Transport
Transport Stops Detail
Health
Burpengary - East's residents are relatively healthy in comparison to broader Australia with the level of common health conditions among the general population somewhat typical, though higher than the nation's average among older cohorts
Burpengary East's health metrics are close to national benchmarks. Common health conditions among its general population are somewhat typical but higher than the national average for older cohorts.
Approximately 51% of the total population (~4,544 people) has private health cover, which is relatively low compared to Greater Brisbane's 47.6%. The most common medical conditions in the area are mental health issues and asthma, affecting 8.8 and 8.0% of residents respectively. 68.7% of residents declare themselves completely clear of medical ailments, compared to 61.9% across Greater Brisbane. The area has 11.6% of residents aged 65 and over (1,039 people), lower than Greater Brisbane's 17.0%. Health outcomes among seniors require more attention than the broader population.
Frequently Asked Questions - Health
Cultural Diversity
Burpengary - East ranks below the Australian average when compared to other local markets across a number of language and cultural background related metrics
Burpengary-East, as per the census conducted on 9 August 2016, had a population with 81.0% born in Australia, 89.3% being citizens, and 93.4% speaking English only at home. Christianity was the predominant religion, comprising 50.0% of the population, compared to 44.7% across Greater Brisbane. The top three ancestry groups were English (32.7%), Australian (29.3%), and Scottish (7.0%).
Notably, New Zealanders made up 1.3%, Maori 1.3%, and Samoans 0.6%, while the regional averages stood at 1.1%, 1.2%, and 0.7% respectively.
Frequently Asked Questions - Diversity
Age
Burpengary - East hosts a young demographic, positioning it in the bottom quartile nationwide
The median age of Burpengary-East is 34, making it younger than Greater Brisbane's figure of 36 and Australia's national median of 38 years. Compared to Greater Brisbane, Burpengary-East has a higher proportion of residents aged 5-14 (13.9%) but fewer residents aged 65-74 (6.2%). Between the 2021 Census and the present day, the population aged 35-44 grew from 13.2% to 15.3%, while the 15-24 age group increased from 13.4% to 14.7%. Conversely, the 45-54 cohort declined from 14.0% to 12.8%, and the 0-4 age group dropped from 7.4% to 6.2%. By 2041, population forecasts suggest significant demographic shifts in Burpengary-East, with the 45-54 cohort projected to grow by 123%, adding 1,404 residents to reach a total of 2,550.
