Chart Color Schemes
This analysis uses ABS Statistical Areas Level 2 (SA2) boundaries, which can materially differ from Suburbs and Localities (SAL) even when sharing similar names.
SA2 boundaries are defined by the Australian Bureau of Statistics and are designed to represent communities for statistical reporting (e.g., census and ERP).
Suburbs and Localities (SAL) represent commonly-used suburb/locality names (postal-style areas) and may use different geographic boundaries. For comprehensive analysis, consider reviewing both boundary types if available.
est. as @ -- *
ABS ERP | -- people | --
2021 Census | -- people
Sales Activity
Curious about local property values? Filter the chart to assess the volume and appreciation (including resales) trends and regional comparisons, or scroll to the map below view this information at an individual property level.
Find a Recent Sale
Sales Detail
Population
Narangba lies within the top quartile of areas nationally for population growth performance according to AreaSearch analysis of recent, and medium to long-term trends
Narangba's population was around 23,770 as of November 2025. This showed an increase of 2,856 people from the 2021 Census figure of 20,914, reflecting a growth rate of 13.7%. The change was inferred from ABS's estimated resident population of 23,135 in June 2024 and an additional 832 validated new addresses since the Census date. This resulted in a population density of 630 persons per square kilometer. Narangba's growth exceeded both national (8.9%) and state averages since the 2021 census, indicating it as a growth leader. Interstate migration contributed approximately 54.6% to overall population gains during recent periods.
AreaSearch uses ABS/Geoscience Australia projections for each SA2 area released in 2024 with a base year of 2022. For areas not covered and years post-2032, Queensland State Government's SA2 area projections released in 2023 based on 2021 data are adopted, with proportional growth weightings applied for age cohorts where necessary. Future population trends forecast a significant increase in the top quartile of Australian statistical areas, with Narangba expected to grow by 6,905 persons to 2041, reflecting an overall increase of 26.4% over the 17 years.
Frequently Asked Questions - Population
Development
The level of residential development activity in Narangba was found to be higher than 90% of real estate markets across the country
Narangba has seen approximately 239 new homes approved annually. Between FY-21 and FY-25, around 1,195 homes were approved, with an additional 134 approved in FY-26 to date. On average, about two people moved to the area per new home constructed over these five financial years, indicating strong demand that supports property values.
The average construction cost value of new homes was $253,000, which is below the regional average, suggesting more affordable housing options for buyers. This year has seen $37.1 million in commercial development approvals, reflecting robust commercial development momentum. Compared to Greater Brisbane, Narangba records about three-quarters the building activity per person and ranks among the 85th percentile nationally, indicating strong developer confidence. New building activity consists of approximately 93% standalone homes and 7% townhouses or apartments, maintaining the area's traditional low-density character focused on family homes.
With around 109 people per dwelling approval, Narangba exhibits characteristics of a growth area. According to AreaSearch's latest quarterly estimate, Narangba is projected to gain about 6,270 residents by 2041. At current development rates, new housing supply should comfortably meet demand, providing favorable conditions for buyers and potentially supporting population growth beyond current projections.
Frequently Asked Questions - Development
Infrastructure
Narangba has strong levels of nearby infrastructure activity, ranking in the top 40% nationally
The performance of a region is significantly influenced by changes in local infrastructure, major projects, and planning initiatives. AreaSearch has identified 35 such projects that could potentially impact the area. Notable projects include Moreton Bay Central (formerly known as The Mill at Moreton Bay), Narangba Central Shopping Centre, Narangba Innovation Precinct, and Narangba Heights Estate. The following list details those projects likely to be most relevant.
Professional plan users can use the search below to filter and access additional projects.
INFRASTRUCTURE SEARCH
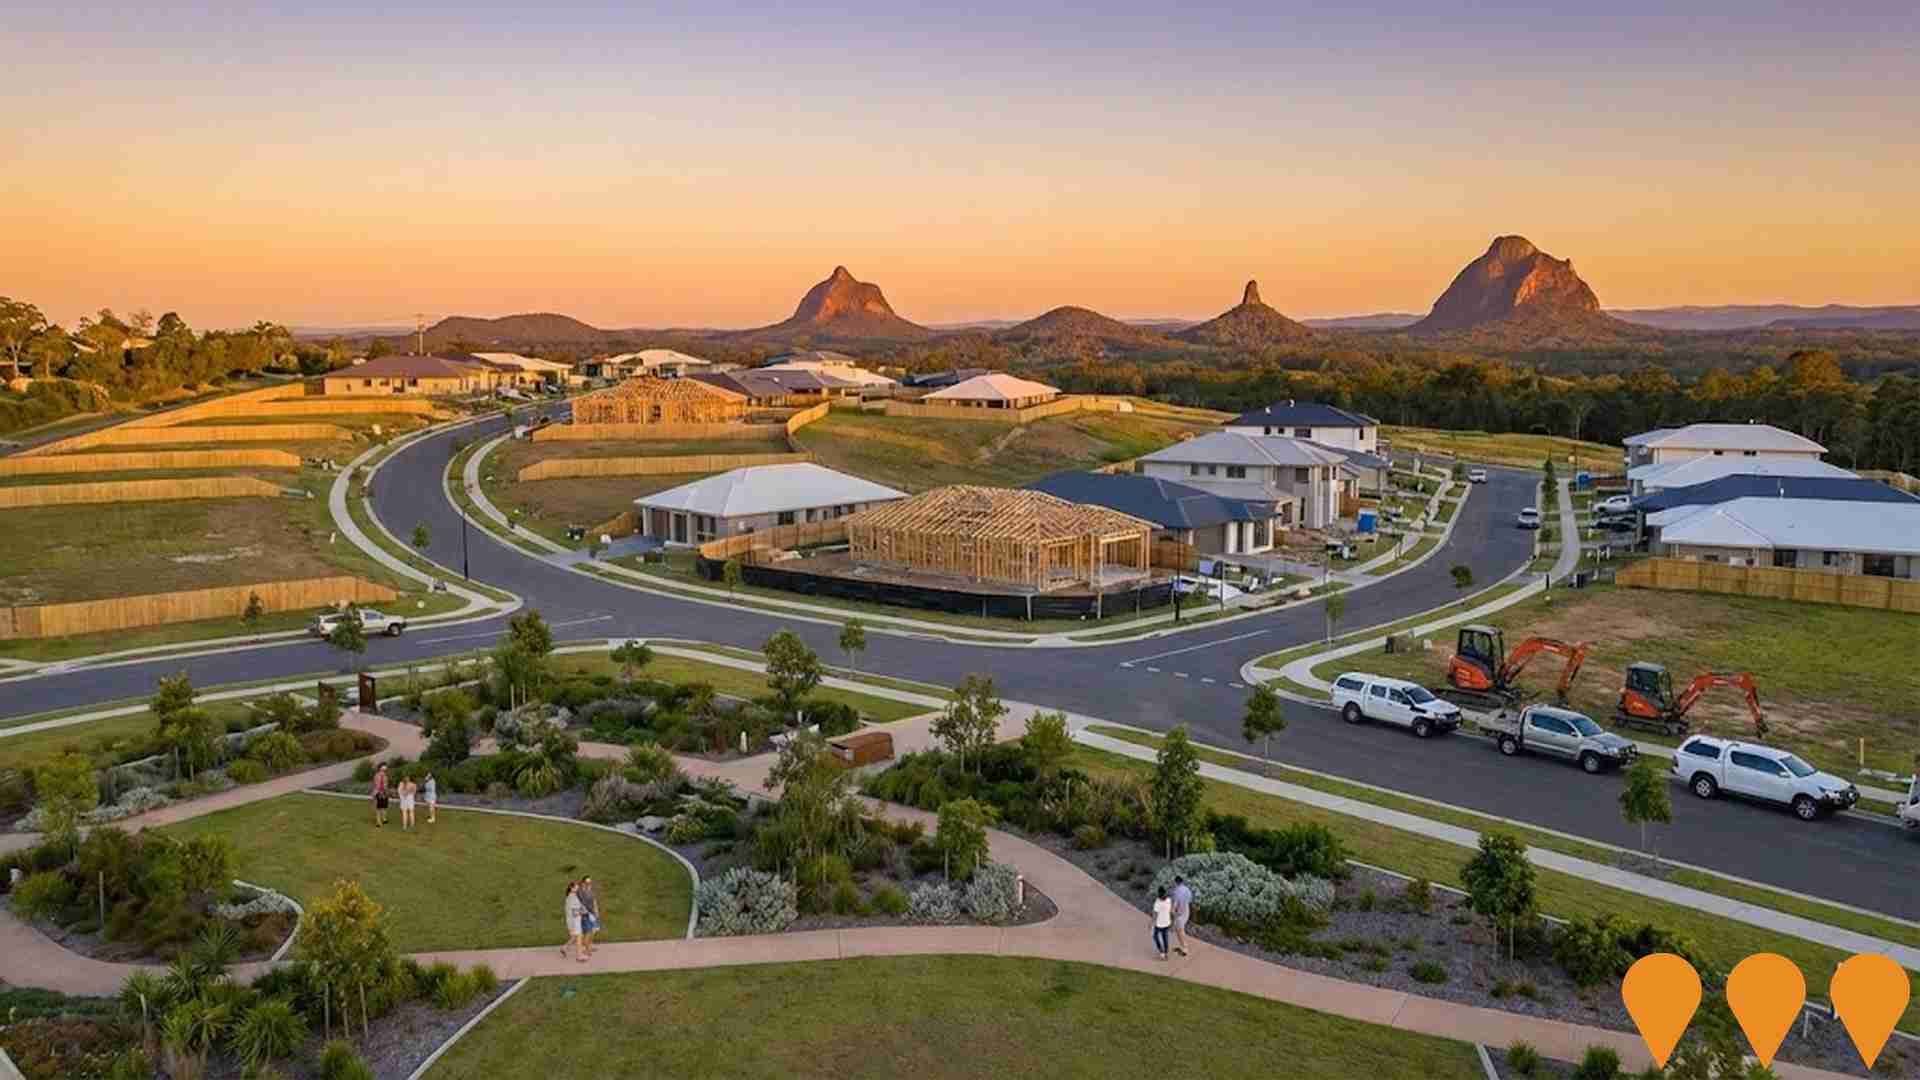
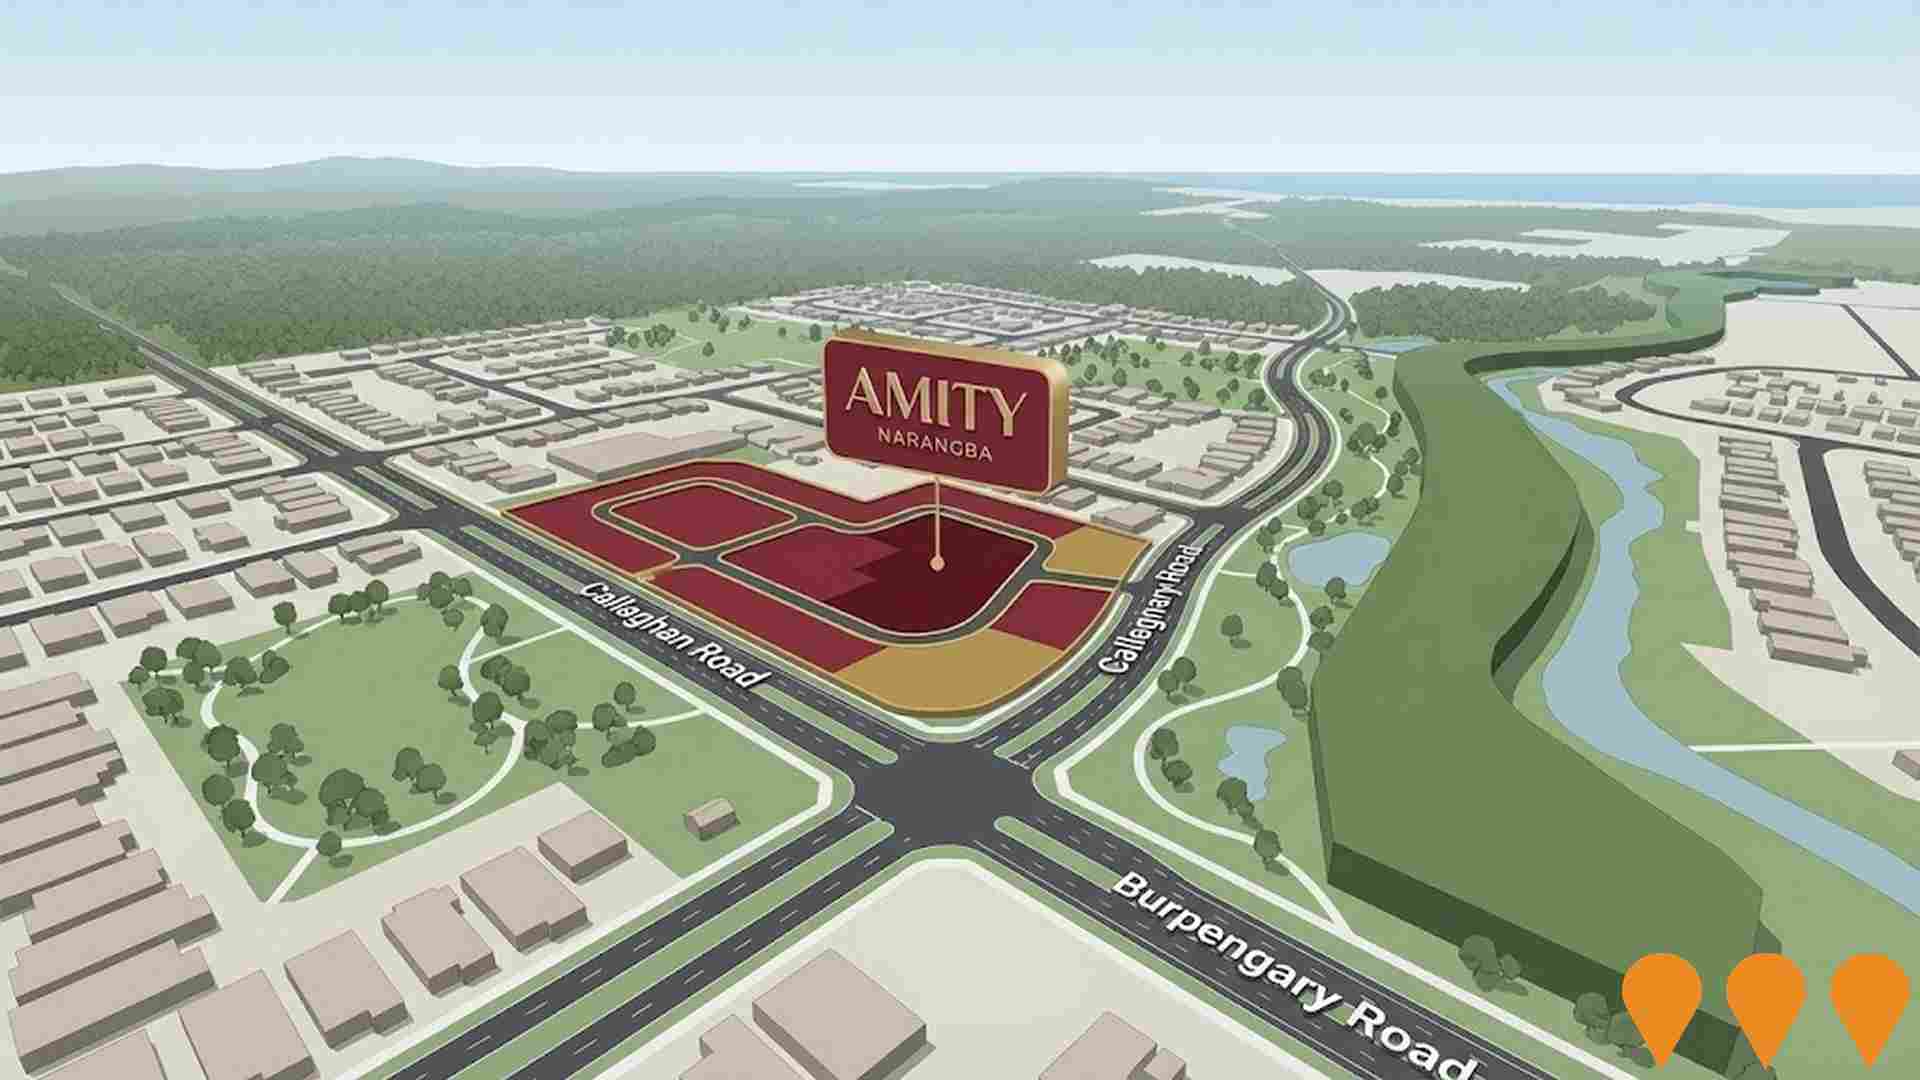
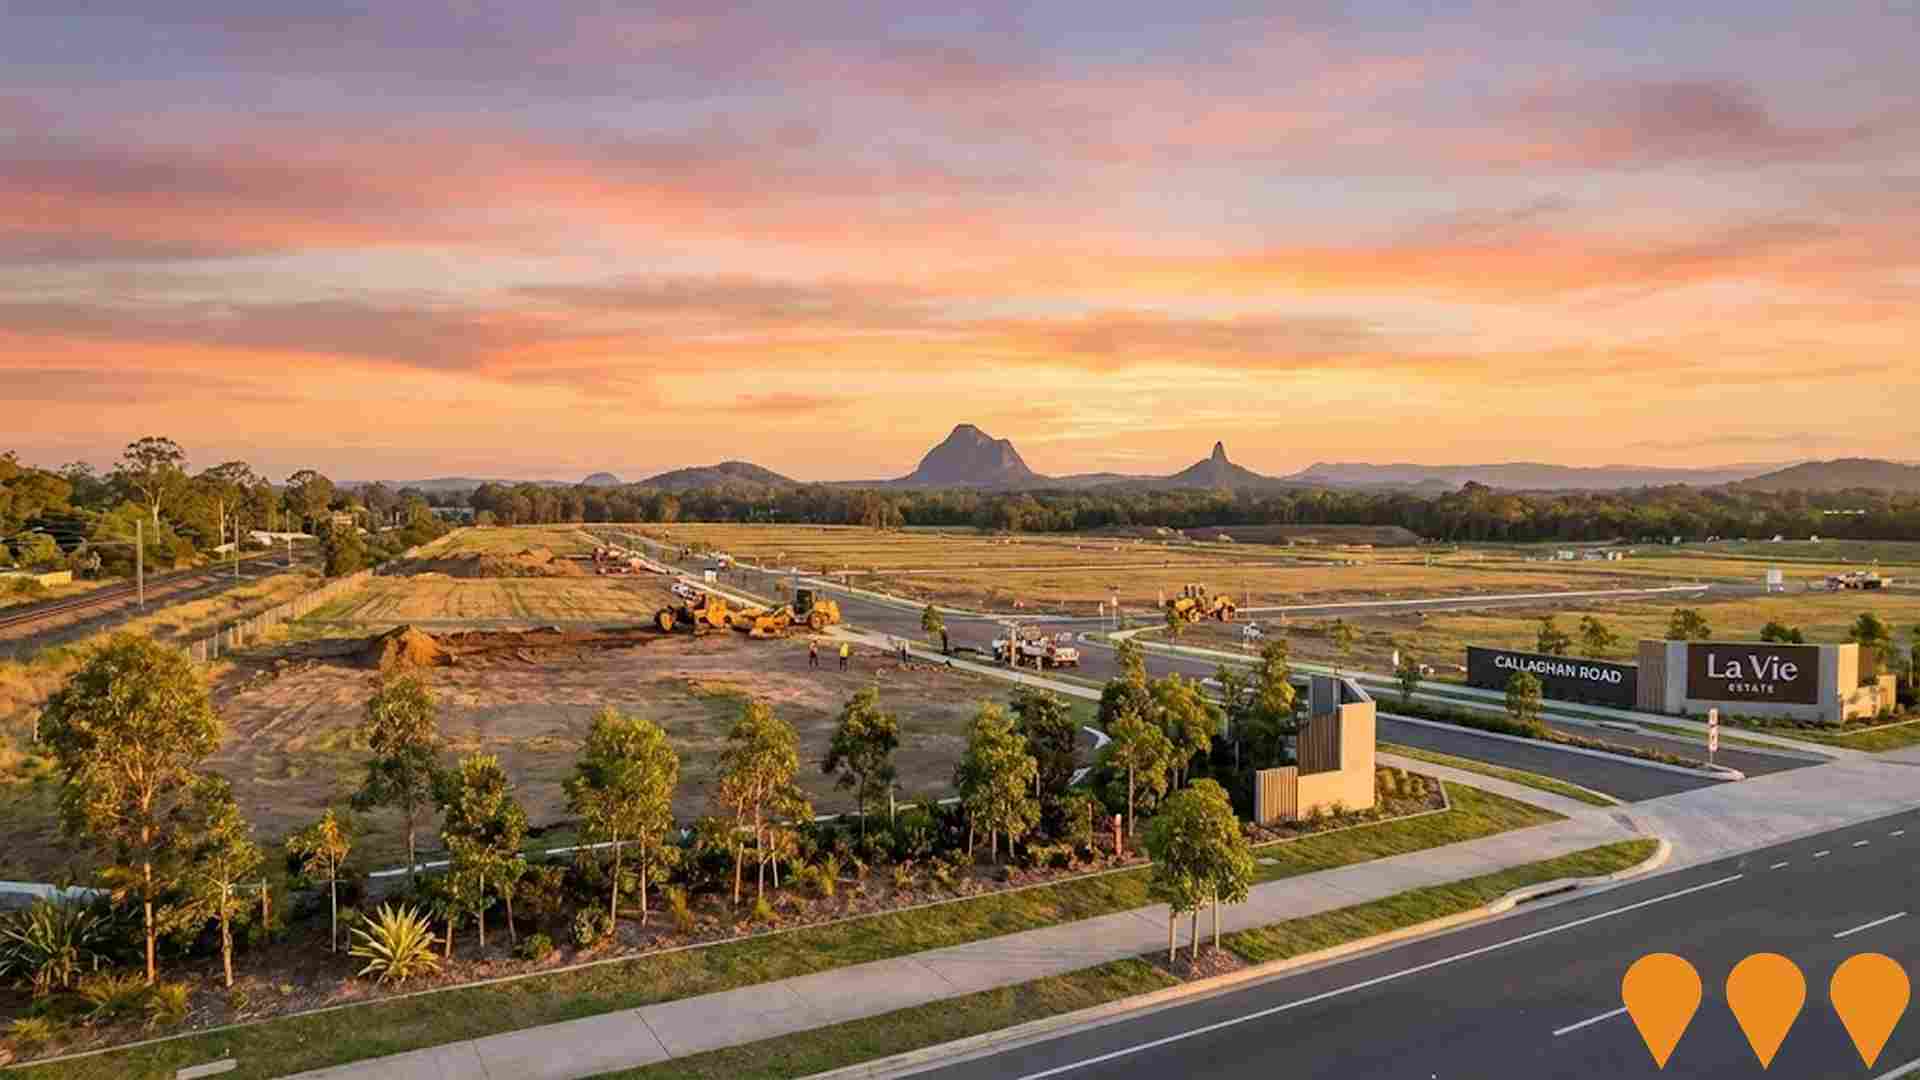
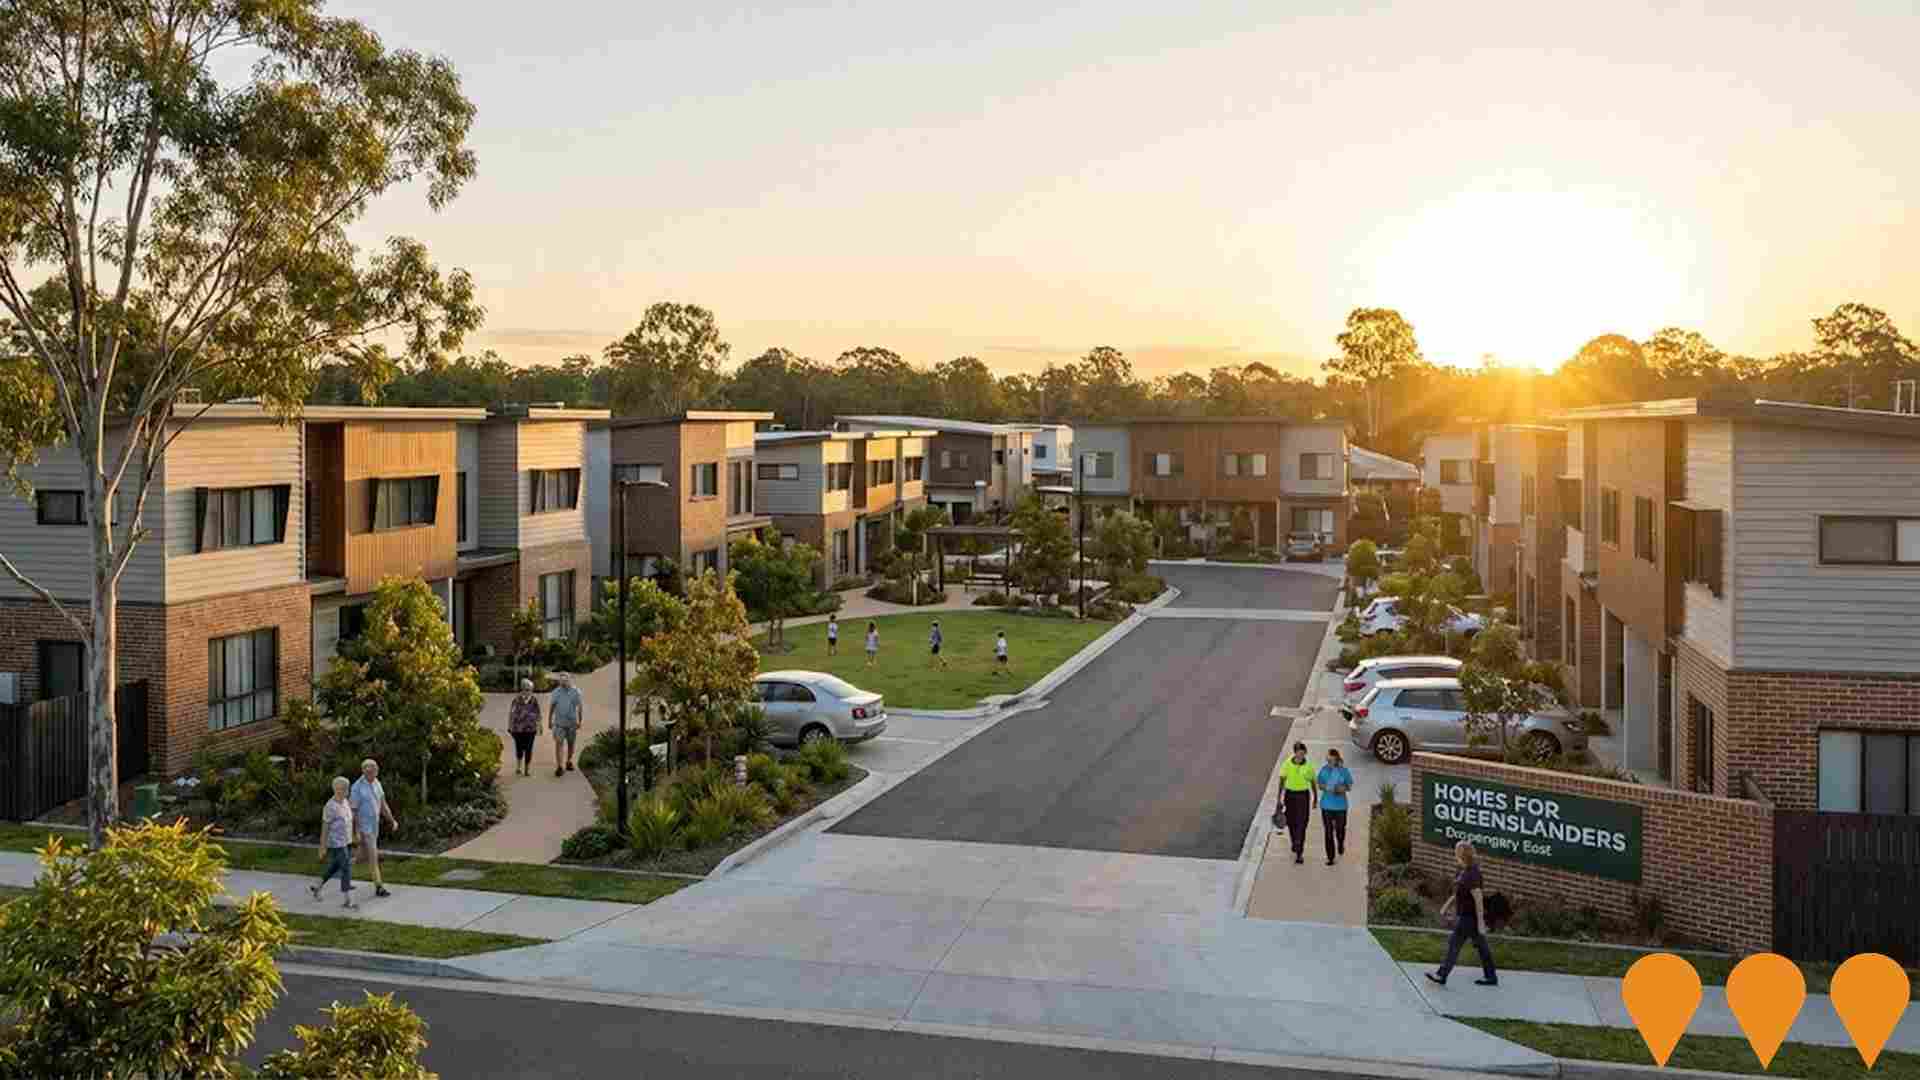
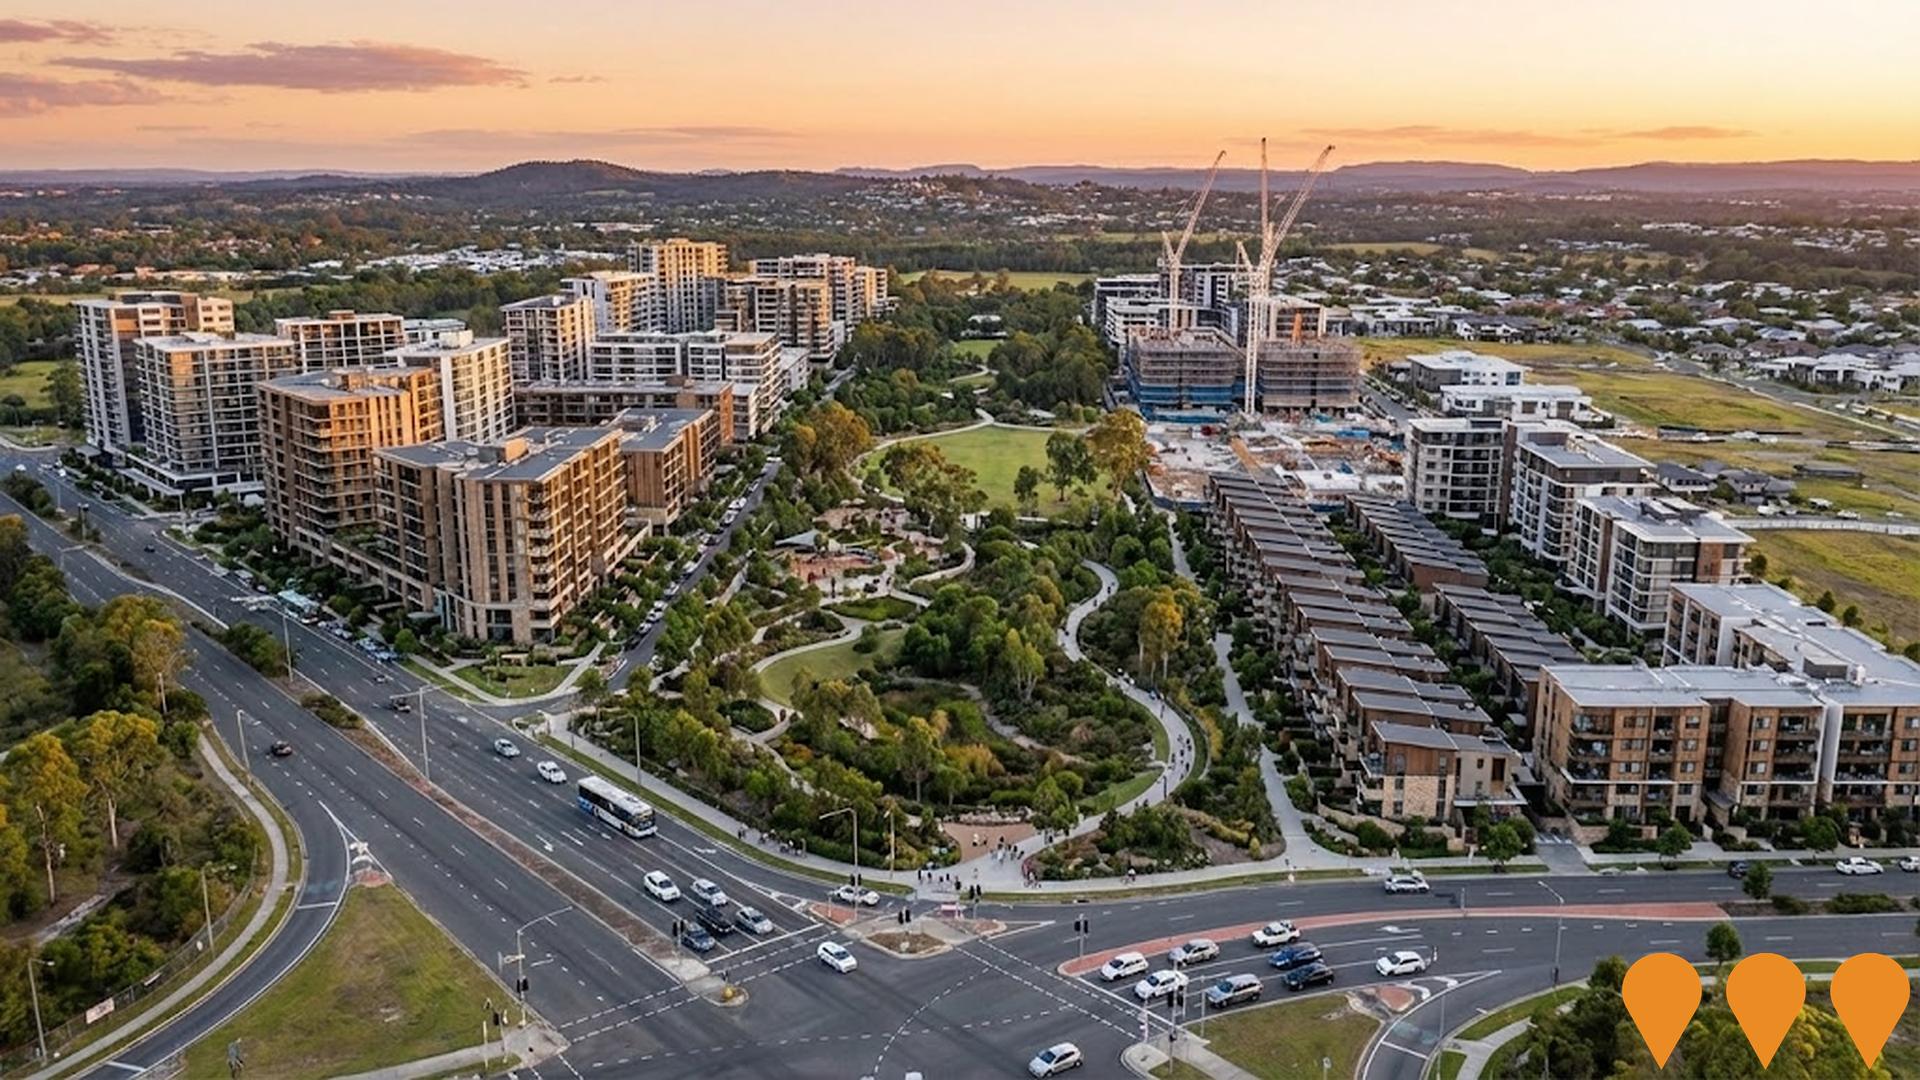
 Denotes AI-based impression for illustrative purposes only, not to be taken as definitive under any circumstances. Please follow links and conduct other investigations from the project's source for actual imagery. Developers and project owners wishing us to use original imagery please Contact Us and we will do so.
Frequently Asked Questions - Infrastructure
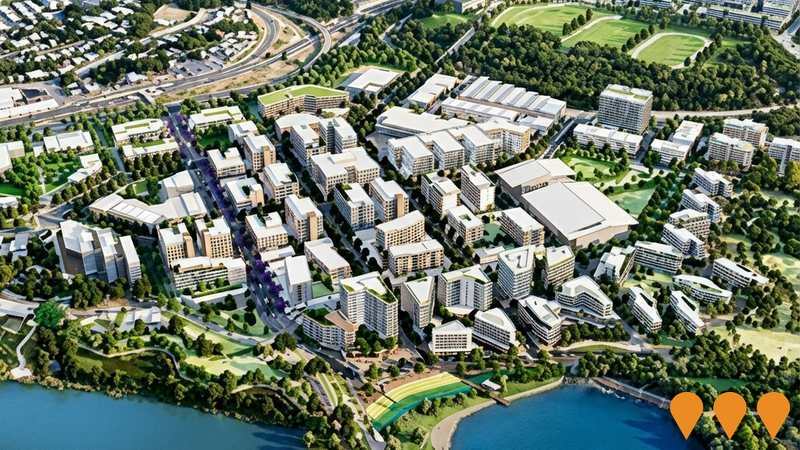
Moreton Bay Central (formerly The Mill at Moreton Bay)
Officially renamed 'Moreton Bay Central' in July 2025, this 460-hectare Priority Development Area (PDA) is anchored by the University of the Sunshine Coast (UniSC) Moreton Bay campus. The project features mixed-use precincts including health, retail, commercial, and residential areas targeting approximately 7,000 residents (approx. 3,000 dwellings), along with 110 hectares of conservation land and the rejuvenation of the Petrie Town Centre.
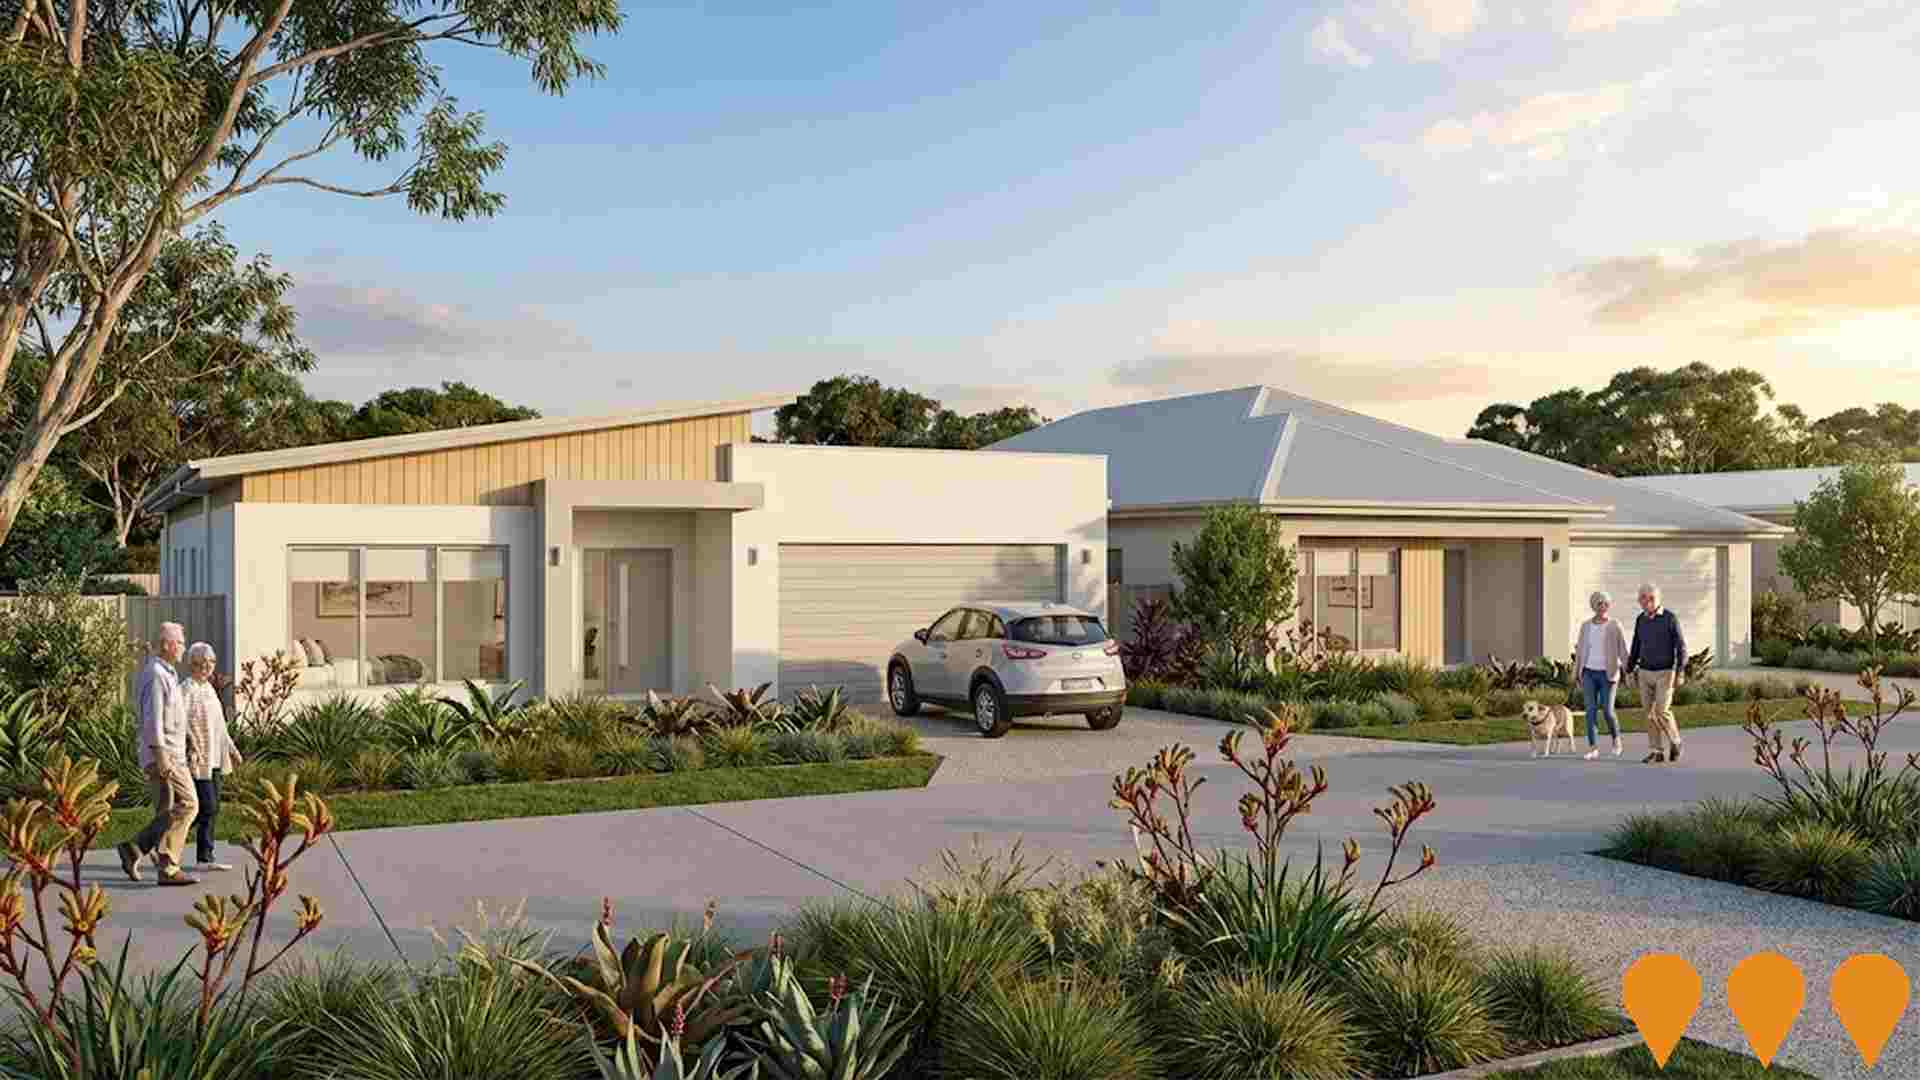
Vantage Lilywood by AVID Property Group
Vantage Lilywood is a boutique over-50s land lease community located in the Waraba growth corridor. It features 296 homes with resort-style amenities including a clubhouse, pool, gym, and cinema, offering a low-maintenance lifestyle with no entry/exit fees or stamp duty.
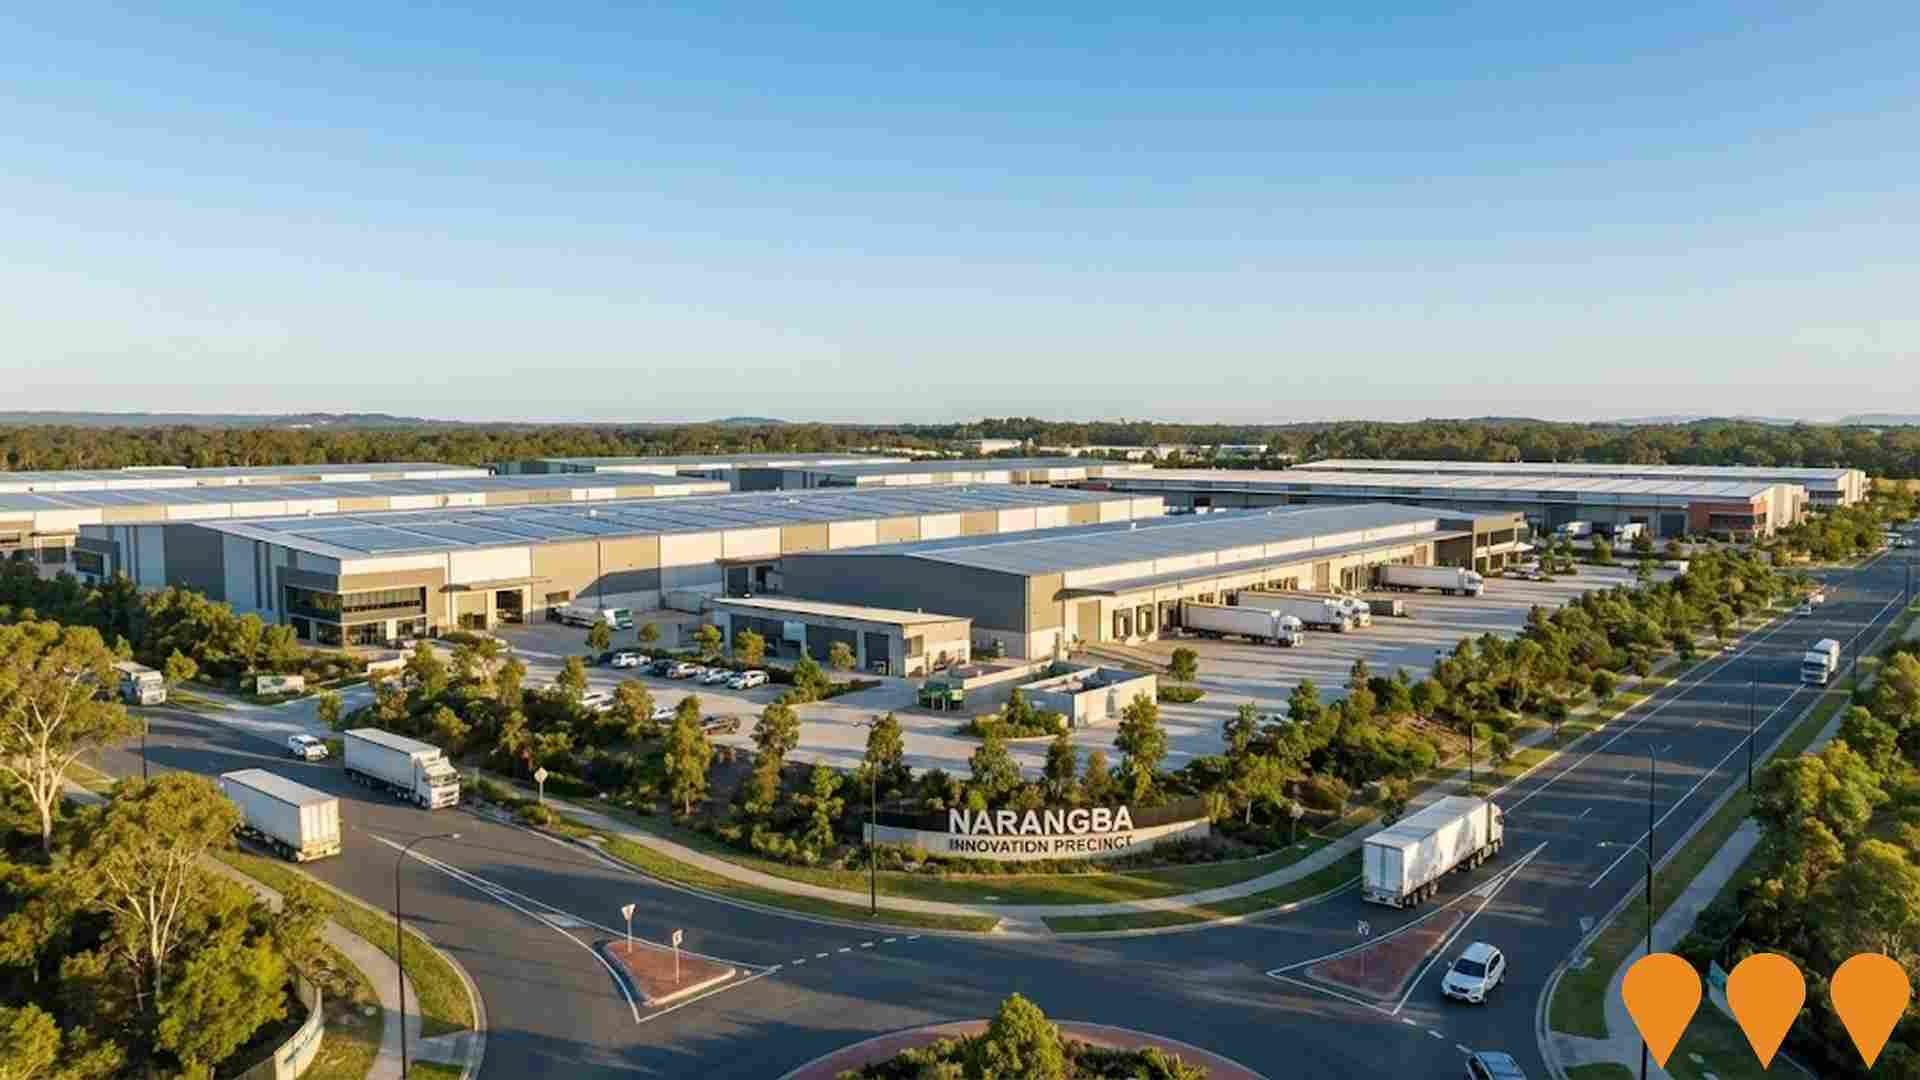
Narangba Innovation Precinct
A 1,000+ hectare enterprise and employment precinct in Narangba supporting high-impact and special industries, resource recovery, recycling, logistics and advanced manufacturing. The precinct is expected to create up to 8,000 jobs over the next 20-30 years. The planning scheme amendment was formally approved by the Queensland Government in December 2024, enabling development to proceed.
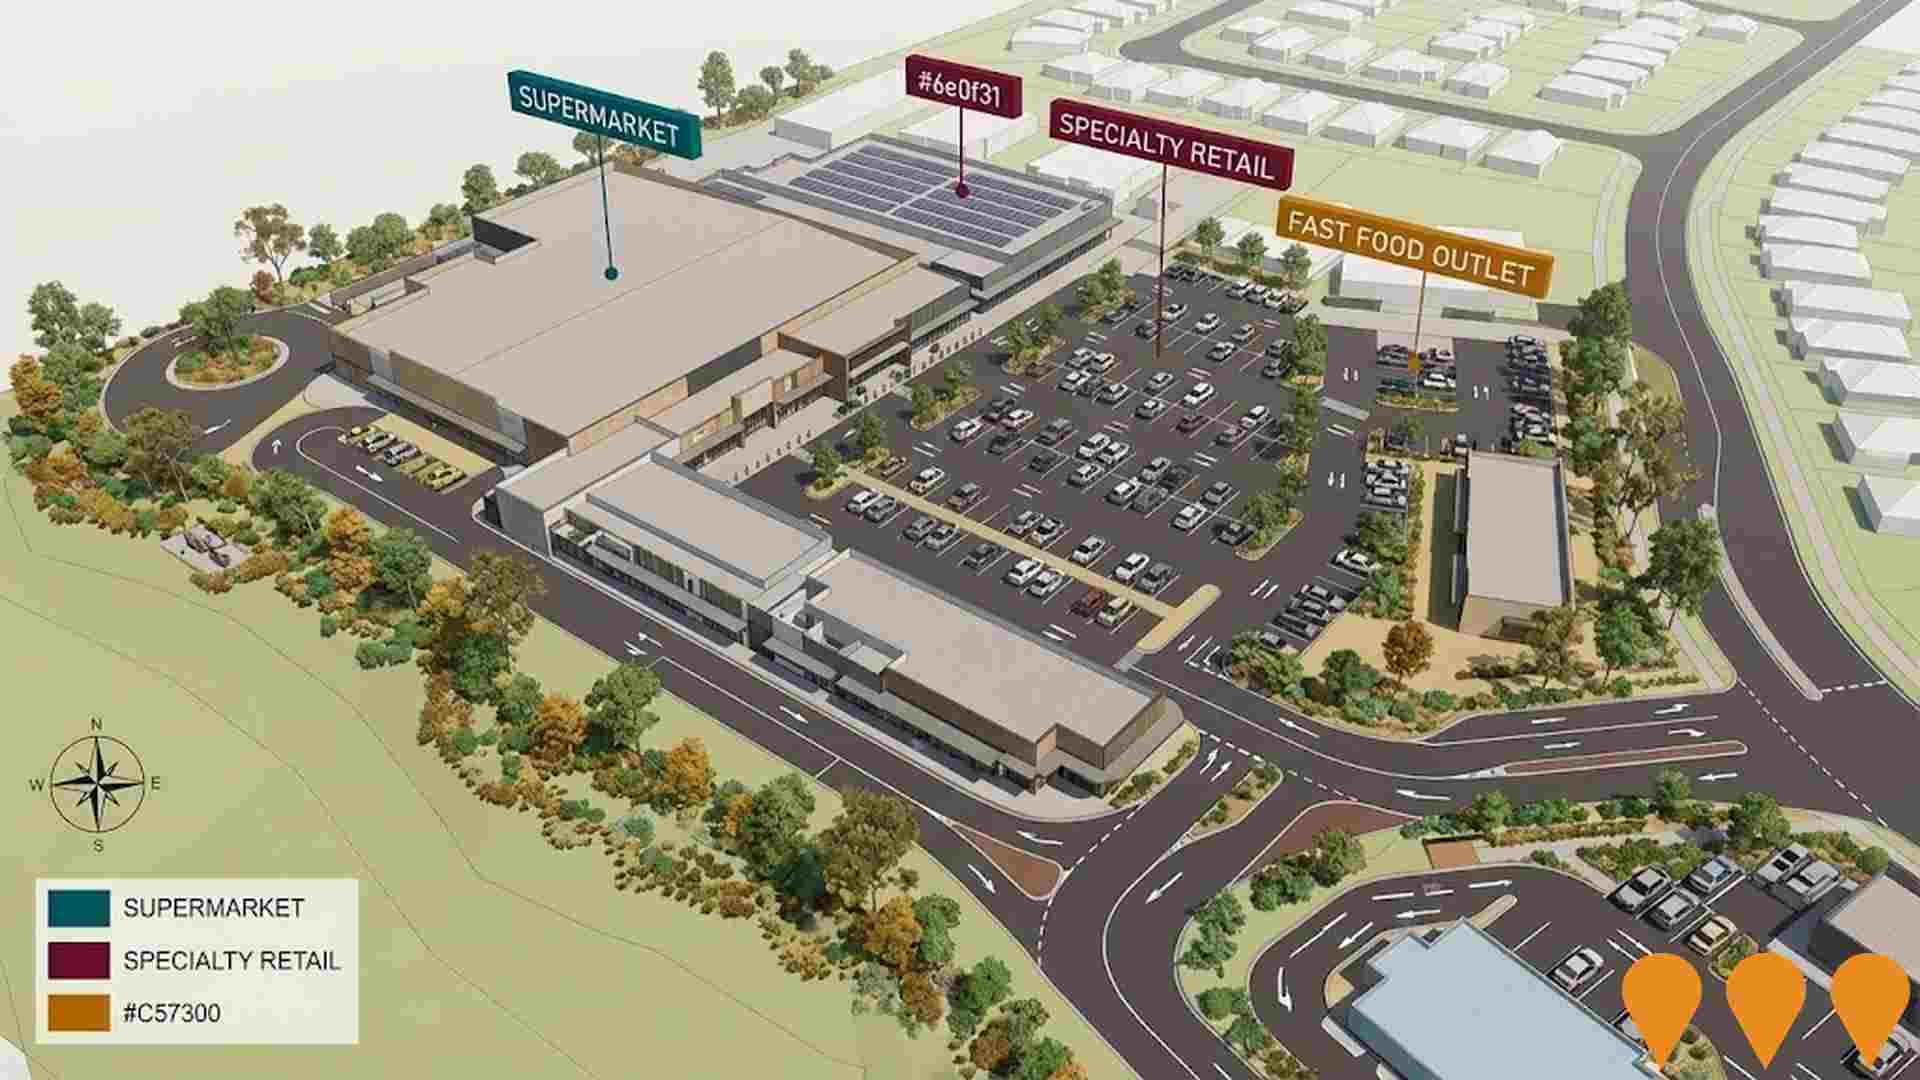
Narangba Central Shopping Centre
Proposed neighbourhood shopping centre comprising approximately 7,000 sqm with a full line supermarket and specialty retail tenants focusing on food, convenience, and service based uses. The project is currently being repositioned to suit the fast changing market in the region and commercial outcomes required by the client.
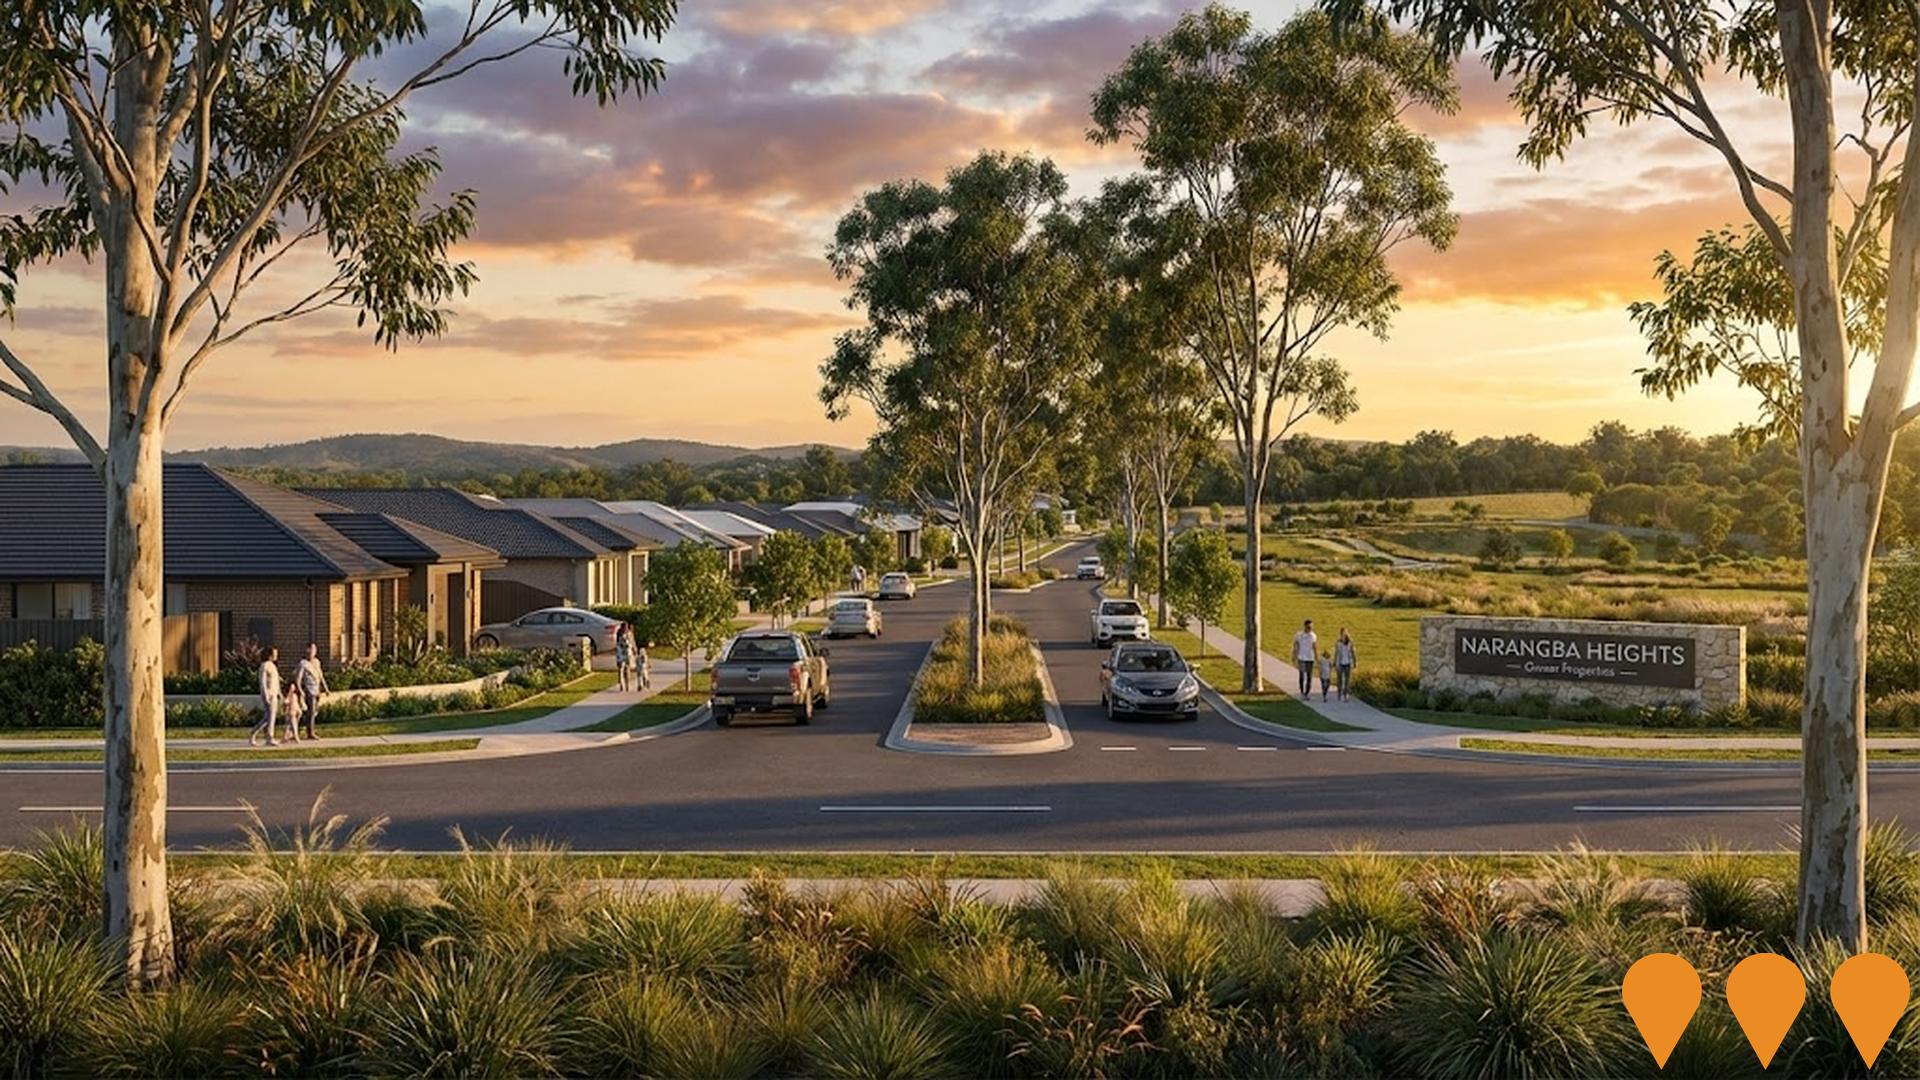
Narangba Heights Estate
Master-planned residential estate by Oxmar Properties featuring lots from 375m2 to 612m2, ultimately accommodating approximately 1,200 families. Located 34km from Brisbane CBD with over 50 acres of parkland, established community amenities, and a planned shopping center. The estate maintains 95% owner-occupier sales ensuring a family-focused community environment.
Narangba East Planning Investigation (RRIA)
The Narangba East Planning Investigation (Rural Residential Investigation Area - RRIA) is a multi-phase planning study by the City of Moreton Bay covering approximately 1020 ha (with a 445 ha Temporary Local Planning Instrument area) in the Narangba East region, spanning parts of Narangba, Burpengary and Dakabin. The investigation is determining long-term land use directions for future urban residential, enterprise and employment uses. A TLPI was adopted on 18 June 2025 (with State Government approval) to pause premature subdivisions and inconsistent urban development for up to two years while detailed planning and community engagement continue through mid-2026. Phase 1 (Land Use Feasibility Study) is complete; Phase 2 (integrated land use and infrastructure planning) is underway; Phase 3 will deliver a planning scheme amendment.
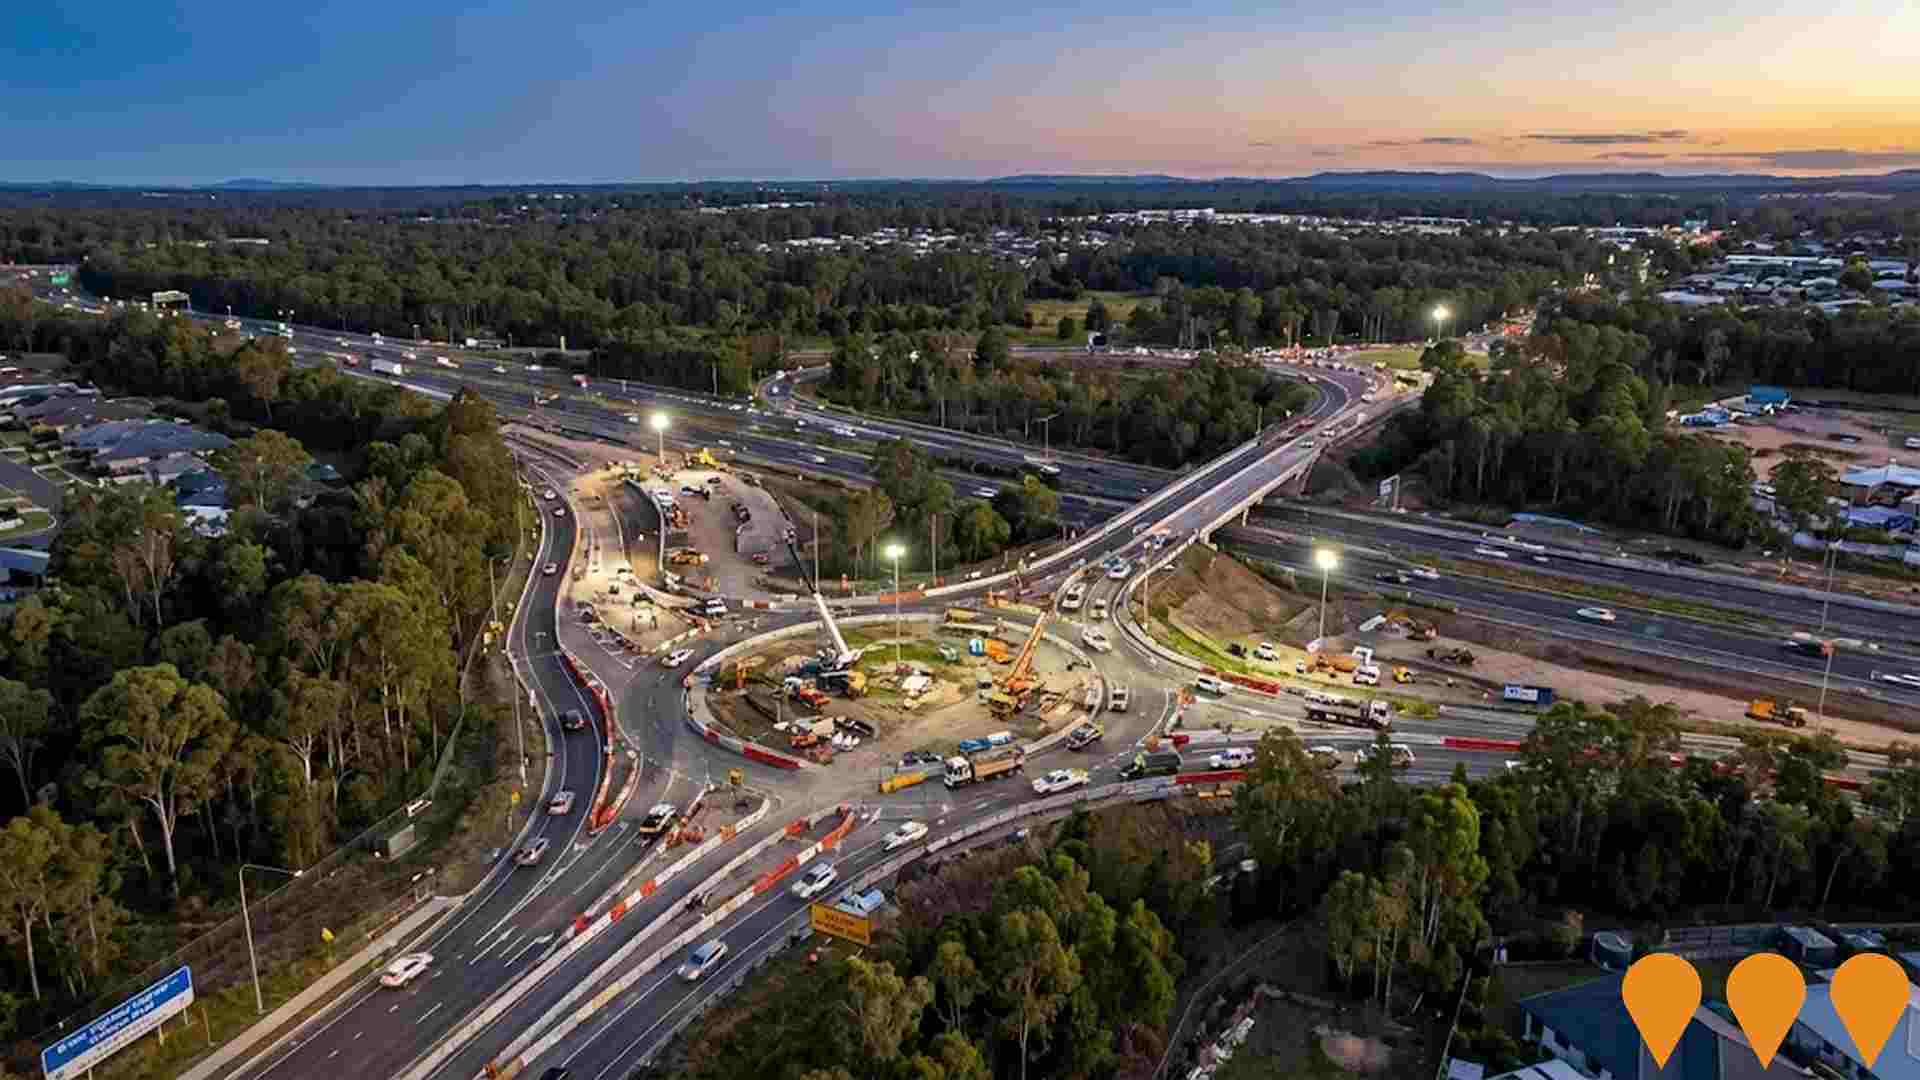
Bruce Highway Upgrade - Uhlmann Road to Buchanan Road
The project involves planning to upgrade the Bruce Highway from Uhlmann Road, Burpengary to Buchanan Road, Morayfield. The preferred option includes adding multi-lane, one-way collector-distributor roads on both sides of the highway to separate local trips from through traffic, upgrading the Uhlmann Road and Buchanan Road interchanges, and providing active transport facilities. Aims to meet future traffic growth, reduce congestion, improve efficiency, safety, and flood immunity.
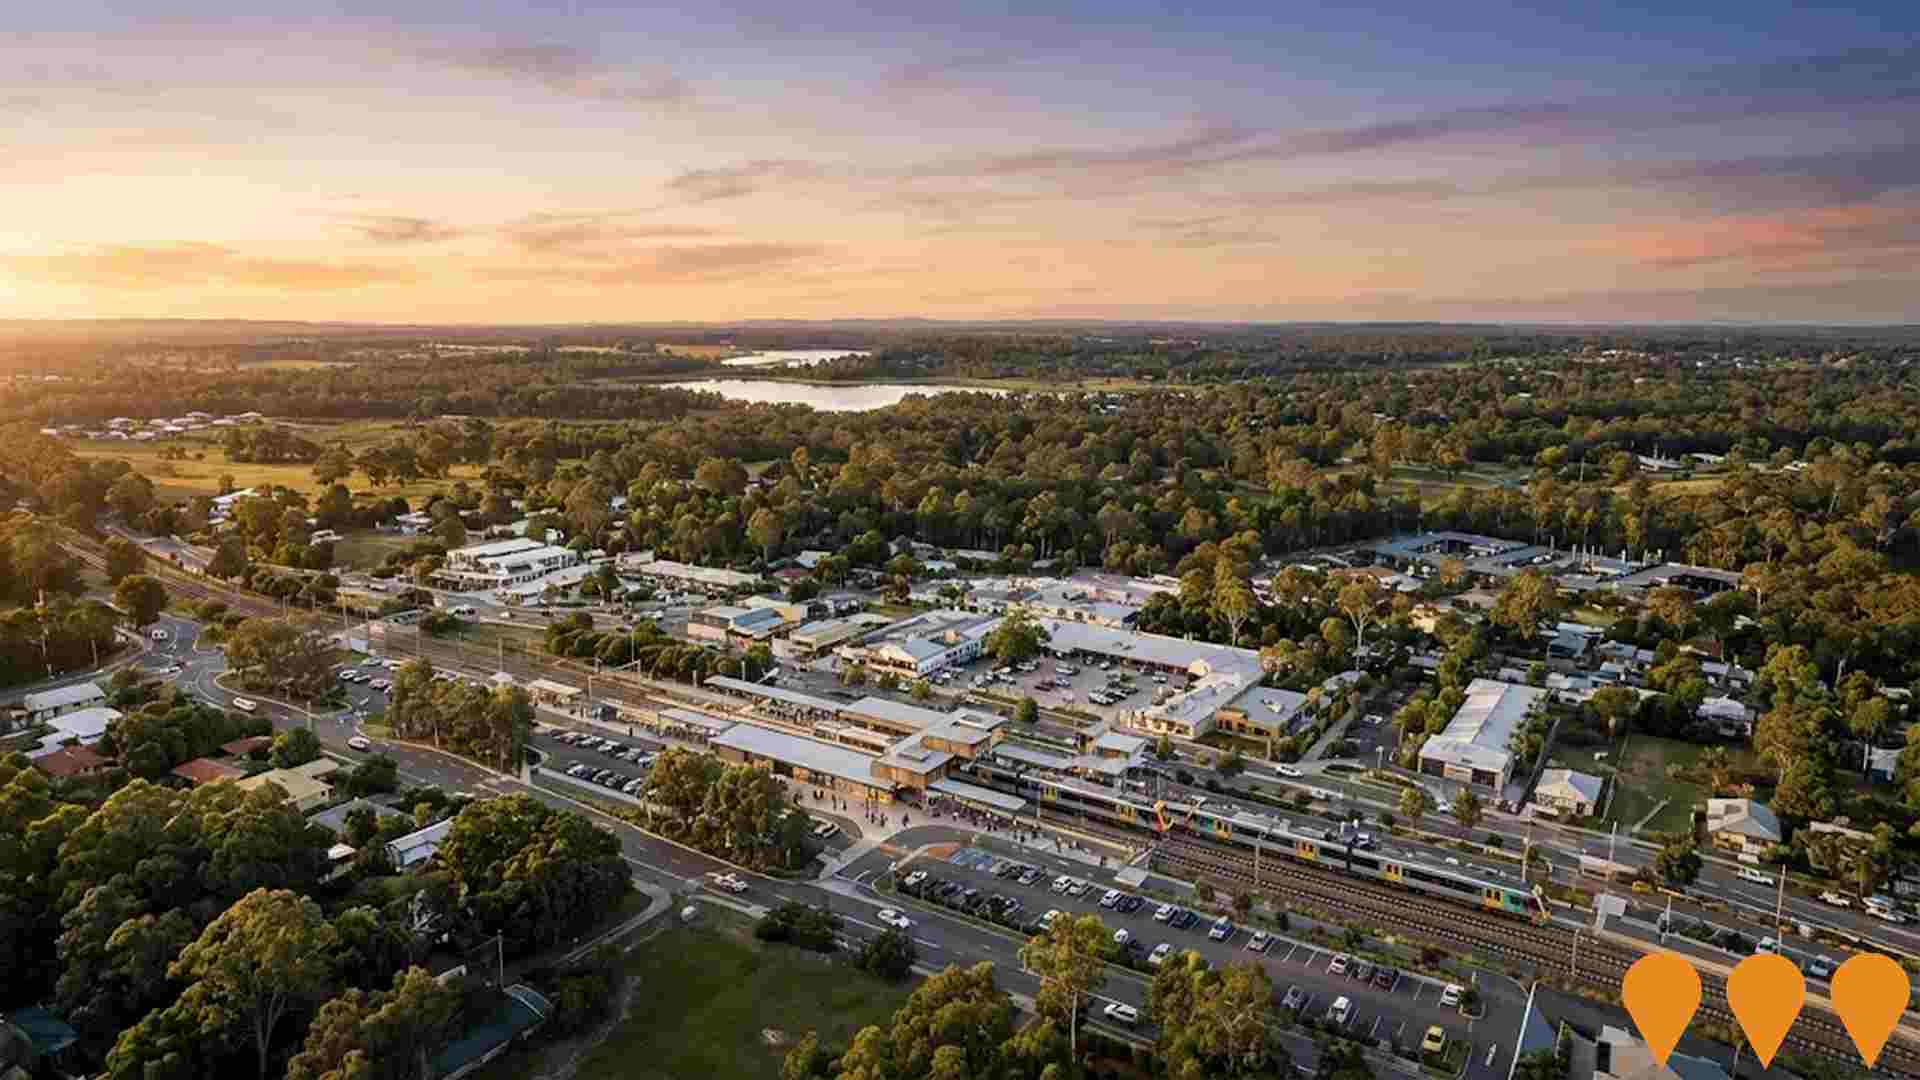
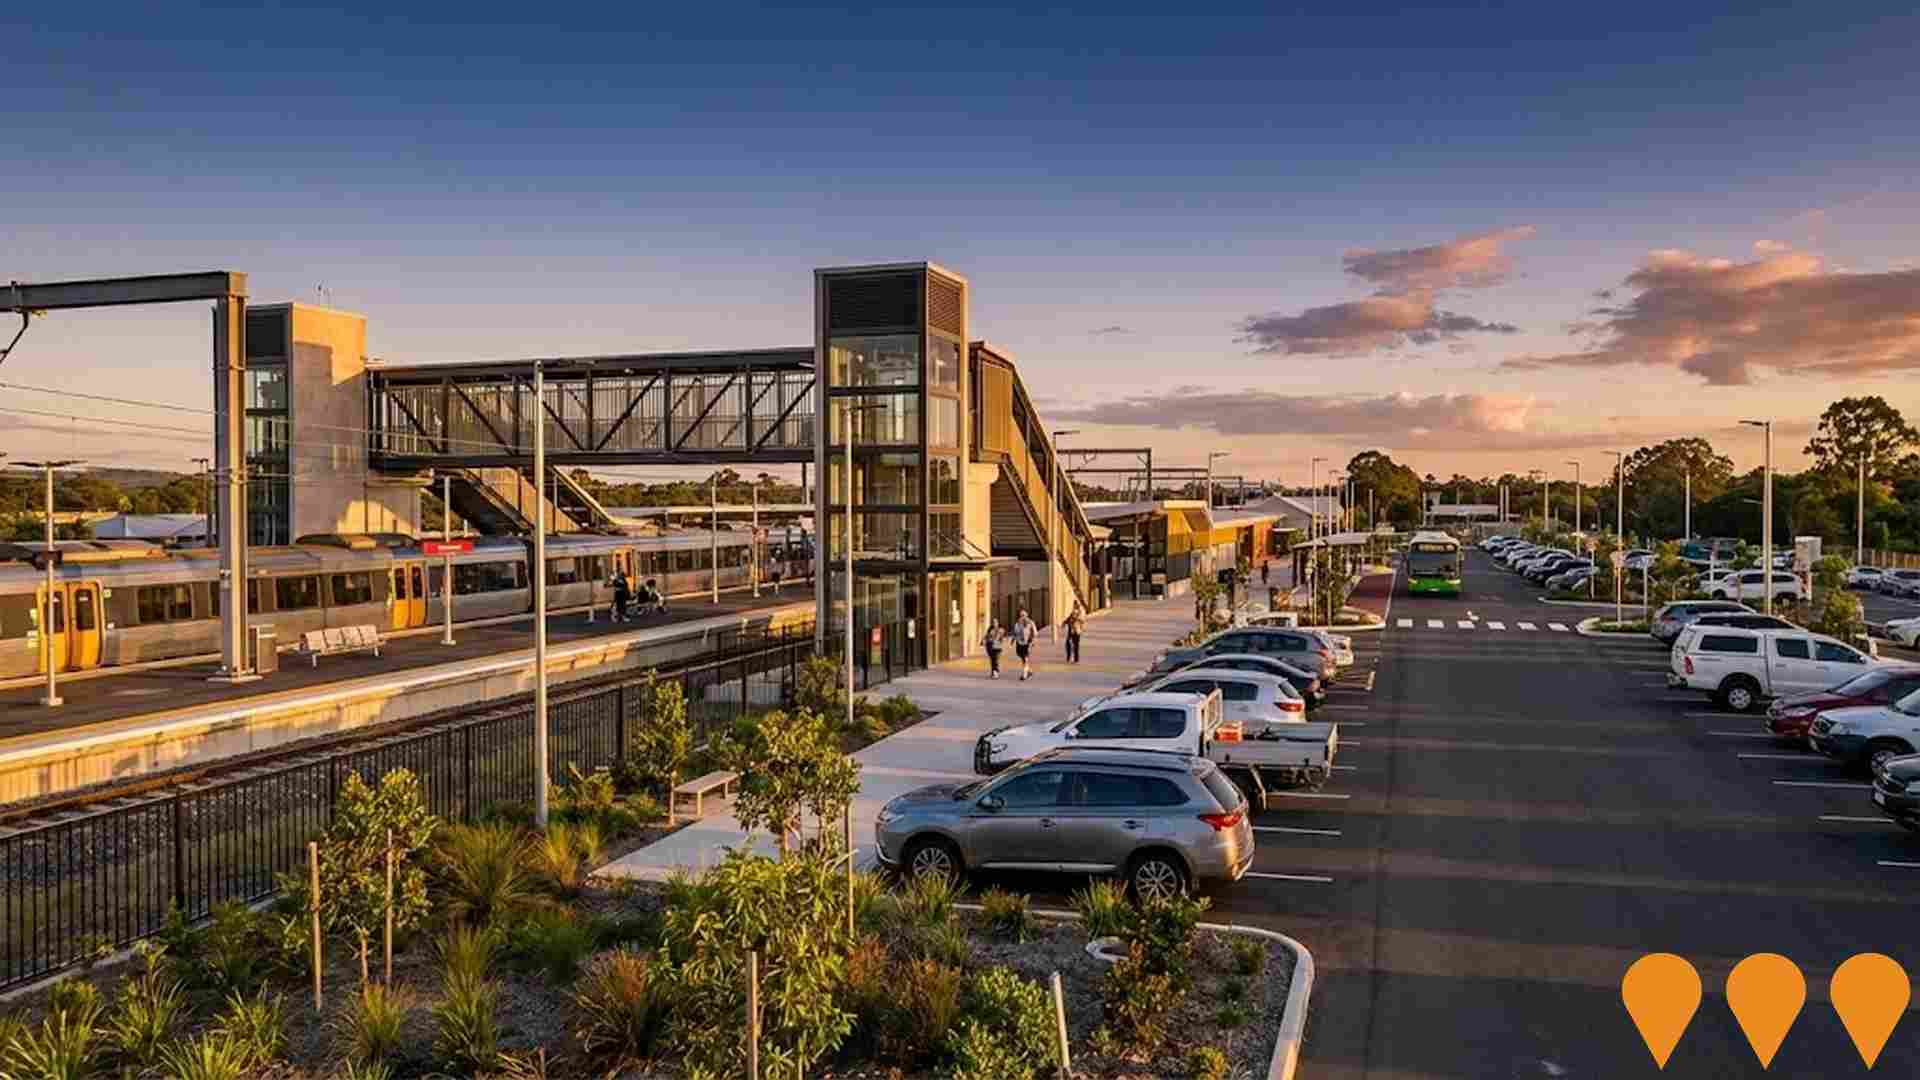
Burpengary Station Accessibility Upgrade
The Burpengary station accessibility upgrade, completed in September 2024, improves accessibility for all customers, including those with disabilities, prams, or luggage. Key features include a new footbridge with lift access, improved accessible parking, full-length high-level platforms, upgraded hearing augmentation loops and tactile ground surface indicators, upgraded CCTV security cameras and lighting, new wayfinding and platform signage, accessible toilets, accessible ticket windows, improved seating and extended platform shelters, a park n ride with space for almost 500 cars, and a 24-bicycle lock-up enclosure with new security swipe access.
Employment
AreaSearch analysis of employment trends sees Narangba performing better than 90% of local markets assessed across Australia
Narangba's skilled workforce has an unemployment rate of 1.7%. In the past year, estimated employment growth was 7.4%.
As of September 2025, 13,356 residents are employed, with an unemployment rate of 2.3%, below Greater Brisbane's rate of 4.0%. Workforce participation is high at 72.0%. Leading industries include health care & social assistance, construction, and retail trade. Construction shows strong specialization, with an employment share 1.4 times the regional level.
Conversely, professional & technical services are lower at 5.3% compared to the regional average of 8.9%. Employment opportunities locally may be limited due to a predominantly residential area. Over the past year, employment increased by 7.4%, labour force by 6.3%, reducing unemployment by 1.0 percentage points. In contrast, Greater Brisbane had employment growth of 3.8% and labour force growth of 3.3%. State-level data to 25-Nov-25 shows Queensland employment contracted by 0.01%, with an unemployment rate of 4.2%. National forecasts suggest overall employment will expand by 6.6% over five years and 13.7% over ten years. Applying these projections to Narangba's industry mix, local employment is expected to increase by 6.3% over five years and 13.2% over ten years.
Frequently Asked Questions - Employment
Income
The area exhibits notably strong income performance, ranking higher than 70% of areas assessed nationally through AreaSearch analysis
As per AreaSearch's latest postcode level ATO data released for financial year 2022, Narangba SA2's median income among taxpayers is $56,881. The average income is $64,629. This aligns with national averages. Greater Brisbane has a median income of $55,645 and an average of $70,520. Based on Wage Price Index growth of 13.99% since financial year 2022, estimated incomes for September 2025 would be approximately $64,839 (median) and $73,671 (average). According to 2021 Census figures, Narangba's household, family, and personal incomes rank at the 71st percentile nationally. Income distribution shows that 41.9% of locals (9,959 people) fall into the $1,500 - 2,999 category, similar to regional levels where 33.3% occupy this bracket. High housing costs consume 15.7% of income. Despite this, disposable income ranks at the 78th percentile. Narangba's SEIFA income ranking places it in the 6th decile.
Frequently Asked Questions - Income
Housing
Narangba is characterized by a predominantly suburban housing profile, with ownership patterns similar to the broader region
Narangba's dwelling structures, as per the latest Census, consisted of 96.1% houses and 3.9% other dwellings (semi-detached, apartments, 'other' dwellings), contrasting with Brisbane metro's 88.8% houses and 11.2% other dwellings. Home ownership in Narangba stood at 19.8%, with the rest being mortgaged (56.2%) or rented (23.9%). The median monthly mortgage repayment was $1,900, higher than Brisbane metro's average of $1,733, and the median weekly rent was $415, compared to Brisbane metro's $350. Nationally, Narangba's mortgage repayments were higher at $1,900 against the Australian average of $1,863, while rents were substantially above the national figure of $375.
Frequently Asked Questions - Housing
Household Composition
Narangba features high concentrations of family households, with a higher-than-average median household size
Family households comprise 87.1% of all households, including 47.9% couples with children, 24.6% couples without children, and 13.7% single parent families. Non-family households make up the remaining 12.9%, with lone person households at 11.1% and group households comprising 1.8%. The median household size is 3.1 people, larger than the Greater Brisbane average of 2.8.
Frequently Asked Questions - Households
Local Schools & Education
Educational attainment in Narangba aligns closely with national averages, showing typical qualification patterns and performance metrics
The area's university qualification rate is 17.7%, significantly lower than Greater Brisbane's average of 30.5%. Bachelor degrees are the most common at 12.8%, followed by postgraduate qualifications (2.5%) and graduate diplomas (2.4%). Vocational credentials are prevalent, with 44.4% of residents aged 15+ holding them - advanced diplomas at 12.8% and certificates at 31.6%. Educational participation is high, with 33.7% of residents currently enrolled in formal education.
This includes 12.8% in primary education, 11.1% in secondary education, and 4.3% pursuing tertiary education.
Frequently Asked Questions - Education
Schools Detail
Nearby Services & Amenities
Transport
Transport servicing is low compared to other areas nationally based on assessment of service frequency, route connectivity and accessibility
Narangba has 33 active public transport stops offering a mix of train and bus services. These stops are served by 52 individual routes, facilitating 2,134 weekly passenger trips in total. Transport accessibility is moderate, with residents on average located 495 meters from the nearest stop.
Service frequency averages 304 trips per day across all routes, translating to approximately 64 weekly trips per stop.
Frequently Asked Questions - Transport
Transport Stops Detail
Health
Narangba's residents are healthier than average in comparison to broader Australia with prevalence of common health conditions quite low among the general population though higher than the nation's average across older, at risk cohorts
Narangba residents show relatively positive health outcomes, with low prevalence of common conditions among the general population but higher rates among older, at-risk cohorts compared to national averages. Private health cover stands at approximately 52% of Narangba's total population (~12,336 people), slightly above Greater Brisbane's average of 49.3%.
Mental health issues and asthma are the most prevalent conditions, affecting 10.2 and 9.0% of residents respectively. Around 69.3% of residents report no medical ailments, compared to 63.7% in Greater Brisbane. Narangba has 11.1% of residents aged 65 and over (2,643 people), lower than Greater Brisbane's 17.3%. Health outcomes among seniors require more attention than the broader population.
Frequently Asked Questions - Health
Cultural Diversity
Narangba ranks below the Australian average when compared to other local markets across a number of language and cultural background related metrics
Narangba's population, surveyed in 2016, showed low cultural diversity with 80.7% born in Australia and 89.0% being citizens. English was spoken at home by 93.9%. Christianity was the predominant religion, at 46.3%.
The 'Other' religious category comprised 0.7%, slightly higher than Greater Brisbane's 0.6%. In terms of ancestry, Narangba's top groups were English (31.5%), Australian (29.6%), and Scottish (7.7%). Notably, New Zealanders made up 1.4% compared to the regional average of 1.3%, Maori were also at 1.2%, and South Africans at 0.7% versus the regional 0.5%.
Frequently Asked Questions - Diversity
Age
Narangba's young demographic places it in the bottom 15% of areas nationwide
Narangba's median age is 33 years, which is slightly younger than the Greater Brisbane average of 36 and significantly lower than the national average of 38 years. Compared to Greater Brisbane, Narangba has a higher proportion of residents aged 5-14 (16.7%) but fewer residents aged 25-34 (11.9%). According to post-2021 Census data, the 75-84 age group has increased from 2.7% to 3.7% of Narangba's population, while the 5-14 cohort has decreased from 18.0% to 16.7%. Demographic modeling indicates that Narangba's age profile will change significantly by 2041. The 45-54 age group is projected to grow by 34%, adding 1,177 residents to reach a total of 4,629. The 0-4 age group is expected to grow by 4%, with an increase of 66 residents.
