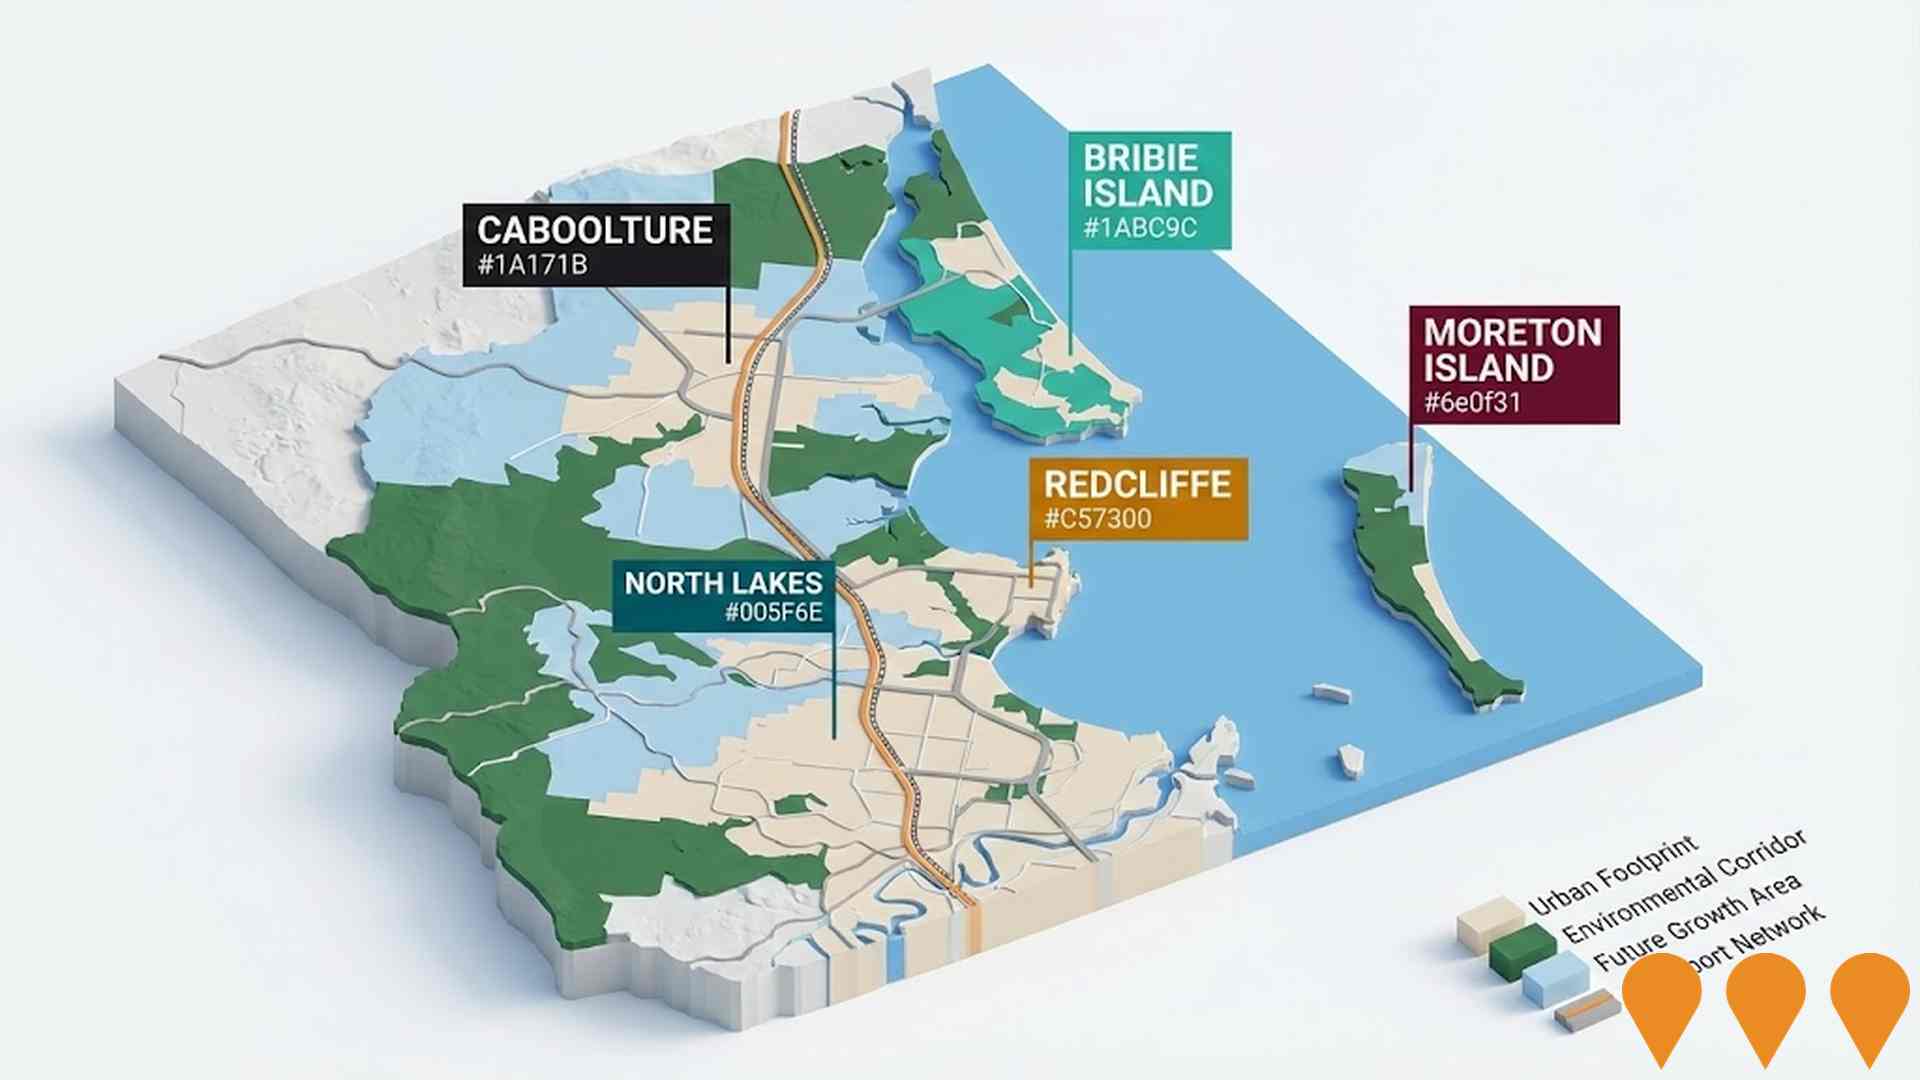
Chart Color Schemes
This analysis uses ABS Statistical Areas Level 2 (SA2) boundaries, which can materially differ from Suburbs and Localities (SAL) even when sharing similar names.
SA2 boundaries are defined by the Australian Bureau of Statistics and are designed to represent communities for statistical reporting (e.g., census and ERP).
Suburbs and Localities (SAL) represent commonly-used suburb/locality names (postal-style areas) and may use different geographic boundaries. For comprehensive analysis, consider reviewing both boundary types if available.
est. as @ -- *
ABS ERP | -- people | --
2021 Census | -- people
Sales Activity
Curious about local property values? Filter the chart to assess the volume and appreciation (including resales) trends and regional comparisons, or scroll to the map below view this information at an individual property level.
Find a Recent Sale
Sales Detail
Population
Population growth drivers in Dayboro are strong compared to national averages based on AreaSearch's ranking of recent, and medium to long-term trends
Dayboro's population, as of November 2025, is approximately 10,019 people. This figure represents an increase of 806 individuals since the 2021 Census, which recorded a population of 9,213. The growth was inferred from the estimated resident population of 9,956 in June 2024 and an additional 85 validated new addresses post-Census. This results in a population density ratio of 24 persons per square kilometer. Dayboro's 8.7% growth since the 2021 Census exceeded the SA3 area average of 7.4%, indicating it as a region with significant growth. Interstate migration was the primary driver, contributing around 64.4% of overall population gains.
AreaSearch uses ABS/Geoscience Australia projections for each SA2 area, released in 2024 using 2022 as the base year. For areas not covered and years post-2032, Queensland State Government's SA2 area projections are adopted, released in 2023 with a 2021 data base. Age category splits are applied proportionally based on ABS Greater Capital Region projections released in 2023 using 2022 data. By 2041, Dayboro is projected to have an above median population growth of statistical areas analysed by AreaSearch, with an expected expansion of 1,579 persons, reflecting a total increase of 15.1% over the seventeen-year period.
Frequently Asked Questions - Population
Development
AreaSearch assessment of residential approval activity sees Dayboro among the top 30% of areas assessed nationwide
Dayboro has received approximately 50 dwelling approvals annually over the past five financial years, totaling around 250 homes. As of FY-26, 19 approvals have been recorded. On average, 3.5 new residents arrive per year for each dwelling constructed between FY-21 and FY-25. This indicates a significant gap between supply and demand, potentially leading to increased buyer competition and pricing pressures.
The average construction cost of new homes is $285,000. In this financial year, there have been $2.2 million in commercial approvals, reflecting the area's residential focus. Compared to Greater Brisbane, Dayboro has slightly more development activity, with 26.0% above the regional average per person over the past five years.
However, building activity has slowed in recent years. Recent construction comprises 96.0% standalone homes and 4.0% townhouses or apartments, maintaining the area's low-density character and attracting space-seeking buyers. With around 271 people per dwelling approval, Dayboro displays a developing market. According to AreaSearch's latest quarterly estimate, Dayboro is projected to add approximately 1,516 residents by 2041. If current construction levels continue, housing supply should meet demand adequately, creating favorable conditions for buyers and potentially exceeding current forecast growth.
Frequently Asked Questions - Development
Infrastructure
Dayboro has moderate levels of nearby infrastructure activity, ranking in the 47thth percentile nationally
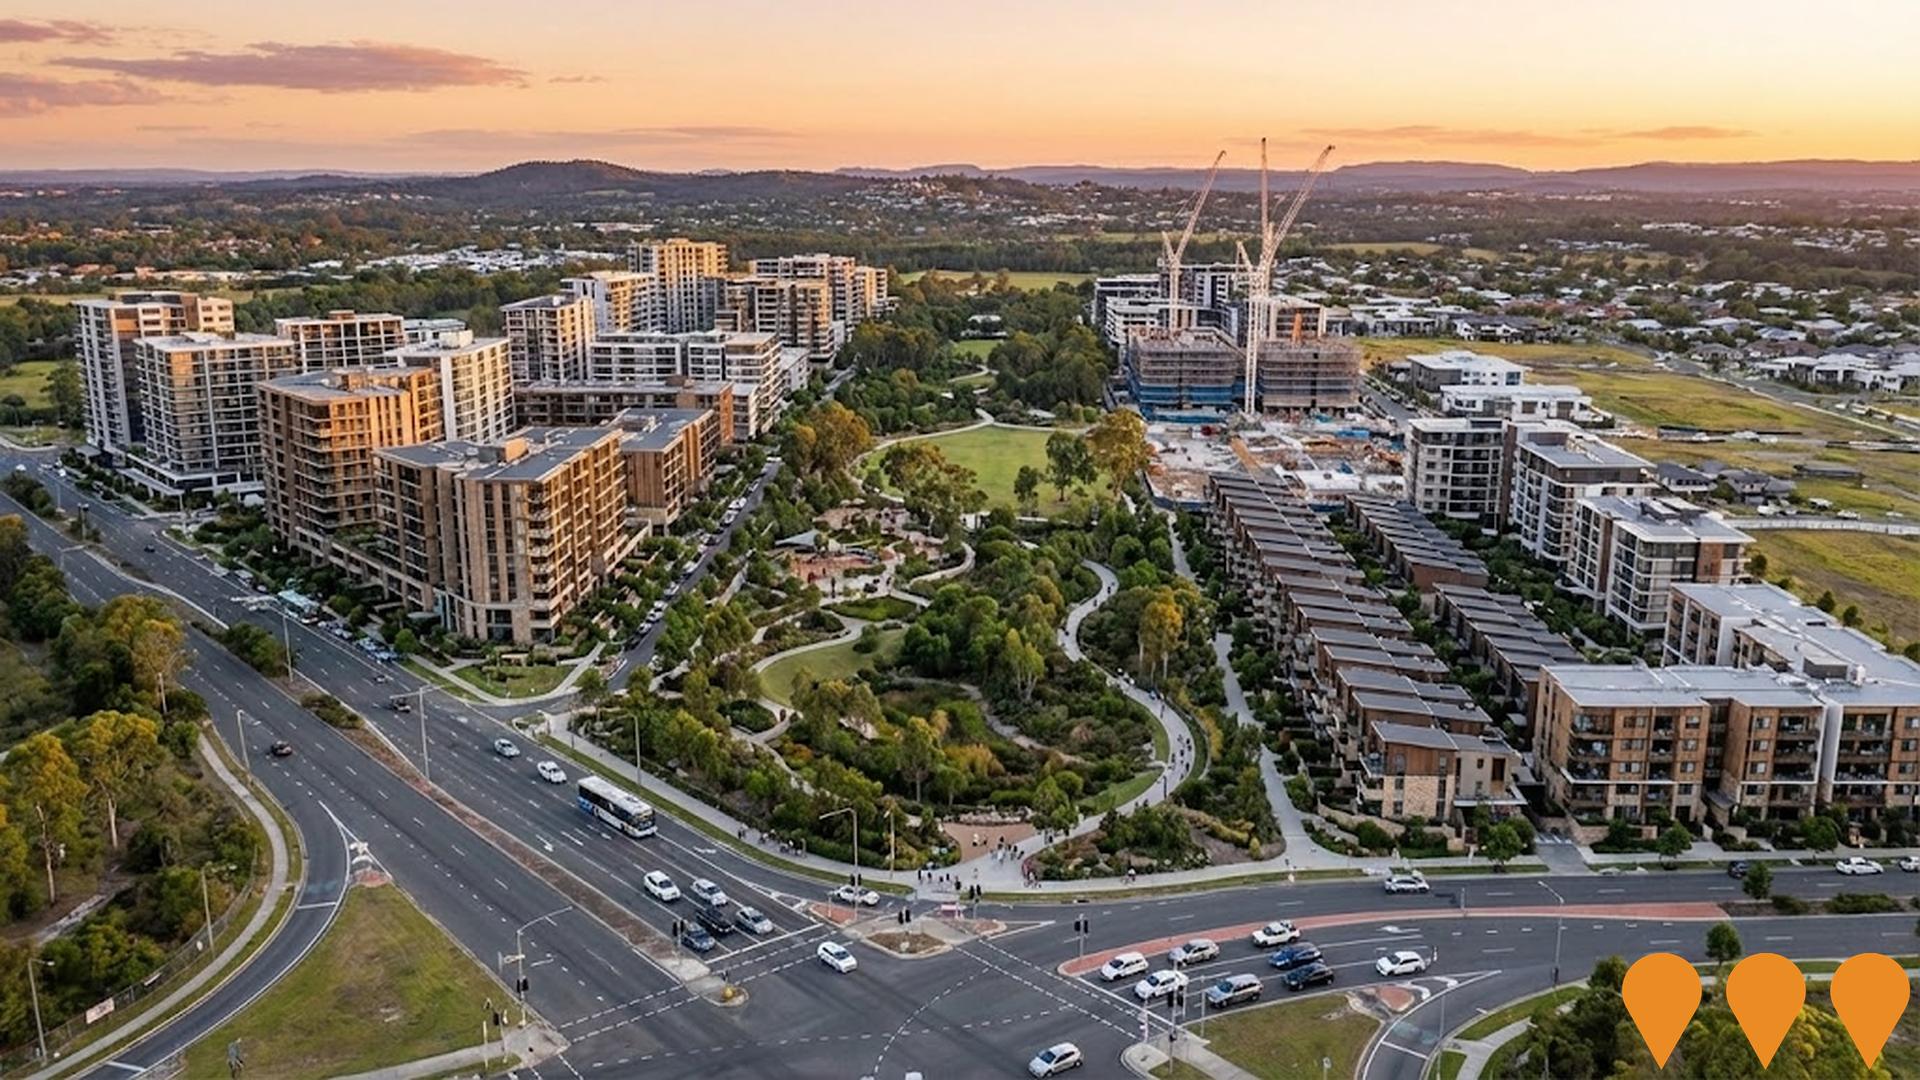
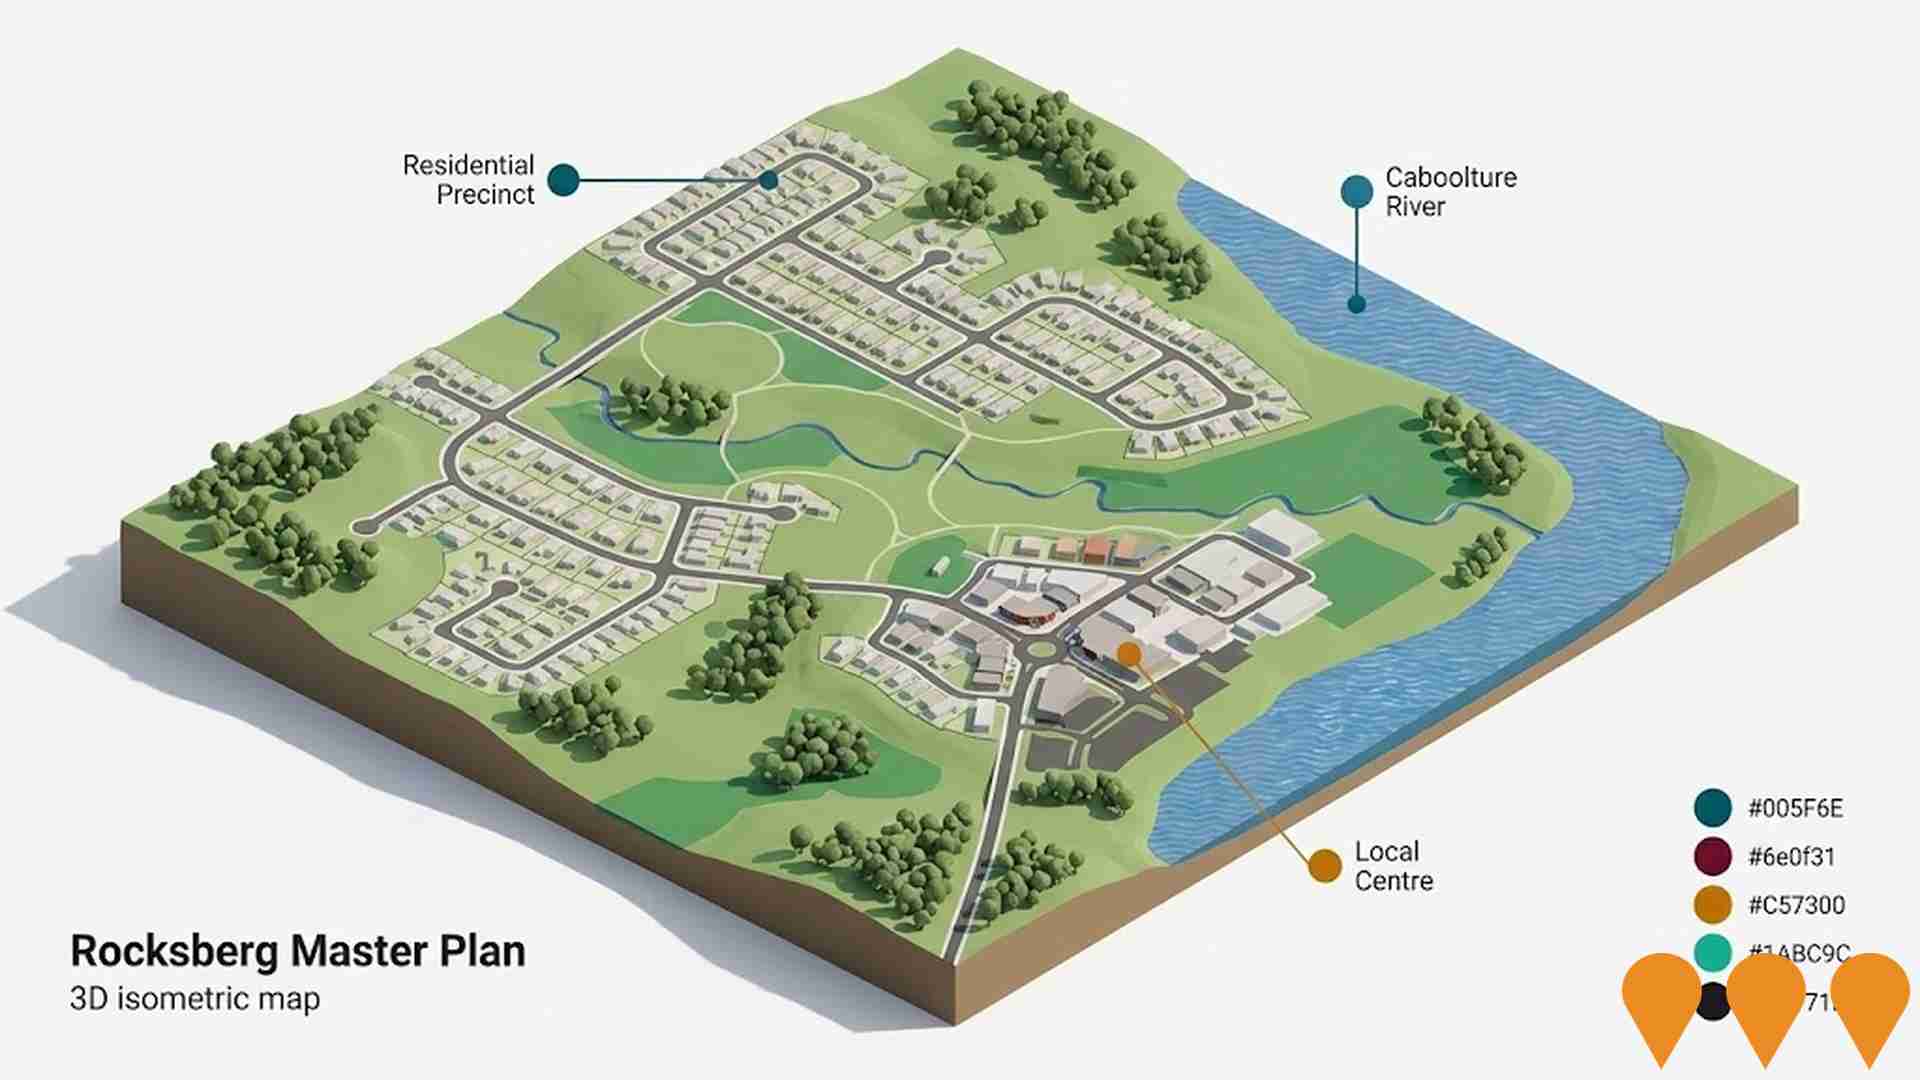
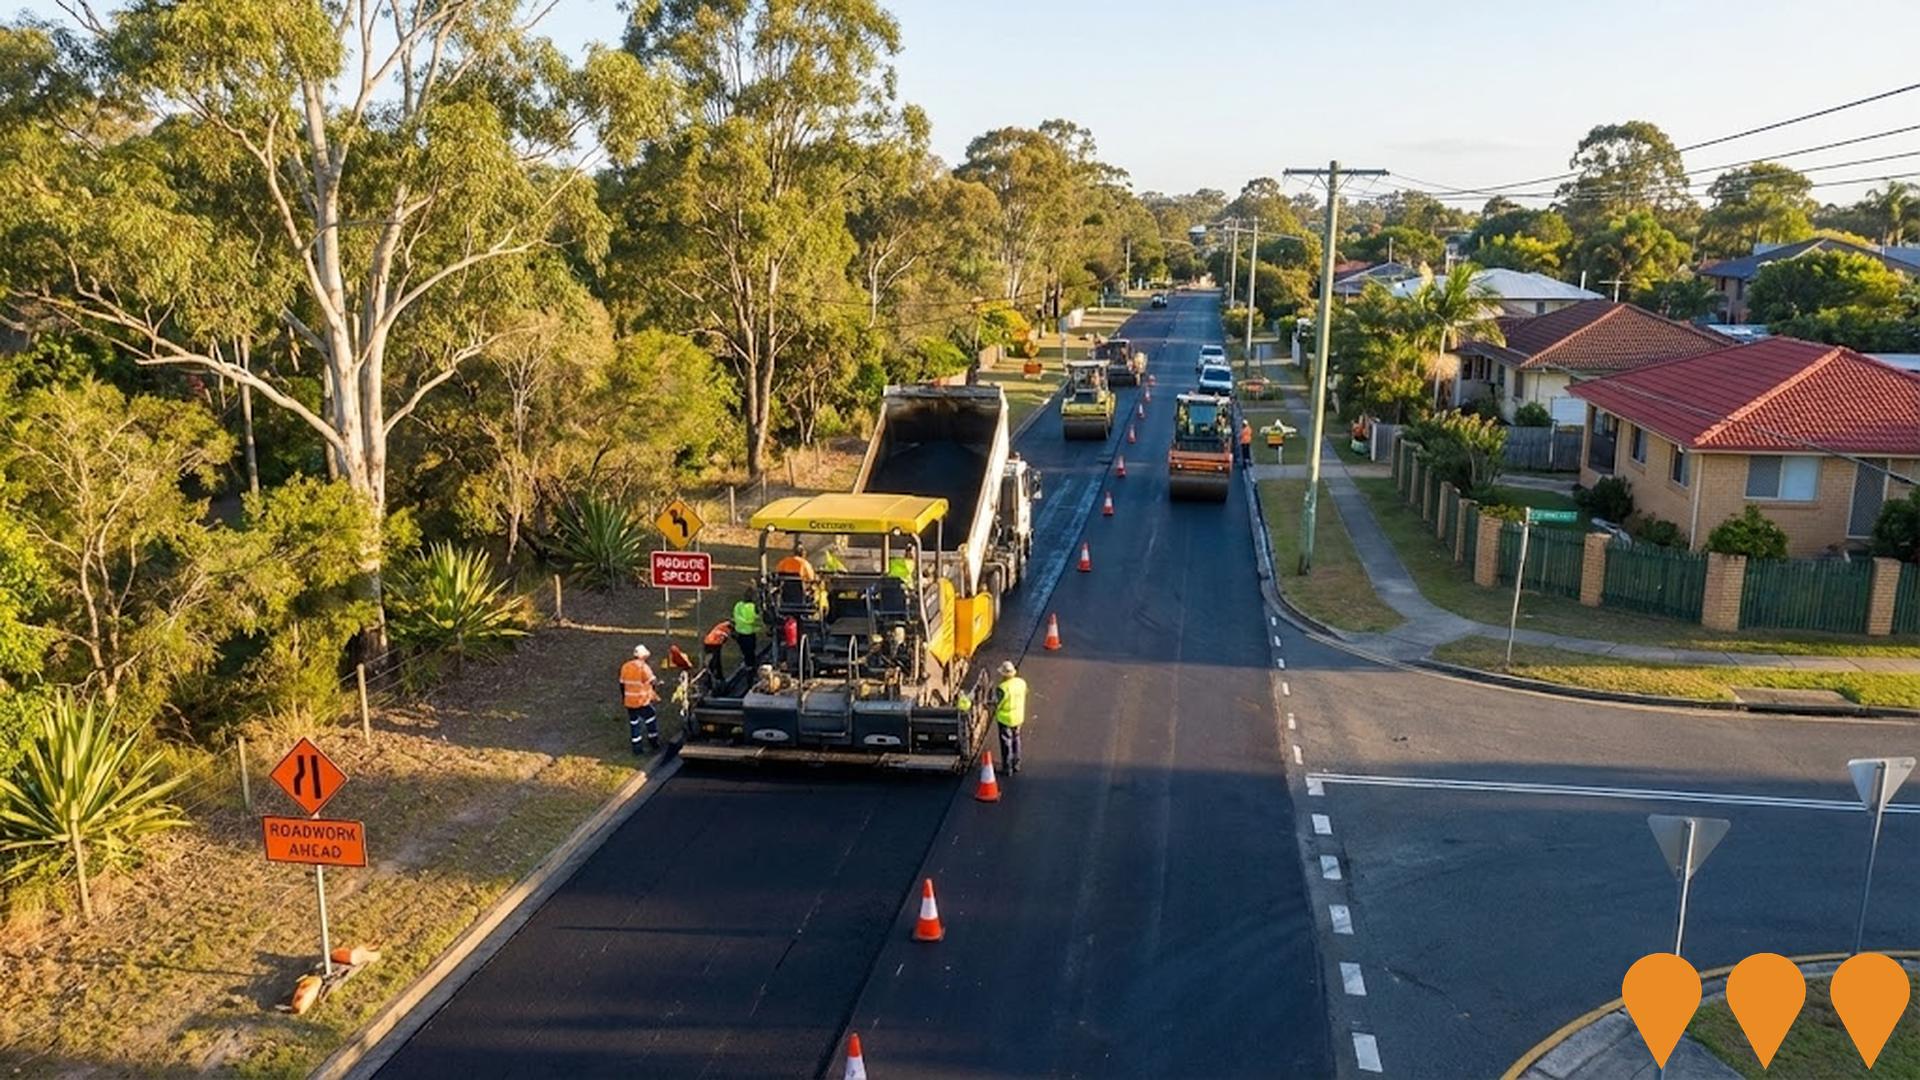
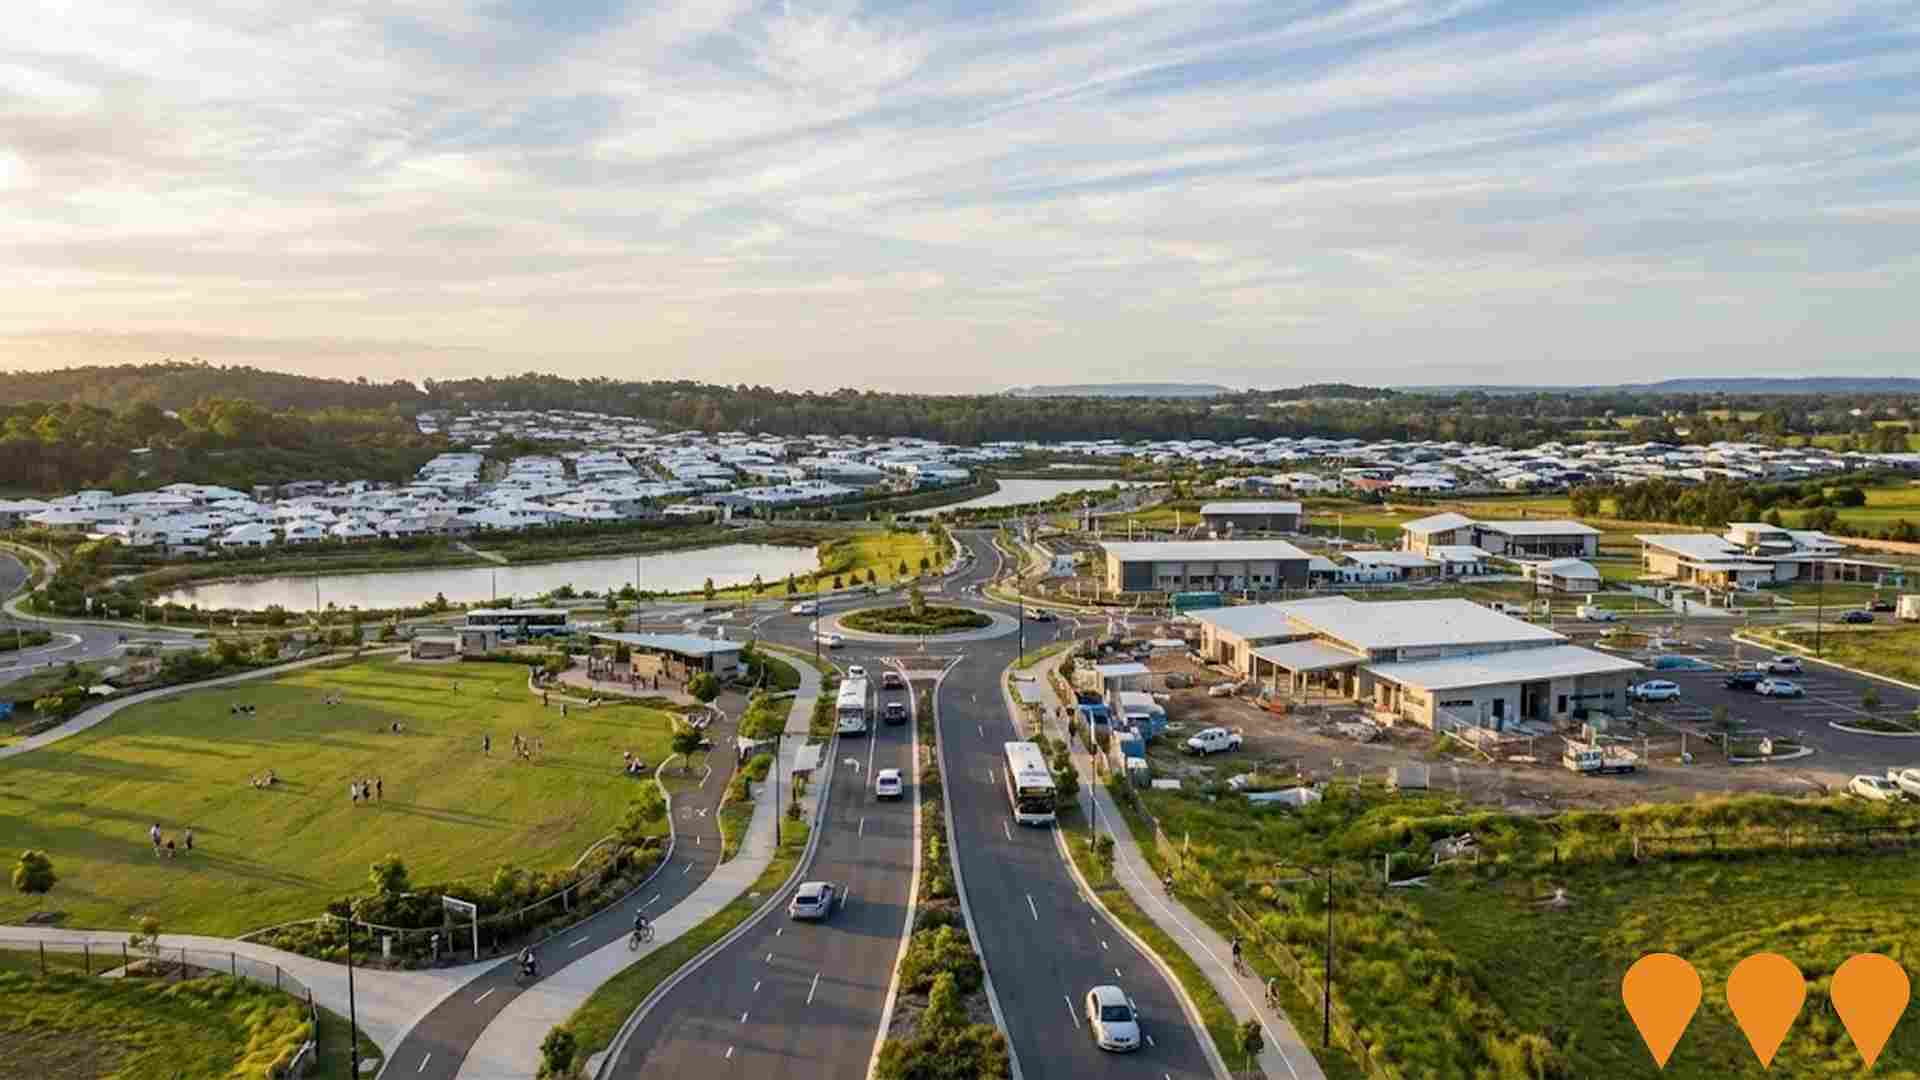
A total of 156 projects have been identified by AreaSearch as potentially impacting the area. These include notable developments such as Kurwongbah Winery and Wellness Retreat, Narangba Heights Shopping Centre, Kinma Valley, and Vantage Lilywood by AVID Property Group. The following list details those considered most relevant.
Professional plan users can use the search below to filter and access additional projects.
INFRASTRUCTURE SEARCH
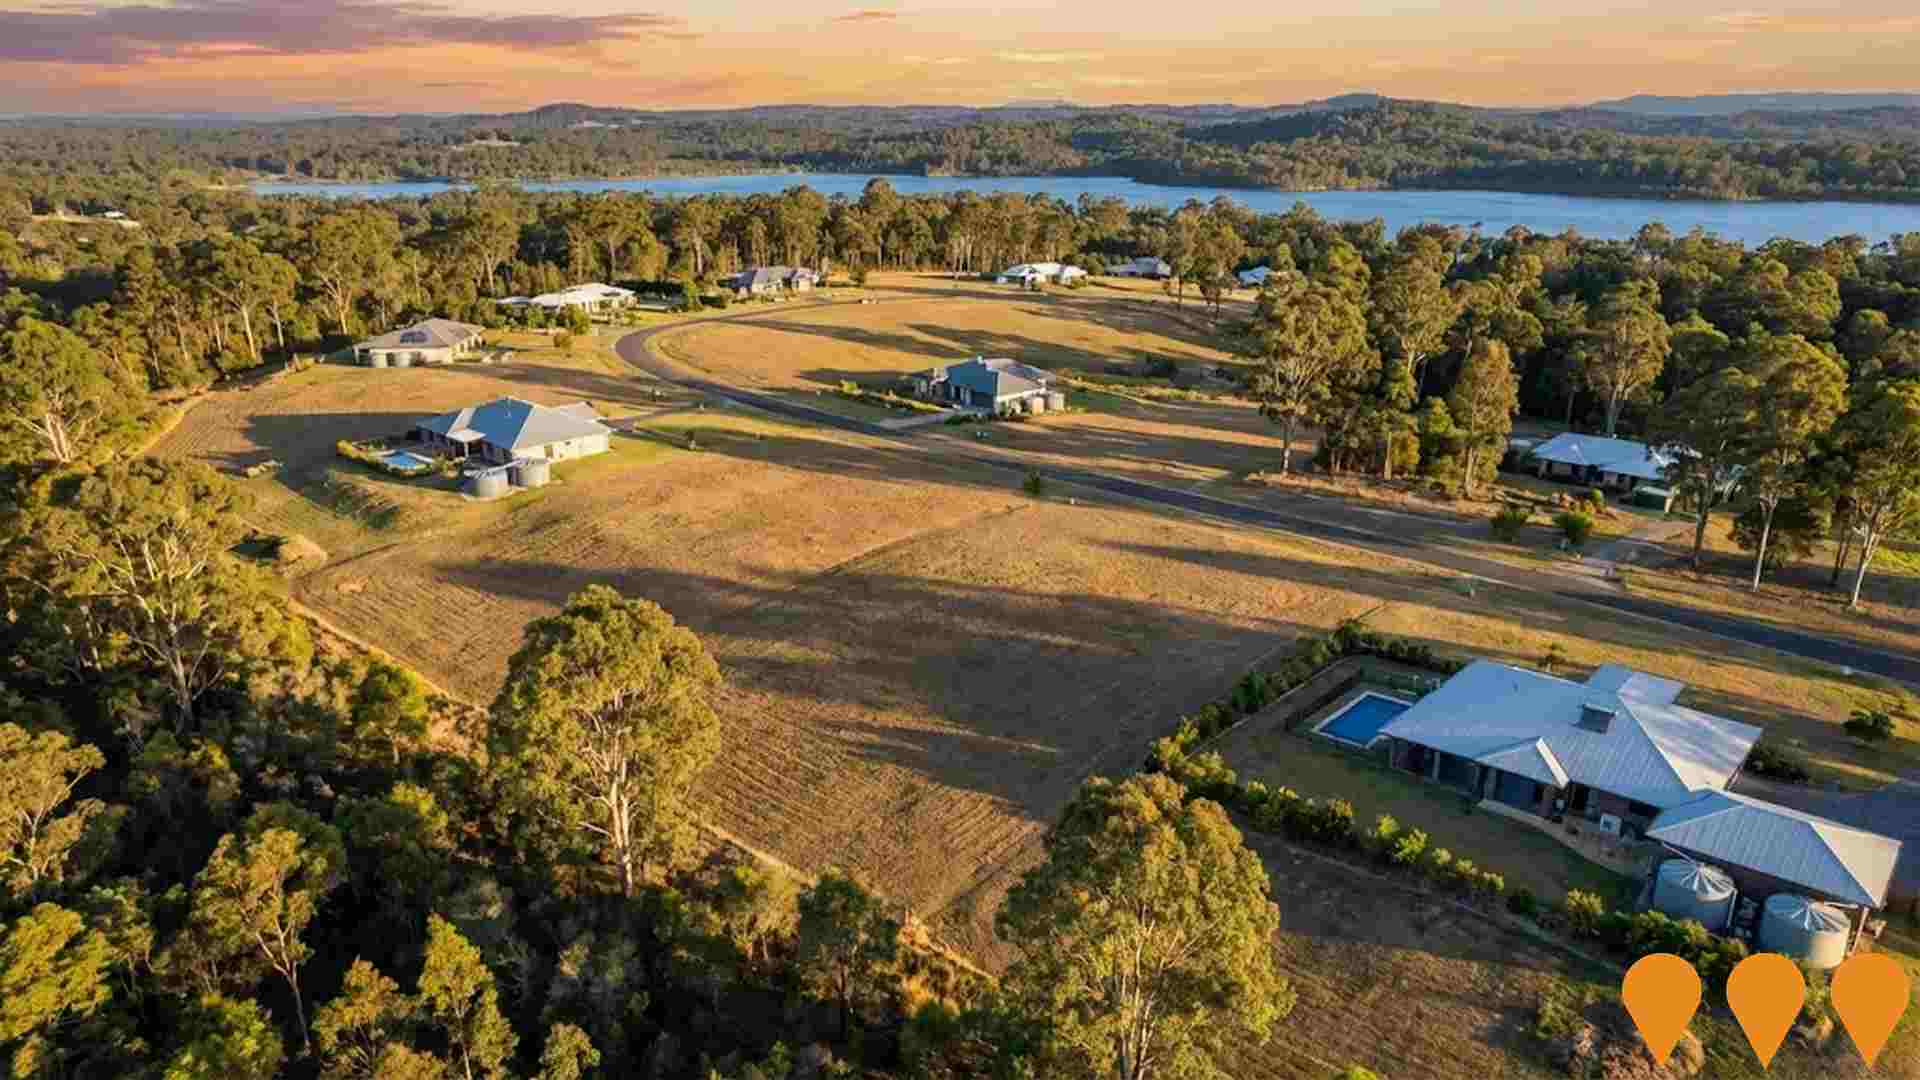
 Denotes AI-based impression for illustrative purposes only, not to be taken as definitive under any circumstances. Please follow links and conduct other investigations from the project's source for actual imagery. Developers and project owners wishing us to use original imagery please Contact Us and we will do so.
Frequently Asked Questions - Infrastructure
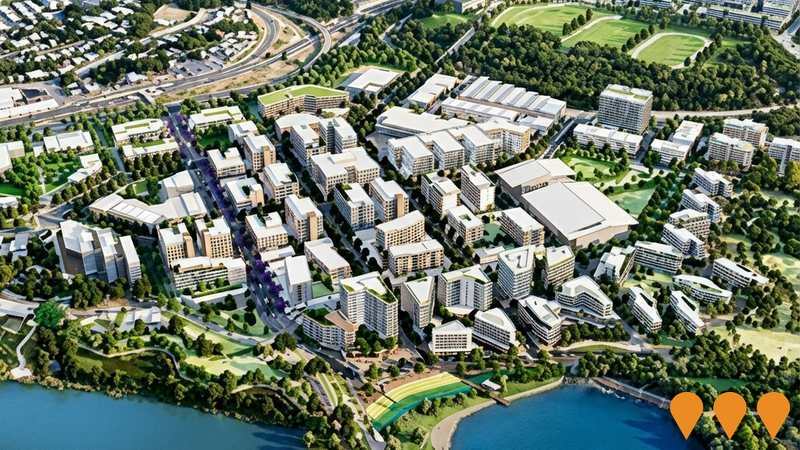
Moreton Bay Central (formerly The Mill at Moreton Bay)
Officially renamed 'Moreton Bay Central' in July 2025, this 460-hectare Priority Development Area (PDA) is anchored by the University of the Sunshine Coast (UniSC) Moreton Bay campus. The project features mixed-use precincts including health, retail, commercial, and residential areas targeting approximately 7,000 residents (approx. 3,000 dwellings), along with 110 hectares of conservation land and the rejuvenation of the Petrie Town Centre.
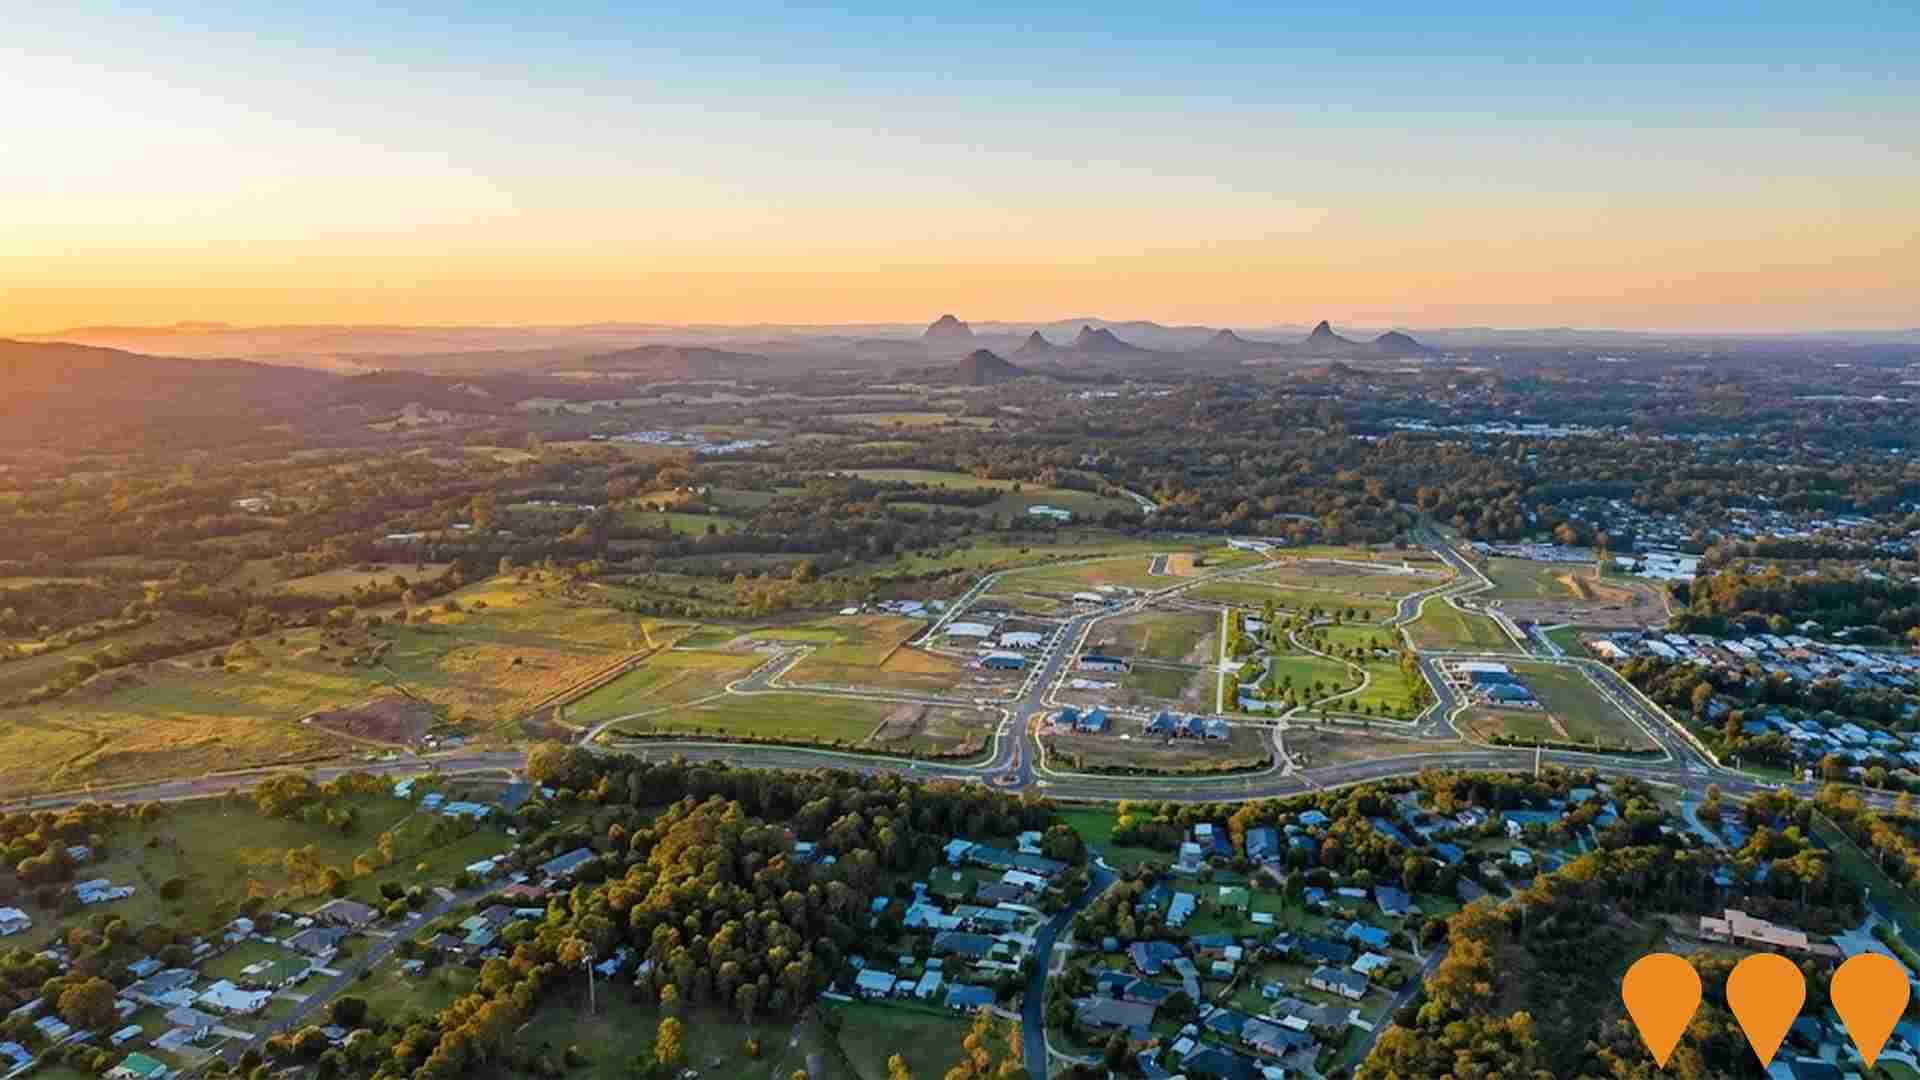
Waraba Priority Development Area (formerly Caboolture West)
Waraba Priority Development Area (declared August 2024, formerly known as Caboolture West) is a major greenfield city development covering approximately 2,900 hectares in Moreton Bay Region. It will deliver around 30,000 dwellings for up to 70,000 residents and support approximately 17,000 jobs over 40+ years. Key features include multiple town and neighbourhood centres, employment precincts, state and private schools, a 360+ ha protected green network, extensive parks, integrated transport infrastructure, and community facilities. Early construction is underway in initial precincts (e.g., Lilywood Landings by Lennium Group, Rivermont by Stockland), with trunk infrastructure, road upgrades, and first homes progressing as of late 2025.
Vantage Lilywood by AVID Property Group
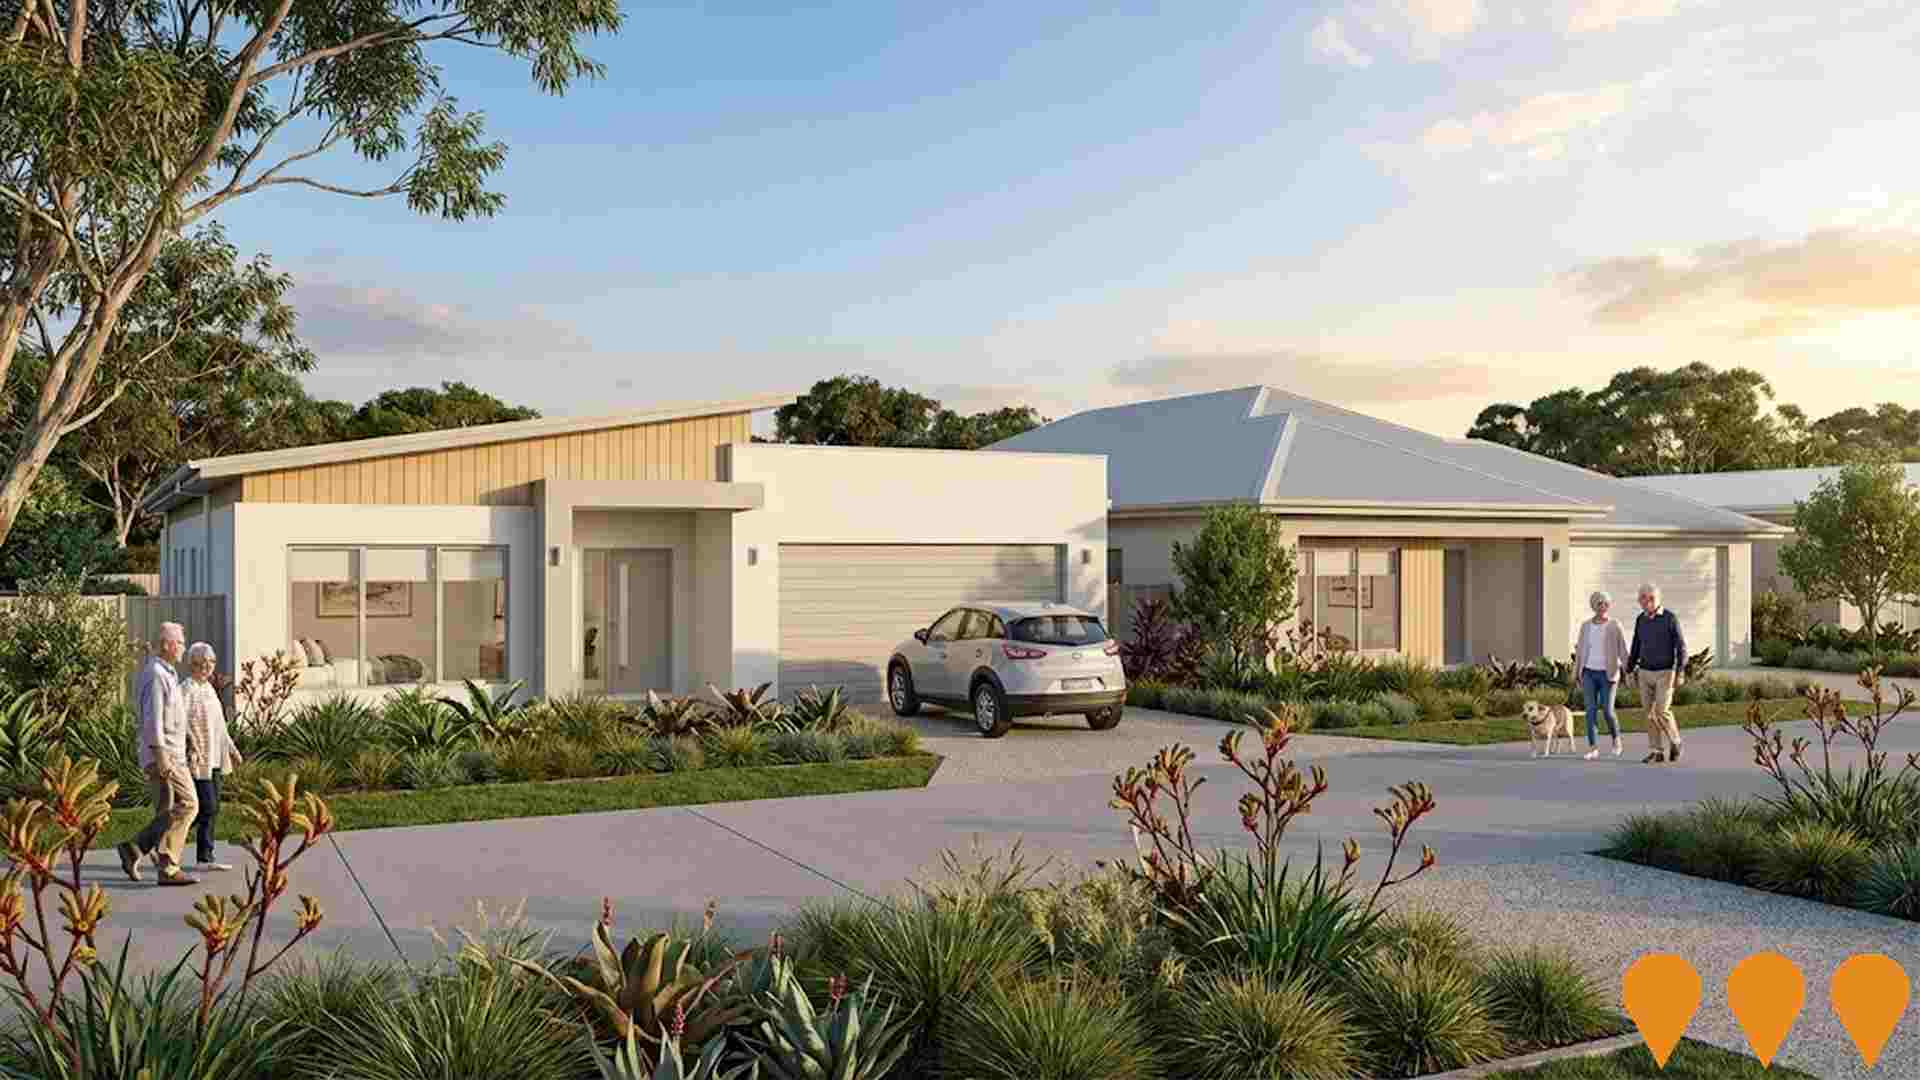
Vantage Lilywood is a boutique over-50s land lease community located in the Waraba growth corridor. It features 296 homes with resort-style amenities including a clubhouse, pool, gym, and cinema, offering a low-maintenance lifestyle with no entry/exit fees or stamp duty.
Narangba Central Shopping Centre
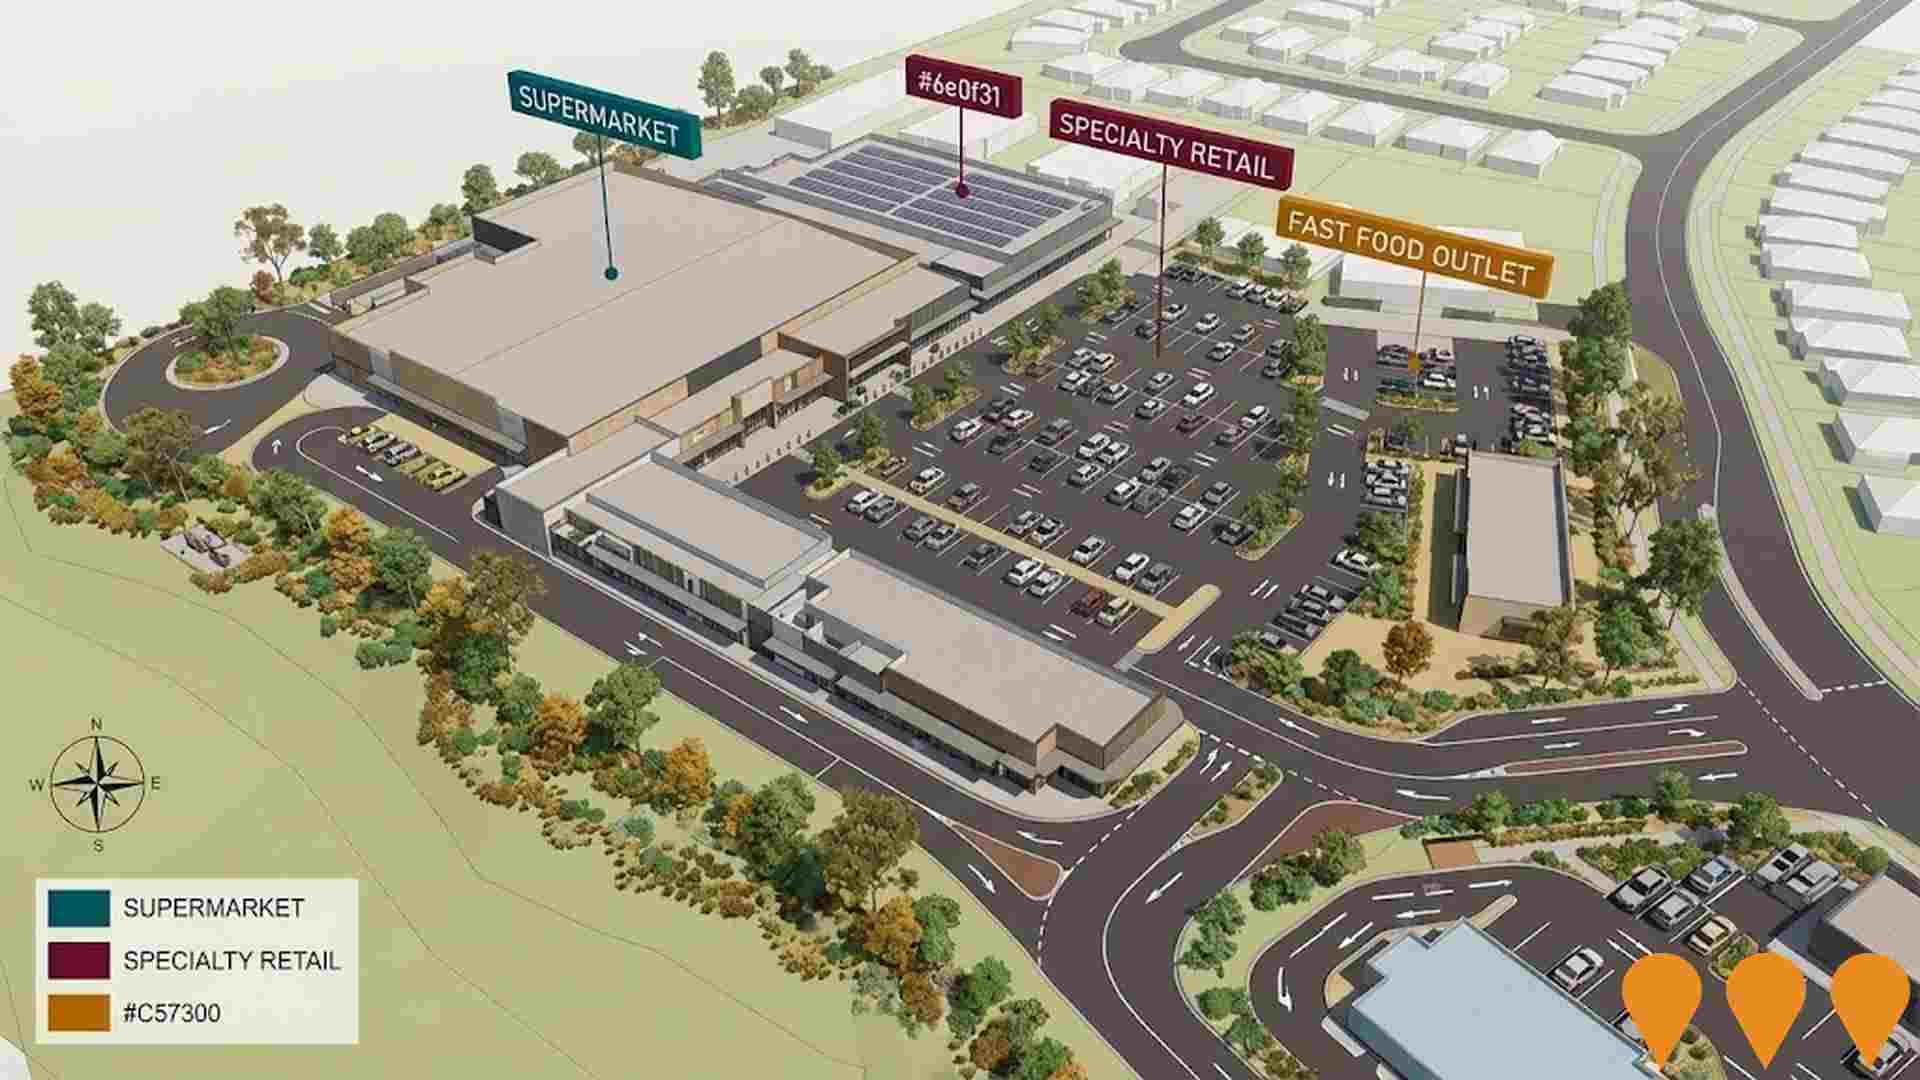
Proposed neighbourhood shopping centre comprising approximately 7,000 sqm with a full line supermarket and specialty retail tenants focusing on food, convenience, and service based uses. The project is currently being repositioned to suit the fast changing market in the region and commercial outcomes required by the client.
Bruce Highway Upgrade - Uhlmann Road to Buchanan Road
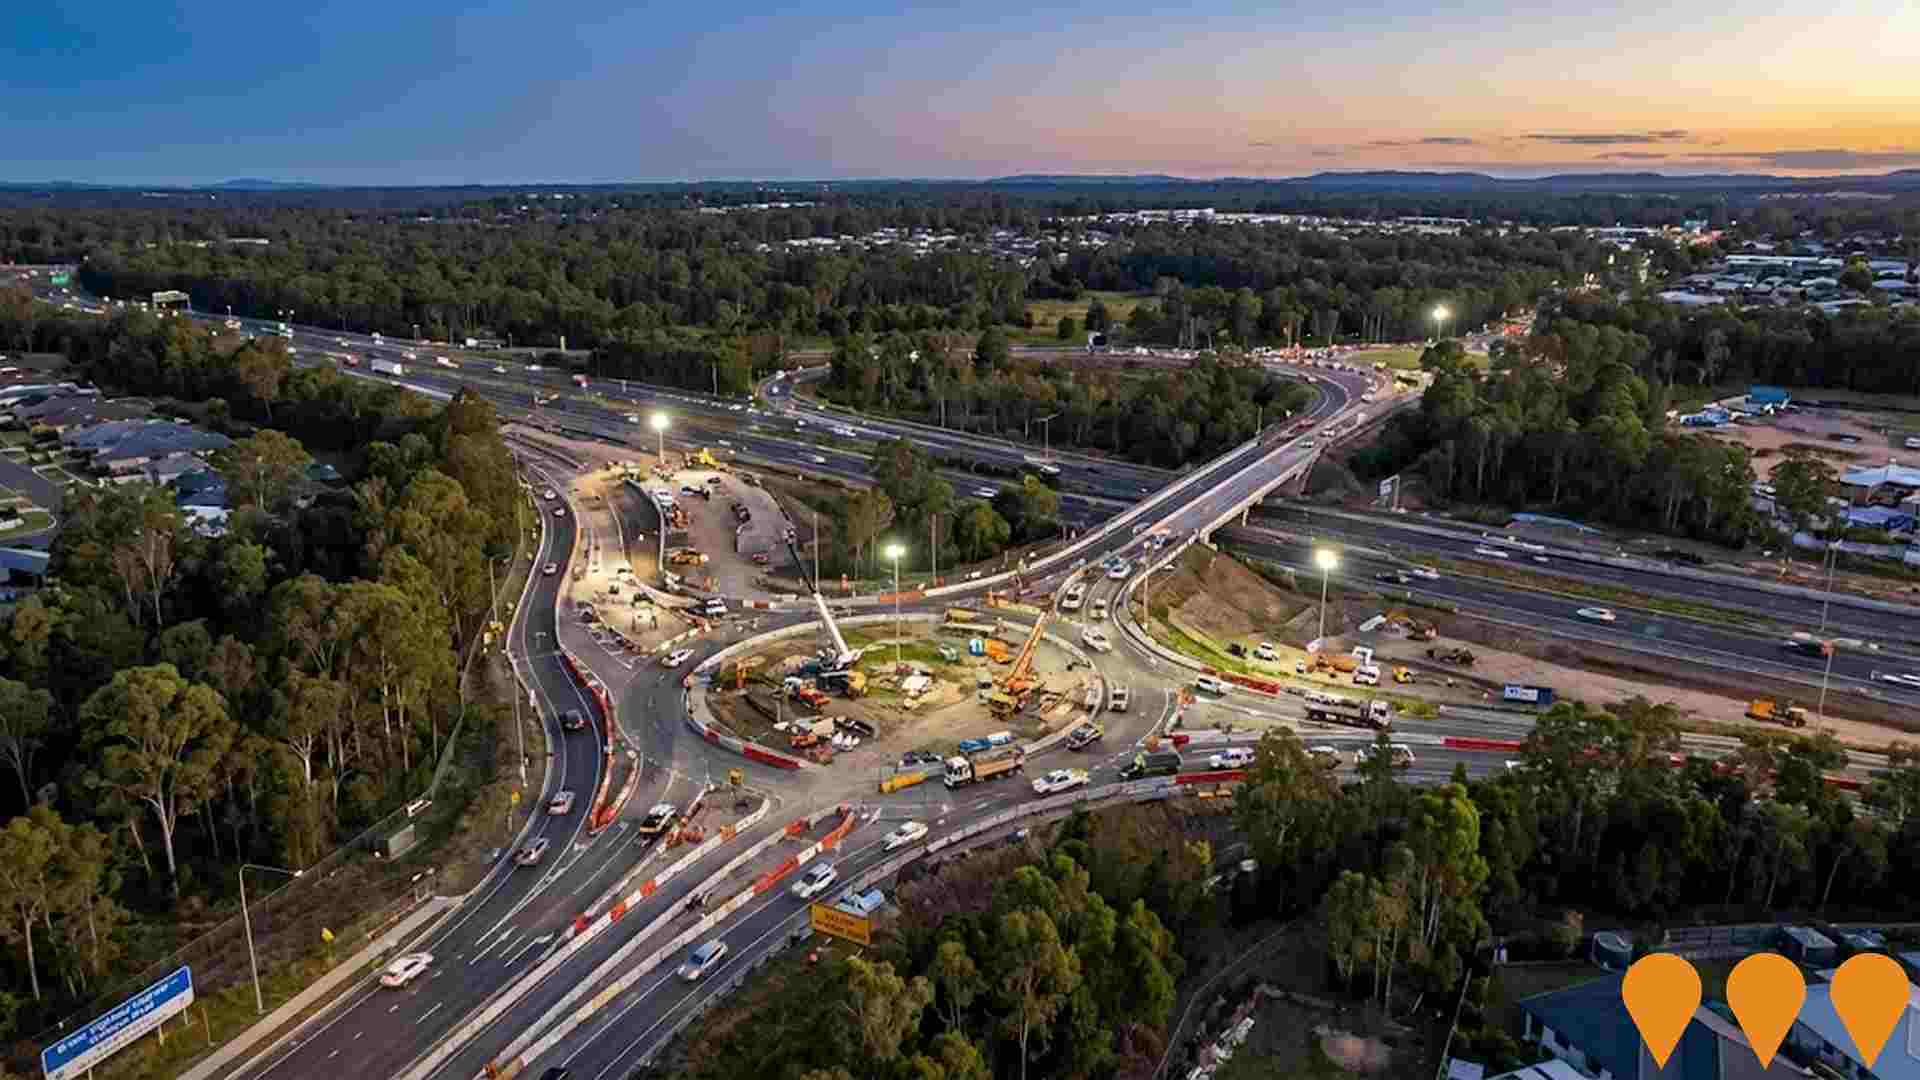
The project involves planning to upgrade the Bruce Highway from Uhlmann Road, Burpengary to Buchanan Road, Morayfield. The preferred option includes adding multi-lane, one-way collector-distributor roads on both sides of the highway to separate local trips from through traffic, upgrading the Uhlmann Road and Buchanan Road interchanges, and providing active transport facilities. Aims to meet future traffic growth, reduce congestion, improve efficiency, safety, and flood immunity.
Ridgeview Estate
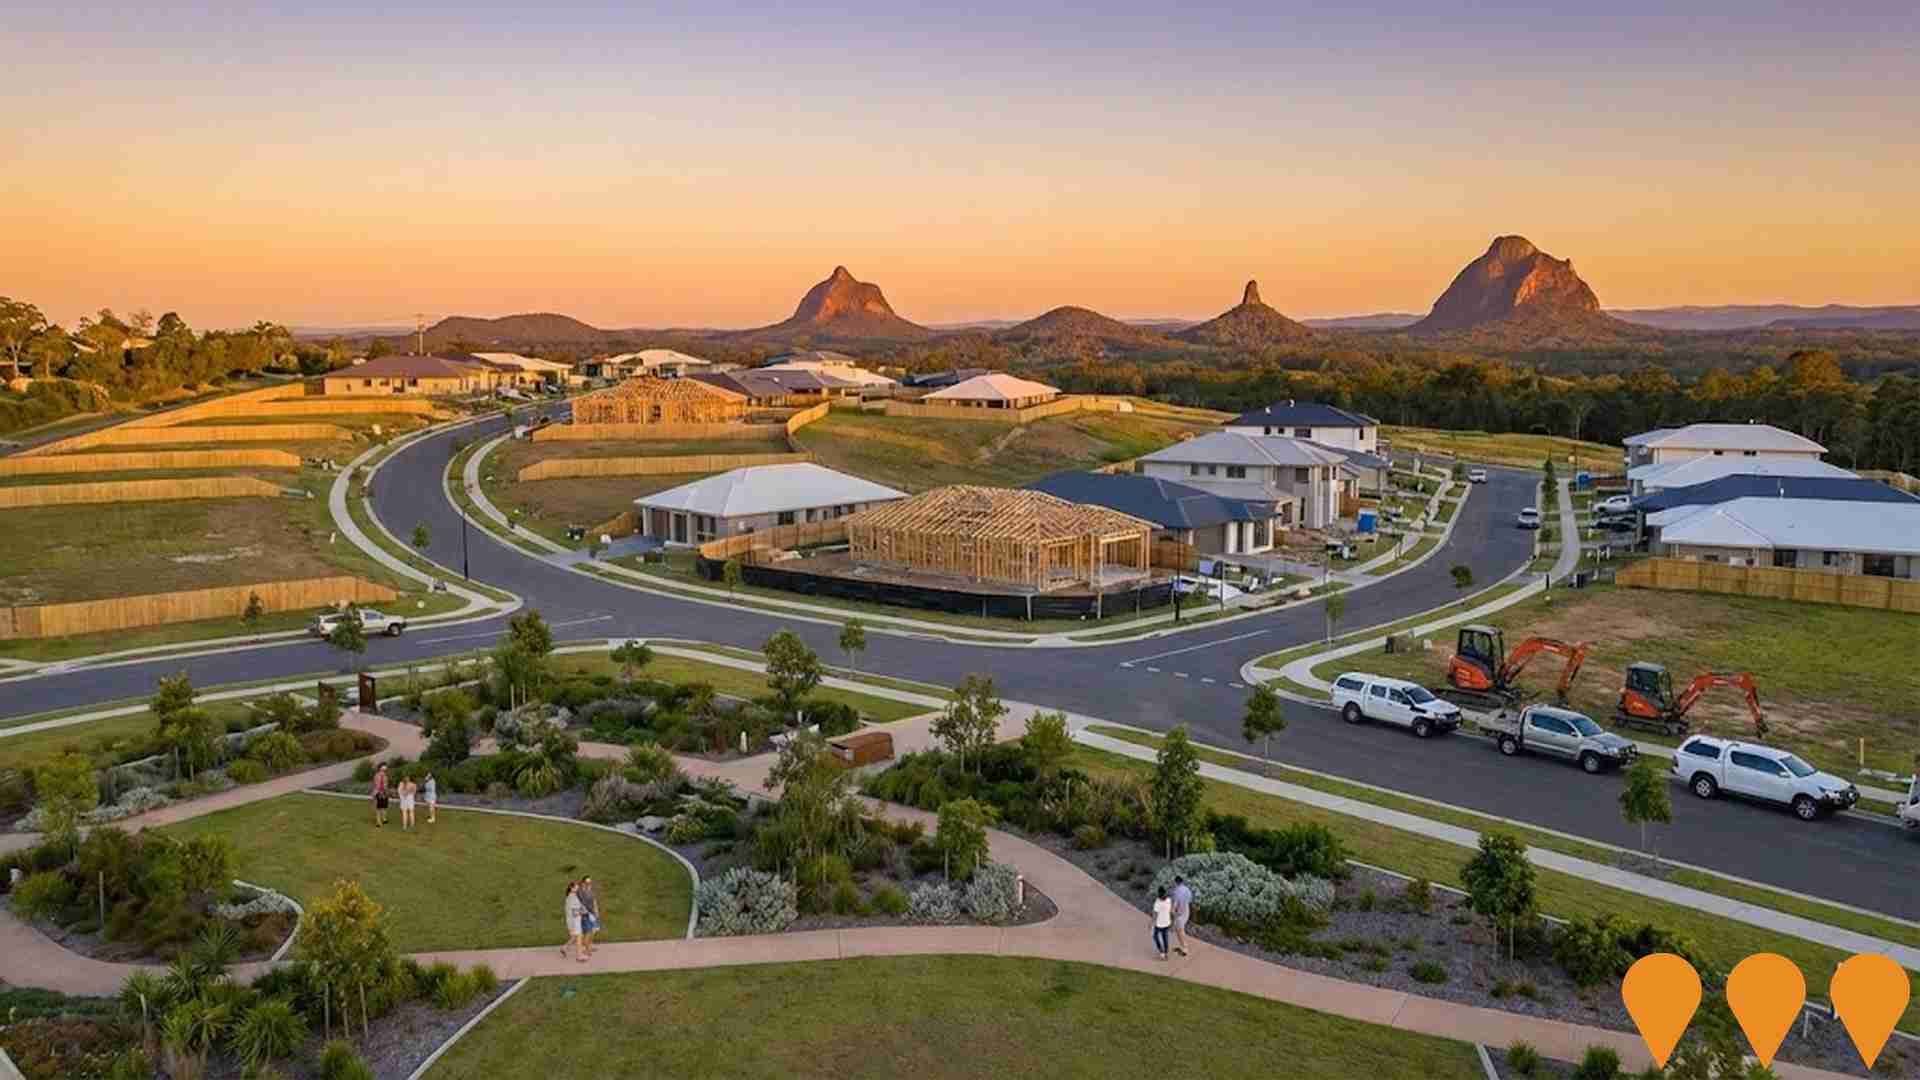
A boutique masterplanned community in Narangba offering premium homesites with panoramic views of the Glass House Mountains. Currently in its final stage - The Glass House Collection - representing the last premium lots in this established community with parks, walking trails, and excellent connectivity to Brisbane and the Sunshine Coast.
Palmer Road Rural Residential Subdivision
Approved rural residential subdivision comprising 16.68 hectares with development approval for 9 large rural residential lots. The naturally treed property offers low-density living in a semi-rural environment close to urban amenities in the Moreton Bay region. The development site was previously marketed through Savills and listings have since been removed from the market, suggesting the property may have been sold or withdrawn. The approved subdivision aligns with Moreton Bay Regional Council's Rural Residential zone provisions for very low density residential development on the edge of urban areas.
Kurwongbah Winery and Wellness Retreat
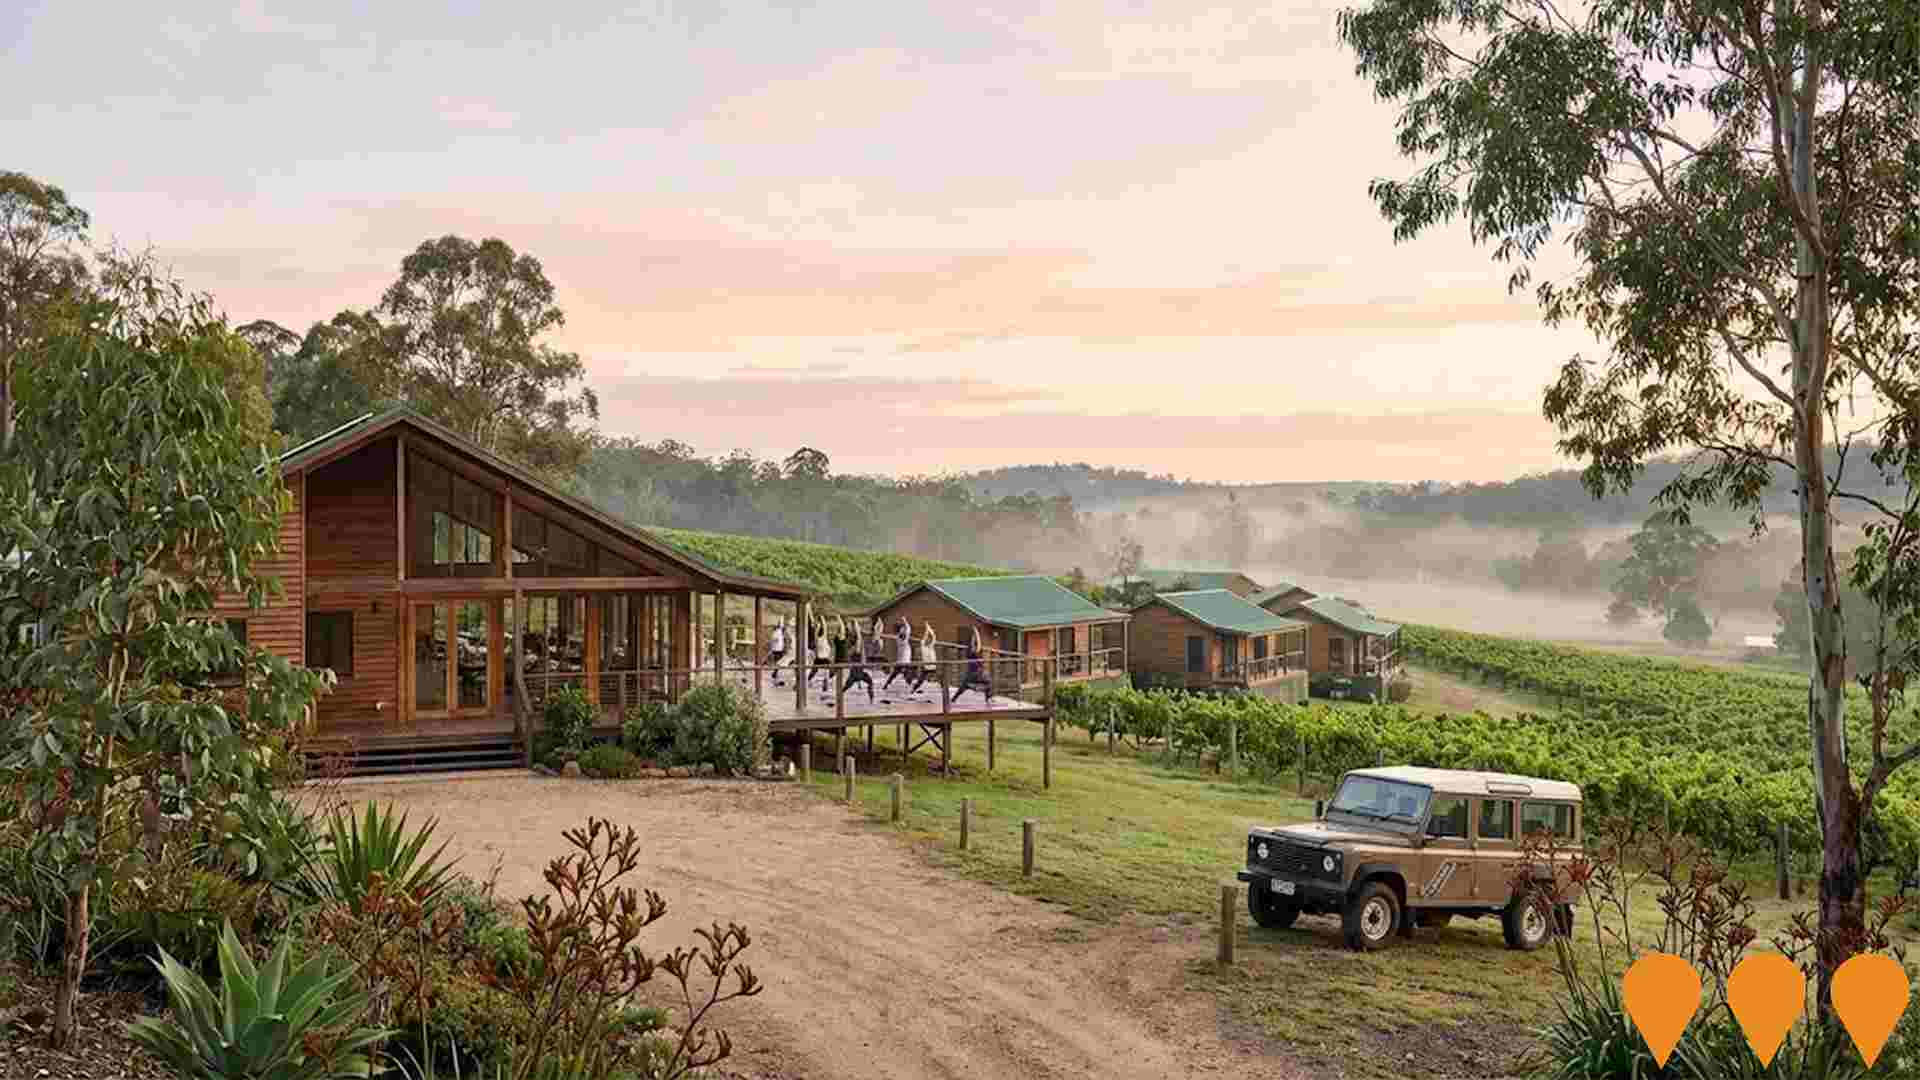
An 85-cabin integrated health and wellness eco retreat with a viticultural twist, including tourist accommodation, a winery with six vineyards, a two-level restaurant with cellar door, a day spa-style health and wellness centre, market gardens, and preservation of koala habitat through replanting and restoration.
Employment
Dayboro ranks among the top 25% of areas assessed nationally for overall employment performance
Dayboro has a skilled workforce with well-represented essential services sectors. Its unemployment rate is 2.8%, lower than Greater Brisbane's 4.0%.
Employment growth over the past year was estimated at 5.0%. As of September 2025, 5,823 residents are employed, with an unemployment rate of 1.2% below Greater Brisbane's. Workforce participation is on par with Greater Brisbane's 64.5%. Leading employment industries include construction, health care & social assistance, and education & training.
Construction has particularly notable concentration, with employment levels at 1.6 times the regional average. Accommodation & food employs just 4.6% of local workers, below Greater Brisbane's 6.7%. Over the 12 months to September 2025, employment increased by 5.0%, while labour force increased by 5.2%, resulting in a slight rise in unemployment rate by 0.2 percentage points. In contrast, Greater Brisbane saw employment rise by 3.8% and unemployment fall by 0.5 percentage points. State-level data to 25-Nov shows QLD employment contracted by 0.01%, with the state unemployment rate at 4.2%. National employment forecasts from May-25 suggest potential future demand within Dayboro, projecting a national employment expansion of 6.6% over five years and 13.7% over ten years. Applying these projections to Dayboro's employment mix suggests local employment should increase by 6.5% over five years and 13.4% over ten years.
Frequently Asked Questions - Employment
Income
Income metrics indicate excellent economic conditions, with the area achieving higher performance than 75% of national locations assessed by AreaSearch
AreaSearch's latest postcode level ATO data for financial year 2022 shows that Dayboro SA2 had a median income of $57,034 and an average income of $74,866. This is higher than Greater Brisbane's median income of $55,645 and average income of $70,520. Based on Wage Price Index growth since financial year 2022, current estimates for Dayboro SA2 are approximately $65,013 (median) and $85,340 (average) as of September 2025. According to the 2021 Census, household incomes in Dayboro SA2 rank at the 87th percentile with a weekly income of $2,378. The earnings profile shows that 31.9% of the population falls within the $1,500 - $2,999 income range. This is similar to the broader area where 33.3% occupy this range. A substantial proportion of high earners (37.5%) have incomes above $3,000 per week, indicating strong economic capacity in the suburb. After housing costs, residents retain 87.0% of their income, reflecting strong purchasing power. The area's SEIFA income ranking places it in the 7th decile.
Frequently Asked Questions - Income
Housing
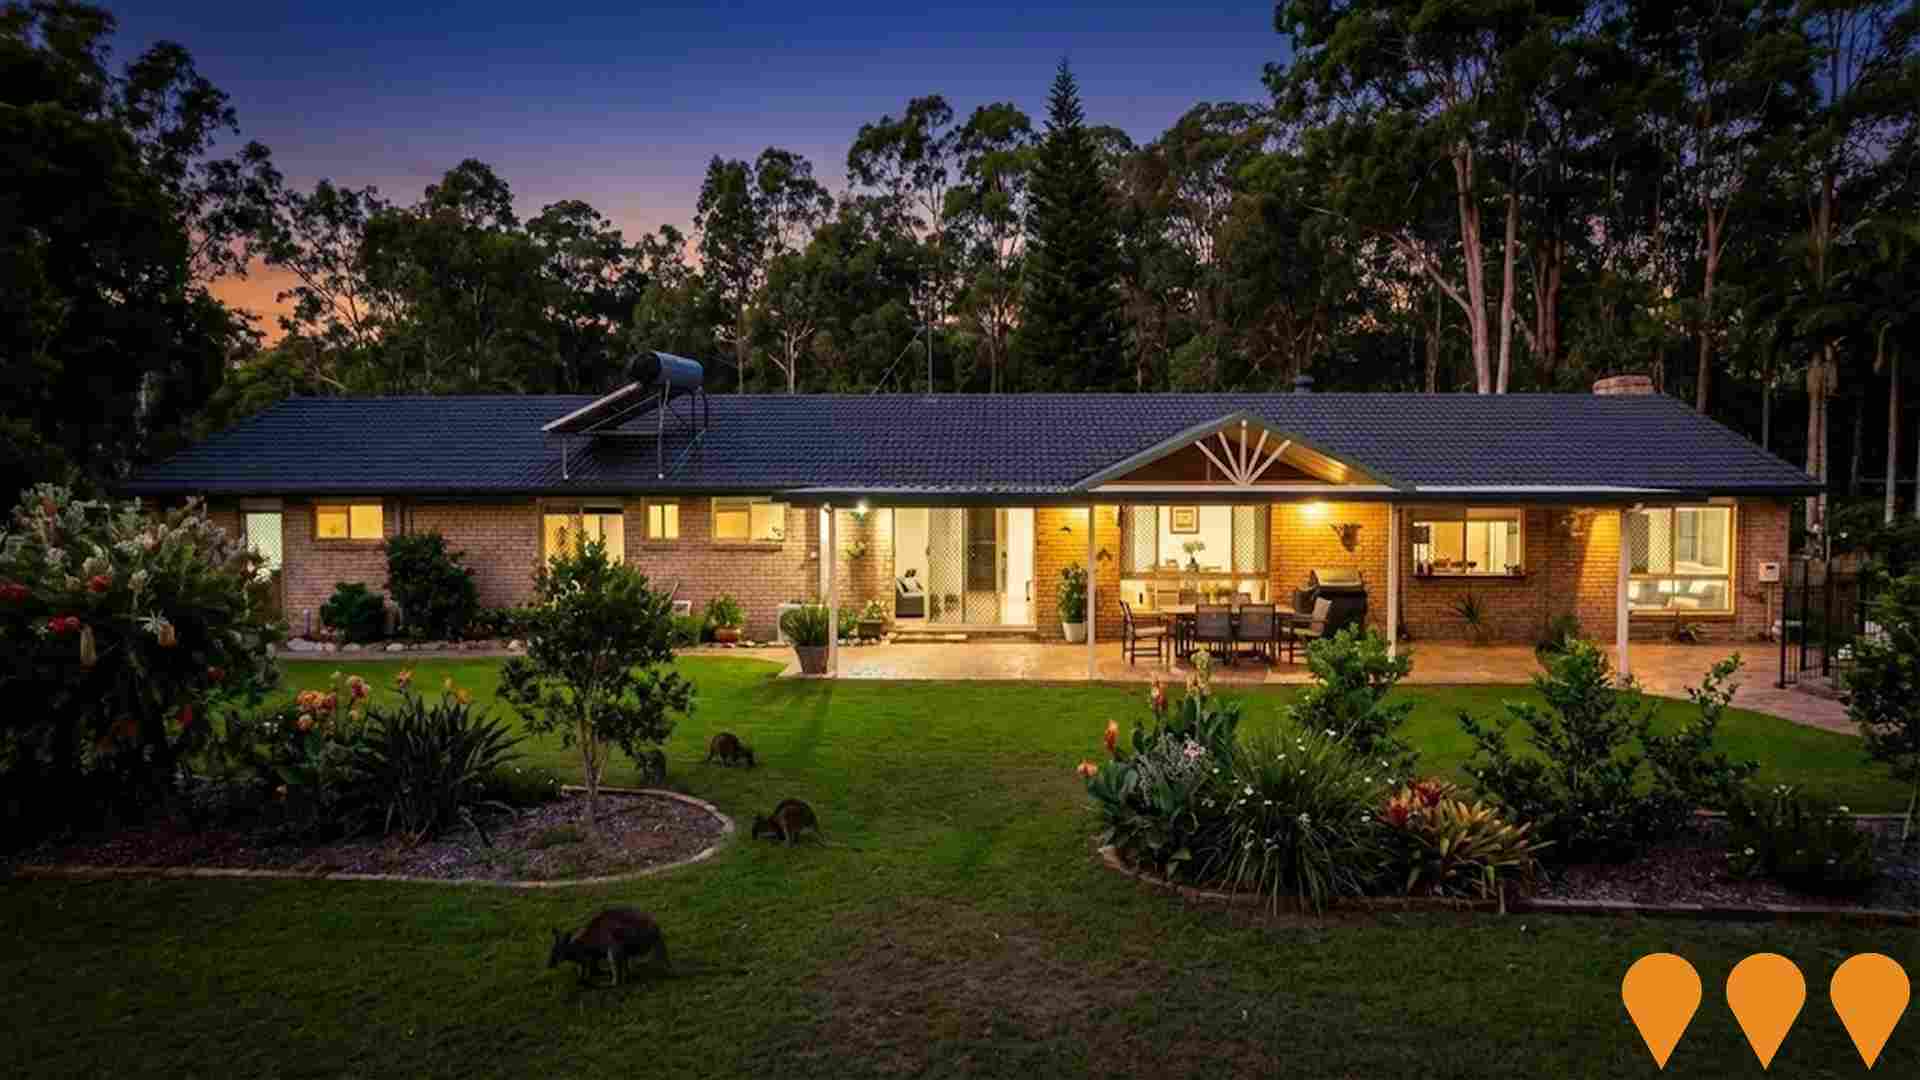
Dayboro is characterized by a predominantly suburban housing profile, with above-average rates of outright home ownership
In Dayboro, as per the latest Census evaluation, 98.6% of dwellings were houses, with the remaining 1.5% being semi-detached, apartments, or other types. This is compared to Brisbane metro's figures of 92.2% houses and 7.9% other dwellings. Home ownership in Dayboro stood at 36.4%, with mortgaged dwellings at 55.1% and rented ones at 8.5%. The median monthly mortgage repayment was $2,167, higher than Brisbane metro's average of $2,080. The median weekly rent in Dayboro was $400, compared to Brisbane metro's $440. Nationally, Dayboro's mortgage repayments were significantly higher than the Australian average of $1,863, while rents exceeded the national figure of $375.
Frequently Asked Questions - Housing
Household Composition
Dayboro features high concentrations of family households, with a higher-than-average median household size
Family households account for 85.7% of all households, including 41.8% couples with children, 35.7% couples without children, and 7.5% single parent families. Non-family households make up the remaining 14.3%, consisting of 12.5% lone person households and 1.7% group households. The median household size is 3.0 people, which is larger than the Greater Brisbane average of 2.9 people.
Frequently Asked Questions - Households
Local Schools & Education
Dayboro shows strong educational performance, ranking in the upper quartile nationally when assessed across multiple qualification and achievement indicators
University qualification levels in Dayboro are at 26.4%, slightly below the SA3 area average of 30.5%. Bachelor degrees are the most common, with 18.2% of residents holding them. This is followed by postgraduate qualifications (5.1%) and graduate diplomas (3.1%).
Vocational credentials are also prevalent, with 41.5% of residents aged 15 and above having them. Advanced diplomas account for 13.6%, while certificates make up 27.9%. Educational participation is high in Dayboro, with 30.8% of residents currently enrolled in formal education. This includes 11.7% in primary education, 10.1% in secondary education, and 4.3% pursuing tertiary education.
Frequently Asked Questions - Education
Schools Detail
Nearby Services & Amenities
Transport
No public transport data available for this catchment area.
Frequently Asked Questions - Transport
Transport Stops Detail
Health
Dayboro's residents are healthier than average in comparison to broader Australia with a fairly standard level of common health conditions seen across both young and old age cohorts
Dayboro's health data shows positive outcomes with common conditions seen across all ages. Private health cover is high at approximately 56%, compared to 59% in Greater Brisbane.
Mental health issues and arthritis are most common, affecting 8.6% and 8.3% respectively. Around 67.9% report no medical ailments, compared to 69.9% in Greater Brisbane. Dayboro has 19.2% residents aged 65+, higher than Greater Brisbane's 16.2%. Health outcomes among seniors are above average, outperforming the general population in health metrics.
Frequently Asked Questions - Health
Cultural Diversity
Dayboro is considerably less culturally diverse than average when assessed alongside AreaSearch's national rankings for language and cultural background related metrics
Dayboro's cultural diversity was found to be below average. As of 2016, 83.5% of its population were born in Australia, with 90.7% being citizens, and 96.3% speaking English only at home. Christianity was the dominant religion in Dayboro, comprising 51.5% of the population, compared to 52.9% across Greater Brisbane.
Regarding ancestry, the top three groups were English (31.9%), Australian (29.2%), and Scottish (9.6%). Notably, German (5.6%) and Dutch (1.9%) were overrepresented in Dayboro compared to regional averages of 4.6% and 1.5%, respectively. South African ancestry was also present at 0.7%.
Frequently Asked Questions - Diversity
Age
Dayboro's median age exceeds the national pattern
The median age in Dayboro is 43 years, which is significantly higher than Greater Brisbane's average of 36 years, and also older than Australia's median age of 38 years. The age group of 55-64 has a strong representation at 15.8% compared to Greater Brisbane, while the 25-34 cohort is less prevalent at 6.4%. According to post-2021 Census data, the population of the 15-24 age group grew from 10.9% to 13.1%, and the 75-84 cohort increased from 4.7% to 6.5%. Conversely, the 25-34 cohort declined from 8.2% to 6.4%, and the 5-14 group dropped from 15.3% to 13.8%. Population forecasts for the year 2041 indicate substantial demographic changes for Dayboro. The 75-84 age group is expected to grow by 76% (492 people), reaching a total of 1,142 from 649. Notably, the combined age groups of 65 and above will account for 67% of the total population growth, reflecting Dayboro's aging demographic profile. In contrast, the 0-4 and 5-14 cohorts are expected to experience population declines.

