Chart Color Schemes
This analysis uses ABS Statistical Areas Level 2 (SA2) boundaries, which can materially differ from Suburbs and Localities (SAL) even when sharing similar names.
SA2 boundaries are defined by the Australian Bureau of Statistics and are designed to represent communities for statistical reporting (e.g., census and ERP).
Suburbs and Localities (SAL) represent commonly-used suburb/locality names (postal-style areas) and may use different geographic boundaries. For comprehensive analysis, consider reviewing both boundary types if available.
est. as @ -- *
ABS ERP | -- people | --
2021 Census | -- people
Sales Activity
Curious about local property values? Filter the chart to assess the volume and appreciation (including resales) trends and regional comparisons, or scroll to the map below view this information at an individual property level.
Find a Recent Sale
Sales Detail
Population
Wagaman has shown very soft population growth performance across periods assessed by AreaSearch
Wagaman's population is 2,055 as of November 2025. This figure represents an increase of 32 people from the 2021 Census total of 2,023. The change was inferred from the estimated resident population of 2,055 in June 2024 and address validation since the Census date. With a density ratio of 2,446 persons per square kilometer, Wagaman ranks in the upper quartile relative to other locations assessed by AreaSearch. Overseas migration contributed approximately 72.1% of overall population gains during recent periods.
AreaSearch uses ABS/Geoscience Australia projections for each SA2 area, released in 2024 with a base year of 2022. For areas not covered by this data and post-2032 growth estimation, AreaSearch applies age cohort-specific growth rates provided by the ABS in its latest Greater Capital Region projections (released in 2023 based on 2022 data). Future population projections indicate a near-median increase for Wagaman among national statistical areas. By 2041, the area is expected to gain 190 persons, reflecting an overall increase of 9.2% over the 17-year period.
Frequently Asked Questions - Population
Development
Residential dwelling approval activity has been practically non-existent in Wagaman
Wagaman has seen only one residential development approval in the past five years. This indicates a mature, established suburb where available land for new construction is limited. For buyers, this scarcity of new housing stock typically supports property values and means competition may primarily be among existing homes.
Compared to Greater Darwin, Wagaman records markedly lower building activity. This scarcity of new dwellings typically strengthens demand and prices for existing properties. This level of activity is also below average nationally, reflecting the area's maturity and pointing to possible planning constraints.
Frequently Asked Questions - Development
Infrastructure
Wagaman has limited levels of nearby infrastructure activity, ranking in the 0thth percentile nationally
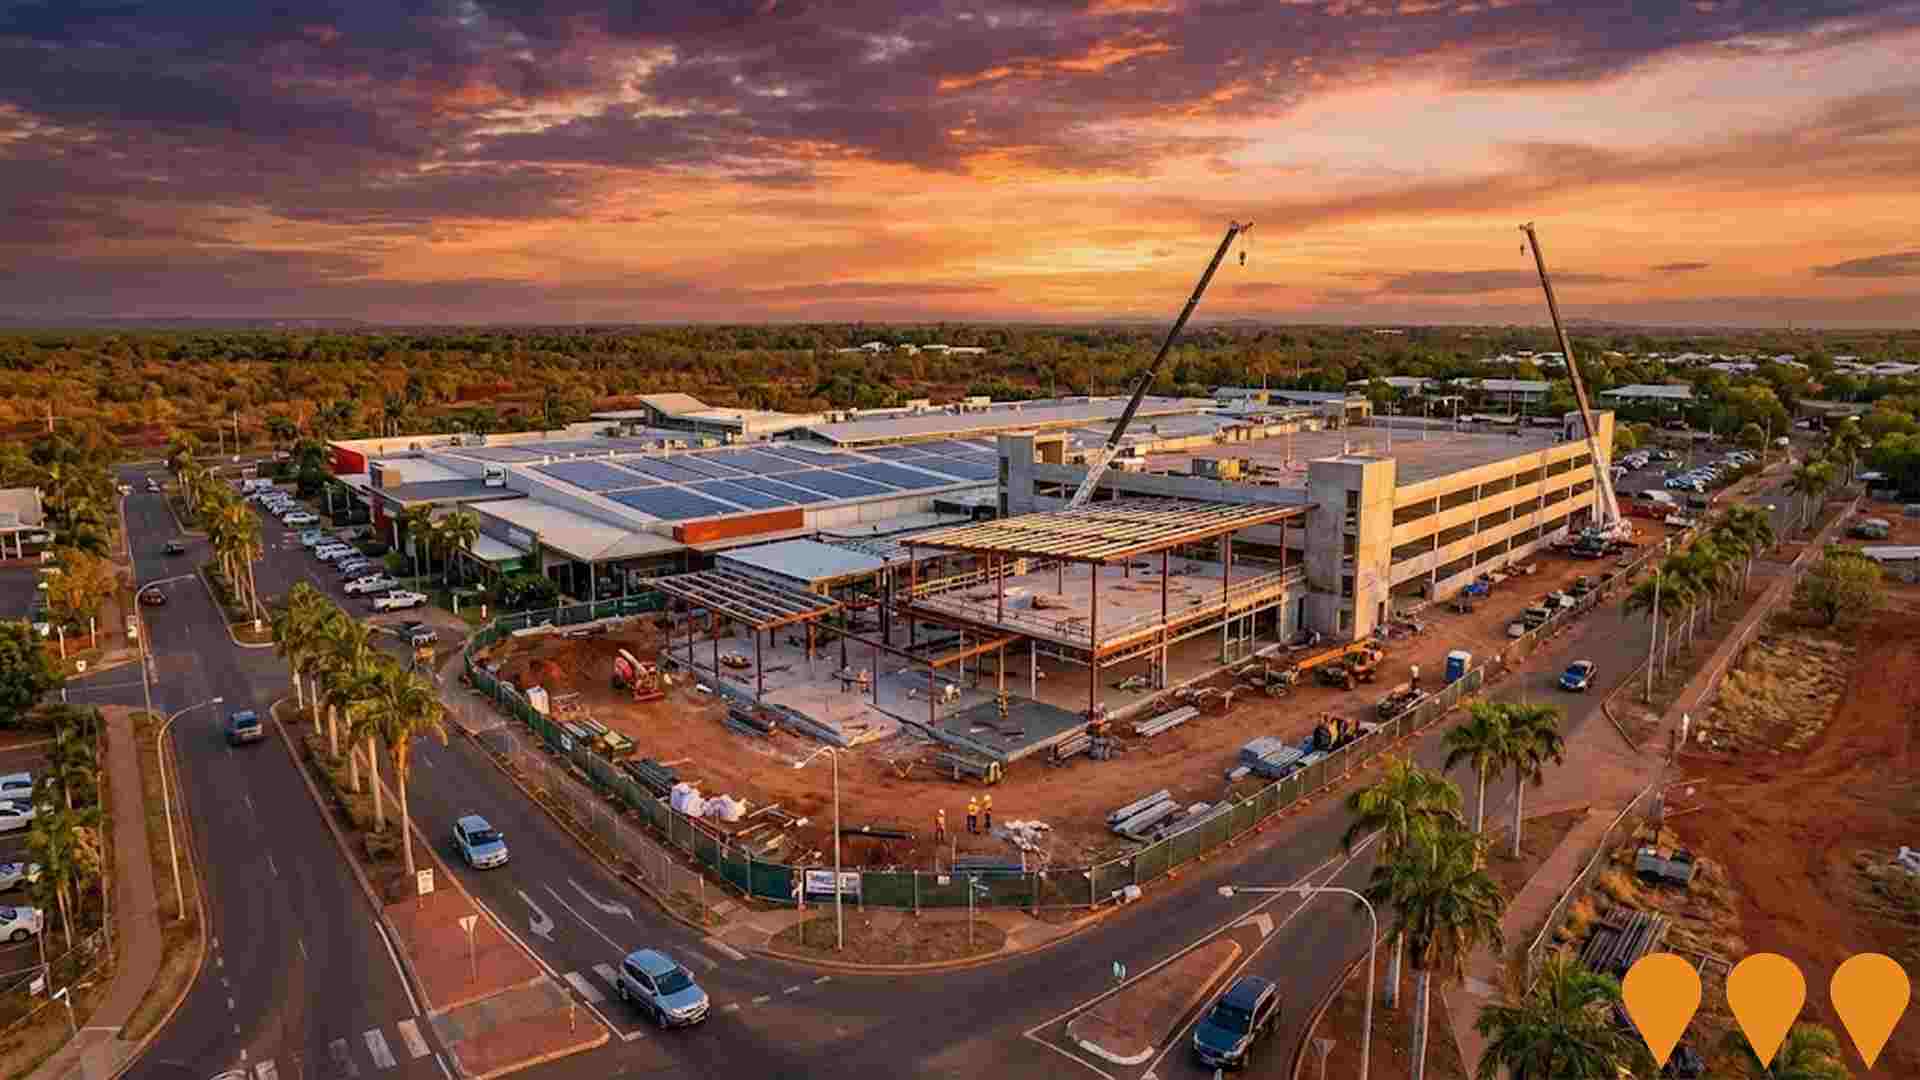
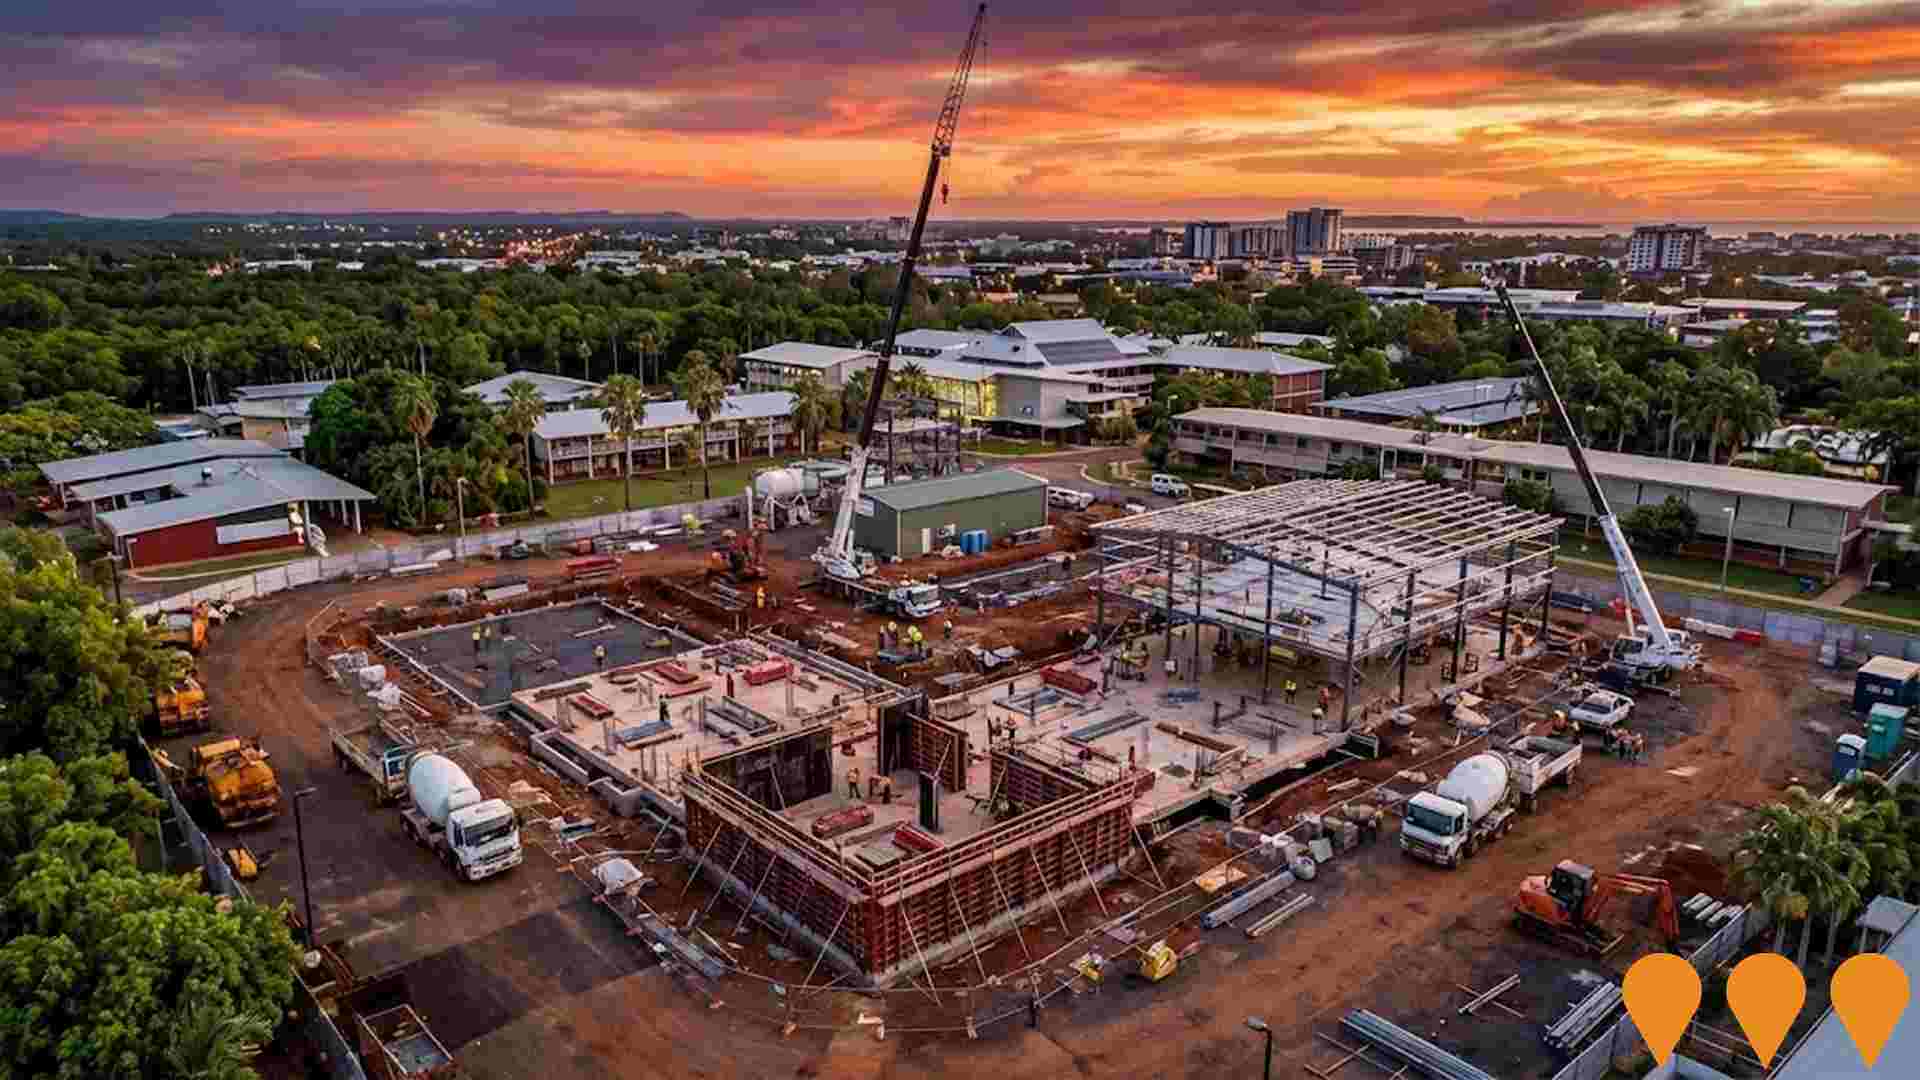
Changes to local infrastructure significantly impact an area's performance. AreaSearch identified two projects likely affecting the area: Casuarina Aquatic and Leisure Centre, Casuarina Square Redevelopment, Royal Darwin Hospital Mental Health Inpatient Unit and CSSD Upgrade, Northern Suburbs Youth Hub.
Professional plan users can use the search below to filter and access additional projects.
INFRASTRUCTURE SEARCH
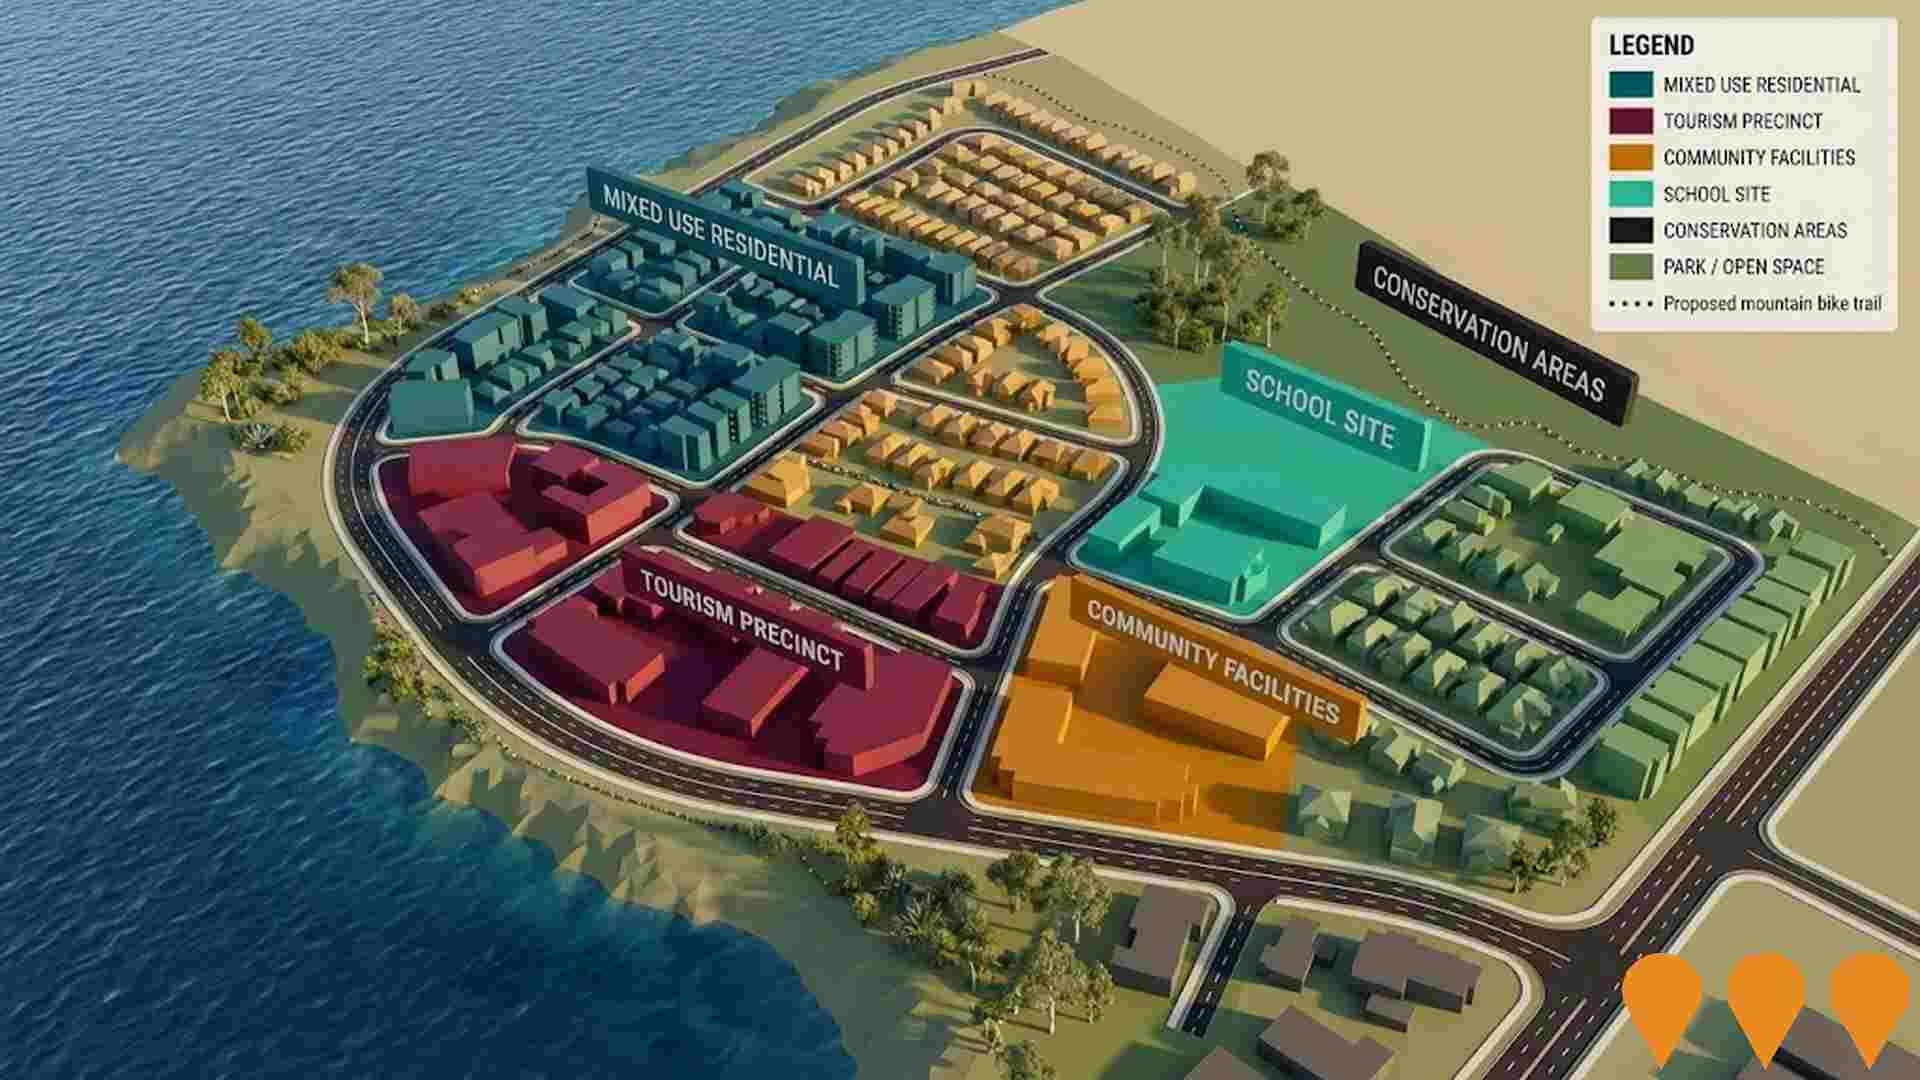
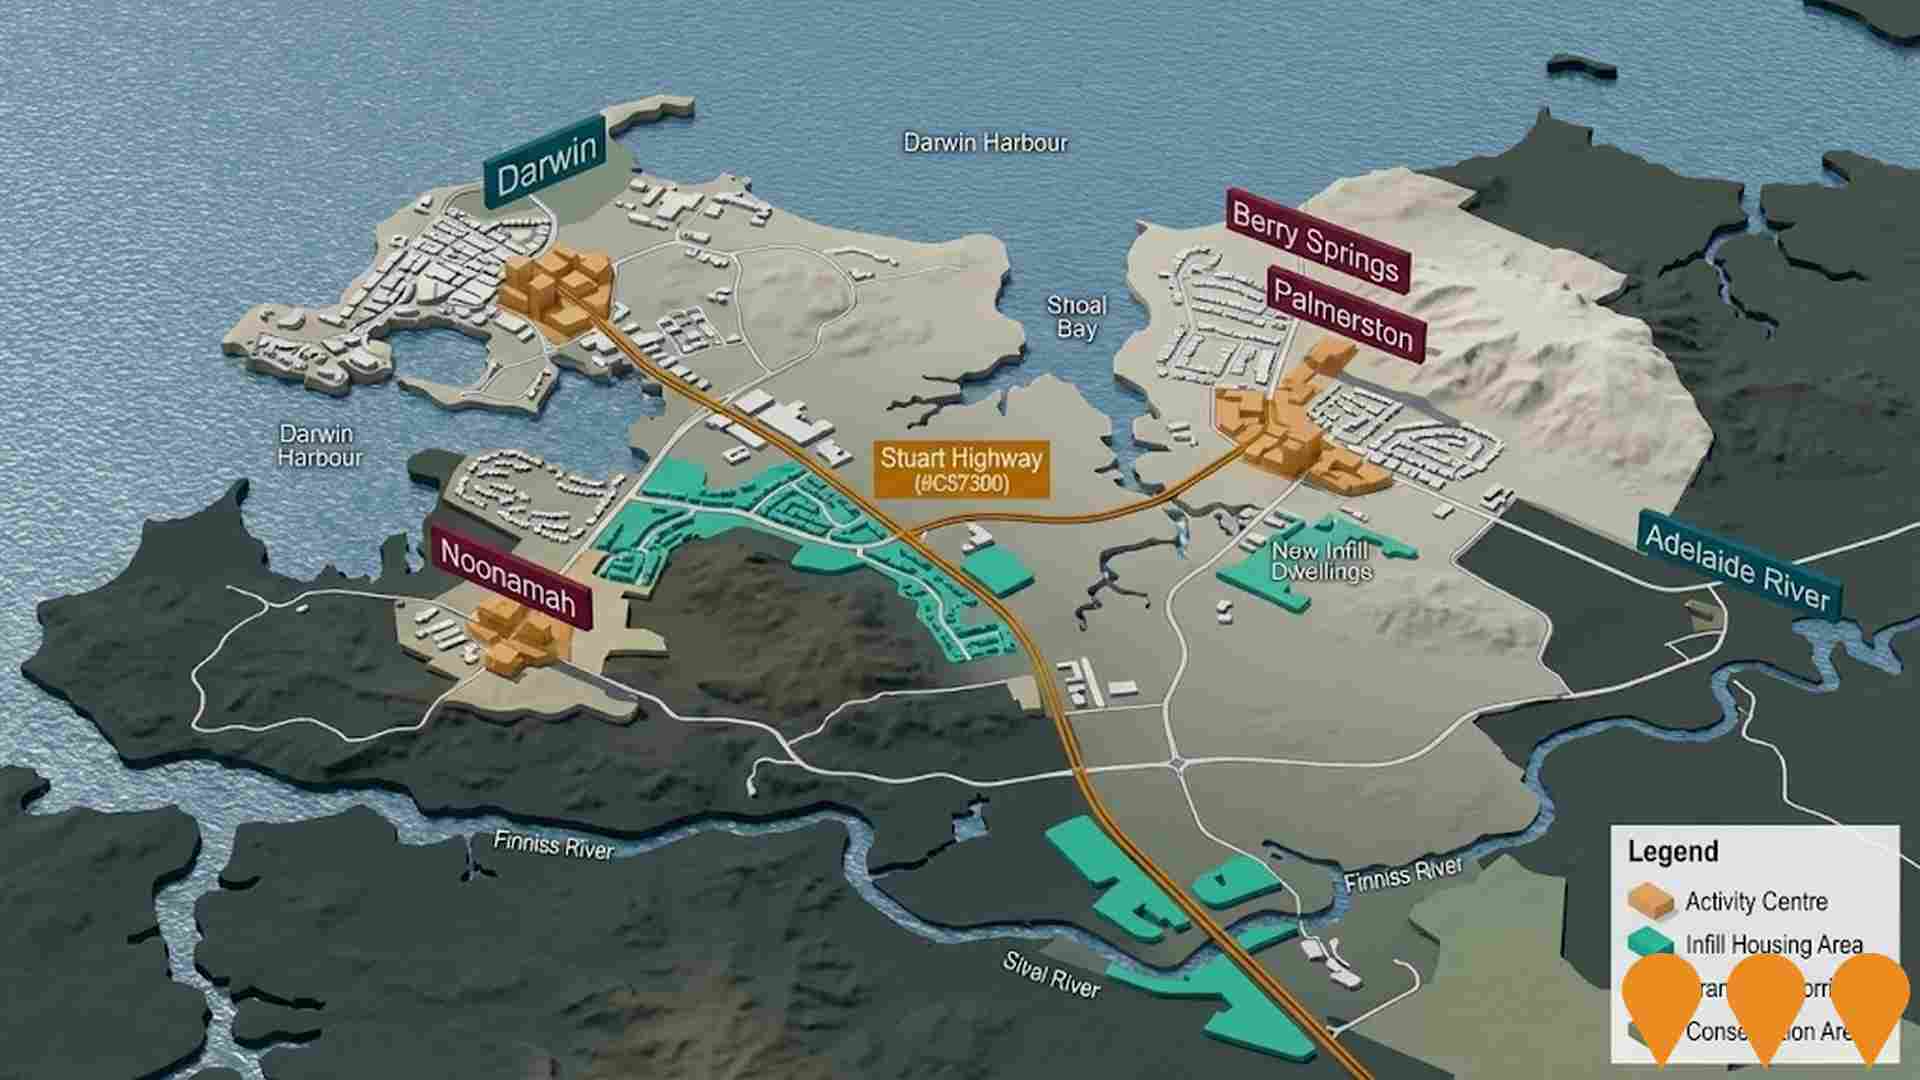
 Denotes AI-based impression for illustrative purposes only, not to be taken as definitive under any circumstances. Please follow links and conduct other investigations from the project's source for actual imagery. Developers and project owners wishing us to use original imagery please Contact Us and we will do so.
Frequently Asked Questions - Infrastructure
Australia-Asia PowerLink (AAPowerLink)
The world's largest renewable energy infrastructure project, comprising a 17-20GW solar farm and 36-42GWh battery storage in the Barkly Region, connected via HVDC transmission to Darwin and Singapore. The project received Commonwealth environmental approval in August 2024. It aims to supply up to 4GW of green electricity to Darwin industrial customers and export power to Singapore.

Royal Darwin Hospital Mental Health Inpatient Unit and CSSD Upgrade
New three-storey mental health inpatient facility at Royal Darwin Hospital providing 18 acute inpatient beds plus a 6-bed Stabilisation Assessment and Referral Area (SARA), connected to the Emergency Department via an elevated enclosed walkway. Project also includes major upgrades to the Central Sterile Services Department (CSSD). Managing Contractor: Sitzler Pty Ltd. Works commenced in 2023 with practical completion expected mid-2025.

Berrimah North Area Plan
Strategic area plan included in the NT Planning Scheme (since December 2014) guiding future land use west of Vanderlin Drive, enabling coordinated commercial, light industrial, employment and residential development with supporting infrastructure. Current NT Budget (2025) includes headworks funding to support implementation across the Greater Darwin region, including Berrimah North.
Hudson Creek Power Station
12MW natural gas-fired power plant, NT's first privately owned grid-connected gas generation facility. Features 25% lower emissions than average NT gas generators. Part of dual project with Batchelor Solar Farm, creating 162 construction jobs and providing vital grid stability to Darwin-Katherine network.

Marine Industry Park
Marine and offshore industries servicing hub at East Arm, Darwin. Stage 1 planning approval is secured for a purpose-built industrial subdivision near the new Darwin Ship Lift, with expressions of interest open for serviced lots. Existing common-user facilities include an all-tide barge ramp (first point of entry) and a secure hardstand supporting storage and fabrication activities.

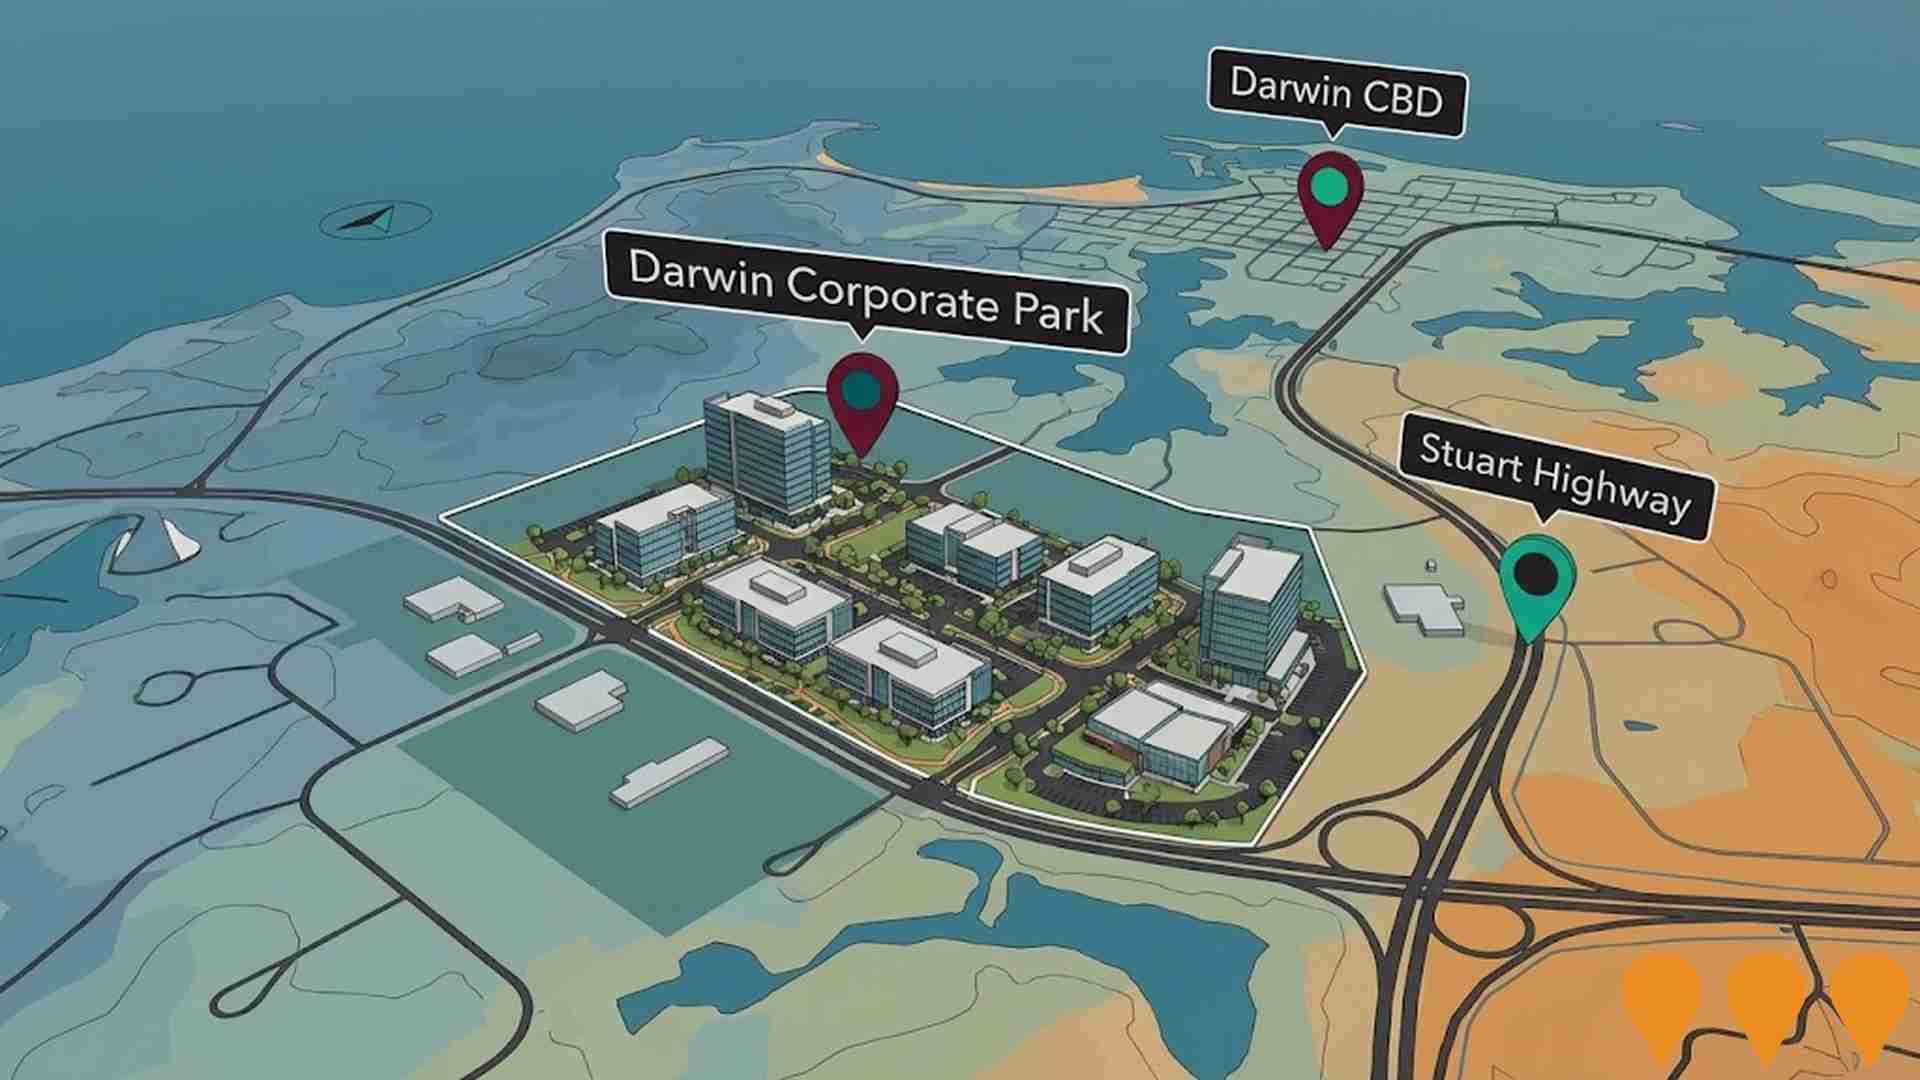
Darwin Corporate Park
Darwin Corporate Park is a premier business park for mixed use commercial office space located in what is now recognised as the centre of greater Darwin.
Frances Bay Mooring Basin lock upgrade
The Northern Territory Government has completed a $20 million upgrade of the Frances Bay Mooring Basin lock. The upgrade includes delivering new lock doors, modernising mechanical and electrical systems, and extending the life of the asset to ensure long-term sustainability, efficiency, and safety for industries such as seafood, pearling, and charter vessels.

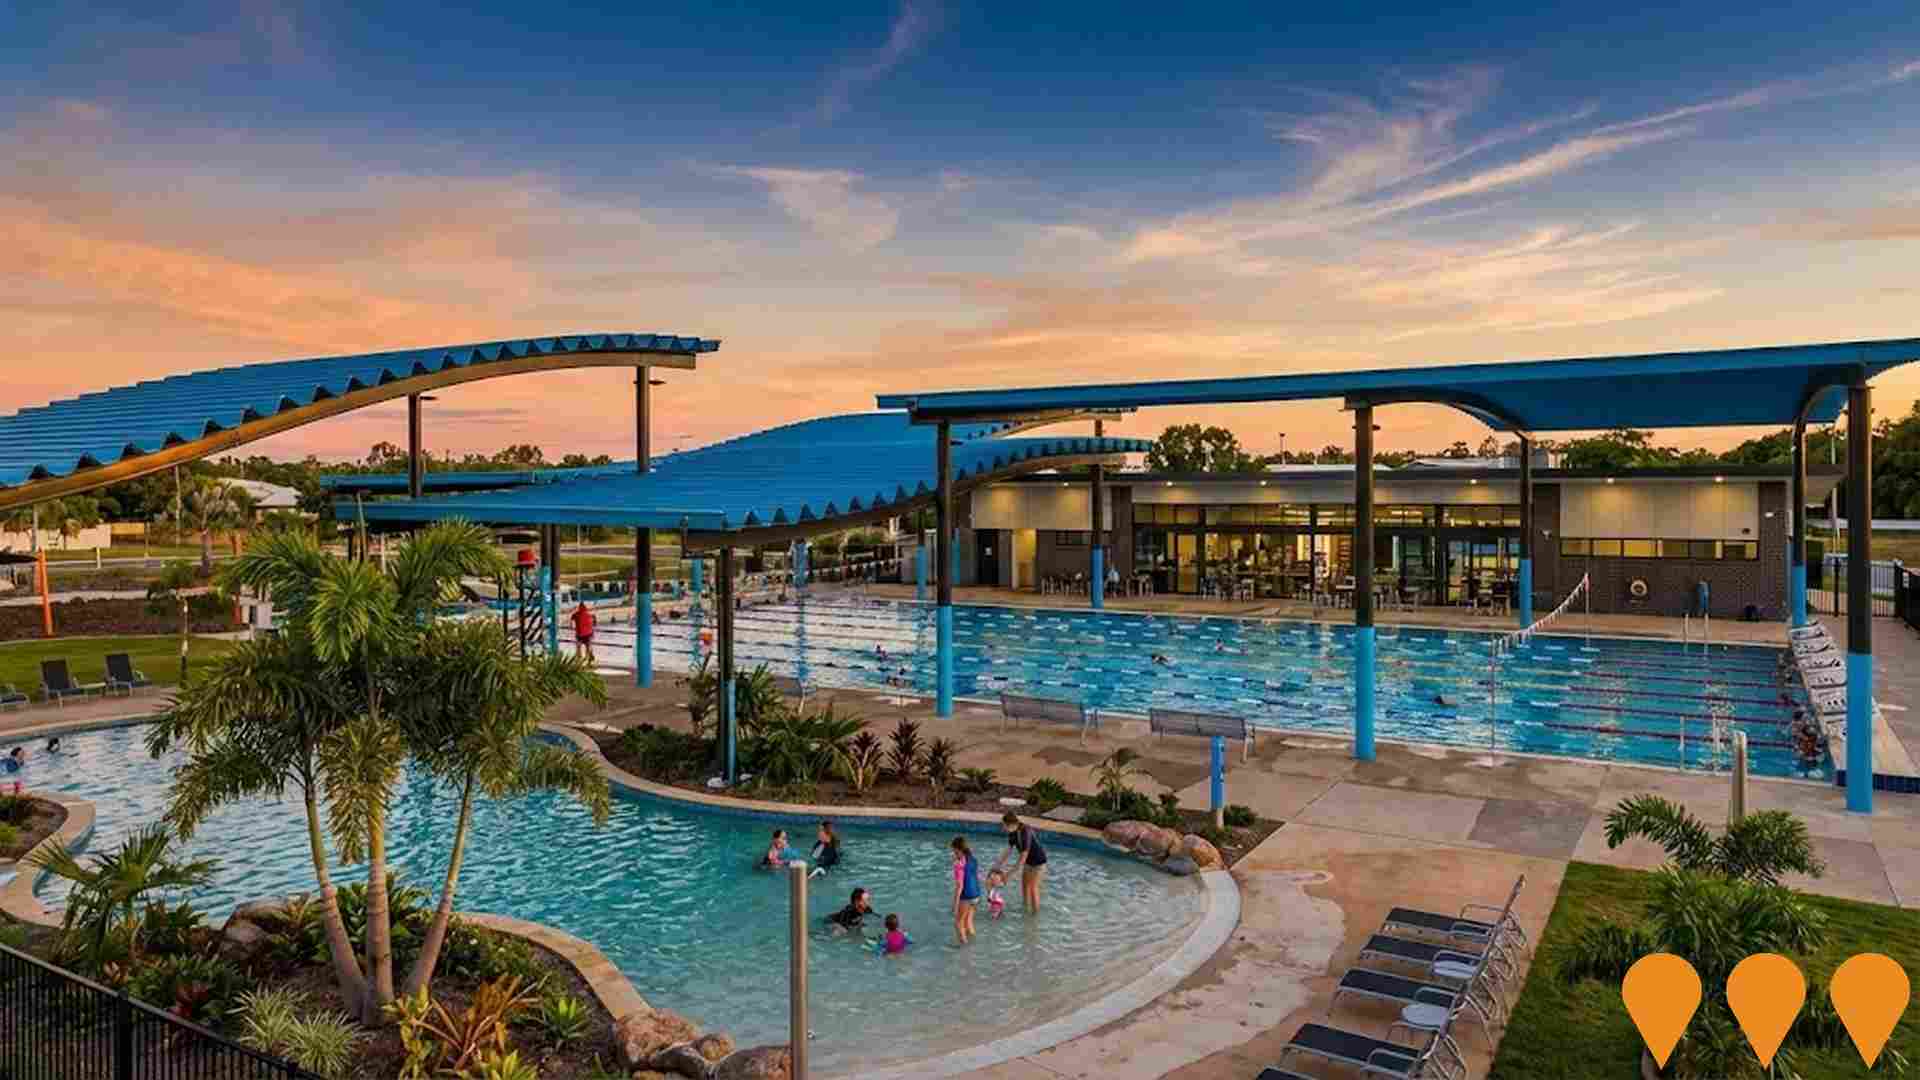
Casuarina Aquatic and Leisure Centre
A new $26.8 million aquatic and leisure centre in Casuarina, featuring an 8-lane 50m pool, a resort-style lagoon pool, a learn-to-swim pool, wet and dry play areas, a cafe, BBQ facilities, a gymnasium, and a basketball 3-on-3 court. The project was funded by the City of Darwin and the Australian Government.
Employment
AreaSearch analysis indicates Wagaman maintains employment conditions that align with national benchmarks
Wagaman has an educated workforce with significant representation in essential services sectors. Its unemployment rate is 3.7%, with estimated employment growth of 1.6% over the past year as of September 2025.
In this period, 1,138 residents are employed while the unemployment rate is 0.6% higher than Greater Darwin's rate of 3.1%. Workforce participation in Wagaman is lower at 66.3%, compared to Greater Darwin's 69.7%. Employment among residents is concentrated in health care & social assistance, public administration & safety, and accommodation & food. Health care & social assistance employment levels are particularly high, at 1.3 times the regional average.
Conversely, public administration & safety employs only 13.2% of local workers, below Greater Darwin's 19.5%. The area appears to offer limited local employment opportunities based on Census data comparisons. Between September 2024 and September 2025, Wagaman's employment levels increased by 1.6%, with labour force growth of 1.5%, resulting in a slight decrease in unemployment rate of 0.1 percentage points. This contrasts with Greater Darwin where employment rose by 1.9% and the labour force grew by 1.9%, but unemployment rose marginally. State-level data from 25-Nov-25 shows NT employment contracted by 1.13% (losing 4,100 jobs), with a state unemployment rate of 4.4%, closely aligned with the national rate of 4.3%. National employment forecasts from May-25 project overall growth of 6.6% over five years and 13.7% over ten years. Applying these projections to Wagaman's employment mix suggests local employment should increase by 6.6% over five years and 13.8% over ten years, assuming constant population projections for illustrative purposes.
Frequently Asked Questions - Employment
Income
The economic profile demonstrates above-average performance, with income metrics exceeding national benchmarks based on AreaSearch comparative assessment
AreaSearch aggregated latest postcode level ATO data for financial year 2022. Wagaman SA2 had a median income of $51,807 and an average income of $60,335. These figures were below the national average. In Greater Darwin, the median was $65,522 and the average was $75,260. Based on Wage Price Index growth of 12.01% since financial year 2022, estimates for September 2025 would be approximately $58,029 (median) and $67,581 (average). Census 2021 income data showed Wagaman's household, family, and personal incomes were at the 66th percentile nationally. The earnings profile indicated that 37.1% of residents earned between $1,500 - 2,999 (762 individuals), similar to surrounding regions where 36.7% fell into this band. Housing accounted for 14.1% of income. Wagaman residents ranked strongly in disposable income at the 74th percentile and the area's SEIFA income ranking placed it in the 4th decile.
Frequently Asked Questions - Income
Housing
Wagaman is characterized by a predominantly suburban housing profile, with above-average rates of outright home ownership
The dwelling structure in Wagaman, as per the latest Census, consisted of 80.6% houses and 19.3% other dwellings (semi-detached, apartments, 'other' dwellings). This compares to Darwin metro's 68.4% houses and 31.6% other dwellings. Home ownership in Wagaman was 22.4%, similar to Darwin metro. Dwellings were either mortgaged (36.0%) or rented (41.6%). The median monthly mortgage repayment in Wagaman was $1,820, below the Darwin metro average of $2,028. Median weekly rent in Wagaman was $340, compared to Darwin metro's $350. Nationally, Wagaman's mortgage repayments were lower than the Australian average of $1,863, and rents were less than the national figure of $375.
Frequently Asked Questions - Housing
Household Composition
Wagaman features high concentrations of group households, with a higher-than-average median household size
Family households comprise 76.5% of all households, including 37.8% couples with children, 22.1% couples without children, and 14.7% single parent families. Non-family households account for the remaining 23.5%, with lone person households at 16.5% and group households comprising 7.4%. The median household size is 3.0 people, larger than the Greater Darwin average of 2.7.
Frequently Asked Questions - Households
Local Schools & Education
Educational outcomes in Wagaman fall within the lower quartile nationally, indicating opportunities for improvement in qualification attainment
Wagaman trail has 30.1% of residents aged 15 and above with university degrees, compared to the SA3 area's 36.1%. This indicates potential for educational development. Bachelor degrees are most common at 18.4%, followed by postgraduate qualifications (8.7%) and graduate diplomas (3.0%). Vocational credentials are also prevalent, with 29.7% of residents holding them, including advanced diplomas (8.3%) and certificates (21.4%).
Educational participation is high, with 34.1% currently enrolled in formal education. This includes primary education (10.7%), secondary education (8.3%), and tertiary education (8.1%).
Frequently Asked Questions - Education
Schools Detail
Nearby Services & Amenities
Transport
Transport servicing is good compared to other areas nationally based on assessment of service frequency, route connectivity and accessibility
Transport analysis in Wagaman shows seven active public transport stops, operating a mix of bus services. These stops are served by 22 different routes, collectively offering 1,326 weekly passenger trips. Transport accessibility is rated excellent, with residents typically located 166 meters from the nearest stop.
Service frequency averages 189 trips per day across all routes, equating to approximately 189 weekly trips per individual stop.
Frequently Asked Questions - Transport
Transport Stops Detail
Health
Wagaman's residents boast exceedingly positive health performance metrics with very low prevalence of common health conditions across all age groups
Health outcomes data shows excellent results throughout Wagaman, with very low prevalence of common health conditions across all age groups. The rate of private health cover is relatively low at approximately 50% of the total population (around 1,027 people), compared to 56.7% in Greater Darwin and a national average of 55.3%. The most prevalent medical conditions are arthritis and diabetes, affecting 4.9 and 4.8% of residents respectively, while 79.8% report being completely free from medical ailments, compared to 77.0% in Greater Darwin.
In Wagaman, 13.2% of residents are aged 65 and over (271 people), with seniors' health outcomes aligning closely with the general population's profile.
Frequently Asked Questions - Health
Cultural Diversity
Wagaman is among the most culturally diverse areas in the country based on AreaSearch assessment of a range of language and cultural background related metrics
Wagaman has a high cultural diversity, with 46.4% of its population born overseas and 48.0% speaking a language other than English at home. Christianity is the main religion in Wagaman, comprising 47.1% of the population. Hinduism is overrepresented in Wagaman compared to Greater Darwin, making up 8.4% versus 5.1%.
The top three ancestry groups are Other (19.9%), Australian (15.4%), and English (14.5%). Notably, Greek (8.5%) Filipino (7.2%), and Spanish (0.8%) ethnicities are overrepresented in Wagaman compared to regional averages of 3.7%, 4.7%, and 0.5% respectively.
Frequently Asked Questions - Diversity
Age
Wagaman's population is younger than the national pattern
Wagaman's median age is 35 years, comparable to Greater Darwin's average of 34 years and marginally lower than Australia's national average of 38 years. Relative to Greater Darwin, Wagaman has a higher proportion of residents aged 45-54 (13.9%) but fewer residents aged 25-34 (16.4%). According to the post-2021 Census data, the percentage of residents aged 75-84 has increased from 3.2% to 4.4%, while the percentage of those aged 0-4 has decreased from 7.3% to 5.2%. Demographic modeling suggests significant changes in Wagaman's age profile by 2041, with the strongest projected growth in the 45-54 cohort (19%), adding 54 residents to reach a total of 340. The demographic aging trend continues as residents aged 65 and older represent 52% of anticipated population growth. Meanwhile, population declines are projected for the 0-4 and 5-14 age cohorts.
