Chart Color Schemes
This analysis uses ABS Statistical Areas Level 2 (SA2) boundaries, which can materially differ from Suburbs and Localities (SAL) even when sharing similar names.
SA2 boundaries are defined by the Australian Bureau of Statistics and are designed to represent communities for statistical reporting (e.g., census and ERP).
Suburbs and Localities (SAL) represent commonly-used suburb/locality names (postal-style areas) and may use different geographic boundaries. For comprehensive analysis, consider reviewing both boundary types if available.
est. as @ -- *
ABS ERP | -- people | --
2021 Census | -- people
Sales Activity
Curious about local property values? Filter the chart to assess the volume and appreciation (including resales) trends and regional comparisons, or scroll to the map below view this information at an individual property level.
Find a Recent Sale
Sales Detail
Population
An assessment of population growth drivers in Millner reveals an overall ranking slightly below national averages considering recent, and medium term trends
Millner's population, as of November 2025, is approximately 2,635 people. This figure represents an increase of 59 individuals since the 2021 Census, which reported a population of 2,576. The change is inferred from the estimated resident population of 2,635 as of June 2024 and address validation since the Census date. This results in a population density ratio of 1,792 persons per square kilometer, higher than the average seen across national locations assessed by AreaSearch. Overseas migration primarily drove population growth, contributing approximately 69.5% of overall population gains during recent periods.
AreaSearch is adopting ABS/Geoscience Australia projections for each SA2 area, released in 2024 with a base year of 2022. For areas not covered by this data and to estimate growth post-2032, AreaSearch applies growth rates by age cohort to each area, as provided by the ABS in its latest Greater Capital Region projections (released in 2023, based on 2022 data). Future demographic trends suggest a population increase just below the median of statistical areas across the nation. By 2041, the area is expected to expand by 322 persons, reflecting a gain of 12.2% in total over the 17 years, based on the latest annual ERP population numbers.
Frequently Asked Questions - Population
Development
The level of residential development activity in Millner is very low in comparison to the average area assessed nationally by AreaSearch
Millner has seen approximately one new home approval annually over the past five financial years, totalling eight homes. As of 26th June 2021, zero approvals have been recorded in this financial year. The population has fallen during this period, yet development activity has been relatively adequate, which is positive for buyers. New properties are constructed at an average cost of $452,000, indicating a focus on the premium market segment with higher-end properties.
In FY-2021/22, $2.1 million in commercial development approvals have been recorded, suggesting minimal commercial development activity compared to previous years. When measured against Greater Darwin, Millner records significantly lower building activity, 68.0% below the regional average per person. This limited new supply generally supports stronger demand and values for established properties. This level of activity is also below national averages, reflecting the area's maturity and potential planning constraints. New development consists of 50.0% standalone homes and 50.0% townhouses or apartments, focusing on higher-density living to create more affordable entry points for downsizers, investors, and first-home buyers.
According to AreaSearch's latest quarterly estimate, Millner is projected to add 322 residents by 2041. If current construction levels persist, housing supply may lag population growth, likely intensifying buyer competition and underpinning price growth.
Frequently Asked Questions - Development
Infrastructure
Millner has limited levels of nearby infrastructure activity, ranking in the 1stth percentile nationally
AreaSearch has identified two projects that may impact the area: Social Housing Accelerator Payment (SHAP) - Greater Darwin / Nightcliff and John Stokes Square Redevelopment. Other notable projects include Casuarina Square Redevelopment and Darwin Mid Suburbs Area Plan. The following list details those considered most relevant.
Professional plan users can use the search below to filter and access additional projects.
INFRASTRUCTURE SEARCH
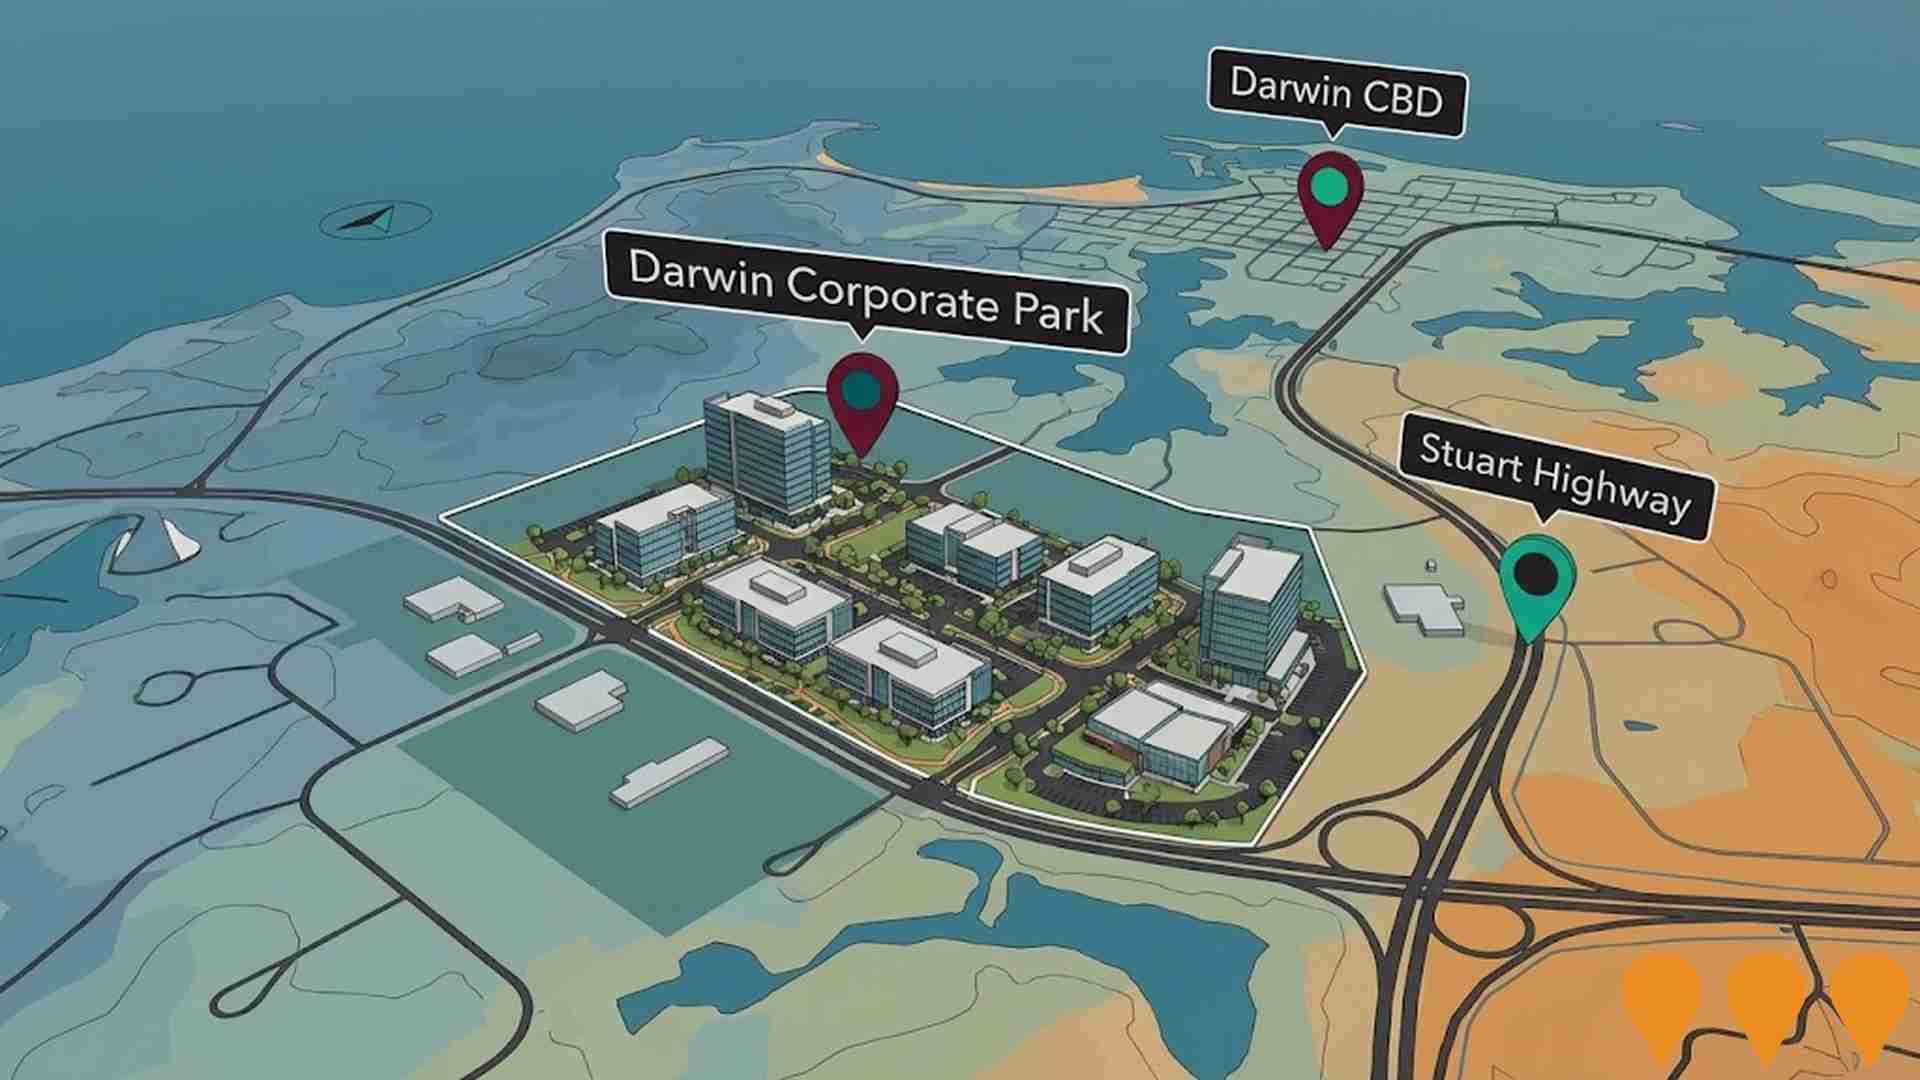
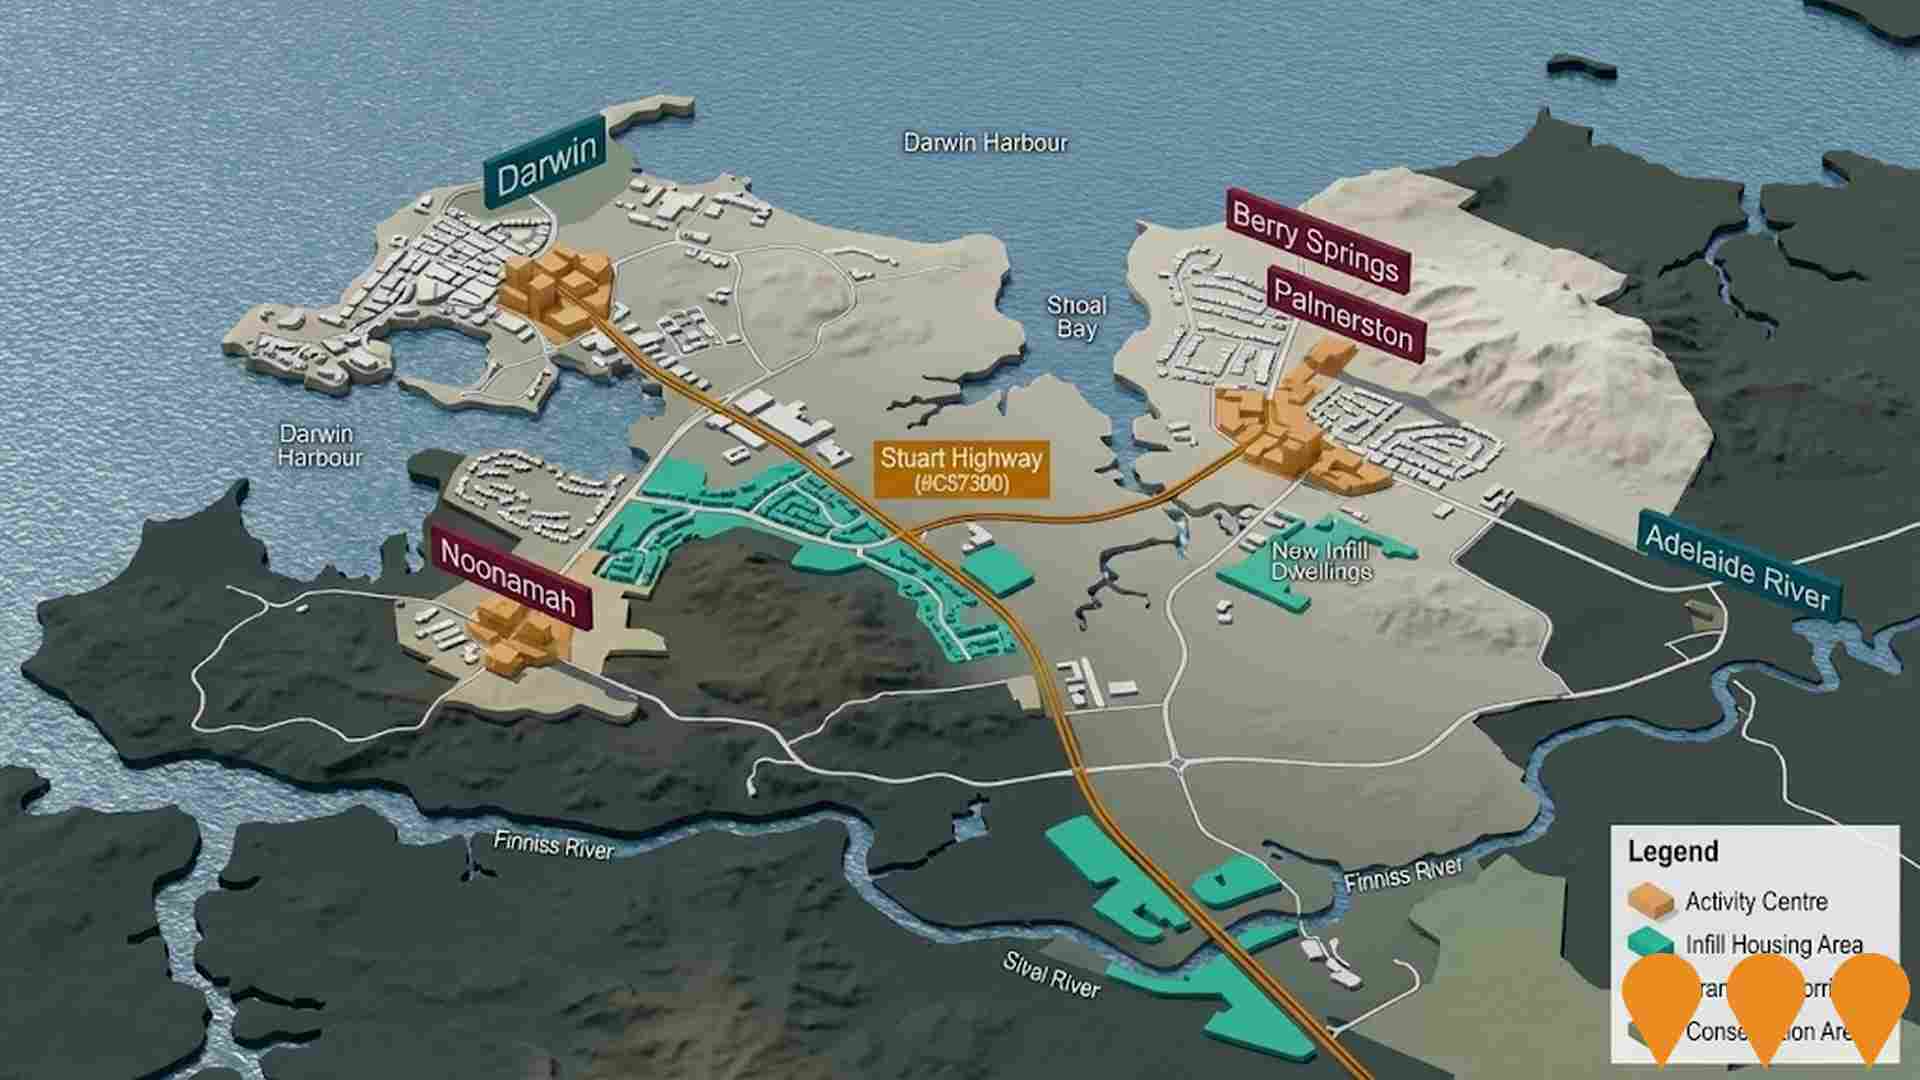
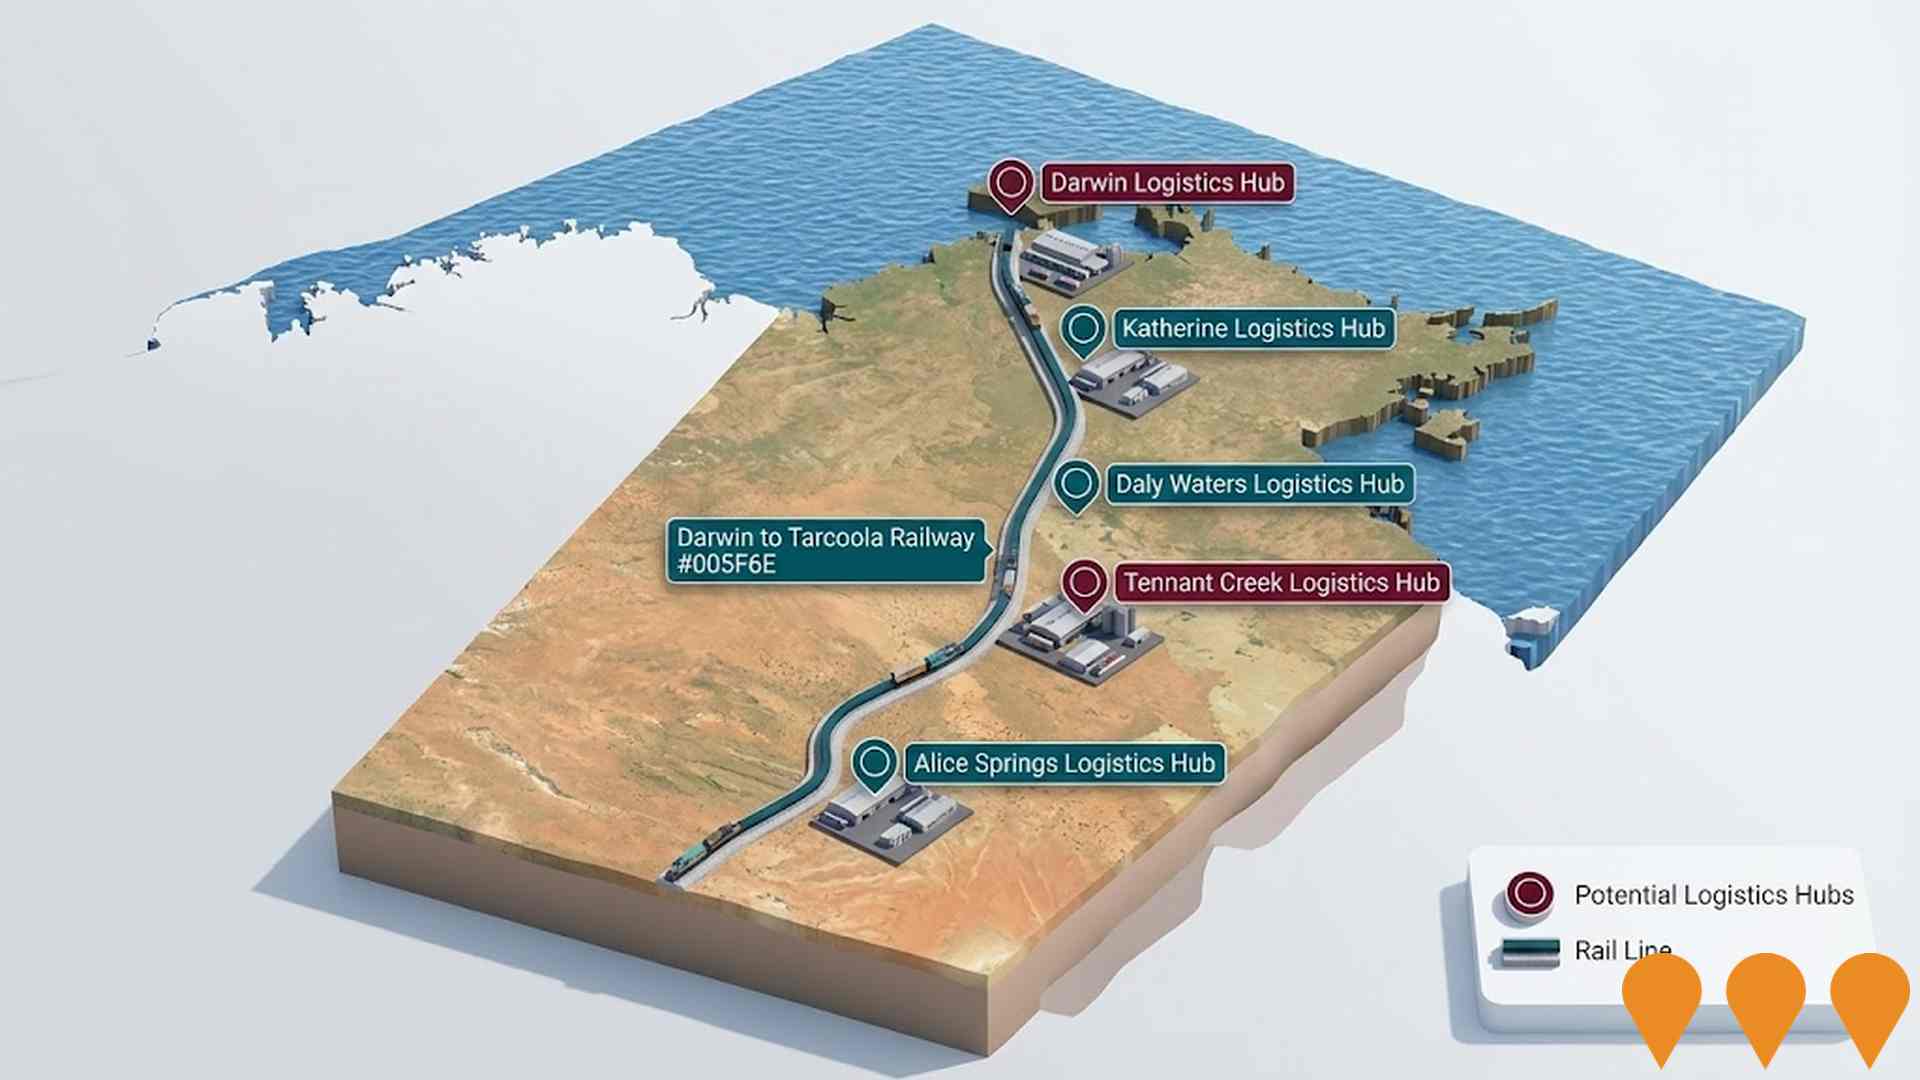
 Denotes AI-based impression for illustrative purposes only, not to be taken as definitive under any circumstances. Please follow links and conduct other investigations from the project's source for actual imagery. Developers and project owners wishing us to use original imagery please Contact Us and we will do so.
Frequently Asked Questions - Infrastructure
Royal Darwin Hospital Mental Health Inpatient Unit and CSSD Upgrade
New three-storey mental health inpatient facility at Royal Darwin Hospital providing 18 acute inpatient beds plus a 6-bed Stabilisation Assessment and Referral Area (SARA), connected to the Emergency Department via an elevated enclosed walkway. Project also includes major upgrades to the Central Sterile Services Department (CSSD). Managing Contractor: Sitzler Pty Ltd. Works commenced in 2023 with practical completion expected mid-2025.

Australia-Asia PowerLink (AAPowerLink)
The world's largest renewable energy infrastructure project, comprising a 17-20GW solar farm and 36-42GWh battery storage in the Barkly Region, connected via HVDC transmission to Darwin and Singapore. The project received Commonwealth environmental approval in August 2024. It aims to supply up to 4GW of green electricity to Darwin industrial customers and export power to Singapore.

John Stokes Square Redevelopment
The John Stokes Square redevelopment in Nightcliff has transformed an aging public housing estate into a mixed use social housing and community precinct. Delivered by the Northern Territory Government, the project provides a new Nightcliff Police Station, 78 purpose built social housing units for seniors and people living with disability, improved public open space and landscaping, and a pedestrian friendly link between Nightcliff Village and Nightcliff Shopping Centre. Construction of the police station finished in 2021 and the social housing towers were completed in 2023, with tenants now moving in and community housing provider Venture Housing managing the complex.

Enabling Digital Health Services for Regional and Remote Australia
National initiative to expand and improve digital health access for people in regional and remote Australia. Focus areas include enabling telehealth and virtual care, upgrading clinical systems and connectivity, supporting secure information exchange, and building workforce capability in digital health, aligned with the Australian Government's Digital Health Blueprint and Action Plan 2023-2033.

Desert Springs Octopus Renewable Energy Program
Majority Indigenous-owned developer pursuing a near-term pipeline of grid-connected solar and battery projects along the Darwin-Katherine Electricity System, with potential to expand into wind and green hydrogen. Partnership includes Octopus Australia with Larrakia Nation and Jawoyn Association to deliver utility-scale renewable energy and community benefit sharing.

Marine Industry Park
Marine and offshore industries servicing hub at East Arm, Darwin. Stage 1 planning approval is secured for a purpose-built industrial subdivision near the new Darwin Ship Lift, with expressions of interest open for serviced lots. Existing common-user facilities include an all-tide barge ramp (first point of entry) and a secure hardstand supporting storage and fabrication activities.

Hudson Creek Power Station
12MW natural gas-fired power plant, NT's first privately owned grid-connected gas generation facility. Features 25% lower emissions than average NT gas generators. Part of dual project with Batchelor Solar Farm, creating 162 construction jobs and providing vital grid stability to Darwin-Katherine network.

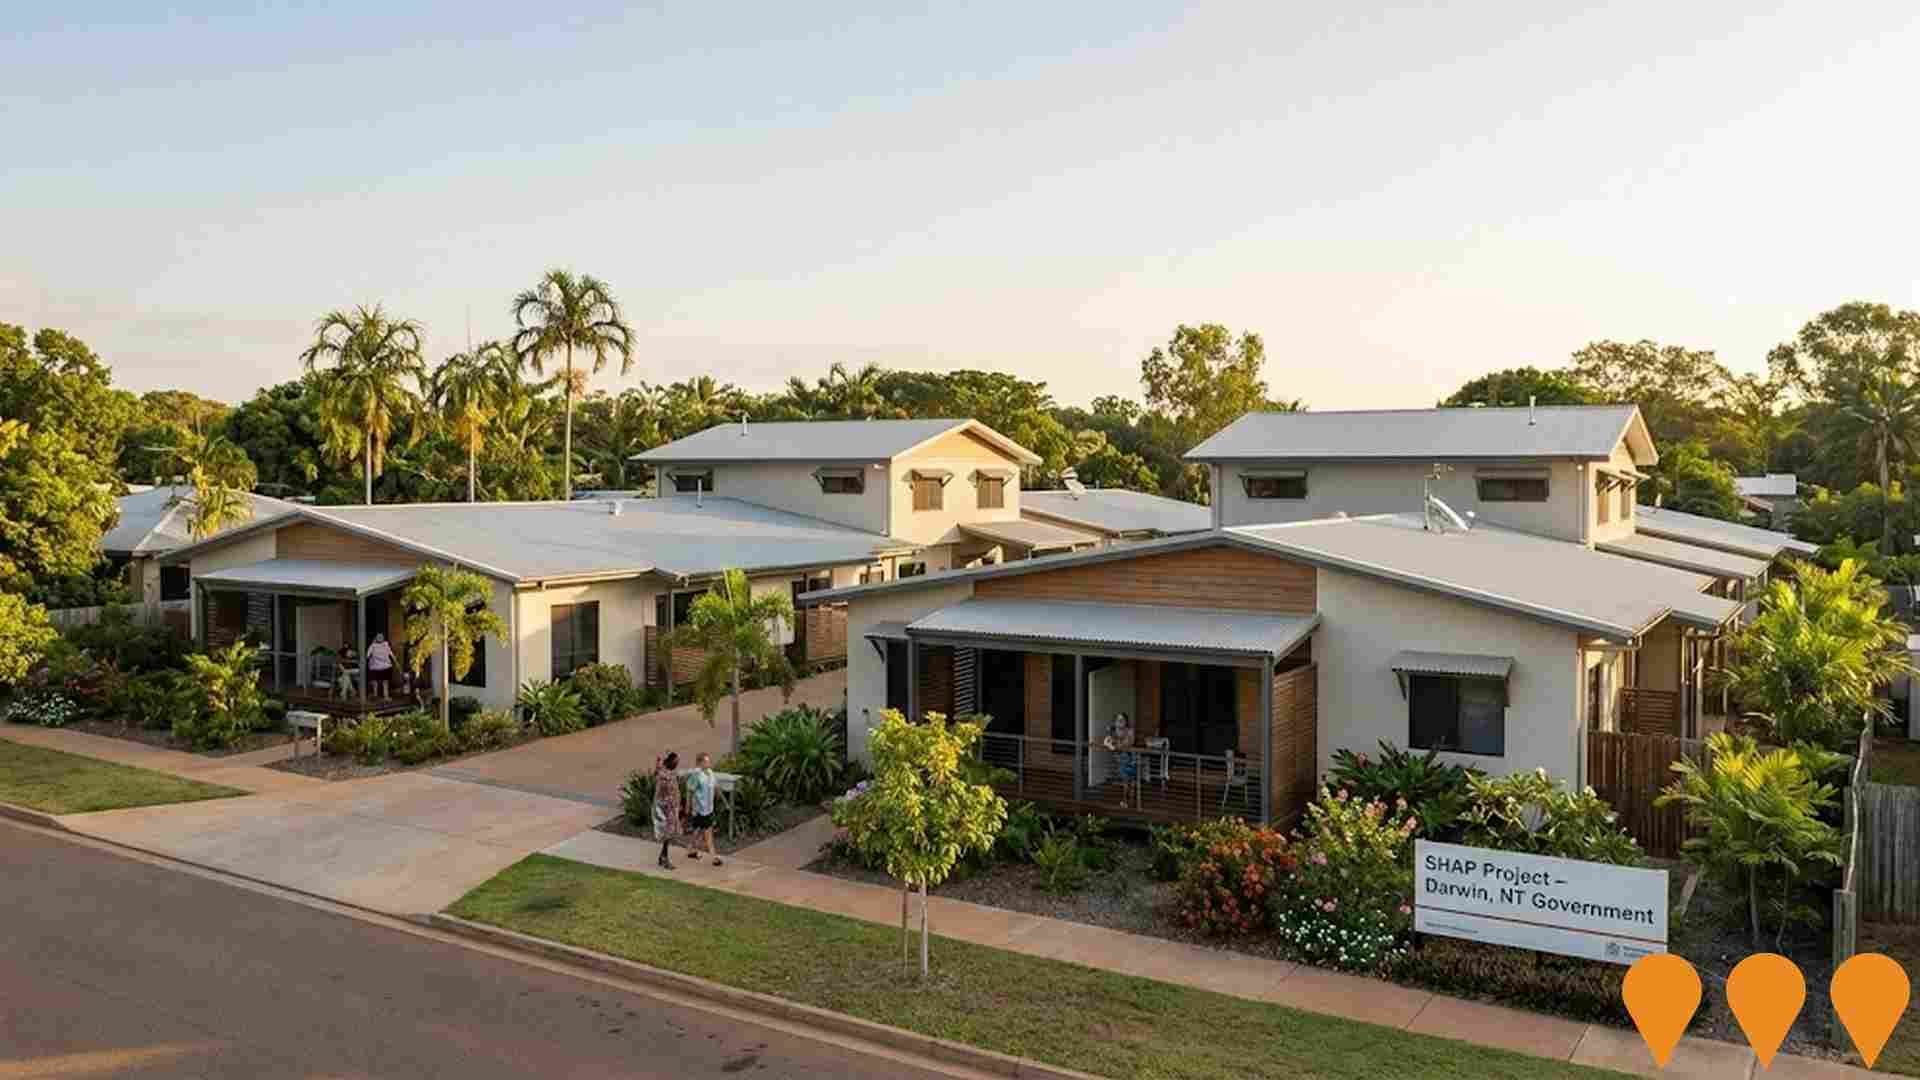
Social Housing Accelerator Payment (SHAP) - Greater Darwin / Nightcliff
Commonwealth-funded SHAP program delivering up to 100 new social and accessible homes across Greater Darwin, Katherine, Tennant Creek and Alice Springs. In Darwin's northern suburbs (including around Nightcliff), the NT Government commenced works in October 2024 with the first eight homes on vacant lots in Rapid Creek, Tiwi and Wanguri. Homes are being built to adaptable standards to better suit local climate and accessibility needs.
Employment
The employment environment in Millner shows above-average strength when compared nationally
Millner has an educated workforce with strong representation in essential services sectors. Its unemployment rate is 3.3%, and it experienced a 1.7% employment growth over the past year as of September 2025.
At this time, 1,562 residents are employed while the unemployment rate is 0.1% higher than Greater Darwin's rate of 3.1%. Workforce participation in Millner is lower at 67.1%, compared to Greater Darwin's 69.7%. The dominant employment sectors among residents include health care & social assistance, public administration & safety, and education & training. Health care & social assistance has a particularly strong presence with an employment share of 1.5 times the regional level, while public administration & safety has limited presence at 13.3% compared to the regional level of 19.5%.
The area appears to offer limited local employment opportunities based on Census data comparisons between working population and resident population. Over the year to September 2025, employment increased by 1.7%, labour force by 1.8%, resulting in a slight unemployment rise of 0.1 percentage points. Greater Darwin recorded similar employment growth of 1.9% during this period. State-level data from November 2025 shows NT employment contracted by 1.13%, with an unemployment rate of 4.4%, closely aligned with the national rate of 4.3%. National employment forecasts from May 2025 project a 6.6% increase over five years and 13.7% over ten years. Applying these projections to Millner's employment mix suggests local employment should increase by 6.9% over five years and 14.2% over ten years, though this is a simplified extrapolation for illustrative purposes only.
Frequently Asked Questions - Employment
Income
Income analysis reveals strong economic positioning, with the area outperforming 60% of locations assessed nationally by AreaSearch
AreaSearch aggregated latest postcode level ATO data released for financial year 2022. Millner SA2 had a median taxpayer income of $57,384 and an average income of $66,829, both slightly above national averages of $65,522 and $75,260 respectively in Greater Darwin. As of September 2025, estimated incomes are approximately $64,276 (median) and $74,855 (average), based on a 12.01% Wage Price Index growth since financial year 2022. Census data shows personal income ranks at the 74th percentile ($957 weekly) and household income at the 54th percentile. Income distribution reveals that 39.4% (1,038 individuals) earn between $1,500 - 2,999, similar to surrounding regions at 36.7%. High housing costs consume 15.4% of income, but disposable income ranks at the 55th percentile. Millner SA2's SEIFA income ranking places it in the 4th decile.
Frequently Asked Questions - Income
Housing
Millner displays a diverse mix of dwelling types, with above-average rates of outright home ownership
Millner's dwelling structure, as recorded in the latest Census, consisted of 52.5% houses and 47.5% other dwellings such as semi-detached homes, apartments, and 'other' dwellings. This contrasts with Darwin metro's dwelling structure, which was 68.4% houses and 31.6% other dwellings. Home ownership in Millner stood at 22.6%, similar to Darwin metro's level. The remaining dwellings were either mortgaged (28.9%) or rented (48.5%). The median monthly mortgage repayment in Millner was $1,733, lower than the Darwin metro average of $2,028. The median weekly rent figure for Millner was recorded at $340, compared to Darwin metro's $350. Nationally, Millner's mortgage repayments were below the Australian average of $1,863, and rents were less than the national figure of $375.
Frequently Asked Questions - Housing
Household Composition
Millner features high concentrations of group households, with a lower-than-average median household size
Family households account for 64.8% of all households, including 26.9% couples with children, 21.6% couples without children, and 14.3% single parent families. Non-family households constitute the remaining 35.2%, with lone person households making up 27.3% and group households comprising 8.1%. The median household size is 2.4 people, which is smaller than the Greater Darwin average of 2.7.
Frequently Asked Questions - Households
Local Schools & Education
Educational outcomes in Millner fall within the lower quartile nationally, indicating opportunities for improvement in qualification attainment
In Millner, residents aged 15 and above have a higher proportion of university qualifications compared to broader benchmarks: 38.7% versus 27.3% in the Northern Territory (NT) and 30.4% in Australia overall. This educational advantage is evident across various qualification levels, with bachelor degrees being the most common at 23.2%, followed by postgraduate qualifications at 11.8% and graduate diplomas at 3.7%. Vocational credentials are also prevalent, with 29.2% of residents holding such qualifications. This includes advanced diplomas (9.5%) and certificates (19.7%).
Educational participation is notably high in Millner, with 33.2% of residents currently enrolled in formal education programs. This includes primary education (9.8%), tertiary education (8.5%), and secondary education (5.9%).
Frequently Asked Questions - Education
Schools Detail
Nearby Services & Amenities
Transport
Transport servicing is high compared to other areas nationally based on assessment of service frequency, route connectivity and accessibility
Millner has 16 active public transport stops operating within its boundaries. These stops are served by a mix of buses along 33 individual routes. Together, these routes facilitate 1,774 weekly passenger trips.
The accessibility of transport in Millner is rated as excellent, with residents located an average of 153 meters from the nearest transport stop. On average, there are 253 trips per day across all routes, which equates to approximately 110 weekly trips per individual stop.
Frequently Asked Questions - Transport
Transport Stops Detail
Health
Millner's residents are extremely healthy with very low prevalence of common health conditions across all age groups
Analysis of health metrics shows strong performance throughout Millner. Prevalence of common health conditions is very low across all age groups.
Private health cover rate is approximately 52% of the total population (~1,380 people), leading that of the average SA2 area but slightly lower than Greater Darwin's 56.7%. The most common medical conditions are arthritis and mental health issues, impacting 6.5% and 5.7% of residents respectively. 76.9% of residents declare themselves completely clear of medical ailments, similar to the 77.0% across Greater Darwin. Millner has 11.8% of residents aged 65 and over (311 people). Health outcomes among seniors are particularly strong, broadly in line with the general population's health profile.
Frequently Asked Questions - Health
Cultural Diversity
Millner is among the most culturally diverse areas in the country based on AreaSearch assessment of a range of language and cultural background related metrics
Millner has a high cultural diversity, with 41.7% of its population born overseas and 40.8% speaking a language other than English at home. Christianity is the predominant religion in Millner, comprising 39.2% of people. Hinduism is notably overrepresented at 10.5%, compared to the Greater Darwin average of 5.1%.
The top three ancestral groups are Other (21.3%), Australian (17.7%), and English (17.7%). Filipino, Spanish, and Greek ethnicities show notable divergences in representation: Filipino is overrepresented at 5.3%, Spanish at 0.9%, and Greek at 3.9%.
Frequently Asked Questions - Diversity
Age
Millner's population is slightly younger than the national pattern
Millner's median age is 36, slightly higher than Greater Darwin's 34 but lower than Australia's 38 years. Compared to Greater Darwin, Millner has a higher proportion of residents aged 55-64 (13.5%) but fewer residents aged 15-24 (9.6%). Between the 2021 Census and now, the 55 to 64 age group has grown from 10.8% to 13.5%, while the 35 to 44 cohort increased from 15.3% to 16.8%. Conversely, the 45 to 54 cohort declined from 13.8% to 10.7%, and the 65 to 74 group dropped from 8.0% to 6.5%. By 2041, Millner's population is forecasted to see substantial demographic changes. The 35 to 44 cohort is projected to grow by 16%, adding 69 residents to reach 512. Meanwhile, the 0 to 4 cohort grows by a modest 4% (adding 5 people).
