Chart Color Schemes
This analysis uses Suburbs and Localities (SAL) boundaries, which can materially differ from Statistical Areas (SA2) even when sharing the same name.
SAL boundaries are defined by Australia Post and the Australian Bureau of Statistics to represent commonly-known suburb names used in postal addresses.
Statistical Areas (SA2) are designed for census data collection and may combine multiple suburbs or use different geographic boundaries. For comprehensive analysis, consider reviewing both boundary types if available.
est. as @ -- *
2021 Census | -- people





Sales Activity


Curious about local property values? Filter the chart to assess the volume and appreciation (including resales) trends and regional comparisons, or scroll to the map below view this information at an individual property level.
Find a Recent Sale

Sales Detail
Population
Lyons has seen population growth performance typically on par with national averages when looking at short and medium term trends
In the suburb of Lyons (NT), evaluation of ABS population updates for the wider region alongside new addresses verified by AreaSearch since the Census points to an estimated population of 2,547 as of May 2026. This represents a rise of 328 people (14.8%) from the 2021 Census, when the count stood at 2,219 residents. This variation is derived from the resident population of 2,547, calculated by AreaSearch using the latest ERP data release from the ABS (June 2025) plus an additional 1 verified new address post-Census. Such a population level translates to a density ratio of 2,625 persons per square kilometer, placing the suburb in the top quartile of all national areas evaluated by AreaSearch. The 14.8% expansion in the suburb of Lyons (NT) since the 2021 census was faster than the national average (9.3%) and the SA3 region, positioning the locality as a regional leader in growth. Population increases in the area were chiefly driven by natural increase, which made up approximately 55.00000000000001% of total population additions in recent times, though other components such as overseas and interstate migration also registered gains.
AreaSearch utilizes ABS/Geoscience Australia projections for each SA2 area, which were published in 2024 using 2022 as the base year. For any SA2 regions lacking this information, and to project growth across all areas after 2032, AreaSearch applies cohort-specific growth rates for each age group, derived from the latest ABS Greater Capital Region projections (published in 2023, using 2022 data). Looking at future demographic changes, a significant population rise within the top quartile of statistical areas nationally is anticipated, with the suburb of Lyons (NT) projected to add 657 persons by 2041 based on compiled SA2 projections, representing an overall increase of 25.8% across the 16 years.
Frequently Asked Questions - Population
Development
Residential development activity is lower than average in Lyons according to AreaSearch's national comparison of local real estate markets
According to AreaSearch analysis of ABS building approvals allocated from statistical area data, Lyons has experienced almost no home approvals in recent times, with an estimated 4 homes approved during the past 5 financial years (between FY-21 and FY-25) and 3 to date in FY-26. With an average of 36.5 new residents annually for each home constructed over the past 5 financial years (between FY-21 and FY-25), demand outstrips new supply by a wide margin, which commonly triggers price escalation and heightened competition among purchasers, while new properties are built with an average value of $635,000, indicating developer activity concentrated in the upmarket premium sector. Furthermore, commercial approvals worth $107,000 have been logged during this financial year, highlighting the predominantly residential character of the neighborhood.
Relative to Greater Darwin, building activity in Lyons is substantially lower, sitting at 82.0% below the regional per capita average. This shortage of new homes generally bolsters demand and values for existing stock. This rate is similarly lower than the national benchmark, indicating a mature market and highlighting potential development restrictions. Moreover, recent construction has consisted entirely of detached houses, preserving the traditional suburban atmosphere with an emphasis on family properties that attract those wanting space. Interestingly, builders are constructing a higher proportion of traditional houses than the census baseline (82.0% at Census), showing ongoing robust demand for family houses despite pressures for higher density. With approximately 4981 people per dwelling approval, Lyons displays a highly mature market.
Frequently Asked Questions - Development
Development applications around Lyons (NT)
Loading development applications…
| Lodged | Address | Description | Type | Distance | Status |
|---|
SOURCE: Planning portals and council registers, compiled by AreaSearch. Distance & bearing measured from the suburb midpoint.
Infrastructure
Lyons has limited levels of nearby infrastructure activity, ranking in the 14thth percentile nationally
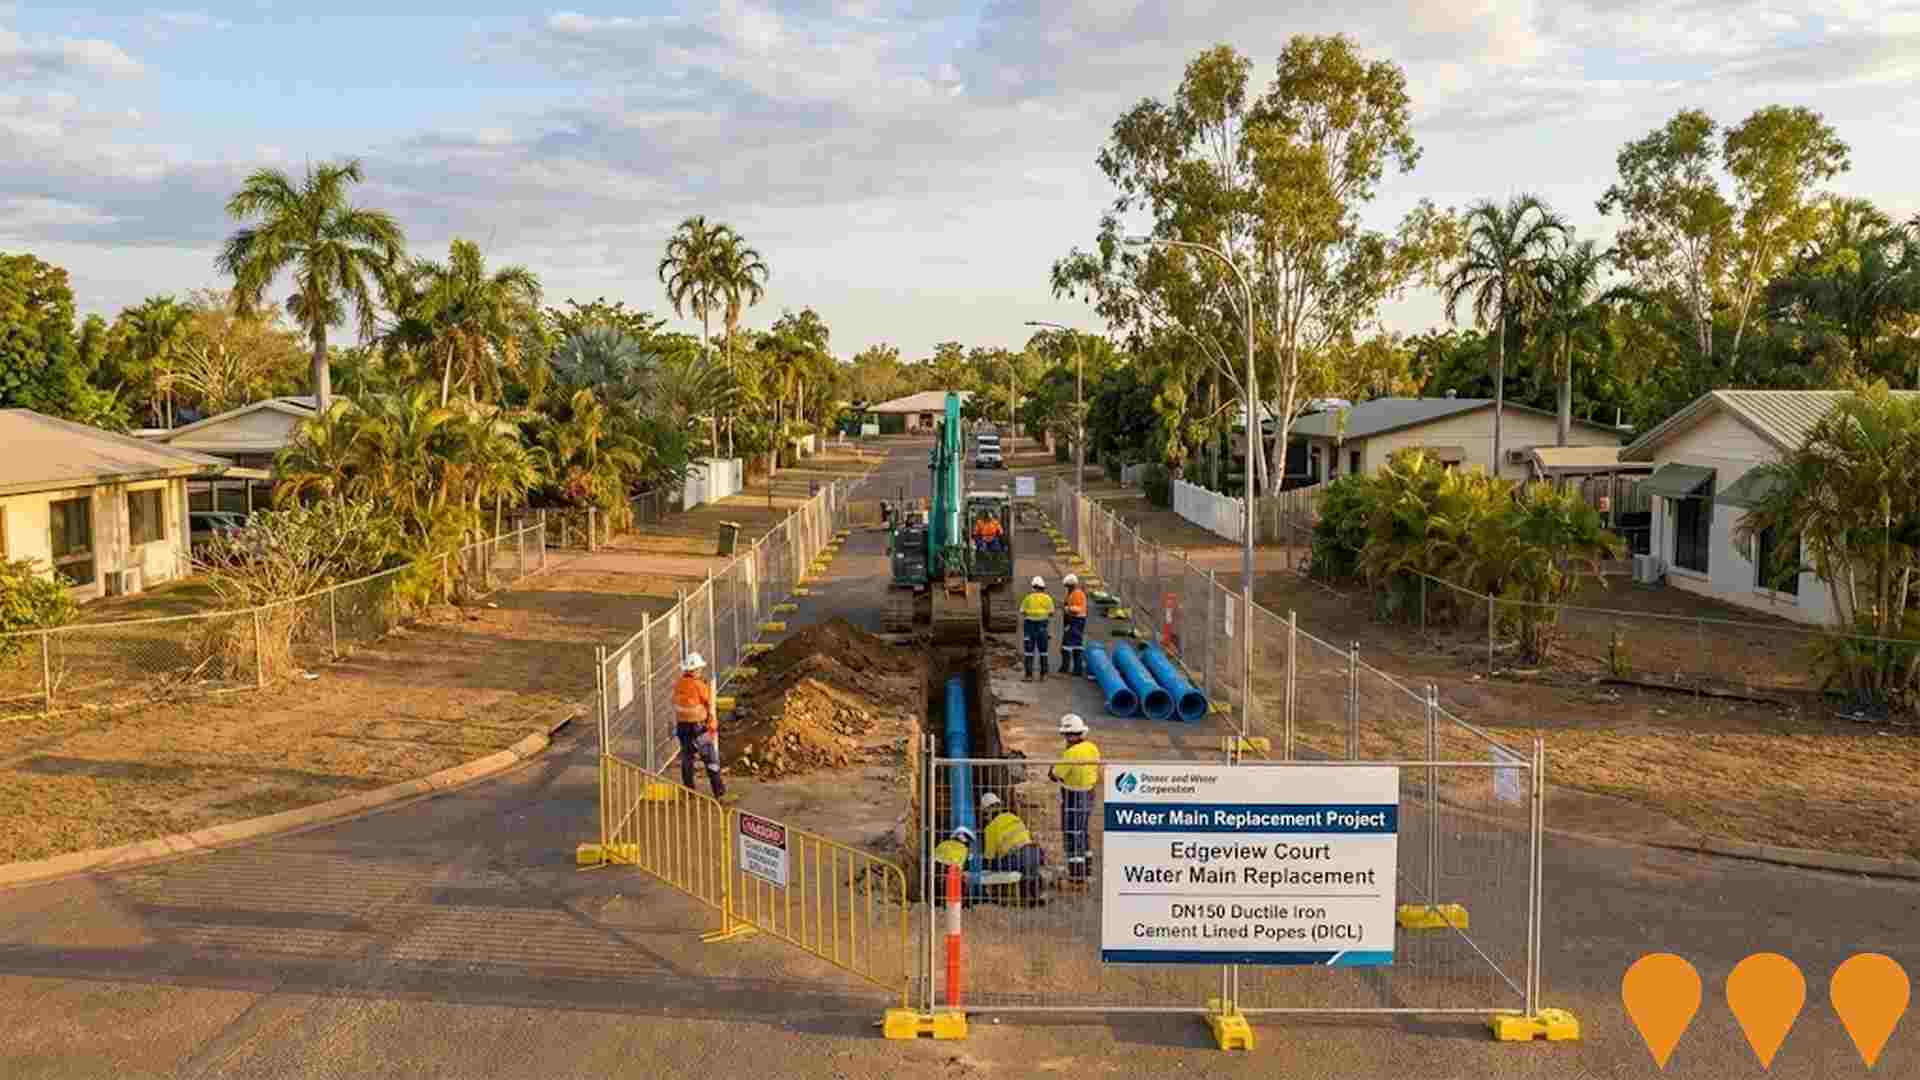
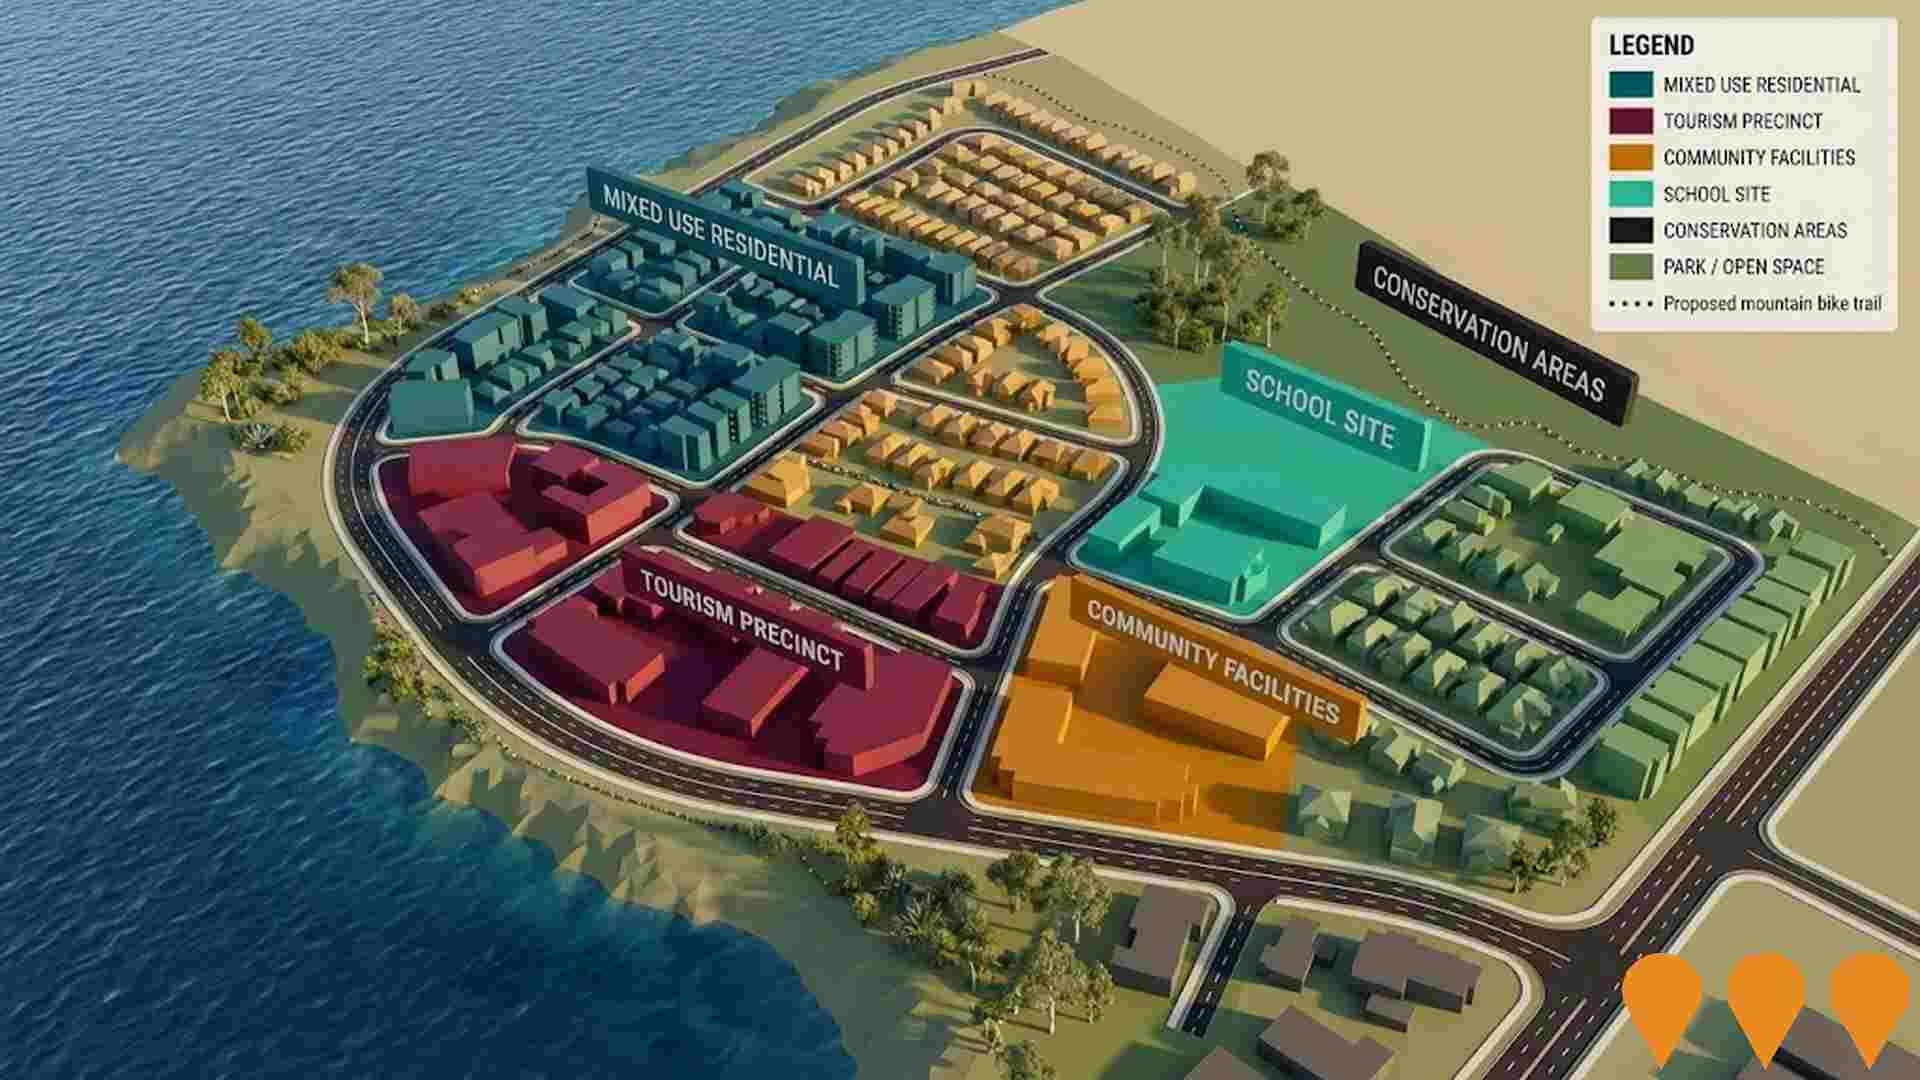
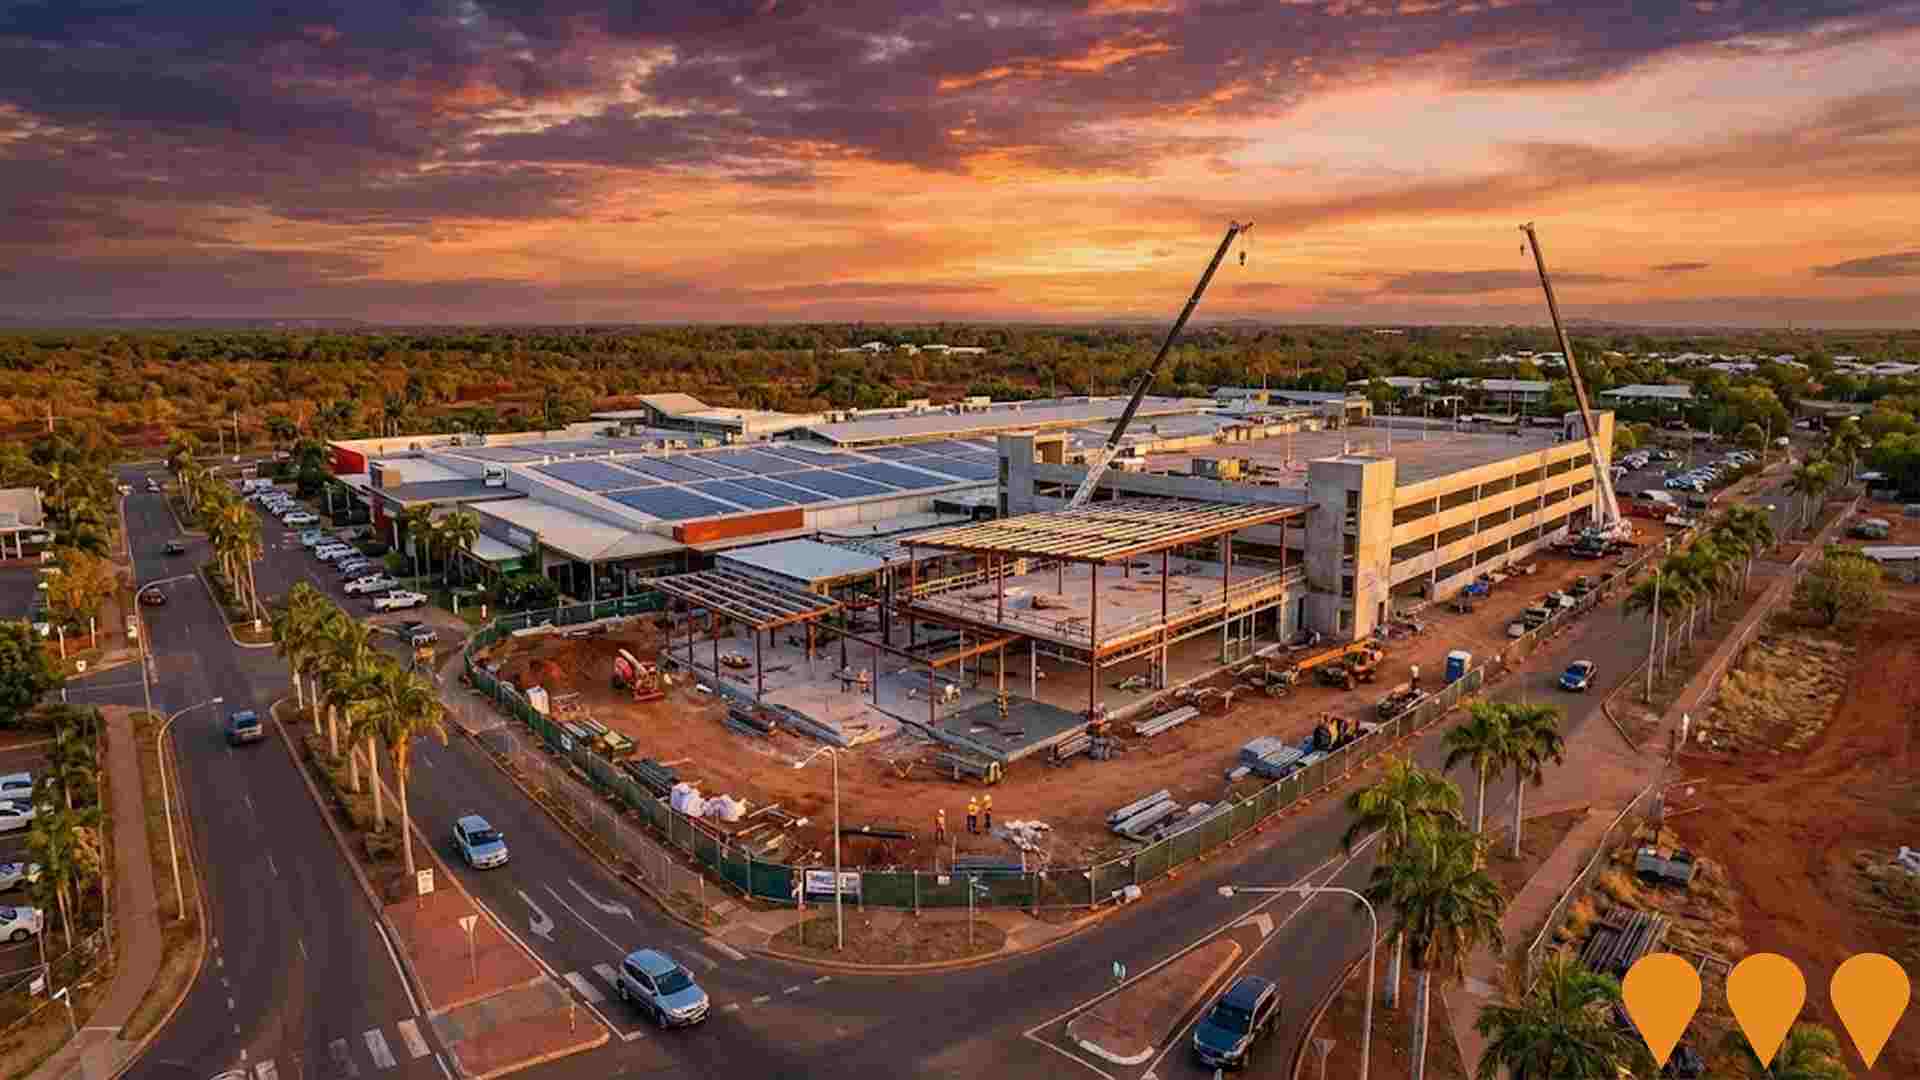
Changes to local infrastructure, major developments, and planning initiatives significantly shape regional performance. AreaSearch has identified a total of 2 projects that are expected to impact the local area. The most relevant projects include the Royal Darwin Hospital Mental Health Inpatient Unit and CSSD Upgrade, the Edgeview Court Water Main Replacement, the Lee Point Master-planned Urban Development, and the Casuarina Square Redevelopment.
Professional plan users can use the search below to filter and access additional projects.
INFRASTRUCTURE SEARCH
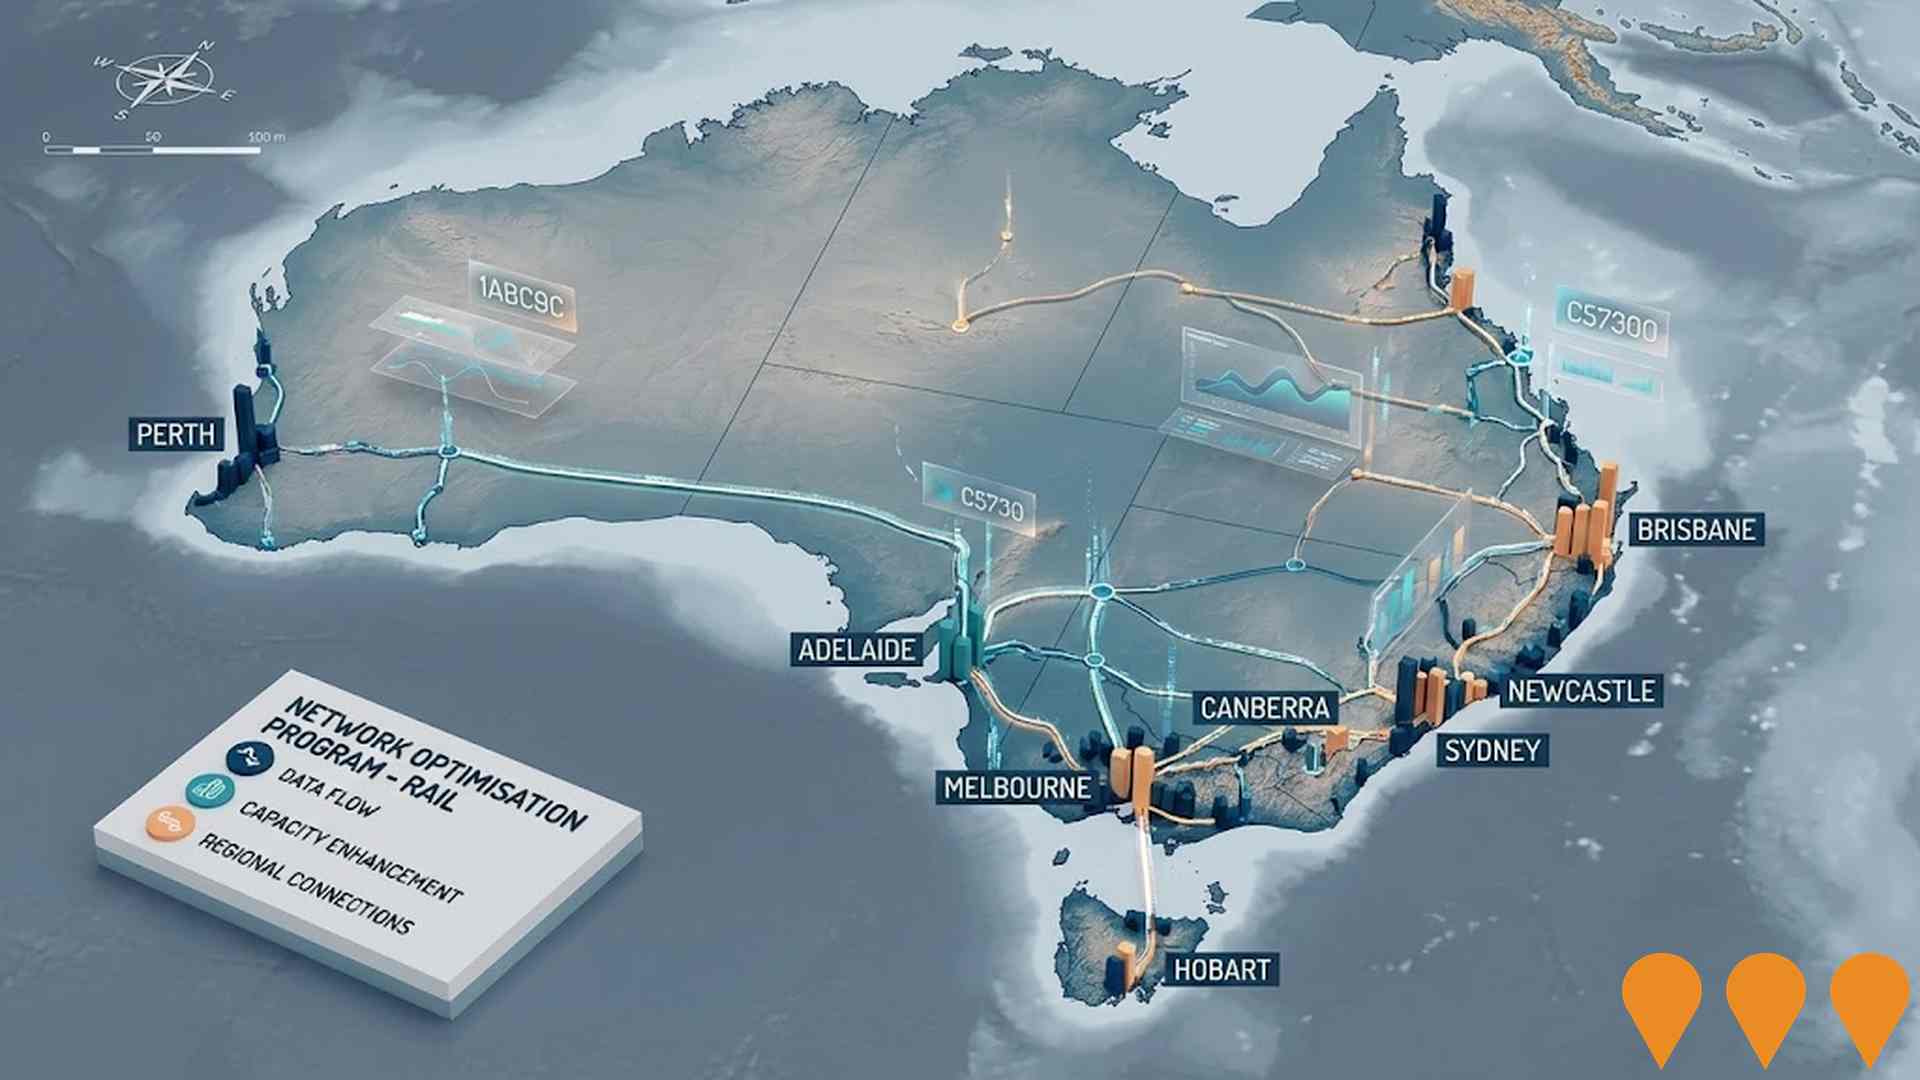
 Denotes AI-based impression for illustrative purposes only, not to be taken as definitive under any circumstances. Please follow links and conduct other investigations from the project's source for actual imagery. Developers and project owners wishing us to use original imagery please Contact Us and we will do so.
Frequently Asked Questions - Infrastructure
Australia-Asia PowerLink (AAPowerLink)
SunCable's AAPowerLink is a large renewable generation, battery storage and HVDC transmission project in the Northern Territory. The project has major environmental approvals from the Northern Territory and Australian governments, conditional Singapore approval to import 1.75 GW from 2035, Indonesian subsea permits, a Singapore-Australia cross-border electricity trade framework and a 70-year Indigenous Land Use Agreement for Powell Creek. It is being staged to supply industrial customers in the Barkly region from the late 2020s, Darwin from the early 2030s, and Southeast Asia from the mid-2030s, with final investment decision targeted for 2027.

Royal Darwin Hospital Mental Health Inpatient Unit and CSSD Upgrade
Construction of a new three-storey mental health inpatient facility providing 18 acute inpatient beds and a 6-bed Stabilisation Assessment and Referral Area (SARA). The unit connects to the Emergency Department via an elevated enclosed walkway across Nightingale Road. Internal fitout is currently underway as of May 2026. The project also encompasses upgrades to the Central Sterile Services Department (CSSD) to meet modern reprocessing standards and clinical safety requirements.

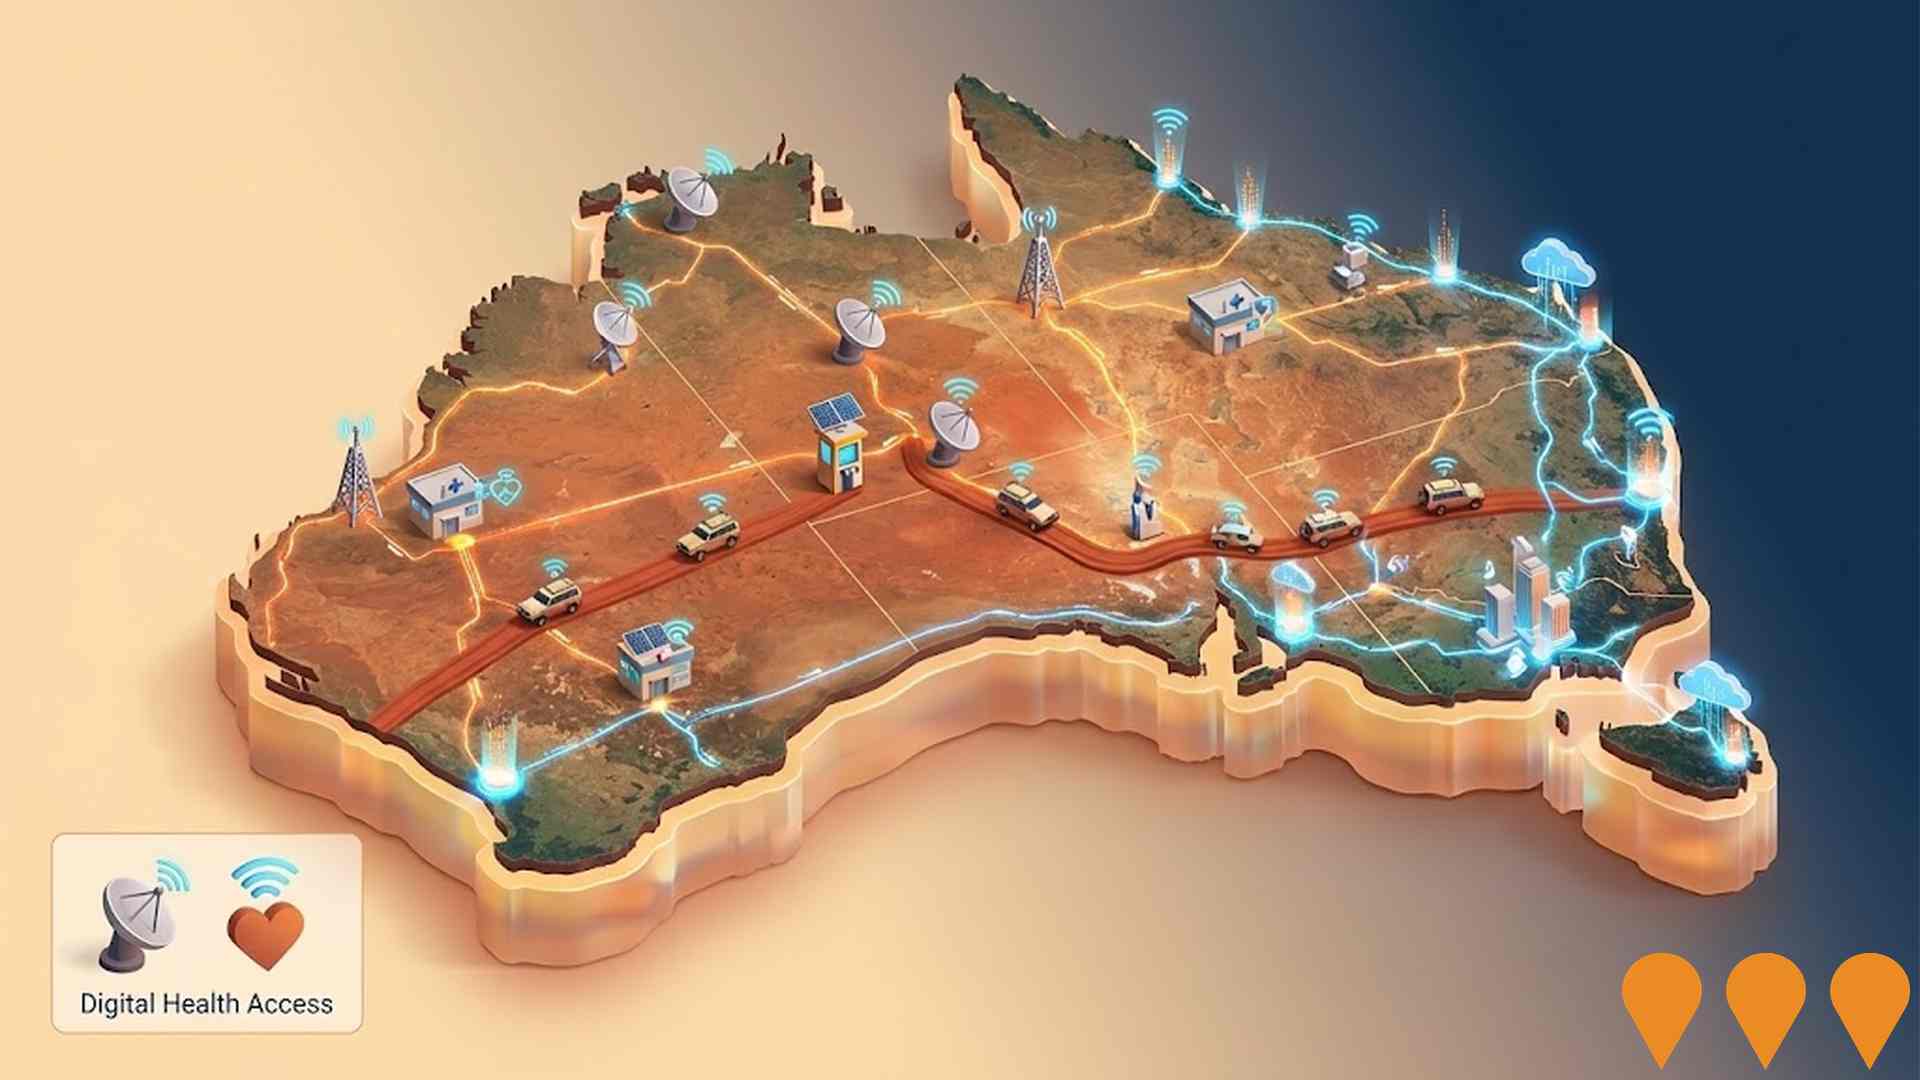
Enabling Digital Health Services for Regional and Remote Australia
A national digital infrastructure program under the Digital Health Blueprint 2023-2033 designed to provide equitable healthcare access for regional and remote Australians. The initiative is currently rolling out the 'Share by Default' legislative framework, which mandates the uploading of pathology and diagnostic imaging reports to My Health Record starting July 2026. Current 2026 milestones include the launch of the Digital Health Implementer Hub to accelerate software conformance and the implementation of the National Allied Health Digital Uplift Plan to integrate allied health practitioners into the national digital ecosystem.
Desert Springs Octopus Renewable Energy Program
Majority Indigenous-owned developer pursuing a near-term pipeline of grid-connected solar and battery projects along the Darwin-Katherine Electricity System, with potential to expand into wind and green hydrogen. Partnership includes Octopus Australia with Larrakia Nation and Jawoyn Association to deliver utility-scale renewable energy and community benefit sharing.

Hudson Creek Power Station
12MW natural gas-fired power plant, NT's first privately owned grid-connected gas generation facility. Features 25% lower emissions than average NT gas generators. Part of dual project with Batchelor Solar Farm, creating 162 construction jobs and providing vital grid stability to Darwin-Katherine network.

Marine Industry Park
Marine and offshore industries servicing hub at East Arm, Darwin. Stage 1 planning approval is secured for a purpose-built industrial subdivision near the new Darwin Ship Lift, with expressions of interest open for serviced lots. Existing common-user facilities include an all-tide barge ramp (first point of entry) and a secure hardstand supporting storage and fabrication activities.

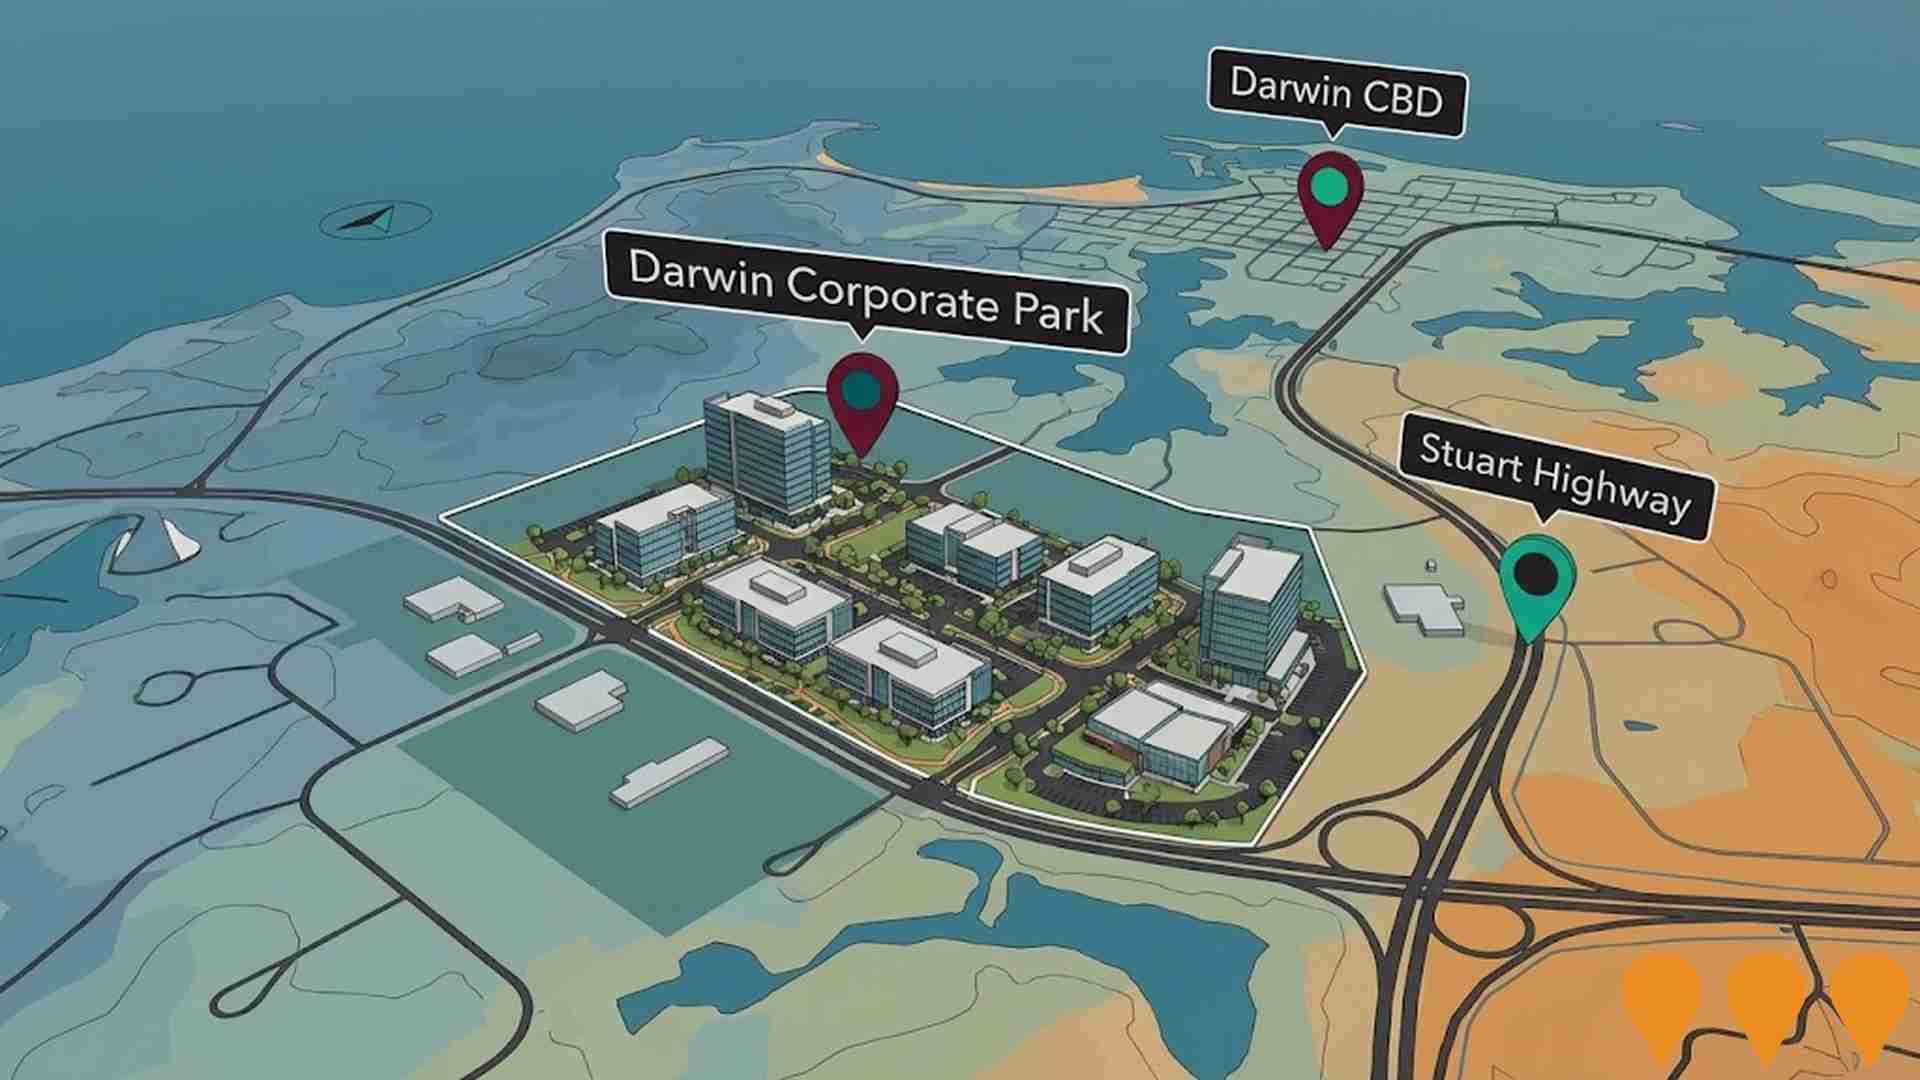
Darwin Corporate Park
Darwin Corporate Park is a premier business park for mixed use commercial office space located in what is now recognised as the centre of greater Darwin.
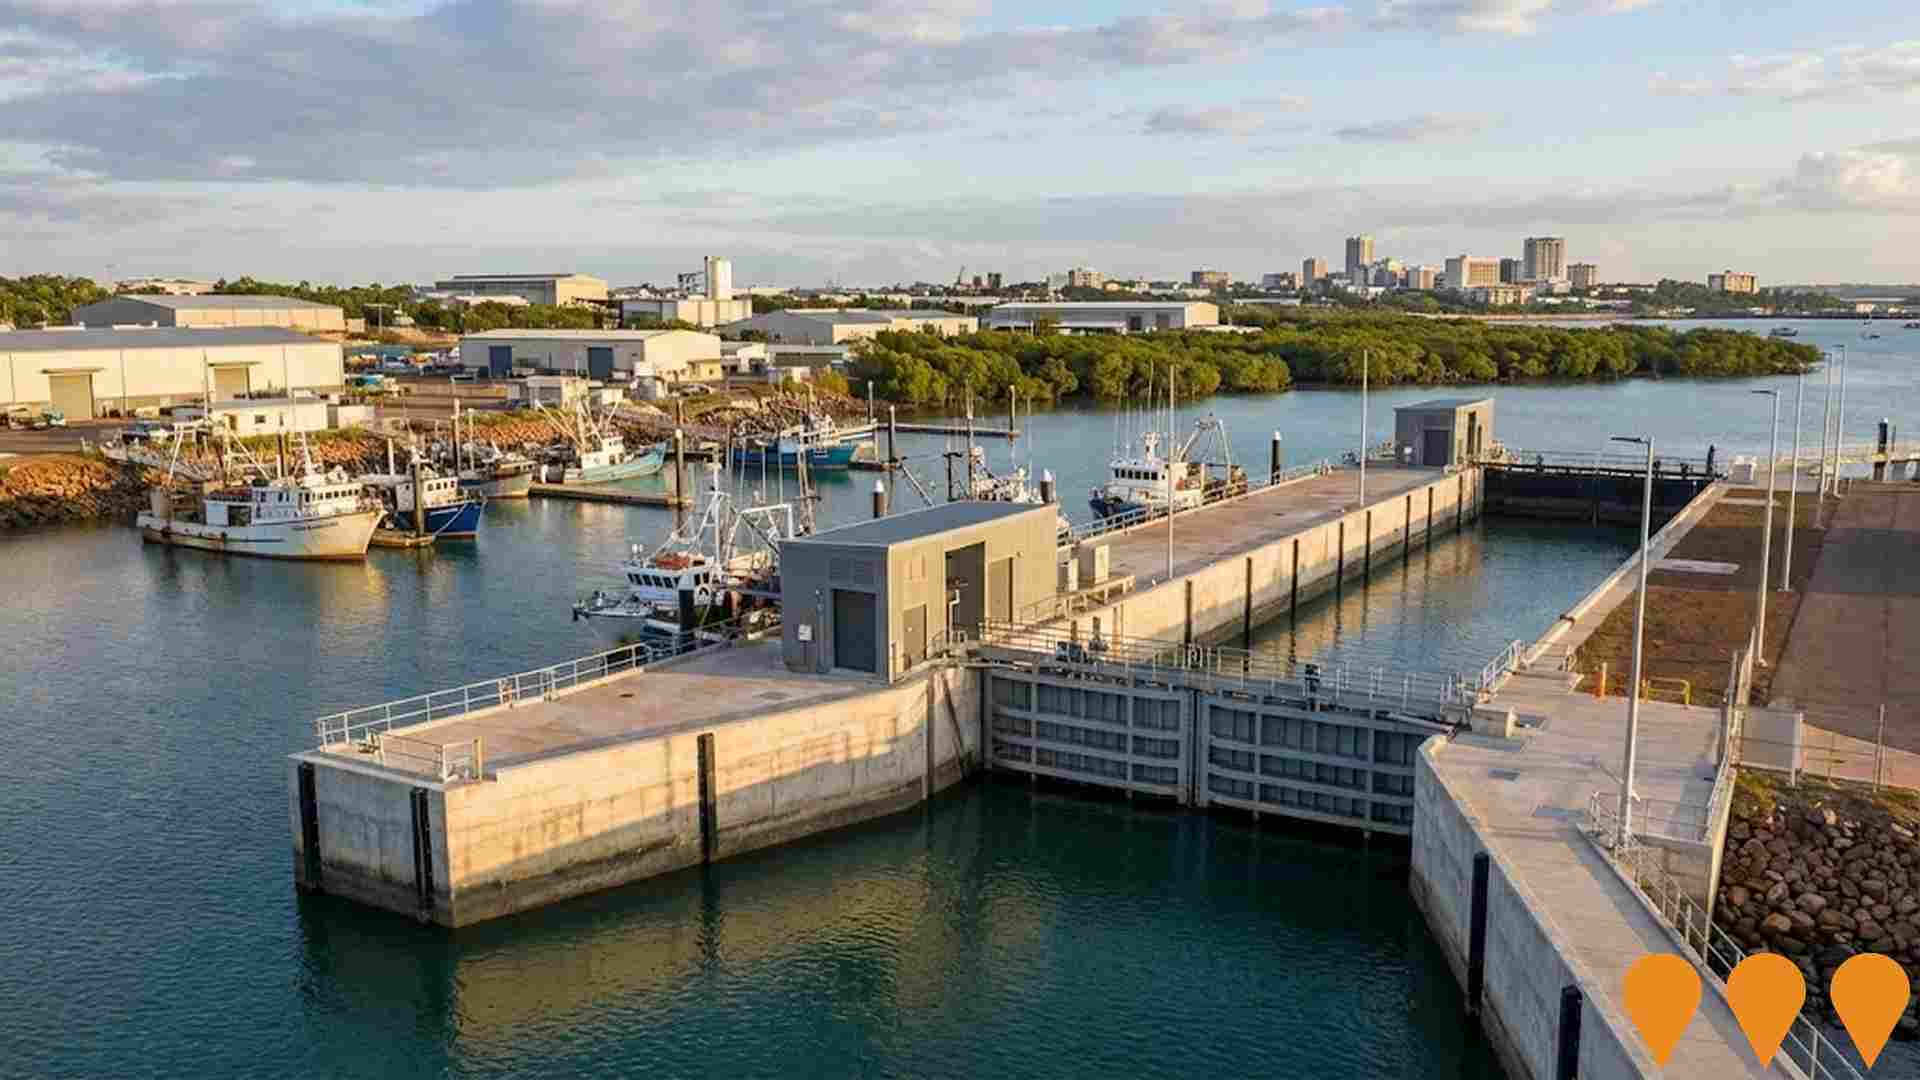
Frances Bay Mooring Basin lock upgrade
The Northern Territory Government has completed a $20 million upgrade of the Frances Bay Mooring Basin lock. The upgrade includes delivering new lock doors, modernising mechanical and electrical systems, and extending the life of the asset to ensure long-term sustainability, efficiency, and safety for industries such as seafood, pearling, and charter vessels.
Employment
Employment conditions in Lyons rank among the top 10% of areas assessed nationally
Lyons features a highly educated workforce, strong representation in essential services, and an unemployment rate of only 0.2%, according to AreaSearch compilations of statistical area data. As of March 2026, 1,392 residents are employed, which places the unemployment rate at 3.2% below the Greater Darwin rate of 3.5%, while labor force participation is very close to the Greater Darwin average of 72.7%. Census records indicate that a minor 5.1% of working residents performed their duties from home, though the influence of COVID-19 lockdowns should be kept in mind.
The primary employment sectors for residents are public administration & safety, health care & social assistance, and education & training. The locality exhibits a strong employment concentration in public administration & safety, with a share that is 1.9 times the regional average. Conversely, construction has a small footprint, accounting for 5.0% of local jobs compared to 9.2% across the region. The highly residential character of the area suggests localized job opportunities are sparse, as shown by the comparison of Census workers to the resident population.
Based on AreaSearch analysis of SALM and ABS data aggregated from broader statistical regions, the labor force shrank by 0.8% and total employment fell by 0.7% in the year ending March 2026, leaving the unemployment rate virtually unchanged. By comparison, Greater Darwin recorded employment growth of 0.4%, labor force expansion of 0.8%, and a rise in unemployment of 0.3 percentage points. Jobs and Skills Australia's national employment projections from May-25 offer additional perspective on potential future demand in Lyons. These estimates, spanning five and ten-year horizons, have been aligned with the local employment distribution to project potential growth. While national employment is projected to grow by 6.6% over five years and 13.7% over ten years, growth rates vary greatly across different industries. Applying these sector-specific forecasts to the employment structure of Lyons suggests local employment could rise by 6.6% over five years and 13.9% over ten years (note that this is a basic weighted extrapolation for demonstration purposes and does not account for localized population dynamics).
Frequently Asked Questions - Employment
Income
The economic profile demonstrates exceptional strength, placing the area among the top 10% nationally based on comprehensive AreaSearch income analysis
According to the latest ATO statistics compiled by AreaSearch for financial year 2023, the suburb of Lyons ranks among the highest earning areas in Australia. The median income for taxpayers in Lyons is $80,349, and the average income is $93,574, compared to Greater Darwin figures of $66,956 and $77,199 respectively. Adjusted for Wage Price Index growth of 9.41% since financial year 2023, contemporary estimates would be roughly $87,910 (median) and $102,379 (average) as of March 2026. Data from the 2021 Census confirms that household, family, and personal incomes in Lyons are positioned in the top tier, ranking between the 95th and 96th percentiles nationally. Income distribution figures show the largest cohort is the 38.3% earning $1,500 - 2,999 weekly (975 residents), which aligns with the regional trend of 36.7% in this bracket. A substantial 48.5% earn in excess of $3,000 weekly, pointing to high-wealth segments that support robust local business activity. Once housing expenses are paid, residents retain 88.7% of their income, showing strong spending capability, and the neighborhood's SEIFA income index places it in the 9th decile.
Frequently Asked Questions - Income
Housing
Lyons is characterized by a predominantly suburban housing profile, with a higher proportion of rental properties than the broader region
At the most recent Census, the residential mix in Lyons consisted of 82.0% houses and 18.0% other dwelling types (such as semi-detached homes, apartments, and alternative housing), compared to Darwin metro's breakdown of 63.5% houses and 36.5% other properties. At the same time, the rate of home ownership in Lyons was lower than the Darwin metro level, standing at 10.1%, with the remaining properties being mortgaged (27.7%) or occupied by renters (62.2%). The median monthly mortgage payment in the area was significantly higher than the Darwin metro average at $2,600, whereas the median weekly rent was logged at $265, compared to Darwin metro figures of $2,100 and $385. Nationally, Lyons's mortgage costs are notably higher than the Australian average of $1,863, while weekly rents are well below the national benchmark of $375.
Frequently Asked Questions - Housing
Household Composition
Lyons features high concentrations of family households, with a higher-than-average median household size
Families represent the vast majority of households at 88.6%, consisting of 57.3% couples with children, 24.8% couples without children, and 5.6% single parent households. Non-family households comprise the remaining 11.4%, with lone person dwellings at 8.4% and group shared households making up 2.2% of the total. The median household size of 3.3 people exceeds the Greater Darwin average of 2.6.
Frequently Asked Questions - Households
Local Schools & Education
Lyons demonstrates exceptional educational outcomes, ranking among the top 5% of areas nationally based on AreaSearch's comprehensive analysis of qualification and performance metrics
The educational profile of this area is distinct within the region, with university graduation rates (35.6% of residents aged 15+) higher than the NT average of 27.3% and the national average of 30.4%, reflecting a strong local focus on tertiary education. Bachelor degrees are the most common qualification at 22.0%, followed by postgraduate degrees (9.6%) and graduate diplomas (4.0%). Vocational and technical training is also well represented, with 36.2% of residents aged 15+ holding trade credentials, consisting of advanced diplomas (13.0%) and certificates (23.2%).
Enrolment in education is remarkably strong, with 40.4% of local residents actively engaged in formal study. This student population includes 15.7% attending primary schools, 10.1% enrolled in secondary education, and 7.1% undertaking university or tertiary studies.
Frequently Asked Questions - Education
Schools Detail
Nearby Services & Amenities
Transport
Transport servicing is good compared to other areas nationally based on assessment of service frequency, route connectivity and accessibility
Analysis of the local transport network shows 6 active public transit stops operating within Lyons, providing bus services. These locations are serviced by 18 distinct routes, which combine to support 959 weekly passenger trips. Access to public transit is rated as excellent, with residents living an average of 170 meters from the nearest stop. Given the residential nature of the suburb, most working residents commute elsewhere, with private cars remaining the primary travel mode at 91%, while 3% of residents cycle. Vehicle ownership stands at an average of 1.9 per household, which is above the regional average. A relatively low 5.1% of residents work from home, according to the 2021 Census, which may reflect the influence of COVID-19 conditions.
Across all transit routes, services average 137 runs per day, which translates to roughly 159 weekly trips at each individual transit stop.
Frequently Asked Questions - Transport
Transport Stops Detail
Health
Lyons's residents are extremely healthy with both young and old age cohorts seeing low prevalence of common health conditions
An examination of health indicators reveals positive outcomes throughout Lyons. Based on AreaSearch's analysis of death rates and the frequency of chronic conditions, both young and old cohorts show low rates of common health issues. In addition, the proportion of residents with private health insurance is exceptionally high, covering approximately 64% of the population (1,620 people), compared to 57.8% in Greater Darwin and a national average of 55.7%.
The most common health conditions reported in the area were mental health concerns and asthma, affecting 6.0% and 5.4% of residents, respectively. Meanwhile, 82.2% of the population reported no chronic medical conditions, compared to 77.1% across Greater Darwin. Residents aged 65 and over account for 5.0% of the local population (127 people), which is below the Greater Darwin level of 11.0%. Seniors in the area display strong health outcomes, with national health rankings matching those of the broader community.
Frequently Asked Questions - Health
Cultural Diversity
Lyons was found to be more culturally diverse than the vast majority of local markets in Australia, upon assessment of a range of language and cultural background related metrics
Lyons exhibits higher cultural diversity than most local property markets, with 31.1% of its residents born overseas and 29.7% speaking a non-English language at home. Christianity is the dominant religion, practiced by 45.0% of the population. The most notable religious variance is in Buddhism, which is practiced by 5.1% of the population, compared to 3.3% across Greater Darwin.
Regarding parental country of birth, the three largest ancestry groups in Lyons are Australian at 23.1%, English at 19.1%, and Other at 13.6% of the population. Significant differences also appear in other ethnic backgrounds, with Greek ancestry notably higher at 4.9% of Lyons (compared to 2.3% regionally), Sri Lankan at 1.1% (compared to 0.3%), and Filipino at 3.7% (compared to 3.8%).
Frequently Asked Questions - Diversity
Age
Lyons hosts a very young demographic, ranking in the bottom 10% of areas nationwide
With a median age of 30 years, Lyons is younger than both the Greater Darwin average of 34 and the Australian average of 38 years. Compared to Greater Darwin, Lyons has a larger share of residents aged 5 - 14 (18.4%) but fewer residents aged 65 - 74 (2.8%). This concentration of 5 - 14 year-olds is well above the national rate of 12.0%. Since the 2021 Census, the 15 to 24 cohort has grown from 12.8% to 14.5% of the population, and the 55 to 64 group has increased from 5.6% to 6.7%. In contrast, the 0 to 4 group has decreased from 10.1% to 8.0%, and the 5 to 14 cohort has dropped from 19.6% to 18.4%. Population projections for 2041 point to notable demographic shifts in Lyons, led by a 48% increase in the 45 to 54 cohort (adding 166 people), which is expected to reach 513 from a baseline of 346.