Chart Color Schemes
est. as @ -- *
ABS ERP | -- people | --
2021 Census | -- people
Sales Activity
Curious about local property values? Filter the chart to assess the volume and appreciation (including resales) trends and regional comparisons, or scroll to the map below view this information at an individual property level.
Find a Recent Sale
Sales Detail
Population
Population growth drivers in Swanbourne - Mount Claremont are strong compared to national averages based on AreaSearch's ranking of recent, and medium to long-term trends
Swanbourne - Mount Claremont's population is 10,518 as of November 2025. From the 2021 Census to June 2024, there was an increase of 906 people (9.4%), reaching an estimated resident population of 10,500 with an additional 17 validated new addresses since the Census date. This results in a density ratio of 899 persons per square kilometer. The area's growth exceeded the national average of 8.9%, demonstrating it as a growth leader in the region. Overseas migration contributed approximately 79.9% of overall population gains during recent periods. AreaSearch uses ABS/Geoscience Australia projections for each SA2 area, released in 2024 with a base year of 2022.
For areas not covered by this data and post-2032 growth estimation, AreaSearch utilises growth rates by age cohort provided by the ABS in its latest Greater Capital Region projections (released in 2023, based on 2022 data). Considering projected demographic shifts, above median population growth is projected for statistical areas across the nation. The area is expected to grow by 1,335 persons to 2041, with an increase of 12.5% in total over the 17 years.
Frequently Asked Questions - Population
Development
Residential development activity is slightly higher than average within Swanbourne - Mount Claremont when compared nationally
Swanbourne - Mount Claremont has seen approximately 28 dwellings receiving development approval annually. Over the past five financial years, from FY-21 to FY-25, around 144 homes were approved, with an additional four approved in FY-26 so far. On average, each dwelling constructed over these years has attracted about 6.3 new residents yearly.
This significant demand outpaces supply, typically leading to price growth and increased buyer competition. The average construction value of new properties is $683,000, indicating developers focus on the premium market with high-end developments. In FY-26, $39.9 million in commercial approvals have been registered, reflecting robust local commercial activity. Compared to Greater Perth, Swanbourne - Mount Claremont exhibits roughly half the construction activity per person and ranks among the 33rd percentile of areas assessed nationally, suggesting constrained buyer choice and interest in existing properties.
This is below average nationally, likely due to the area's maturity and possible planning constraints. New development consists predominantly of detached houses (95.0%) with a small percentage of medium and high-density housing (5.0%), preserving the area's traditional low density character appealing to families seeking space. Detached housing dominance in new construction is higher than current patterns suggest (79.0% at Census), indicating strong demand for family homes despite increasing density pressures. The estimated population per dwelling approval is 494, reflecting its quiet development environment. Population forecasts project Swanbourne - Mount Claremont to gain approximately 1,317 residents by 2041. If current development rates persist, housing supply may not keep pace with population growth, potentially intensifying buyer competition and supporting stronger price growth.
Frequently Asked Questions - Development
Infrastructure
Swanbourne - Mount Claremont has limited levels of nearby infrastructure activity, ranking in the 7thth percentile nationally
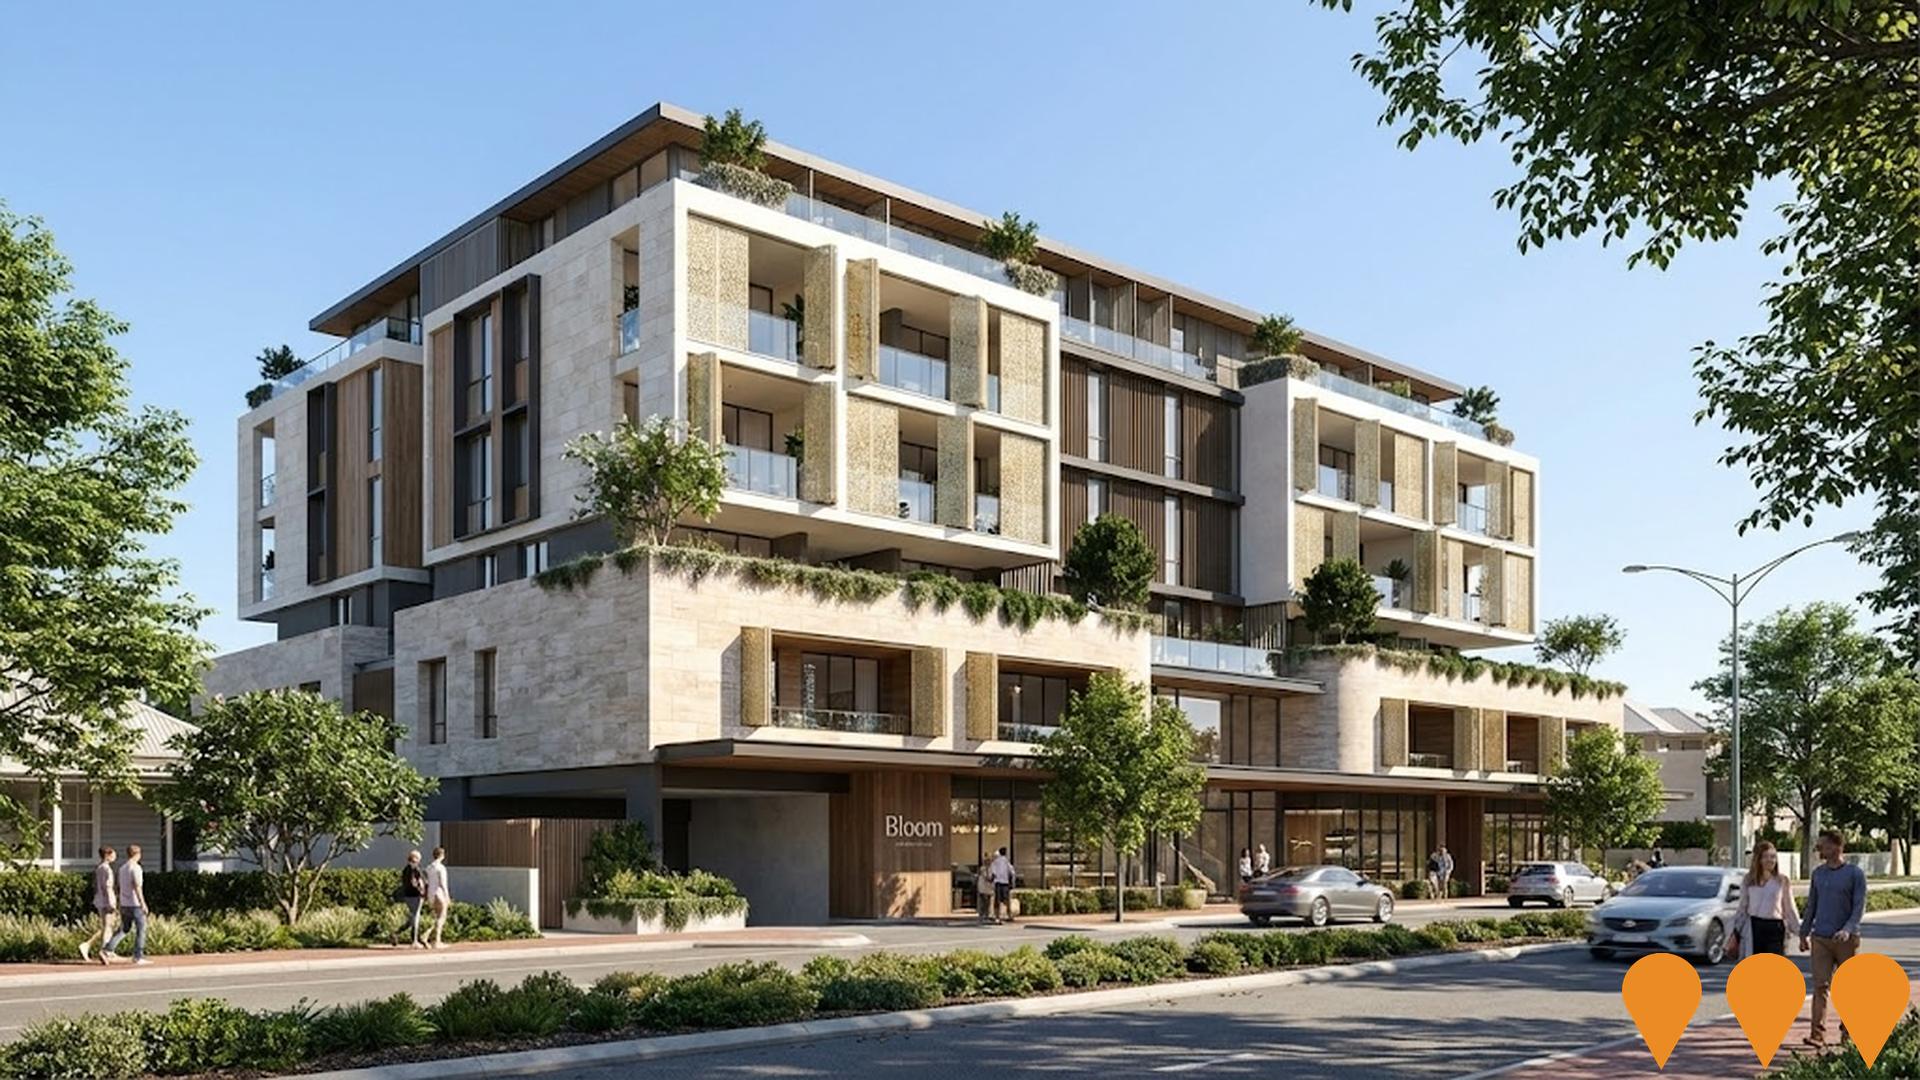
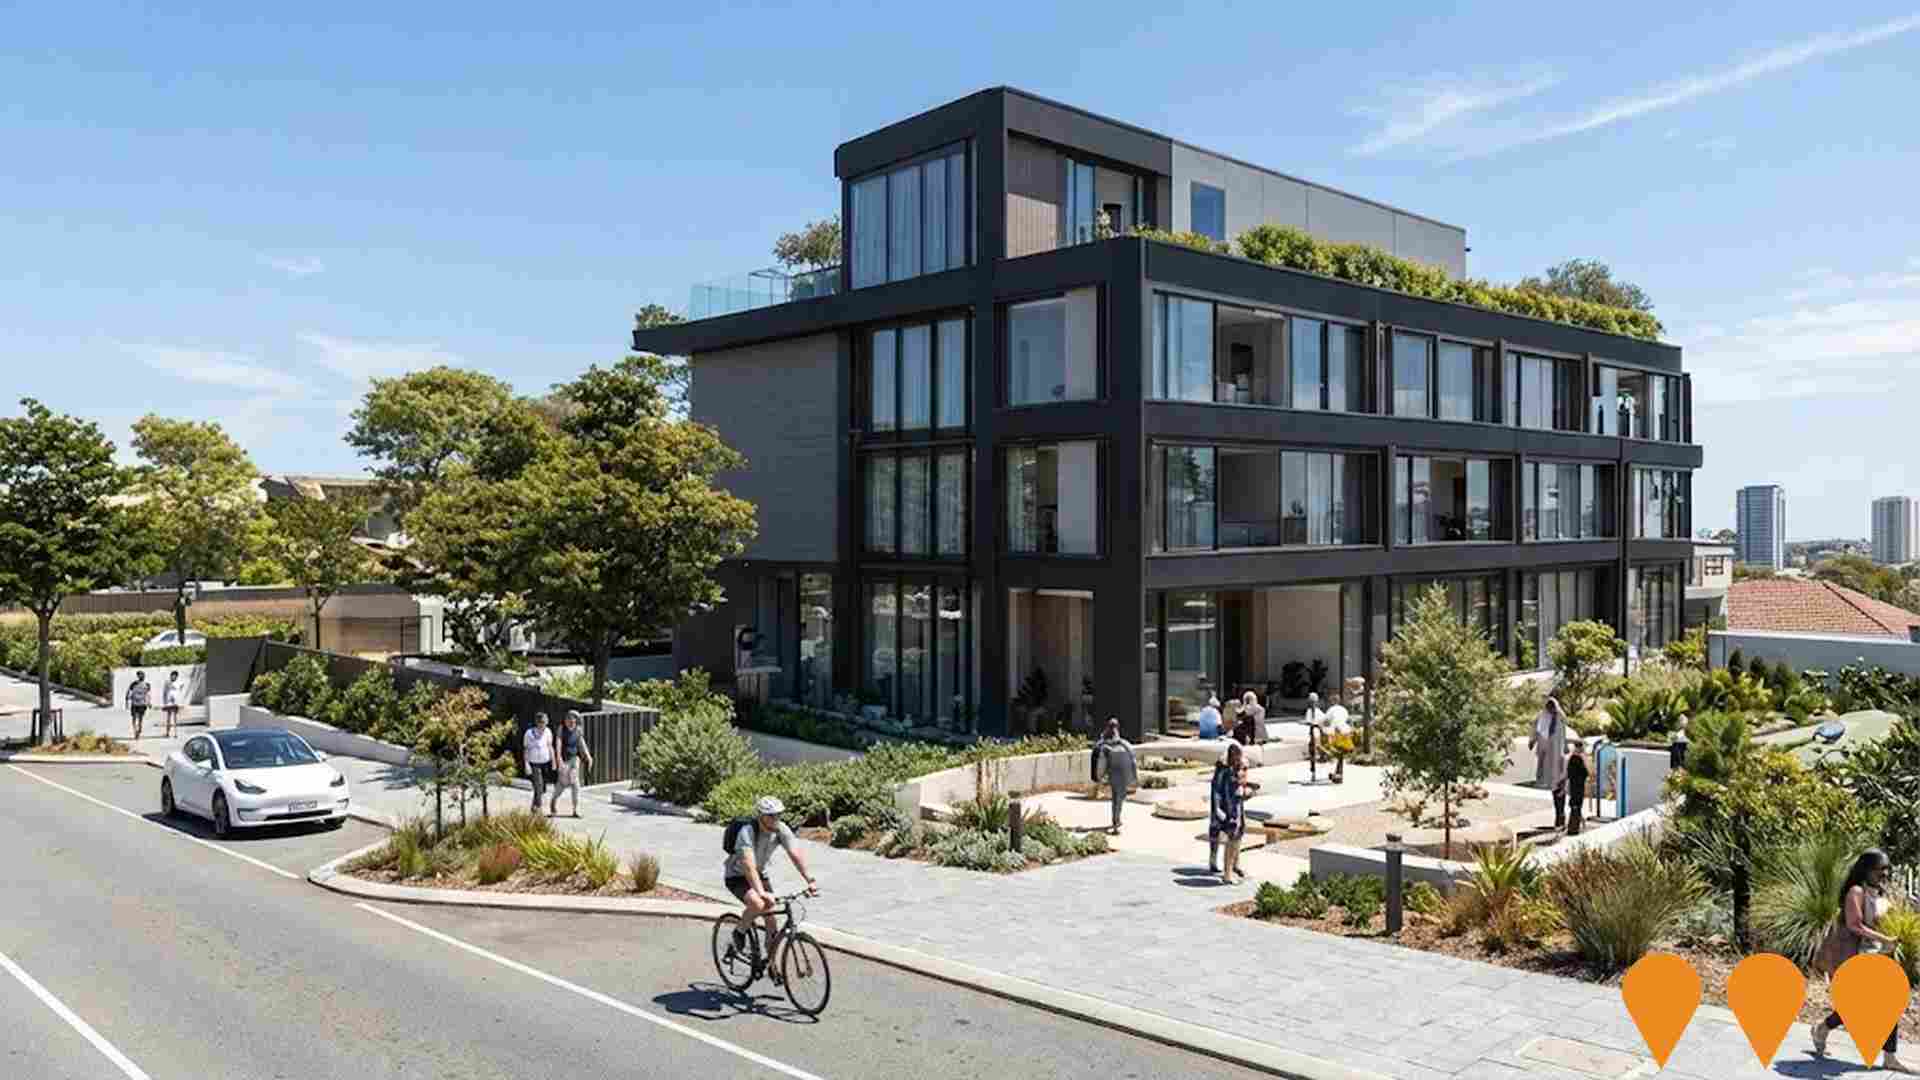
Changes to local infrastructure significantly influence an area's performance. AreaSearch identified 28 projects likely impacting the area. Notable initiatives include Claremont on the Park Stage 2 (The Crescent), Swanbourne Station Transit-Oriented Development, Broadway on the Bay, and Claremont Station METRONET Upgrade. The following list details those most relevant.
Professional plan users can use the search below to filter and access additional projects.
INFRASTRUCTURE SEARCH
 Denotes AI-based impression for illustrative purposes only, not to be taken as definitive under any circumstances. Please follow links and conduct other investigations from the project's source for actual imagery. Developers and project owners wishing us to use original imagery please Contact Us and we will do so.
Frequently Asked Questions - Infrastructure
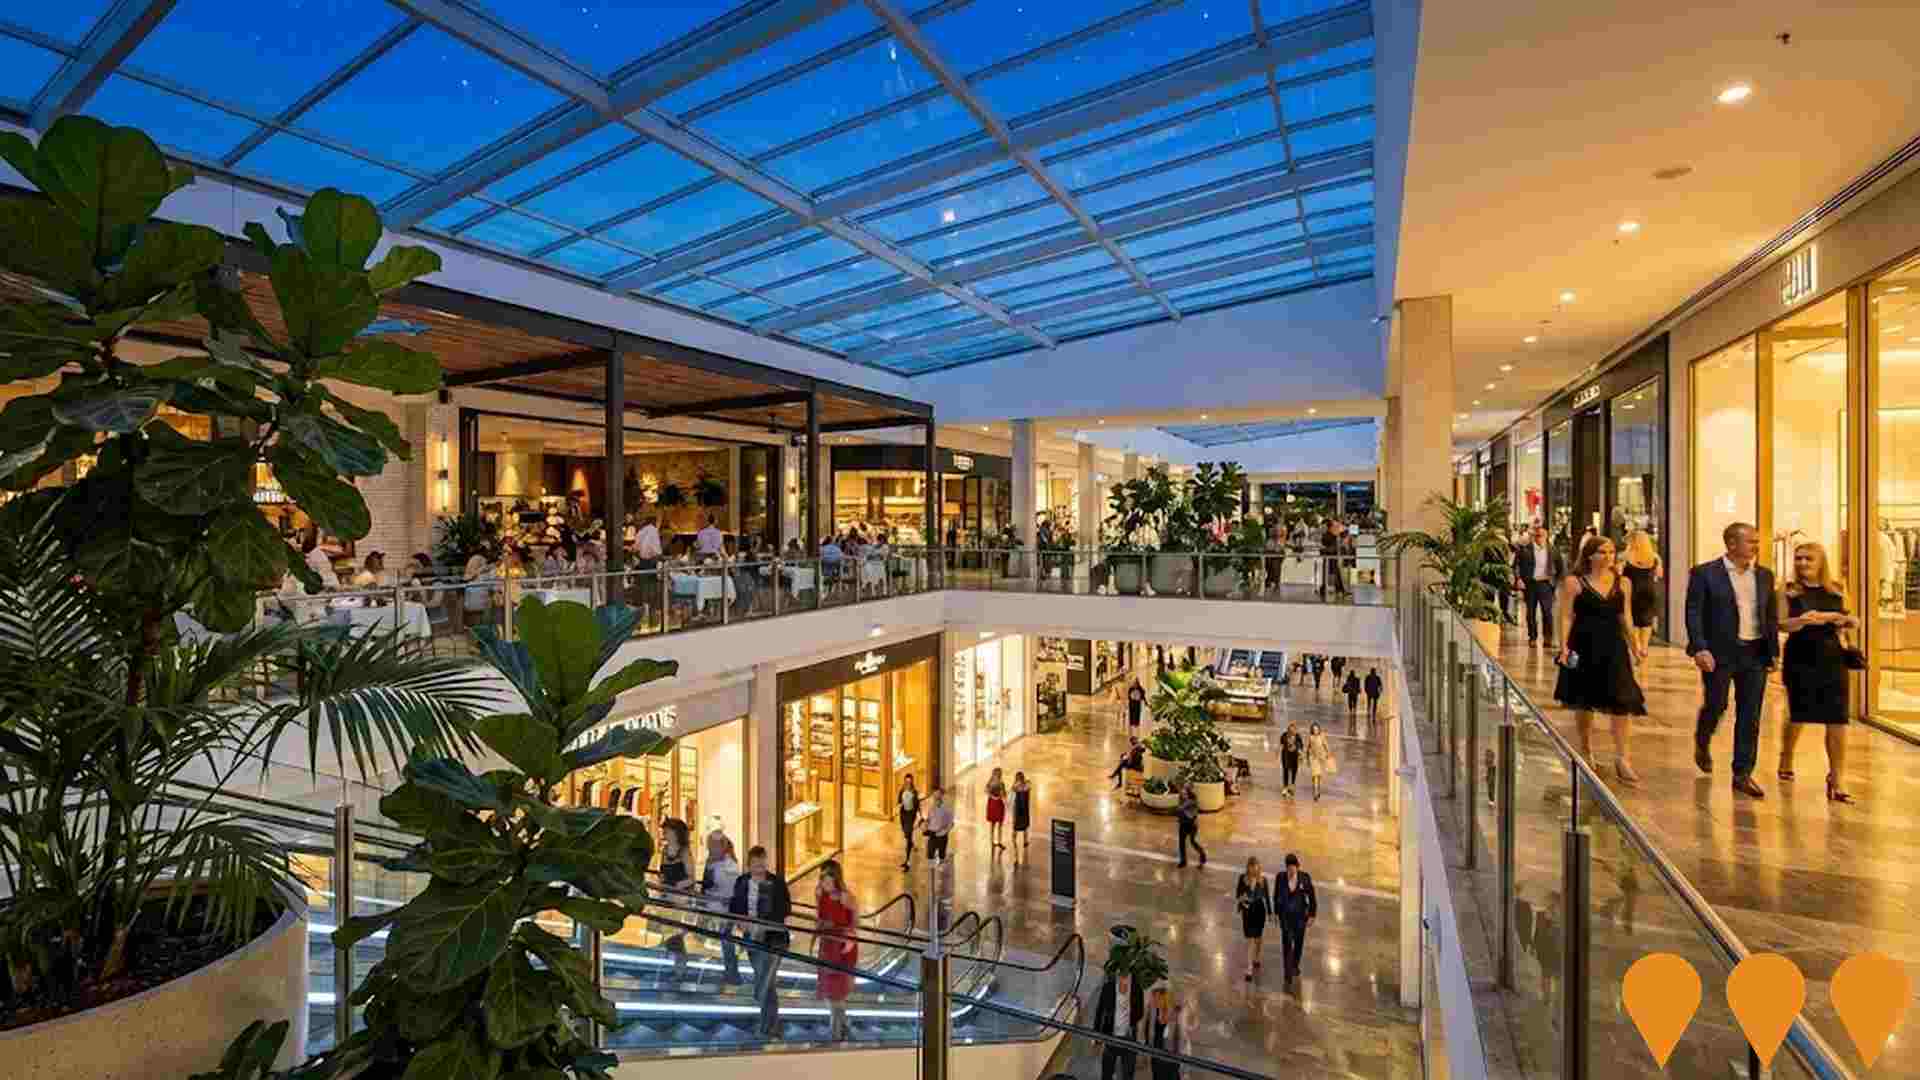
Claremont Quarter Shopping Centre
Claremont Quarter is a premium shopping and dining destination in Perth's Western Suburbs, featuring high-end retail stores, restaurants, and professional services. Originally developed by Multiplex and Hawaiian Group, now wholly owned by Hawaiian Group.
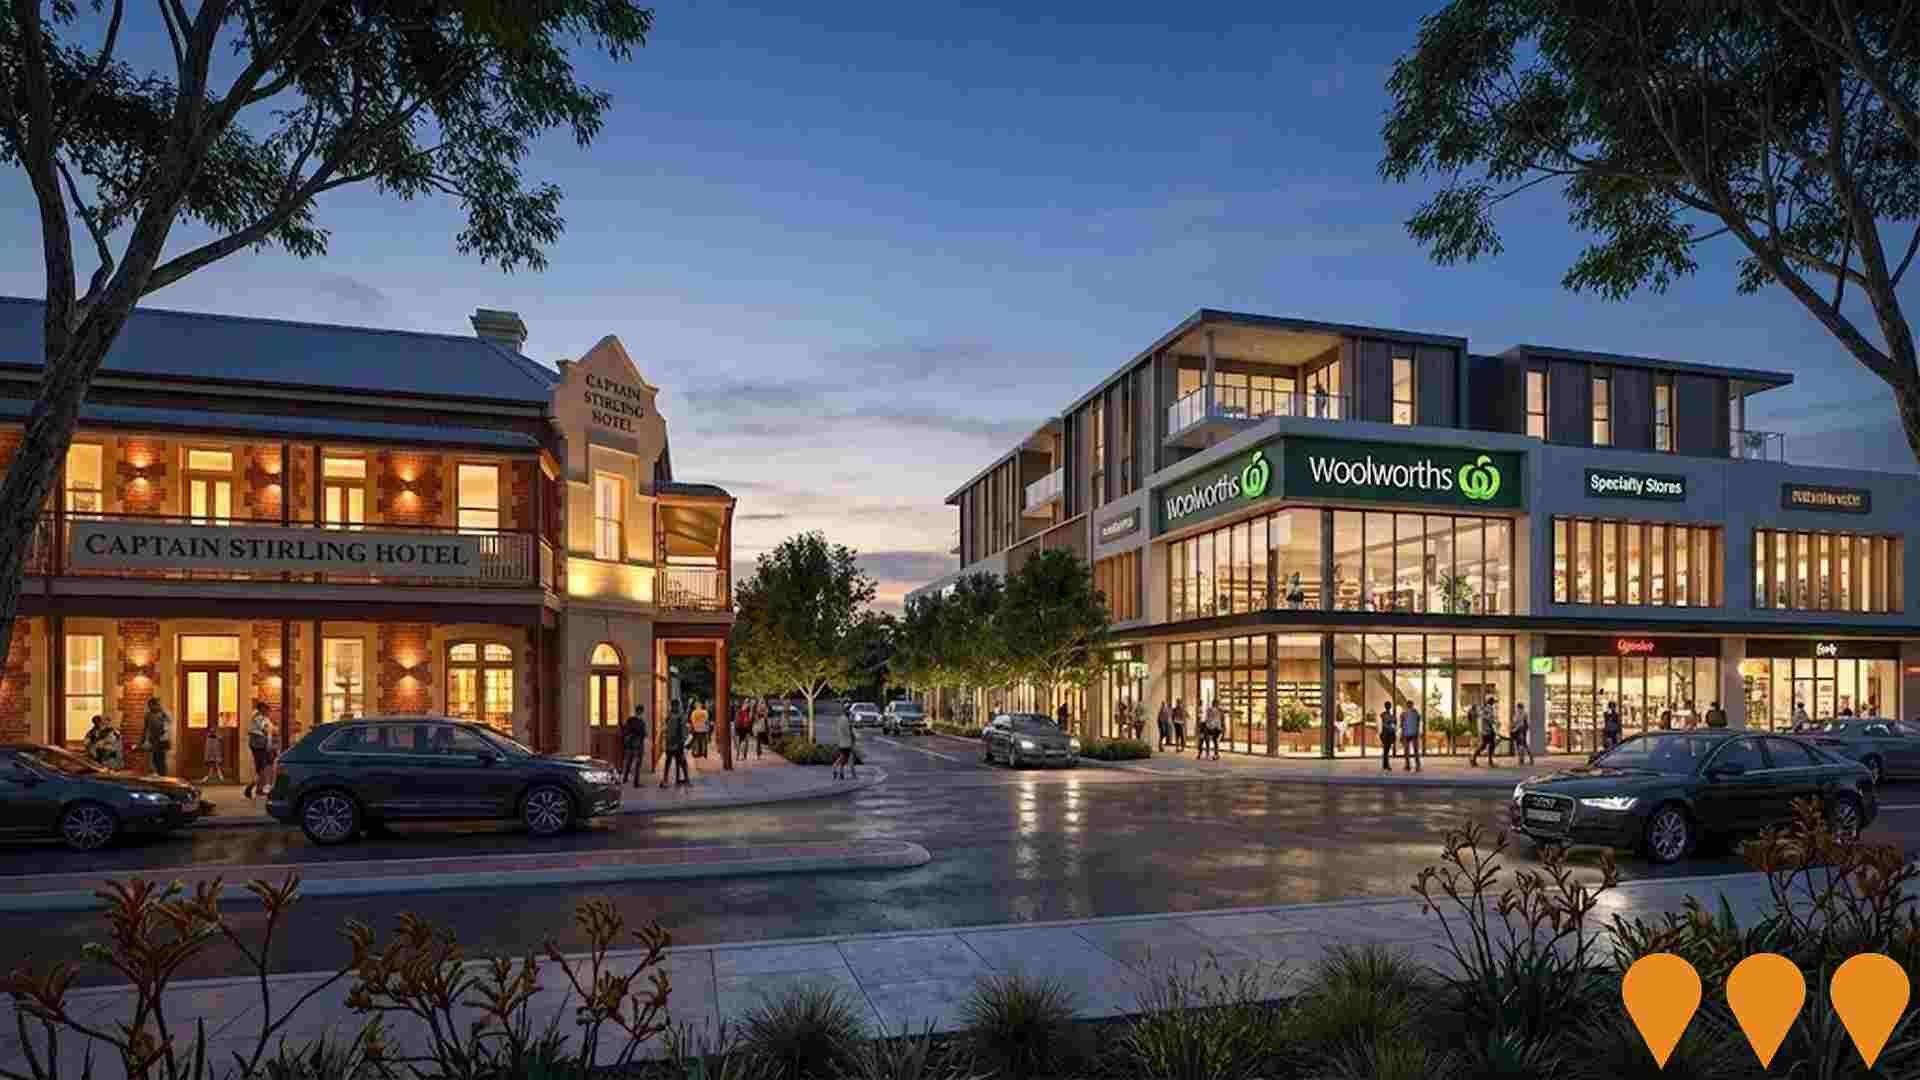
Nedlands Square
Redevelopment of the Captain Stirling Hotel precinct into a new town centre anchored by a full line Woolworths supermarket with 28 specialty stores, food and beverage tenancies, wellness and medical services, a community square, 368 on site car parks, and restoration of the heritage listed Captain Stirling Hotel. The project is underway and is scheduled to open in late 2026.
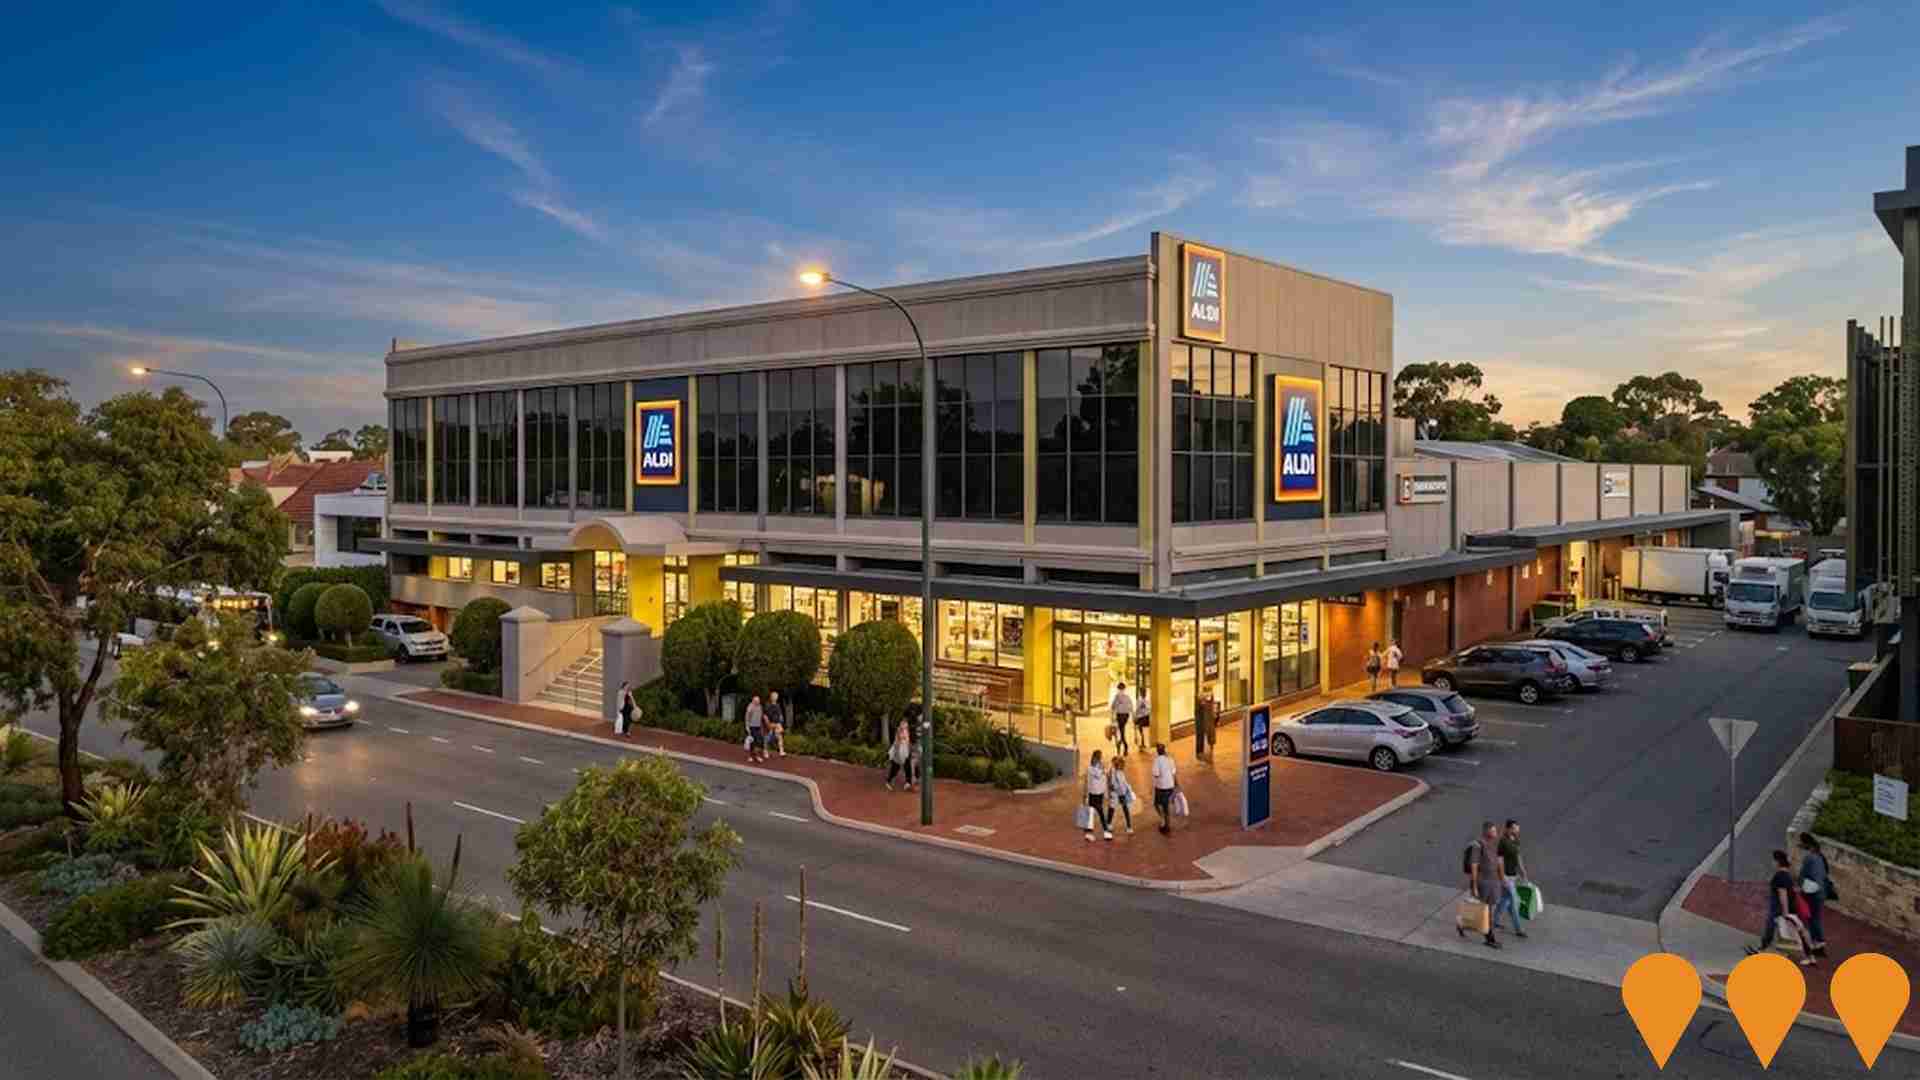
ALDI Nedlands
Redevelopment of the former Captain Stirling Centre into a new ALDI supermarket with six smaller tenancies, a rear laneway and semi-basement parking. State DAP approval granted on 11 Feb 2025; construction expected to follow with opening targeted for 2026.
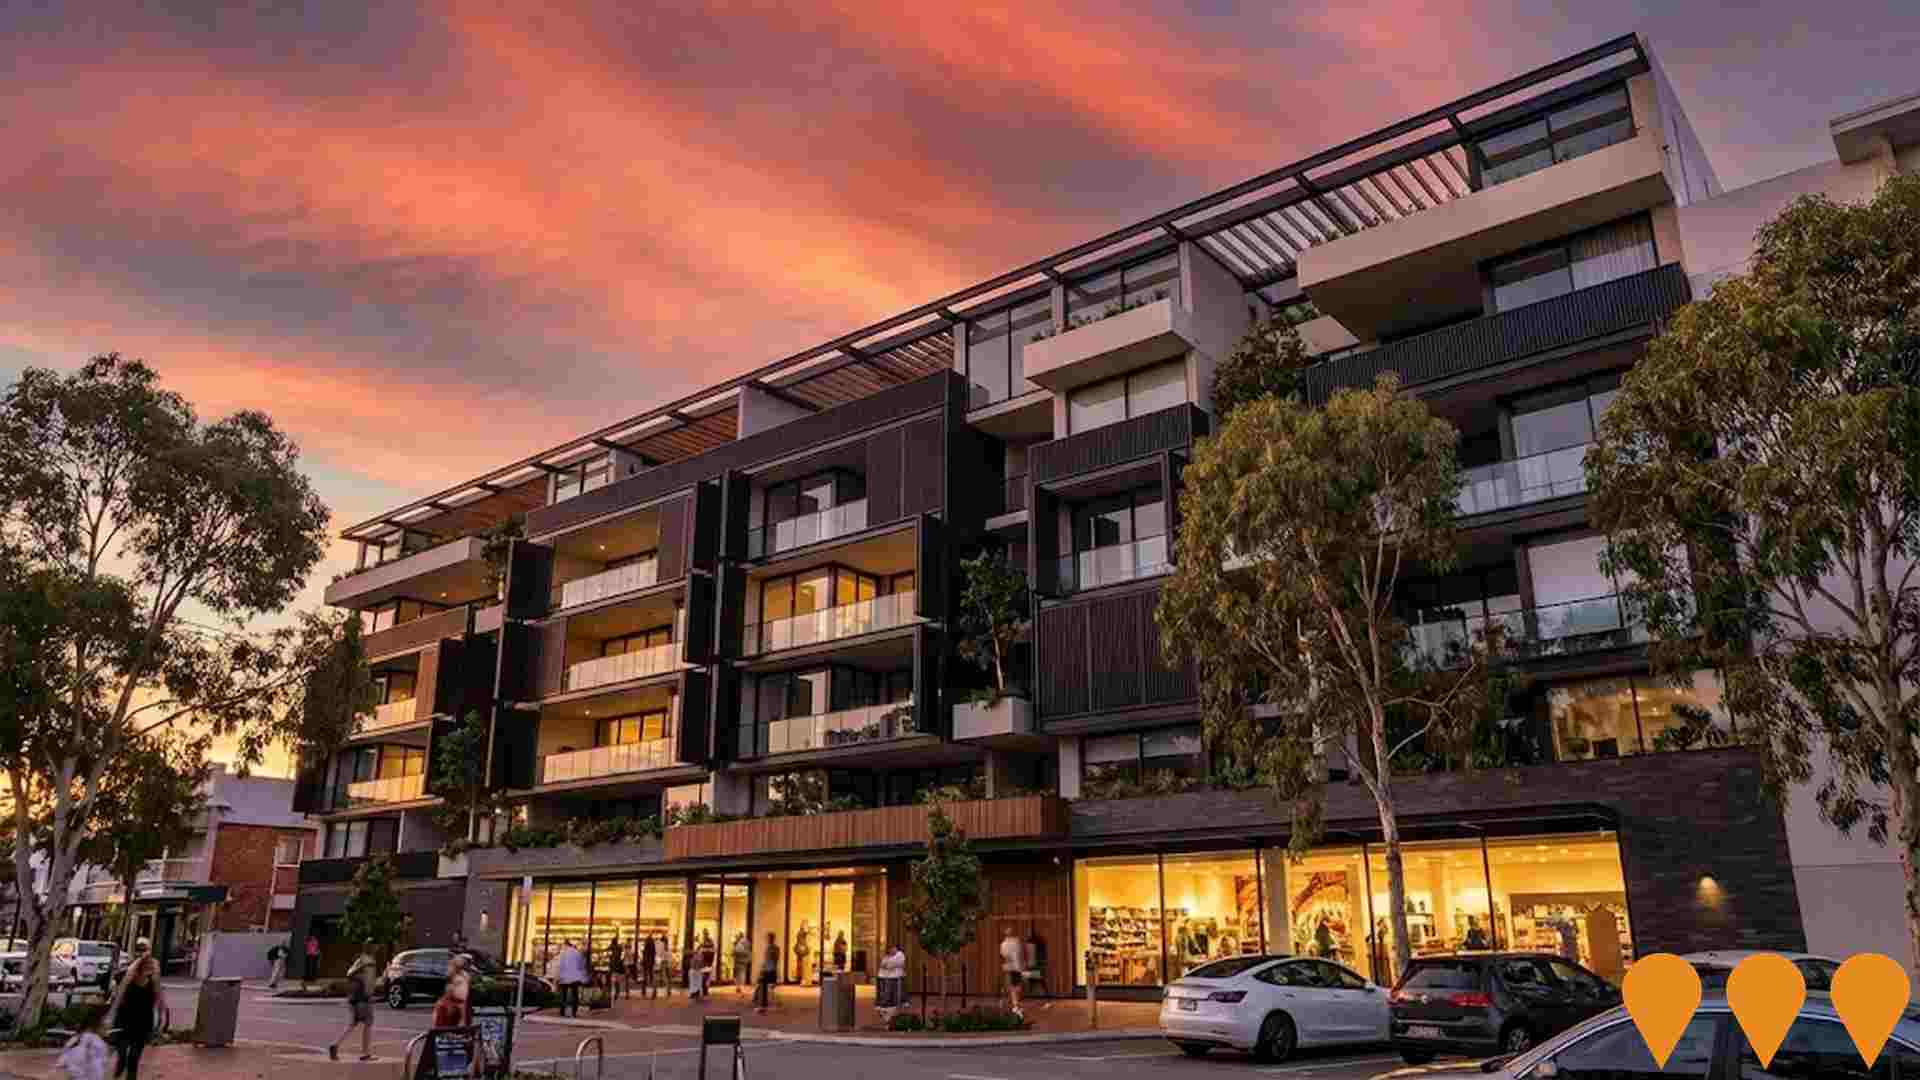
The Grove Residences
A luxury residential development by Blackburne featuring 247 apartments across three buildings (16-storey, 12-storey, and 4-storey podium) spanning 15,741sqm between Claremont, Cottesloe, and Peppermint Grove. Includes resort-style amenities such as thermal pools, spa, fitness center, boutique retail, and rooftop dining. Built on the historic Sundowner Hostel site. Winner of 2024 UDIA WA Awards for Excellence - Design. Features Moroccan-themed thermal bathhouse, $600,000 golf simulator, yoga studio, workshop, kids' playroom, vegetable gardens, and rooftop cocktail lounge with 360-degree views. Designed by MJA Studio with landscaping by Aspect Studio. Completed June 2024.

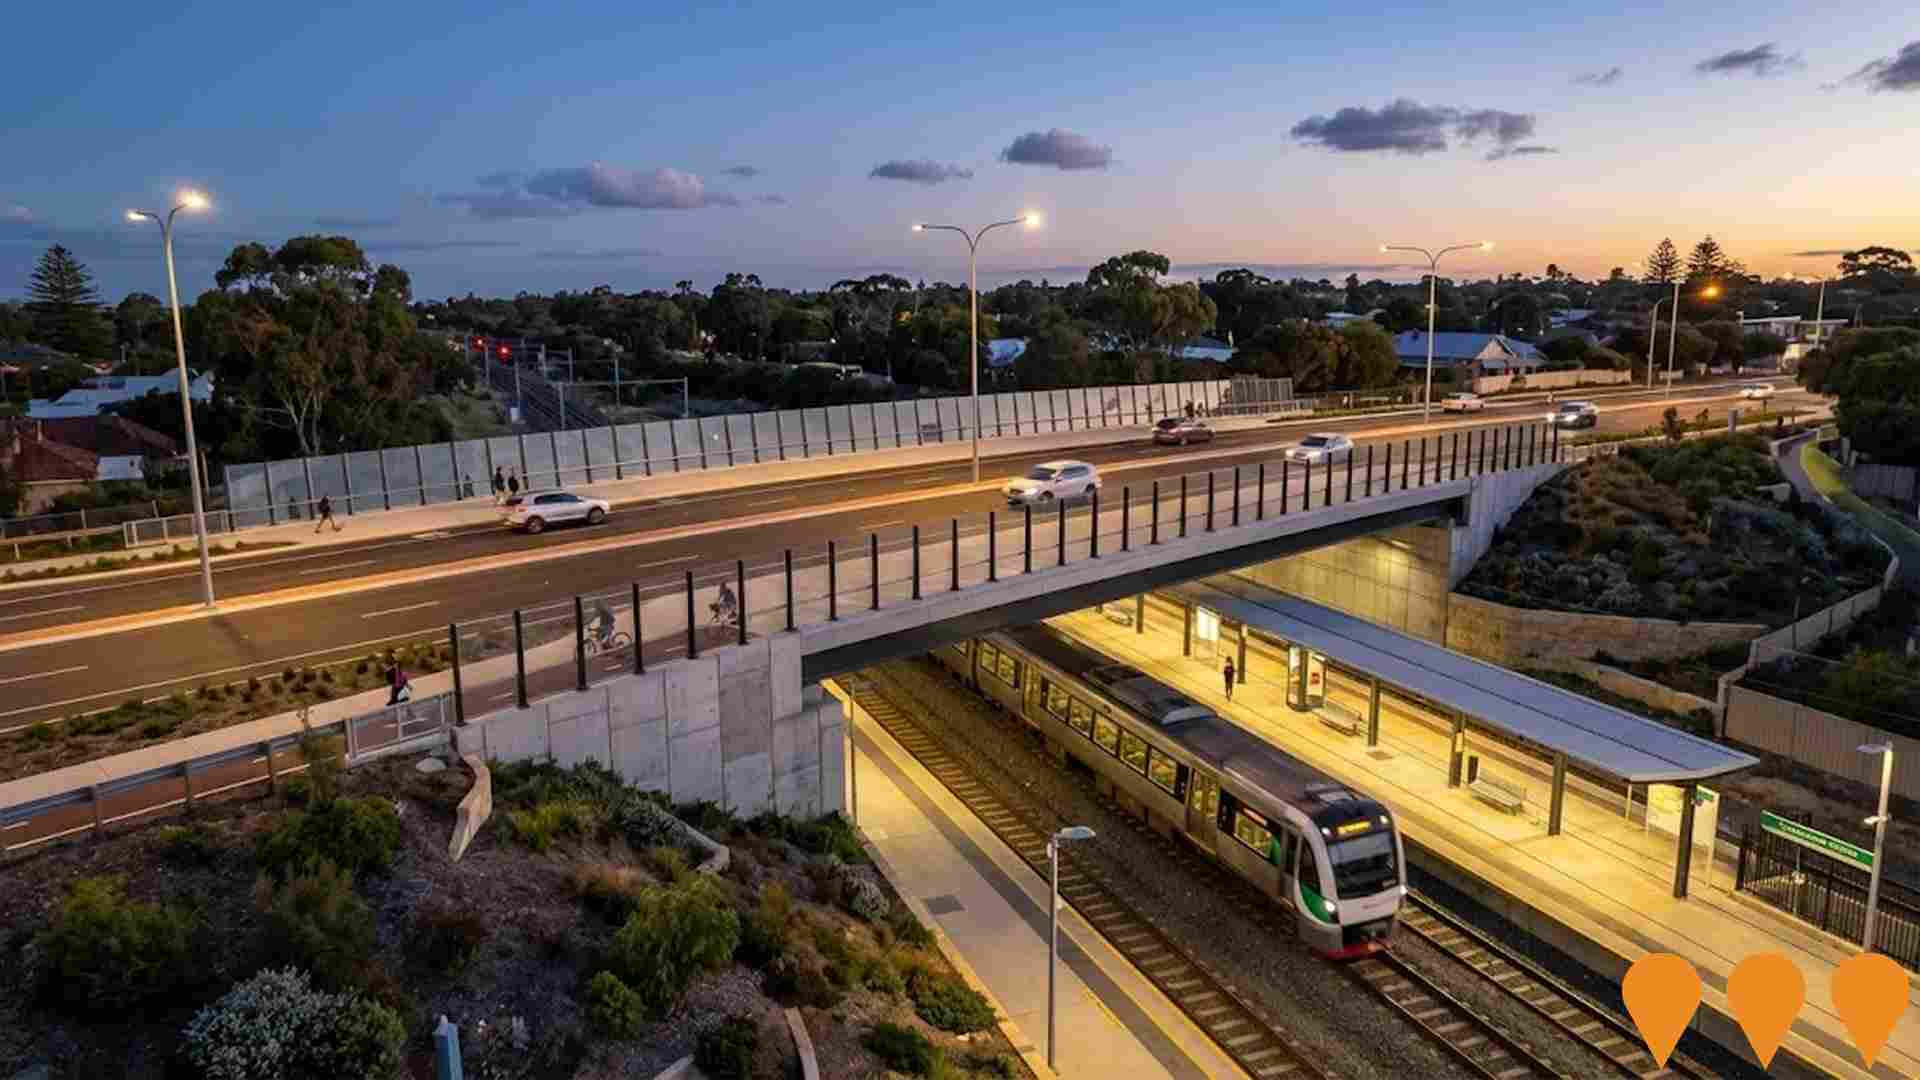
Claremont Station METRONET Upgrade
Major upgrade of Claremont train station as part of the METRONET rail infrastructure program, including new platforms, accessibility improvements, and enhanced passenger facilities.

22 St Quentin Avenue Mixed-Use Development
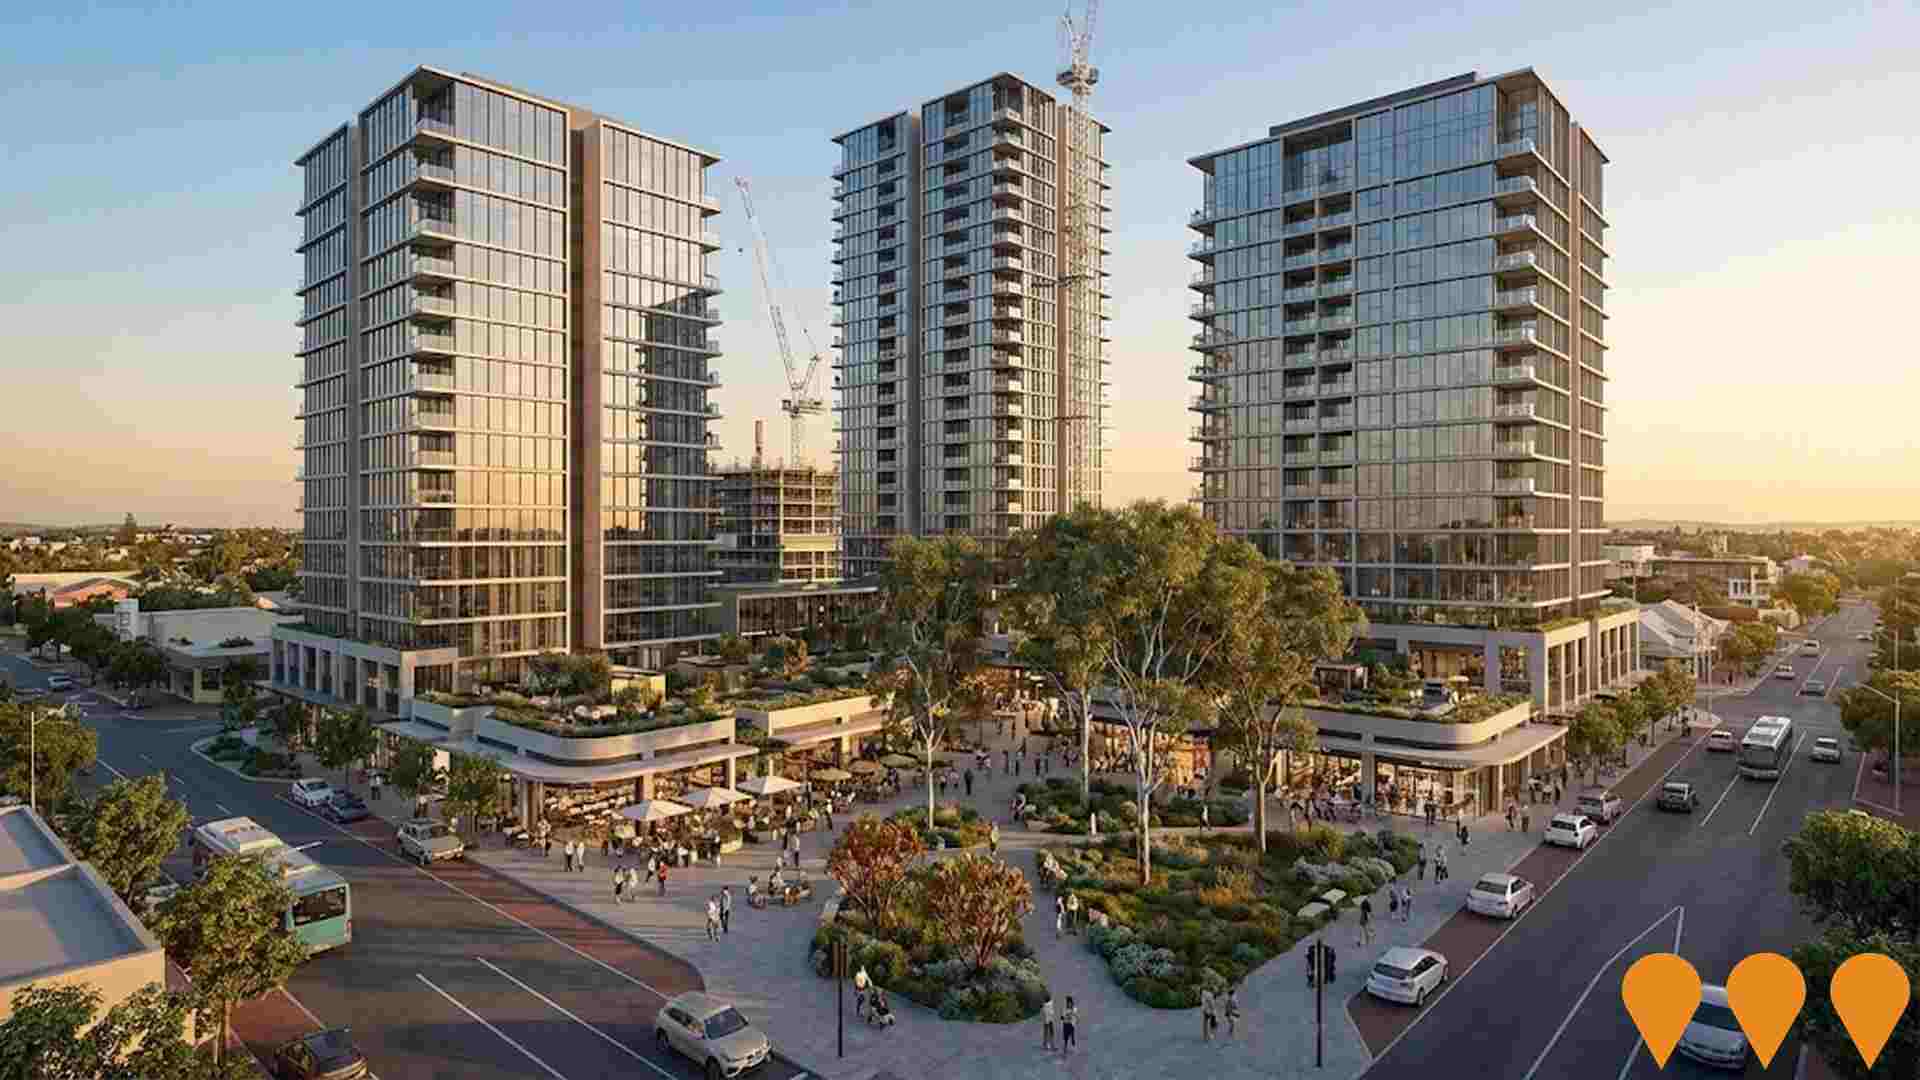
A 14-storey mixed-use development with 86 residential apartments, offices, restaurants, shops, and communal facilities. Features two floors of office and retail space plus four floors of basement parking. Designed by Pennock Architects for Kuraland, with community consultation over two years.
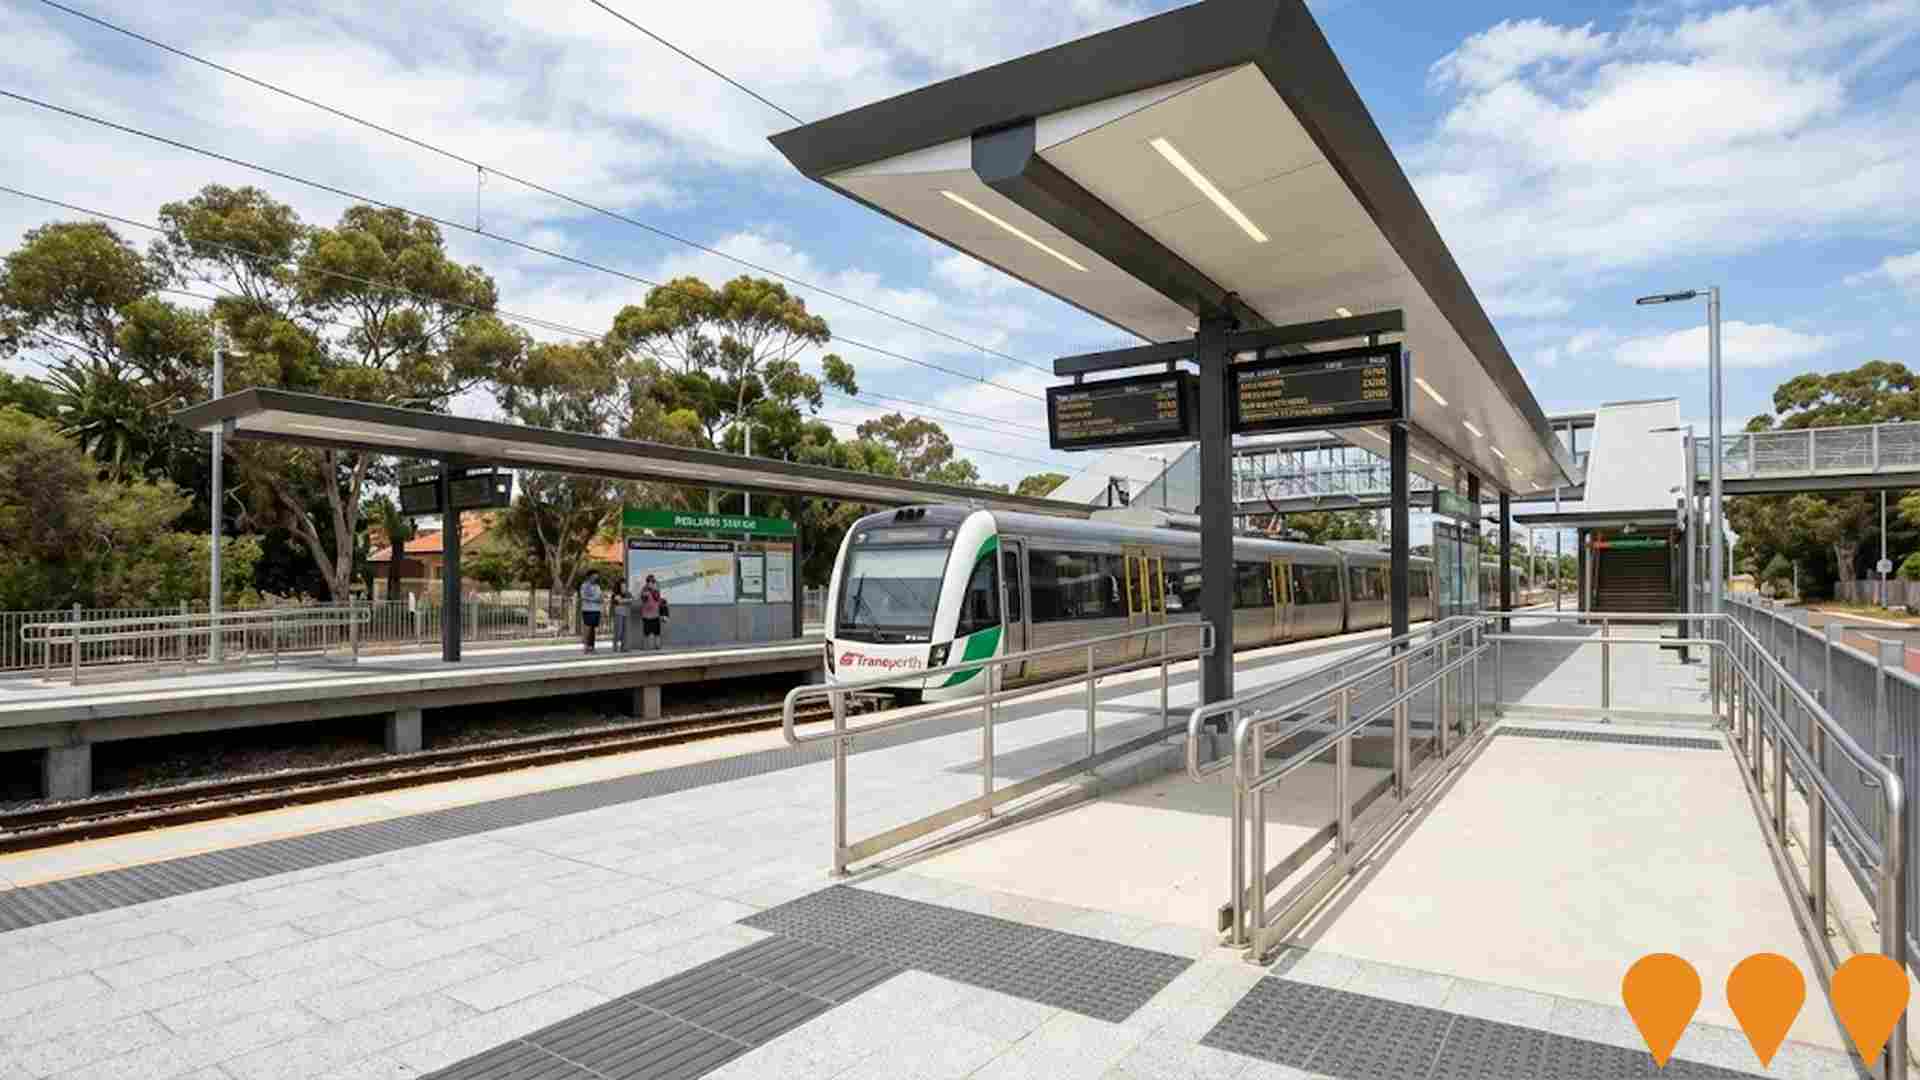
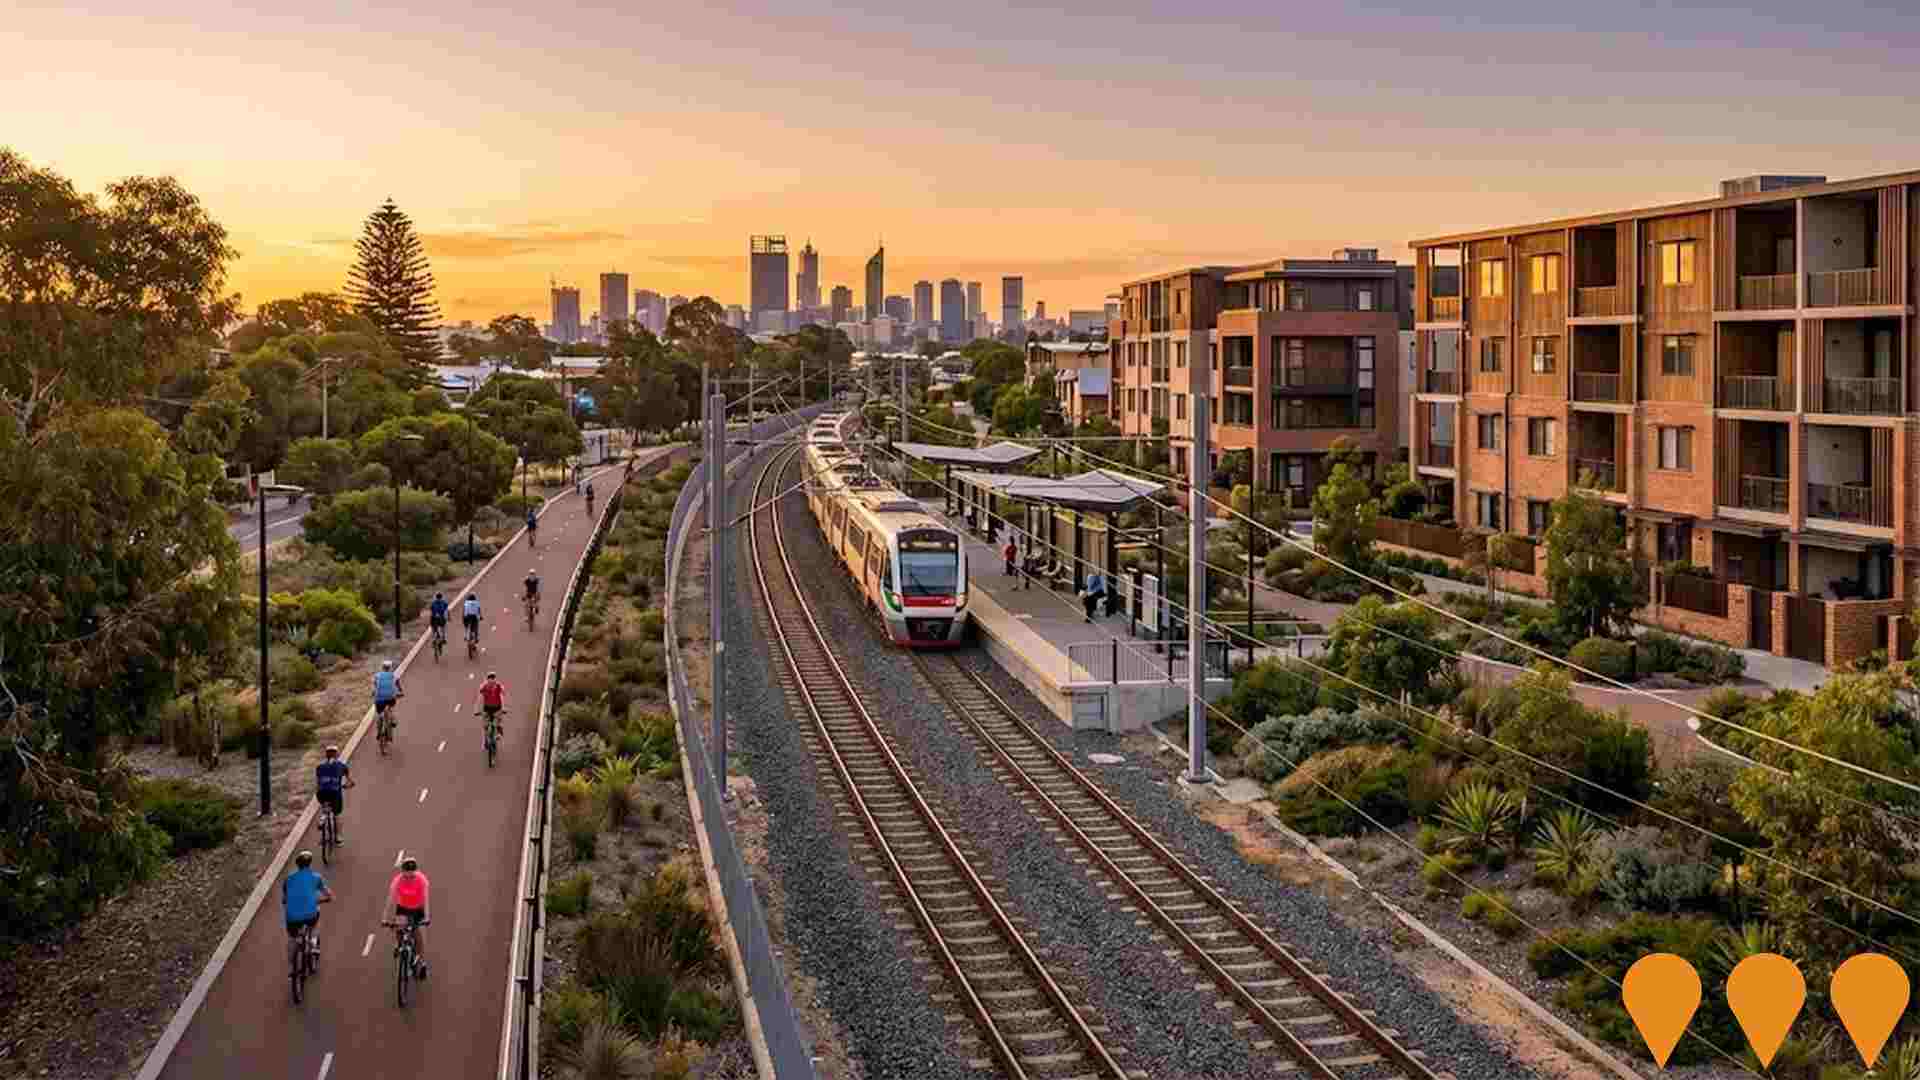
Swanbourne Station TOD
Transit-oriented development planned around Swanbourne train station to provide medium-density housing and commercial facilities integrated with public transport infrastructure.
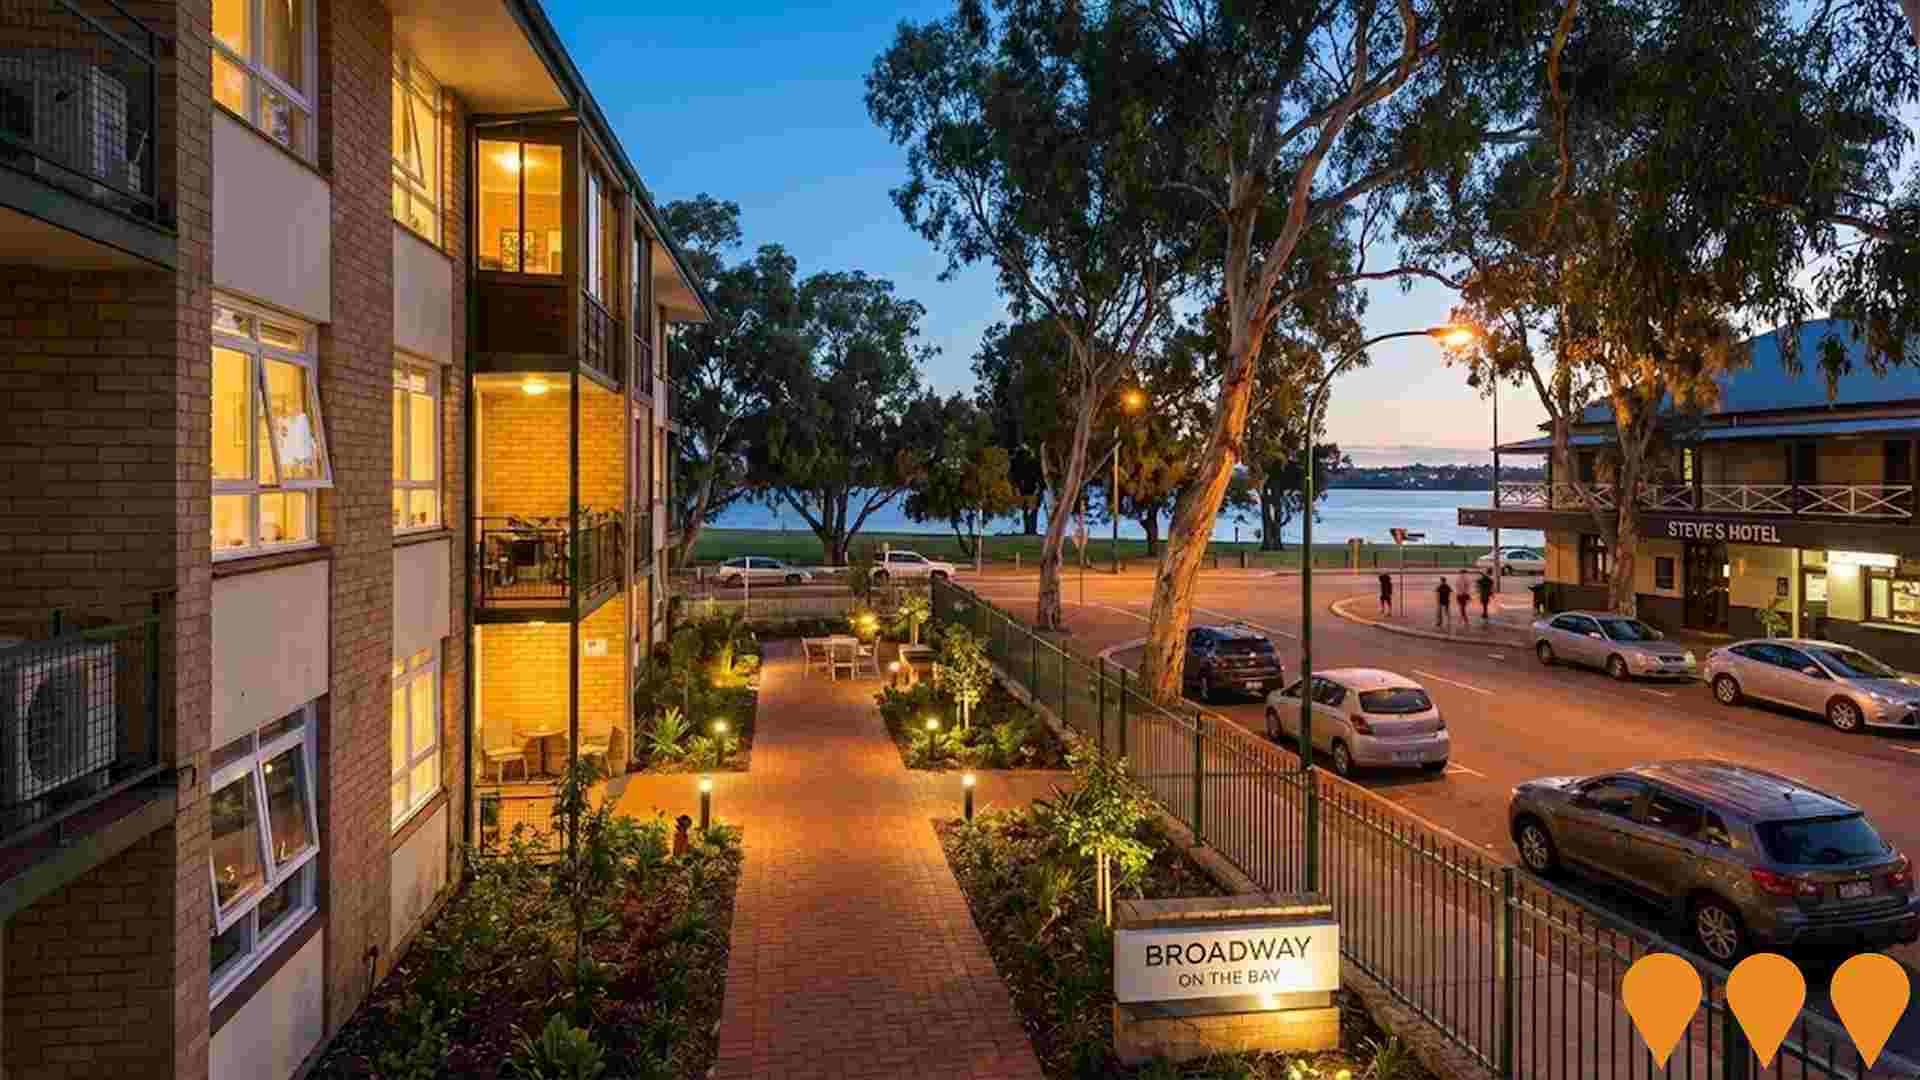
Broadway on the Bay
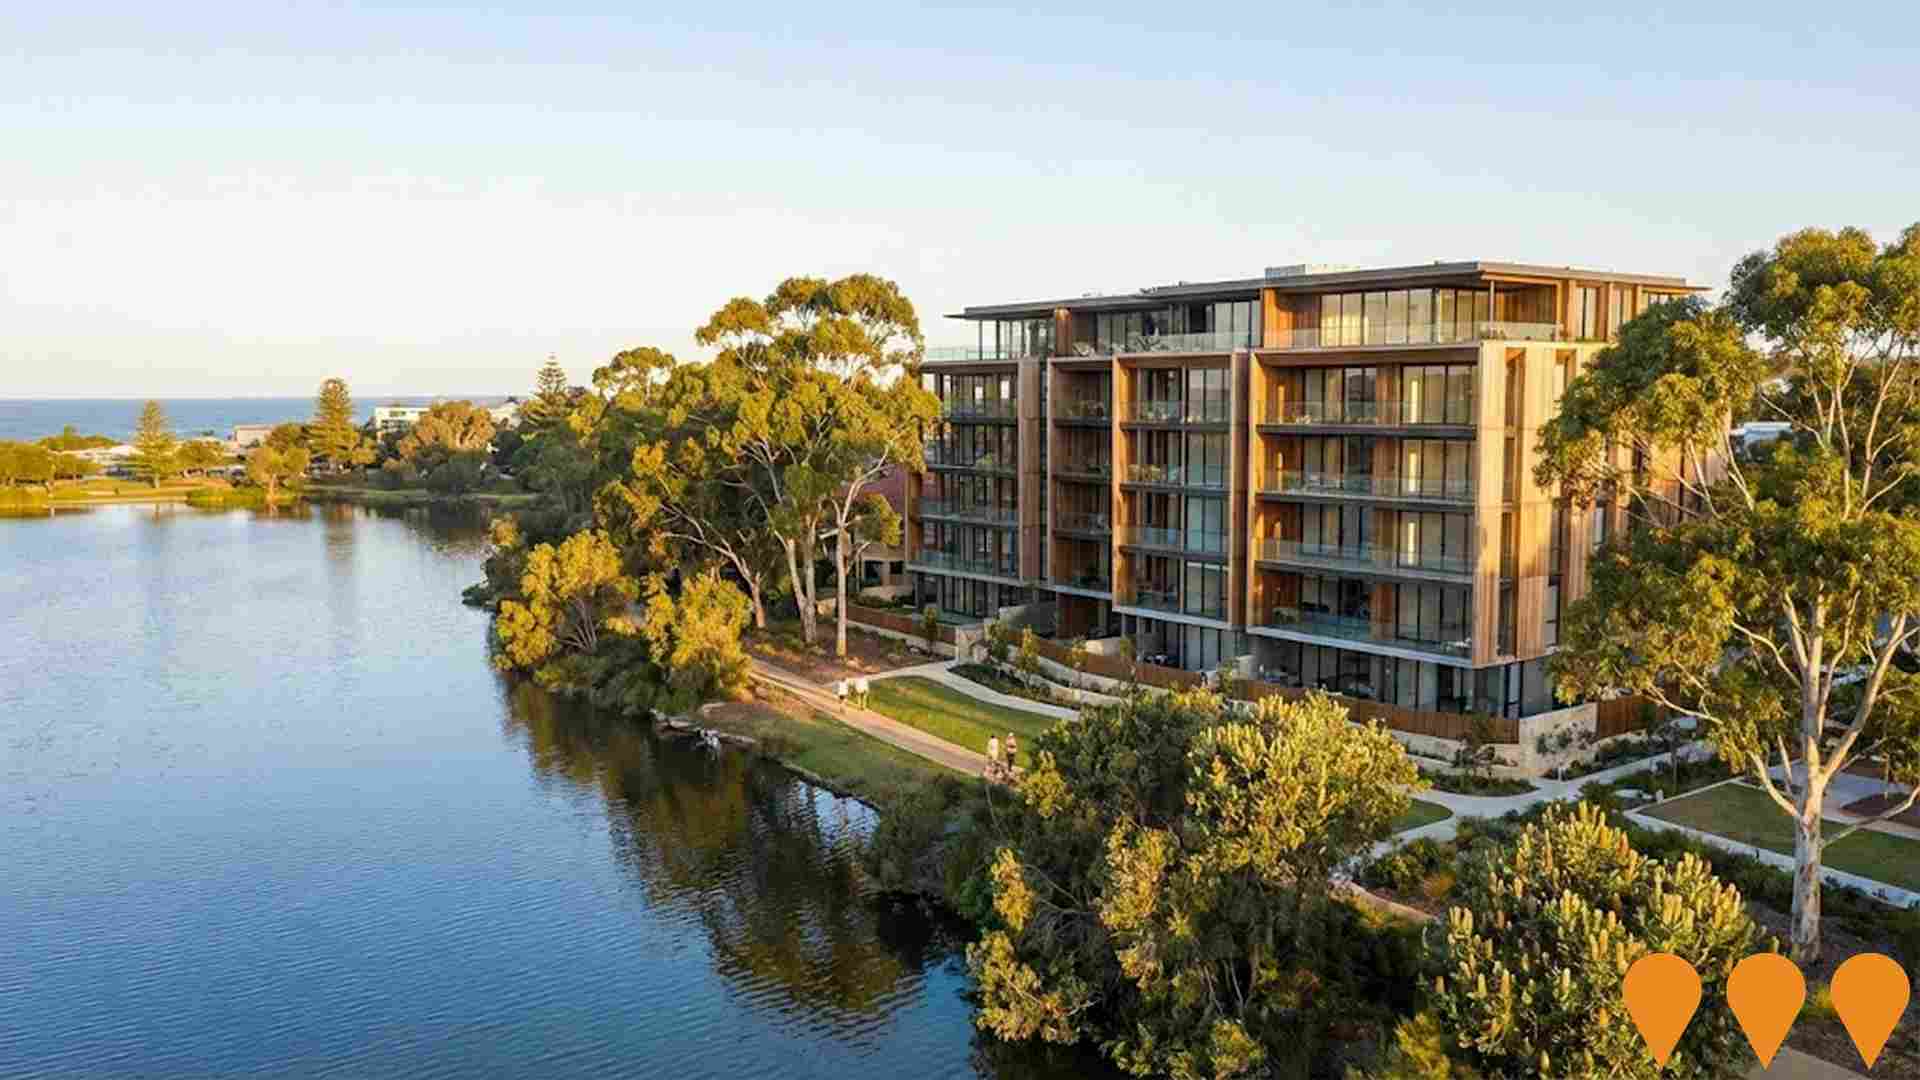
A boutique riverside development of 21 luxury apartments over 8 levels in Crawley, offering uninterrupted parkland and Swan River views. The project is developed by Edge Visionary Living, a premium and award-winning apartment developer in WA. Designed by Hillam Architects with Art Deco influences, located opposite iconic Steve's Hotel with direct river access. Located adjacent to JH Abrahams Reserve with panoramic views of the Swan River and Perth city skyline. Features luxury resident amenities including wellness garden, outdoor terrace, gym, sauna, quiet lounge and dining room. Completion scheduled for Q3 2025.
Employment
The labour market strength in Swanbourne - Mount Claremont positions it well ahead of most Australian regions
Swanbourne - Mount Claremont has an unemployment rate of 1.4%. As of June 2025, there are 5,619 residents employed, with a participation rate similar to Greater Perth's at 65.2%.
The dominant employment sectors include health care & social assistance, professional & technical, and education & training. Professional & technical services show strong representation, being 1.9 times the regional level. However, construction is under-represented, with only 4.8% of the workforce compared to Greater Perth's 9.3%. Many residents commute elsewhere for work based on Census data analysis.
Between June 2024 and June 2025, the labour force decreased by 1.4%, employment declined by 1.8%, leading to an unemployment rate rise of 0.4 percentage points. In contrast, Greater Perth saw employment rise by 3.7% and a labour force growth of 3.8%. National employment forecasts from Jobs and Skills Australia, released in May 2025, project national employment growth of 6.6% over five years and 13.7% over ten years. Applying these projections to Swanbourne - Mount Claremont's employment mix suggests local growth of approximately 7.3% over five years and 14.9% over ten years.
Frequently Asked Questions - Employment
Income
The economic profile demonstrates exceptional strength, placing the area among the top 10% nationally based on comprehensive AreaSearch income analysis
AreaSearch's latest postcode level ATO data, released for financial year 2022, indicates Swanbourne - Mount Claremont's median income among taxpayers is $69,181. The average income in this area is $139,631. Nationally, these figures place Swanbourne - Mount Claremont in the top percentile. In comparison, Greater Perth has a median income of $58,380 and an average of $78,020. Based on Wage Price Index growth of 14.2% since financial year 2022, current estimates for Swanbourne - Mount Claremont would be approximately $79,005 (median) and $159,459 (average) as of September 2025. Census data reveals that household, family, and personal incomes in Swanbourne - Mount Claremont rank highly nationally, between the 90th and 98th percentiles. The data shows that 41.2% of residents (4,333 people) fall into the $4,000+ income bracket, unlike regional trends where 32.0% fall within the $1,500 - $2,999 range. Higher earners represent a substantial presence with 51.9% exceeding $3,000 weekly. After housing costs, residents retain 88.7% of their income, reflecting strong purchasing power in the area. The area's SEIFA income ranking places it in the 10th decile.
Frequently Asked Questions - Income
Housing
Swanbourne - Mount Claremont is characterized by a predominantly suburban housing profile, with ownership patterns similar to the broader region
Swanbourne - Mount Claremont's dwelling structures, as per the latest Census, consisted of 79.4% houses and 20.7% other dwellings (semi-detached, apartments, 'other' dwellings). This compares to Perth metro's 68.6% houses and 31.3% other dwellings. Home ownership in the area was 43.6%, with mortgaged dwellings at 35.0% and rented ones at 21.3%. The median monthly mortgage repayment was $3,250, below Perth metro's average of $3,293. The median weekly rent was $450, matching Perth metro's figure but higher than the national average of $375. Nationally, Swanbourne - Mount Claremont's mortgage repayments were significantly higher at $1,863.
Frequently Asked Questions - Housing
Household Composition
Swanbourne - Mount Claremont has a typical household mix, with a higher-than-average median household size
Family households account for 76.6% of all households, including 41.8% couples with children, 25.7% couples without children, and 8.7% single parent families. Non-family households constitute the remaining 23.4%, with lone person households at 21.2% and group households comprising 2.3%. The median household size is 2.7 people, larger than the Greater Perth average of 2.6.
Frequently Asked Questions - Households
Local Schools & Education
Swanbourne - Mount Claremont demonstrates exceptional educational outcomes, ranking among the top 5% of areas nationally based on AreaSearch's comprehensive analysis of qualification and performance metrics
Swanbourne - Mount Claremont's educational attainment exceeds broader benchmarks. Among residents aged 15+, 57.2% hold university qualifications, compared to 27.9% in WA and 30.1% in Greater Perth. Bachelor degrees are the most common at 36.3%, followed by postgraduate qualifications (16.1%) and graduate diplomas (4.8%). Vocational pathways account for 17.5%.
Educational participation is high, with 34.8% of residents currently enrolled in formal education: 12.1% in secondary, 10.6% in primary, and 8.3% in tertiary education. The area has a robust network of 6 schools educating approximately 3,981 students, demonstrating exceptional performance (ICSEA: 1163). It includes 4 primary and 2 K-12 schools. As an education hub with 37.9 school places per 100 residents, it attracts students from surrounding communities, significantly above the regional average of 18.1.
Frequently Asked Questions - Education
Schools Detail
Nearby Services & Amenities
Transport
Transport servicing is good compared to other areas nationally based on assessment of service frequency, route connectivity and accessibility
The analysis shows that Swanbourne - Mount Claremont has 91 active public transport stops, served by a mix of trains and buses. These stops are covered by 17 different routes, offering a total of 3,709 weekly passenger trips. The area's transport accessibility is rated excellent, with residents usually located about 186 meters from the nearest stop.
On average, services run 529 times daily across all routes, which translates to roughly 40 weekly trips per individual stop.
Frequently Asked Questions - Transport
Transport Stops Detail
Health
Swanbourne - Mount Claremont's residents boast exceedingly positive health performance metrics with very low prevalence of common health conditions across all age groups
Swanbourne - Mount Claremont demonstrates excellent health outcomes with very low prevalence of common conditions across all ages. The private health cover rate is approximately 83% (8,750 people), compared to 87.5% in Greater Perth and a national average of 55.3%. Arthritis and asthma are the most prevalent conditions, affecting 7.1% and 6.5% respectively.
73.8% of residents report no medical ailments, similar to Greater Perth's 74.2%. As of 2021, 21.2% of residents are aged 65 and over (2,225 people). Senior health outcomes align with the general population's profile.
Frequently Asked Questions - Health
Cultural Diversity
The level of cultural diversity witnessed in Swanbourne - Mount Claremont was found to be above average when compared nationally for a number of language and cultural background related metrics
Swanbourne-Mount Claremont has a higher-than-average cultural diversity, with 11.5% of its residents speaking a language other than English at home and 29.6% born overseas. Christianity is the predominant religion in Swanbourne-Mount Claremont, comprising 51.8% of the population. Judaism, however, is more prevalent here compared to Greater Perth, with 0.5% versus 0.4%.
The top three ancestry groups are English (31.4%), Australian (23.8%), and Scottish (9.3%). Notably, South African (1.4%) and Polish (0.9%) ethnicities are overrepresented compared to regional averages of 1.1% and 0.8%, respectively.
Frequently Asked Questions - Diversity
Age
Swanbourne - Mount Claremont hosts an older demographic, ranking in the top quartile nationwide
The median age in Swanbourne - Mount Claremont is 42 years, which is significantly higher than Greater Perth's average of 37 years and Australia's average of 38 years. The 15-24 age group makes up 14.7% of the population compared to Greater Perth, while the 25-34 cohort constitutes 8.5%. According to post-2021 Census data, the 75-84 age group has increased from 6.2% to 7.4%, whereas the 45-54 cohort has decreased from 14.9% to 13.6%. Population forecasts for 2041 suggest substantial demographic changes in Swanbourne - Mount Claremont, with the 85+ group expected to grow by 135% (from 358 to 842 people). The combined 65+ age groups will account for 63% of total population growth, reflecting the area's aging demographic profile. Conversely, the 0-4 and 5-14 cohorts are projected to experience population declines.
