Chart Color Schemes
This analysis uses Suburbs and Localities (SAL) boundaries, which can materially differ from Statistical Areas (SA2) even when sharing the same name.
SAL boundaries are defined by Australia Post and the Australian Bureau of Statistics to represent commonly-known suburb names used in postal addresses.
Statistical Areas (SA2) are designed for census data collection and may combine multiple suburbs or use different geographic boundaries. For comprehensive analysis, consider reviewing both boundary types if available.
est. as @ -- *
2021 Census | -- people







Curious about local property values? Filter the chart to assess the volume and appreciation (including resales) trends and regional comparisons, or scroll to the map below view this information at an individual property level.
Find a Recent Sale

Sales Detail
Westmeadows has an estimated 6,871 residents, up from 6,502 at the 2021 Census — a change of 369 people, or 5.7%. Growth has averaged 0.8% a year over five years. Overseas migration accounts for 83.0% of that increase. That puts 1,420 residents on each square kilometre. Population is estimated from ABS Estimated Resident Population releases and GNAF address data, re-based from the 2021 Census and updated annually.
Detail
According to AreaSearch evaluations combining broader Australian Bureau of Statistics updates with 61 validated new addresses identified following the Census, the suburb of Westmeadows has an estimated resident population of 6,871 as of Aug 2026. This figure marks an expansion of 369 people (5.7%) compared to the 6,502 people counted in the 2021 Census, informed by the ABS ERP release from June 2025 alongside post-Census address verification. This demographic count produces a density of 1,419 persons per square kilometer, placing the suburb above the nationwide benchmark in AreaSearch assessments. Inflow from overseas migration served as the core engine of recent demographic expansion, accounting for roughly 83.0% of total population additions.
Demographic modeling by AreaSearch incorporates 2024 ABS/Geoscience Australia projections pegged to a 2022 baseline for local SA2 zones, while uncovered areas rely on 2023 Victorian State Government Regional/LGA projections converted via weighted population growth aggregation from LGA down to SA2 boundaries. Age-bracket growth rates derived from these models are similarly projected across all localities for 2032 to 2041. Forward-looking projections place the suburb of Westmeadows in the highest quartile among statistical divisions analyzed by AreaSearch, with aggregated SA2 figures pointing to an addition of 2,200 persons by 2041, representing a cumulative increase of 32.0% across the 16 years.
Frequently Asked Questions - Population
96 new dwellings have been approved in Westmeadows over the past five years, an average of 19 a year. That places the area in the 57th percentile for residential development activity nationally, about 3 approvals per 1,000 residents a year. Approvals are currently running at an annualised 28, running ahead of that longer-run average. Figures come from ABS building approvals aggregated to this Suburb (SAL) boundary and are updated monthly as the ABS releases them.
Detail
Statistical building permit records compiled by AreaSearch show that Westmeadows averaged roughly 19 residential approvals annually, yielding an estimated 96 homes across the prior 5 financial years, with 28 approvals documented to date in FY-25. Because an average of 3.4 new residents entered per dwelling built over the past 5 financial years (from FY-21 to FY-25), construction volume trails population expansion significantly, creating upward pressure on prices through heightened buyer competition. New residences carry an average construction value of $545,000, moderately exceeding regional benchmarks and pointing toward superior build quality, while $4.6 million in commercial approvals during the current financial year underscores the predominantly residential profile of the locality.
Dwelling creation in Westmeadows lags Greater Melbourne substantially, trailing the metropolitan per-person benchmark by 78.0%. Although construction has gained momentum recently, this relative shortfall of new supply typically elevates demand and valuations across existing properties, while trailing national output levels to signal market maturity and potential zoning or land boundaries. Recent building approvals are split evenly between standalone houses at 50.0% and medium-to-high density structures at 50.0%. This growing focus on denser residential formats provides accessible entry points for first-home buyers, downsizers, and investors, marking a noticeable pivot from the established stock where houses comprise 77.0% as land becomes scarcer and preferences shift. The market maintains a low-density profile with roughly 240 people per approved dwelling. Projected demographic growth indicates that Westmeadows will add 2,200 residents leading up to 2041 according to the latest quarterly estimate from AreaSearch. If residential development maintains its prevailing tempo, housing availability may fail to match population inflows, potentially intensifying buyer demand and driving property value appreciation.
Frequently Asked Questions - Development
Development applications around Westmeadows
SOURCE: Planning portals and council registers, compiled by AreaSearch. Distance & bearing measured from the suburb midpoint.
AreaSearch tracks 3 current infrastructure and development projects inside Westmeadows, worth an estimated $48 million. A further 89 sit in the immediately surrounding suburbs, taking the tracked pipeline within reach of the area to $180.8 billion. 21 are already under construction and 29 are due for completion within three years. The pipeline spans residential development, transport & logistics and communities, precincts & urban renewal. Records are compiled from Infrastructure Australia, state agencies, council planning portals and public announcements, reviewed and updated daily, then ranked by proximity, construction stage, completion horizon and project scale.
Detail
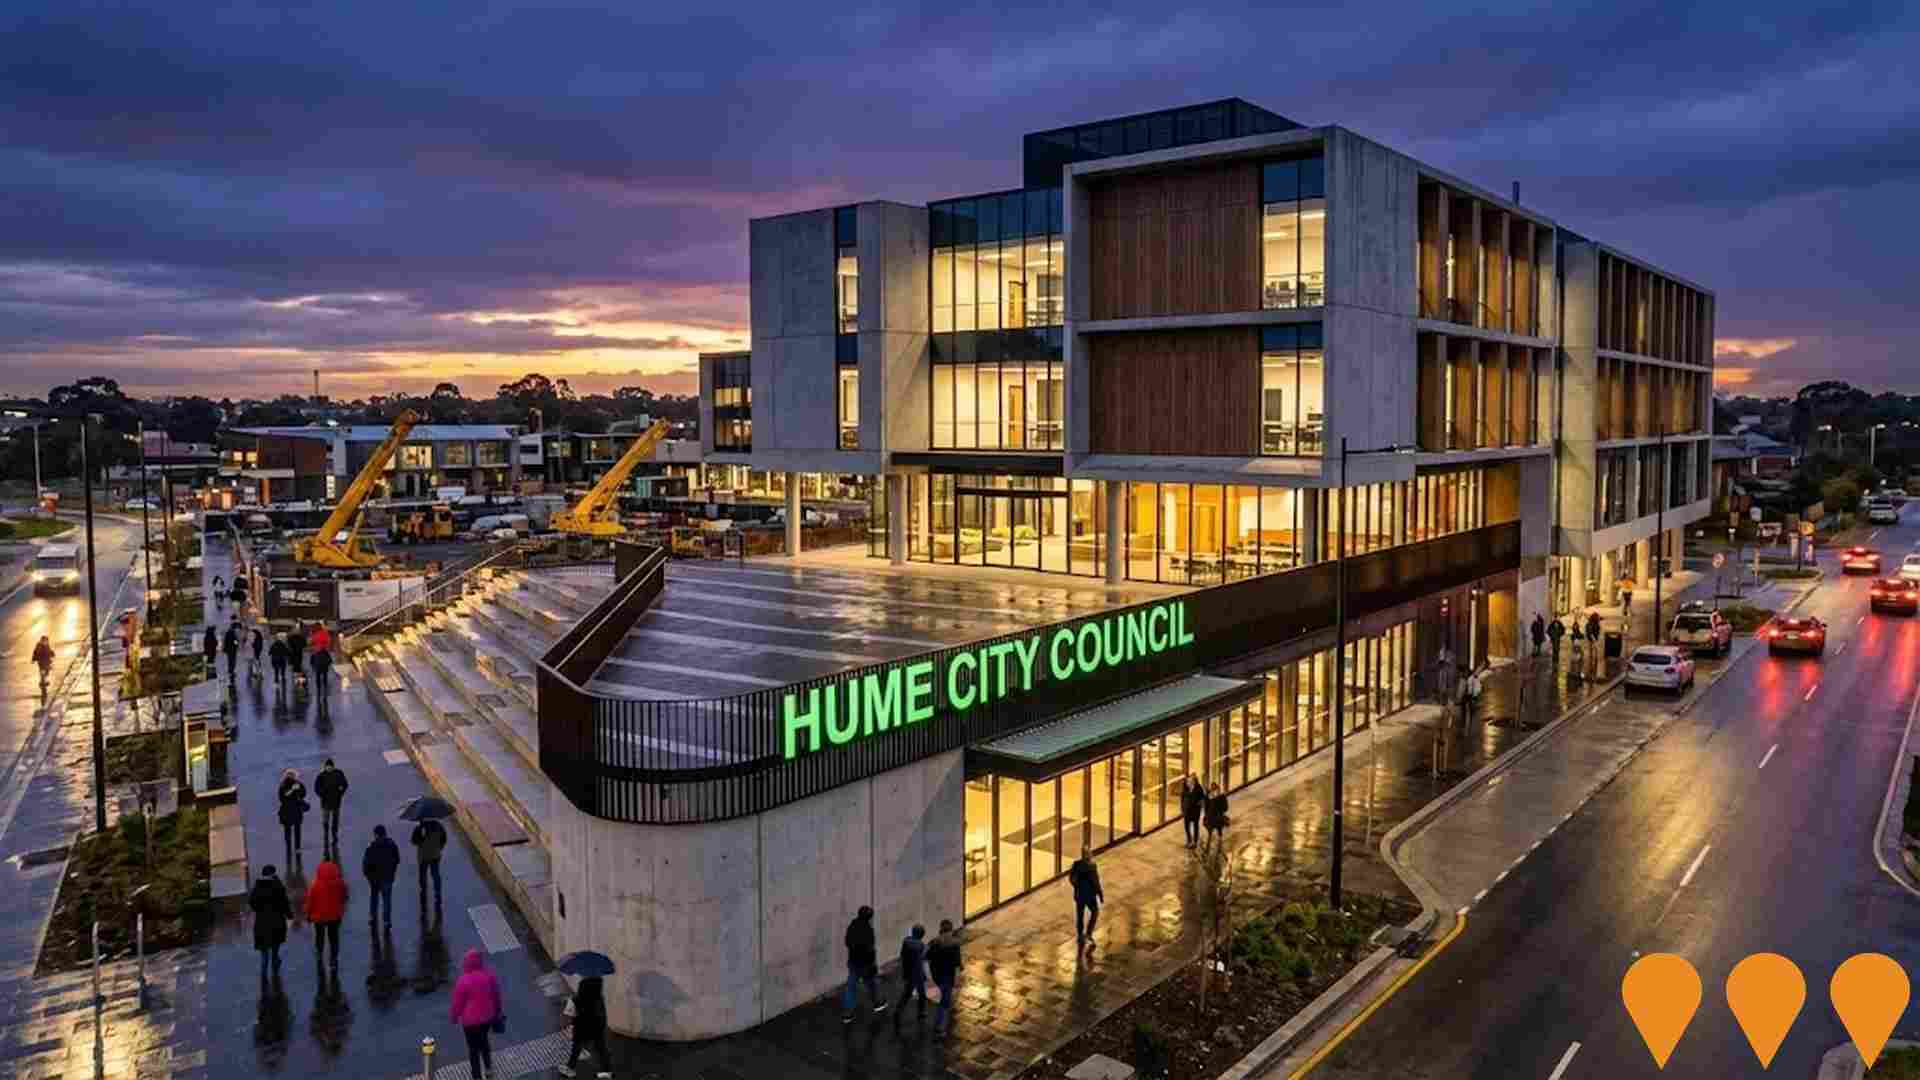
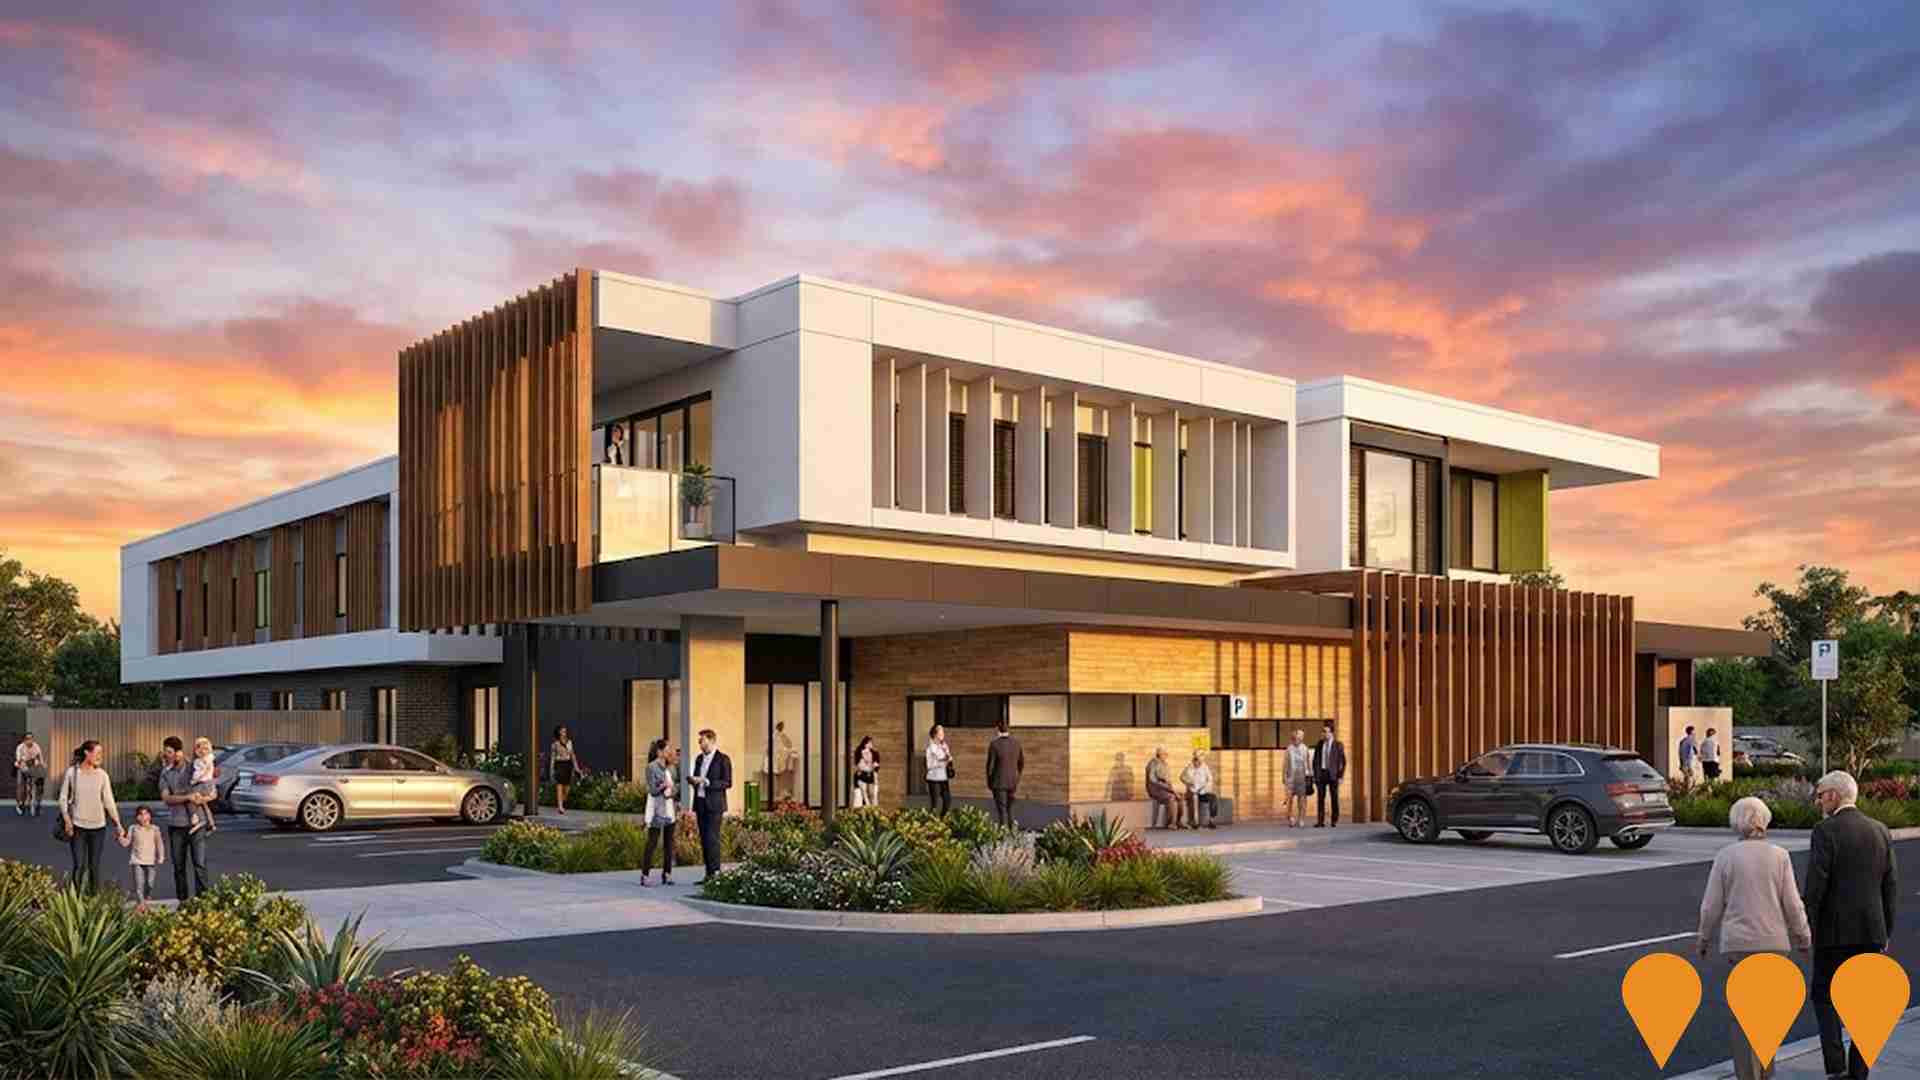
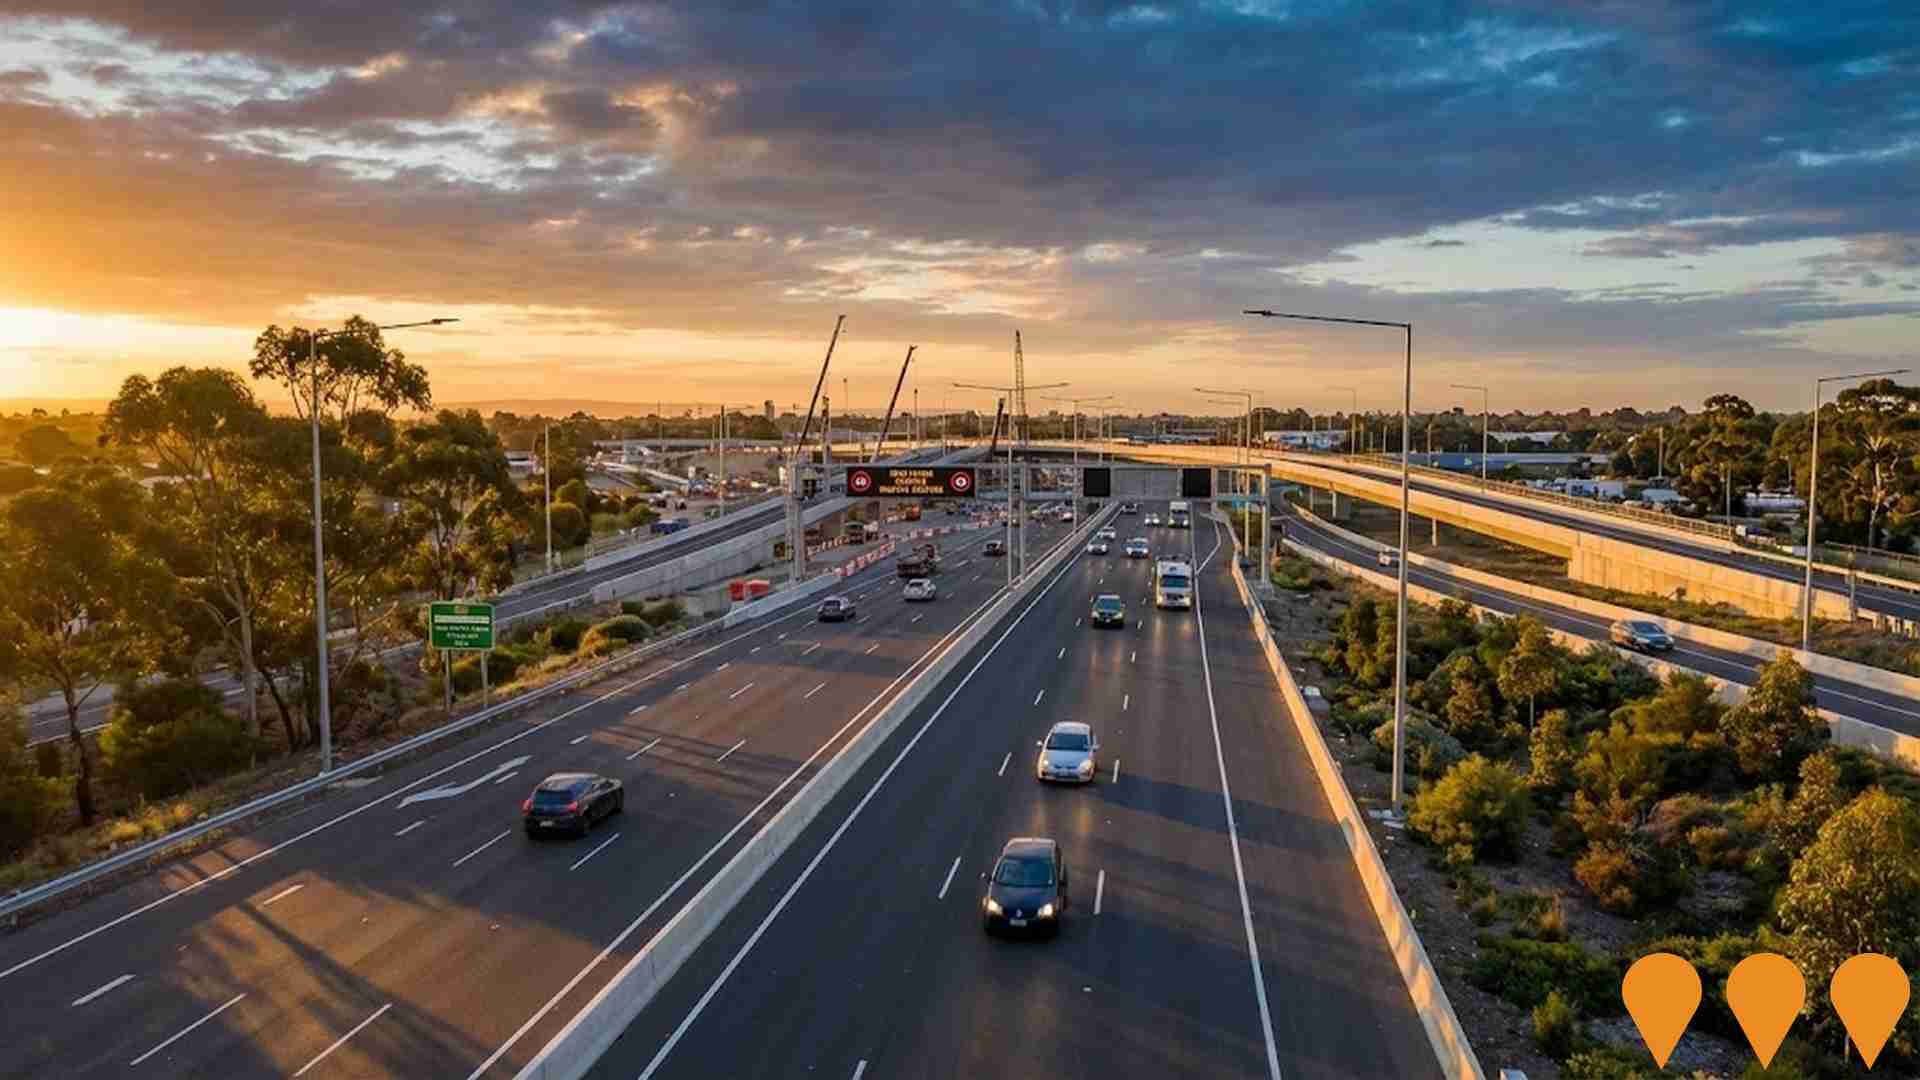
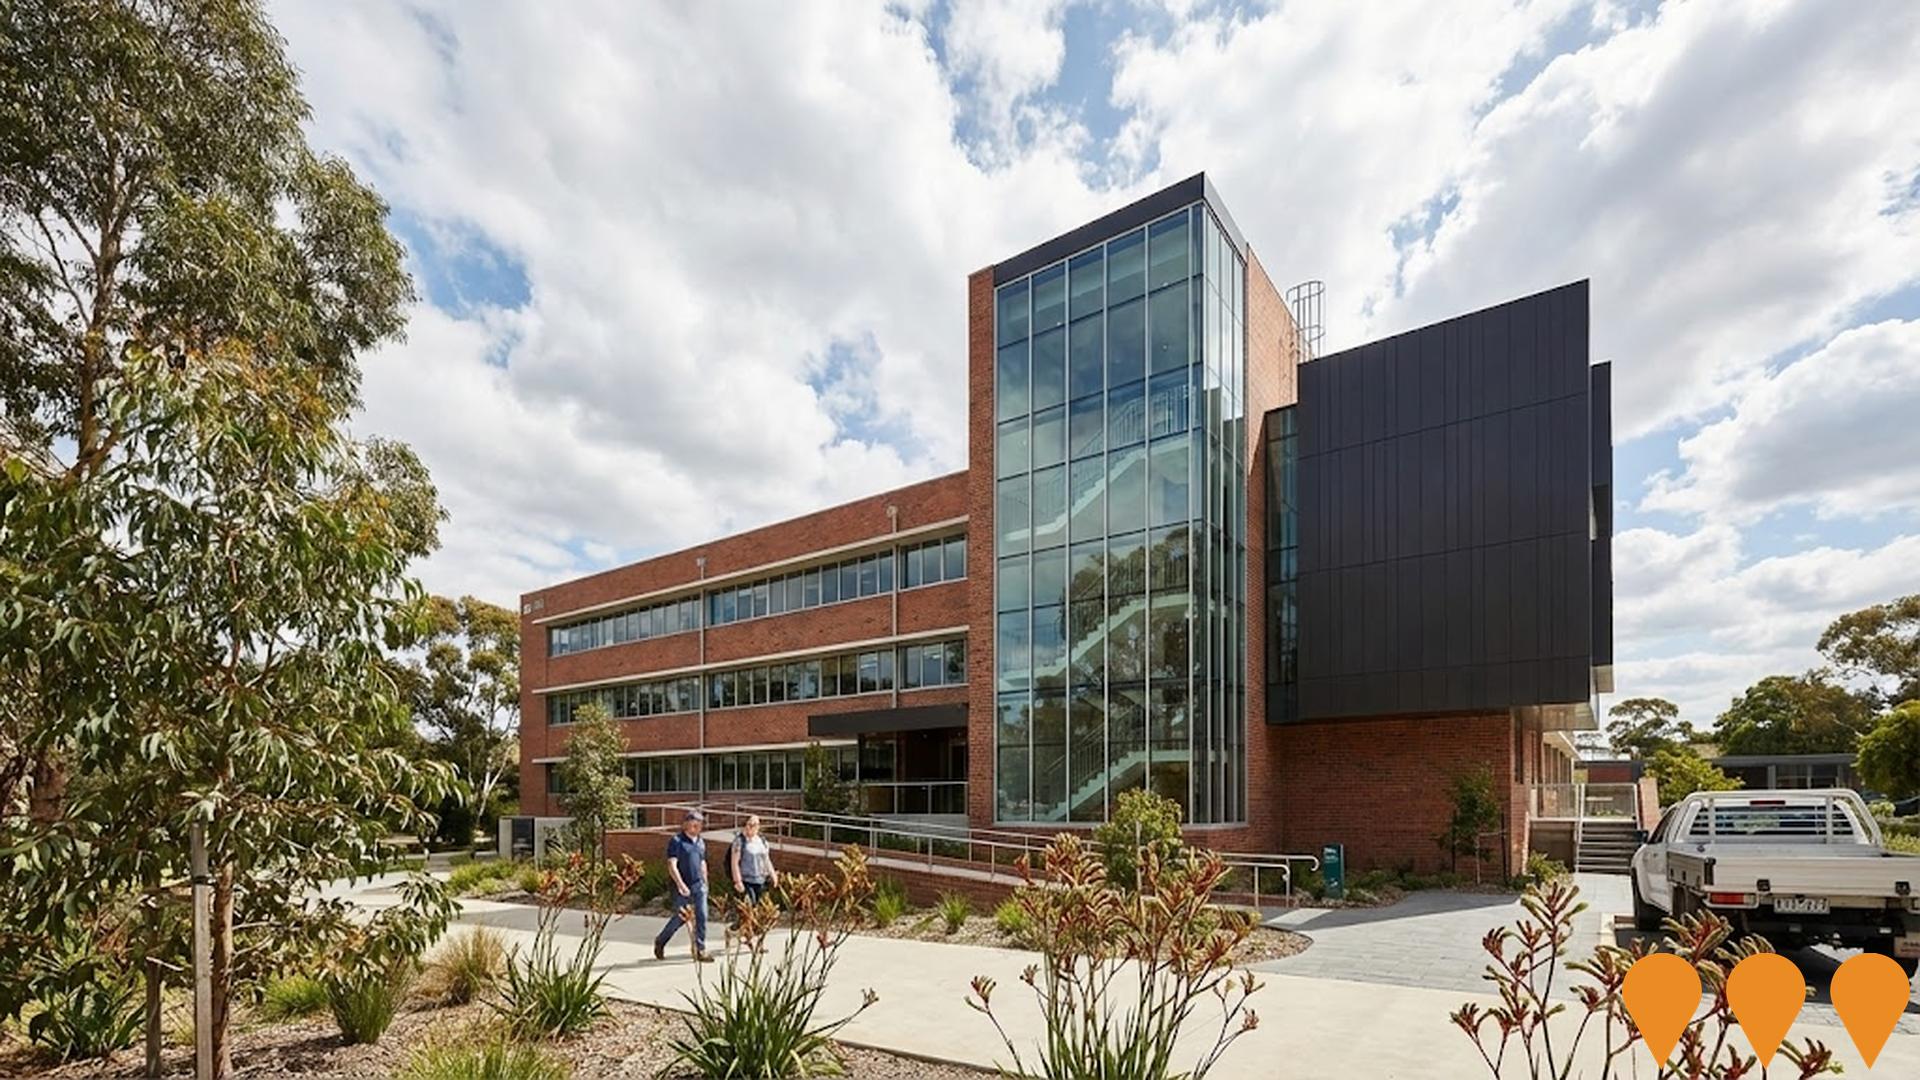
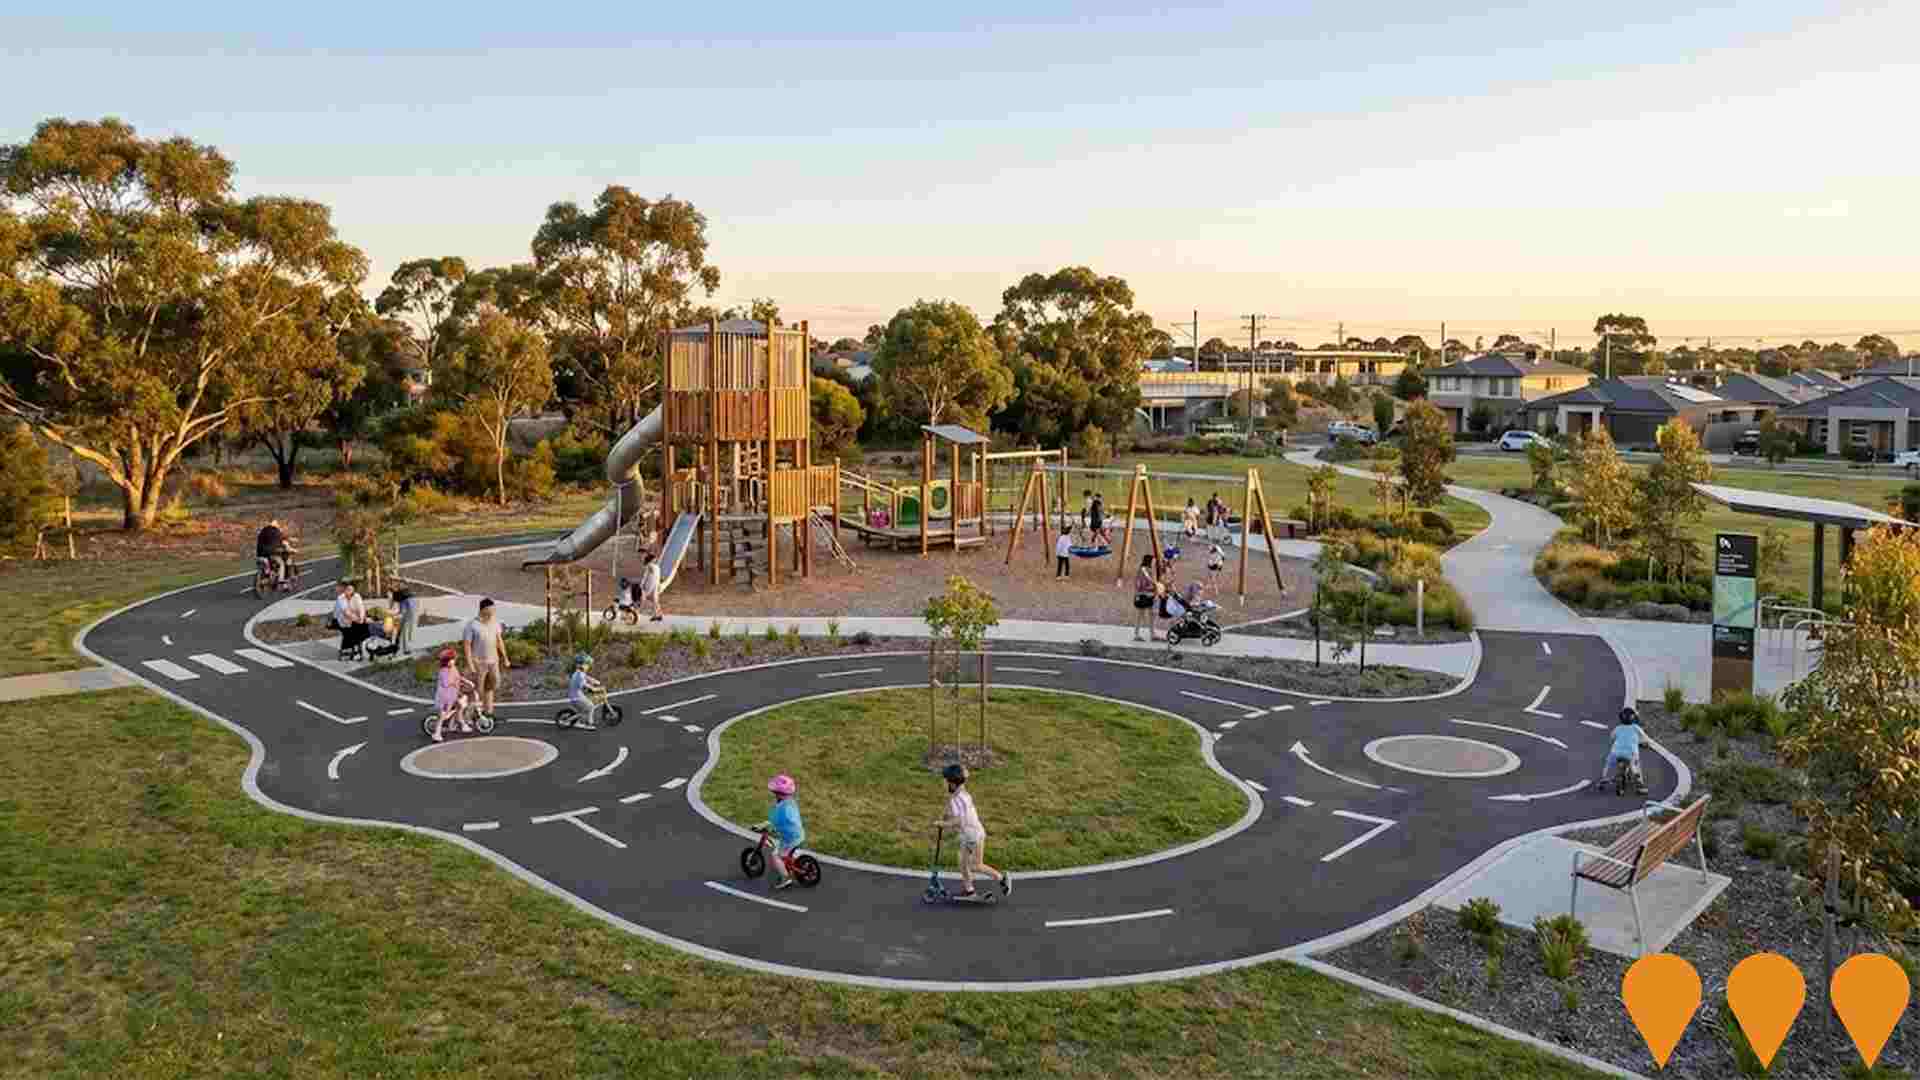
Infrastructure upgrades, major works, and strategic planning decisions play a defining role in shaping local community performance. AreaSearch has pinpointed 26 notable initiatives positioned to influence the area, with prominent undertakings comprising the Gladstone Park Shopping Centre Refurbishment and Expansion, The Parks Gladstone Park, the Greenvale to Attwood Shared Path Project, and developments at 9 Tindale Court, Attwood, which feature among the most impactful local projects.
Professional plan users can use the search below to filter and access additional projects.
INFRASTRUCTURE SEARCH
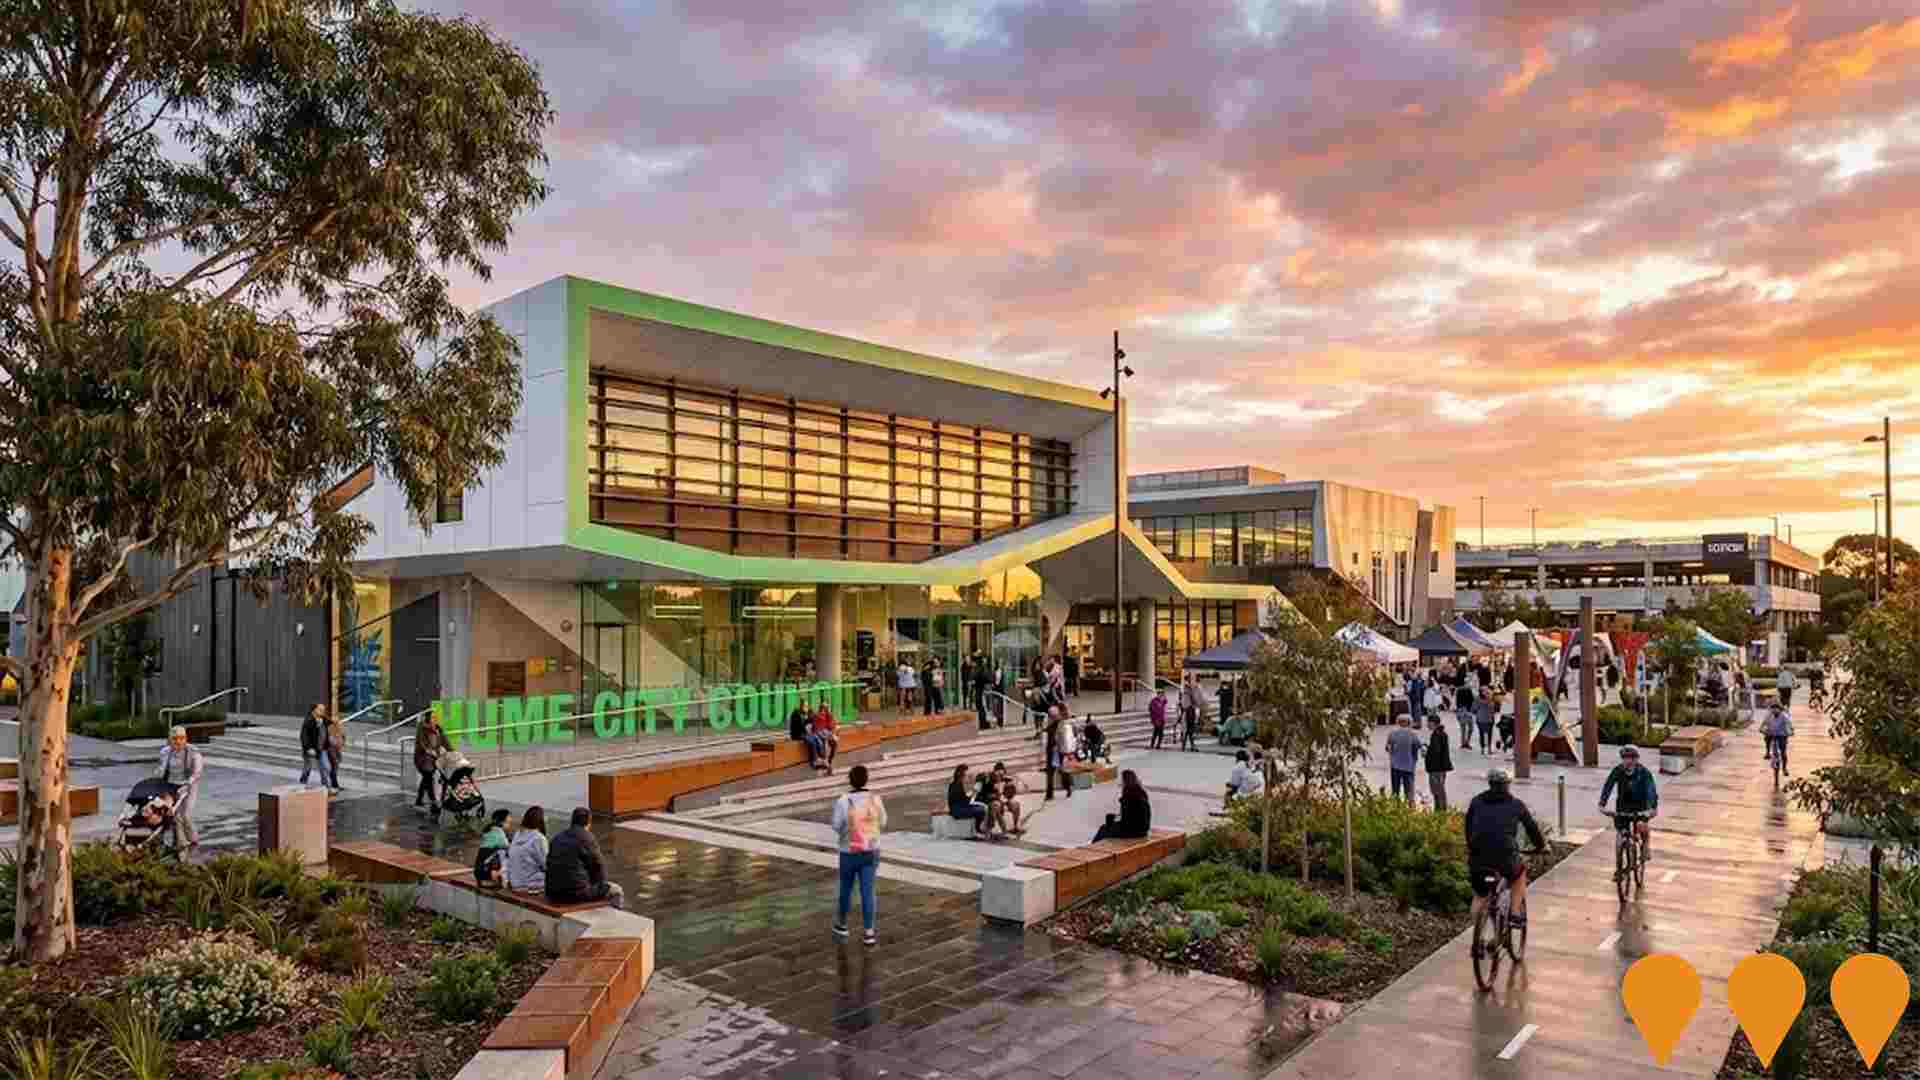
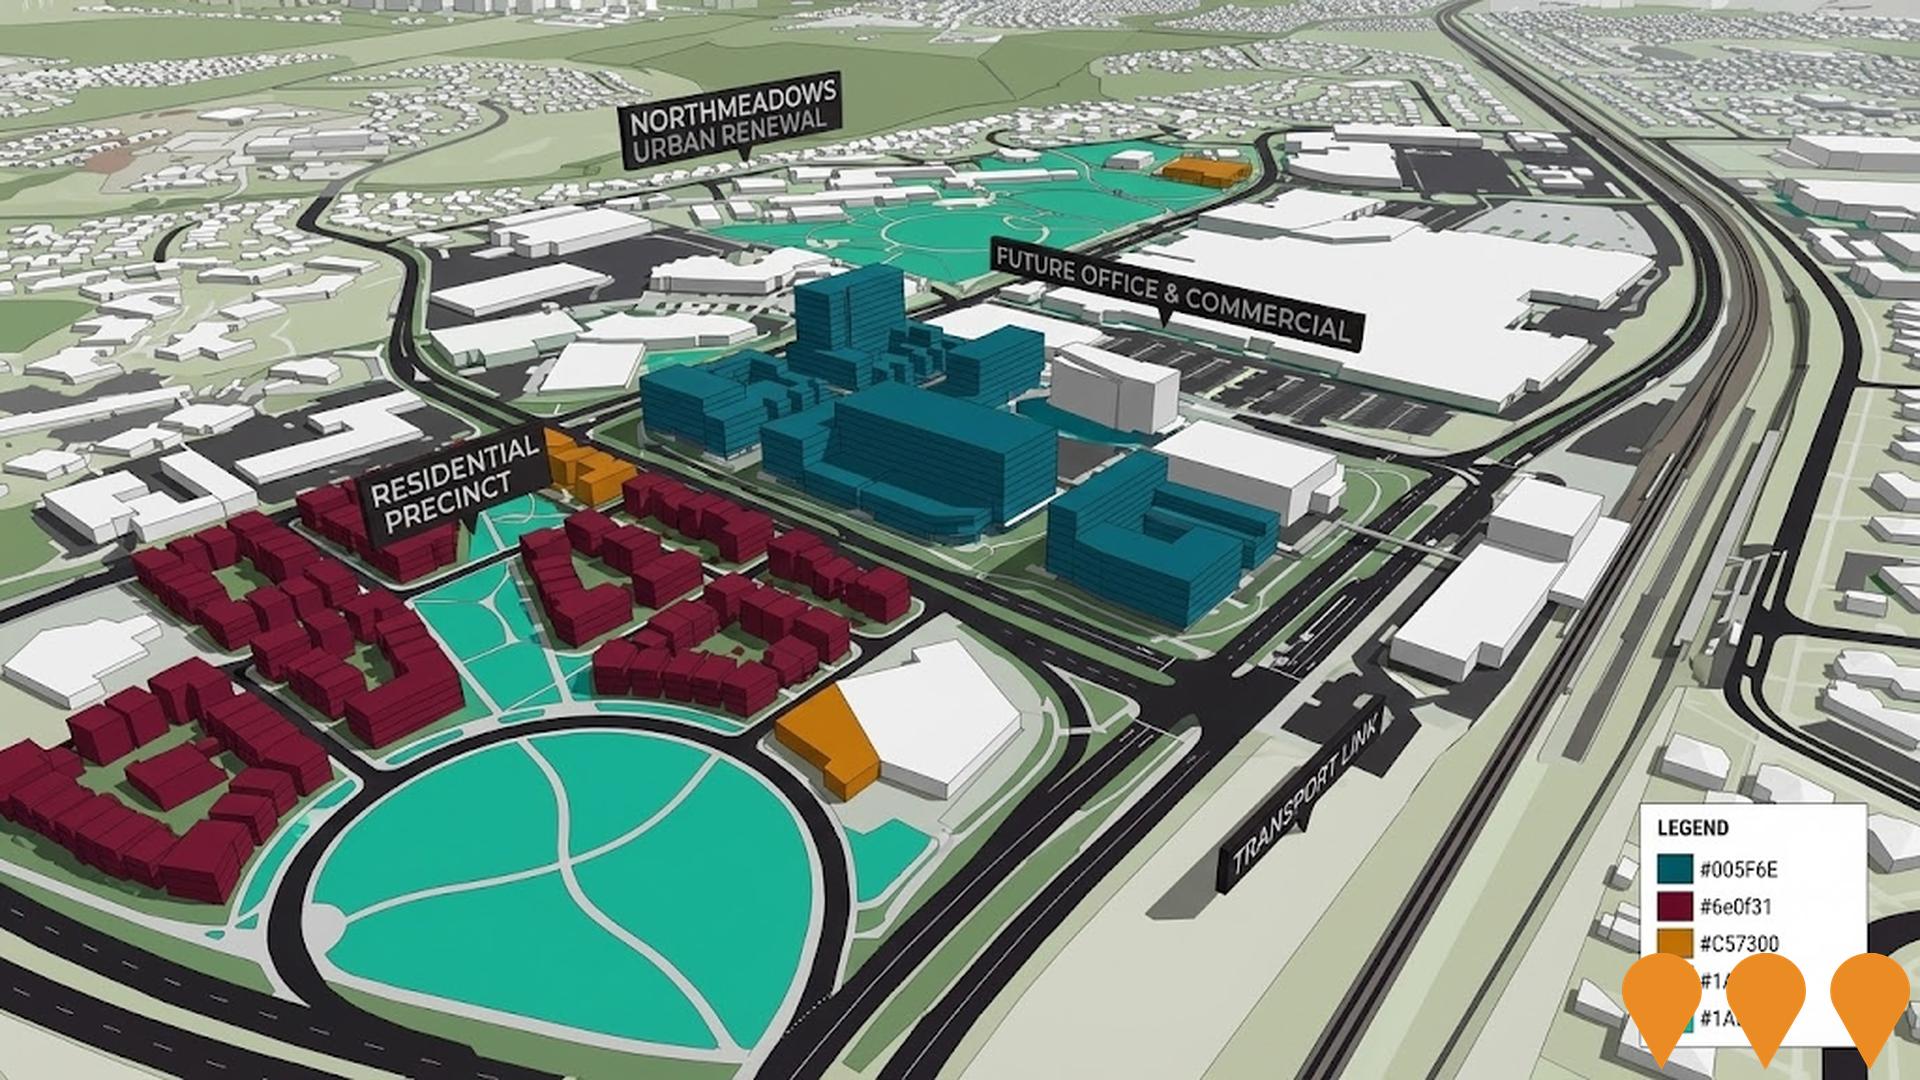
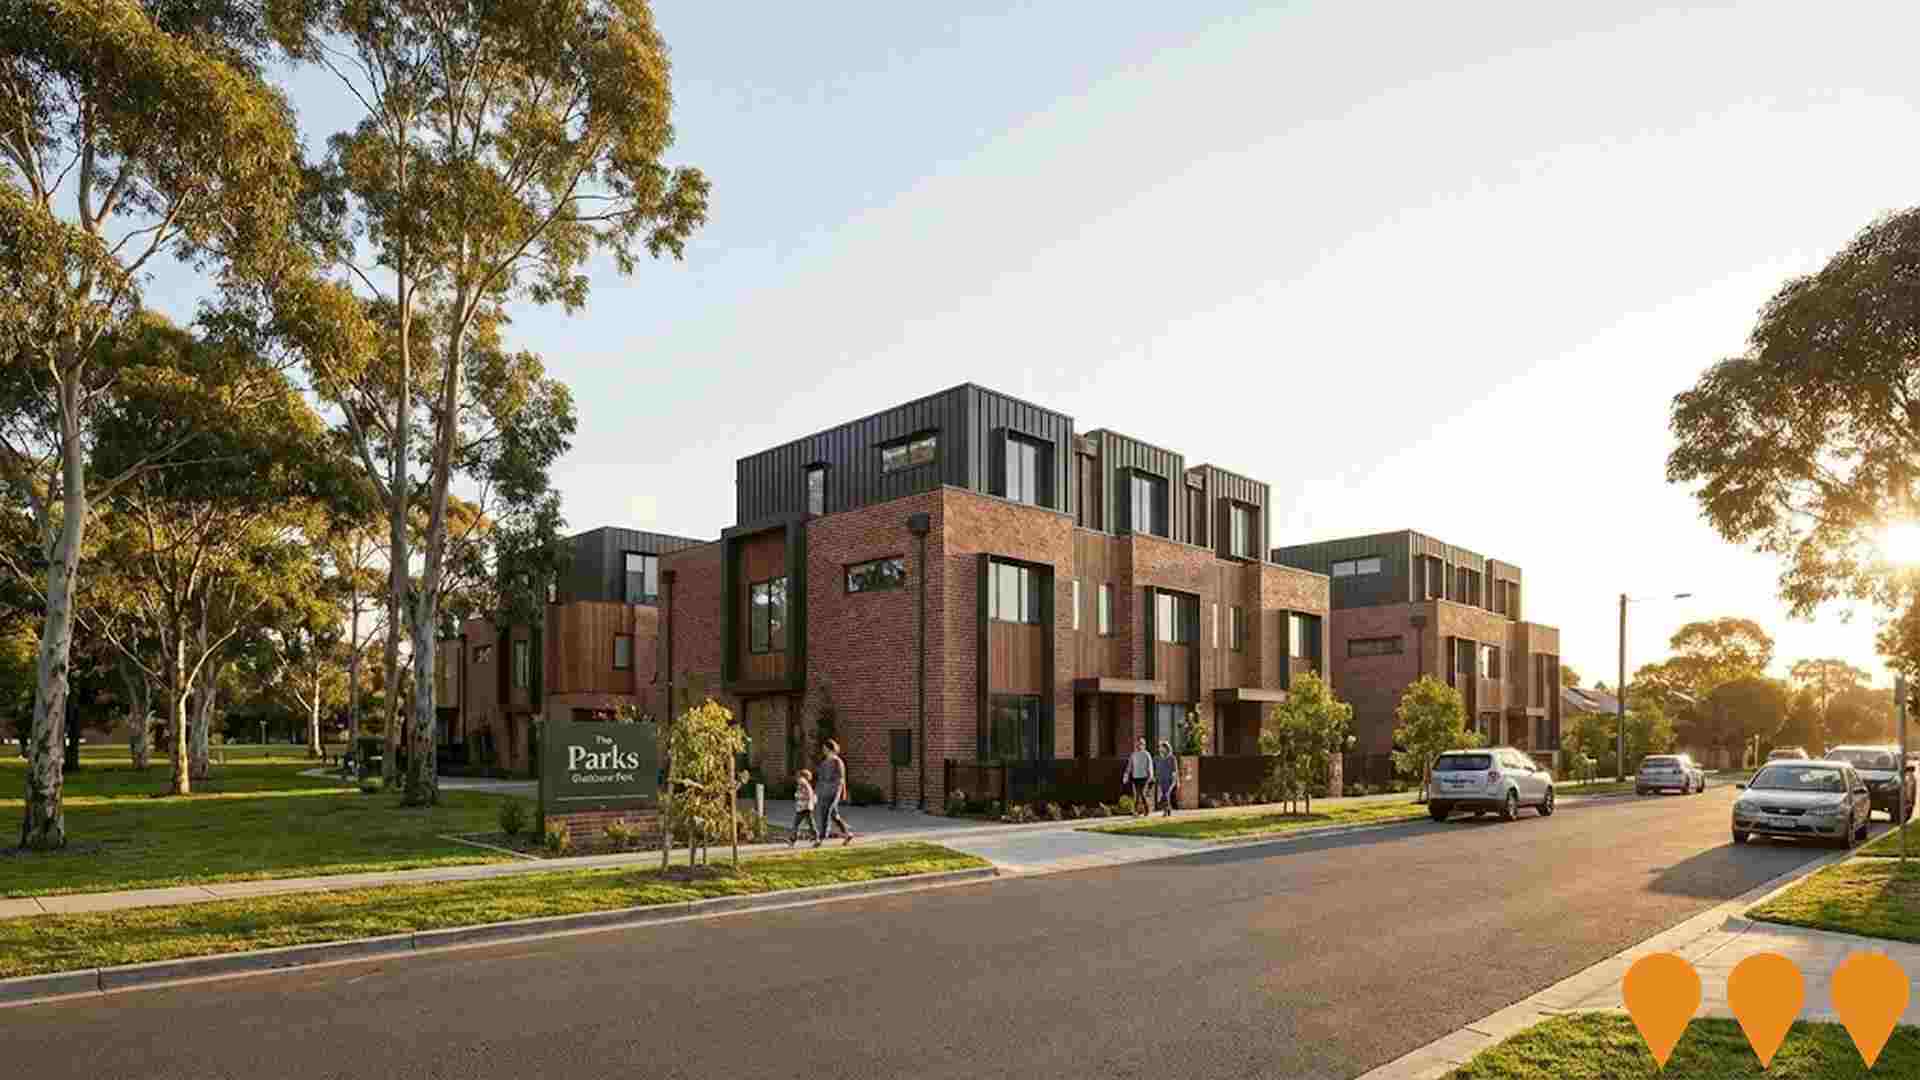
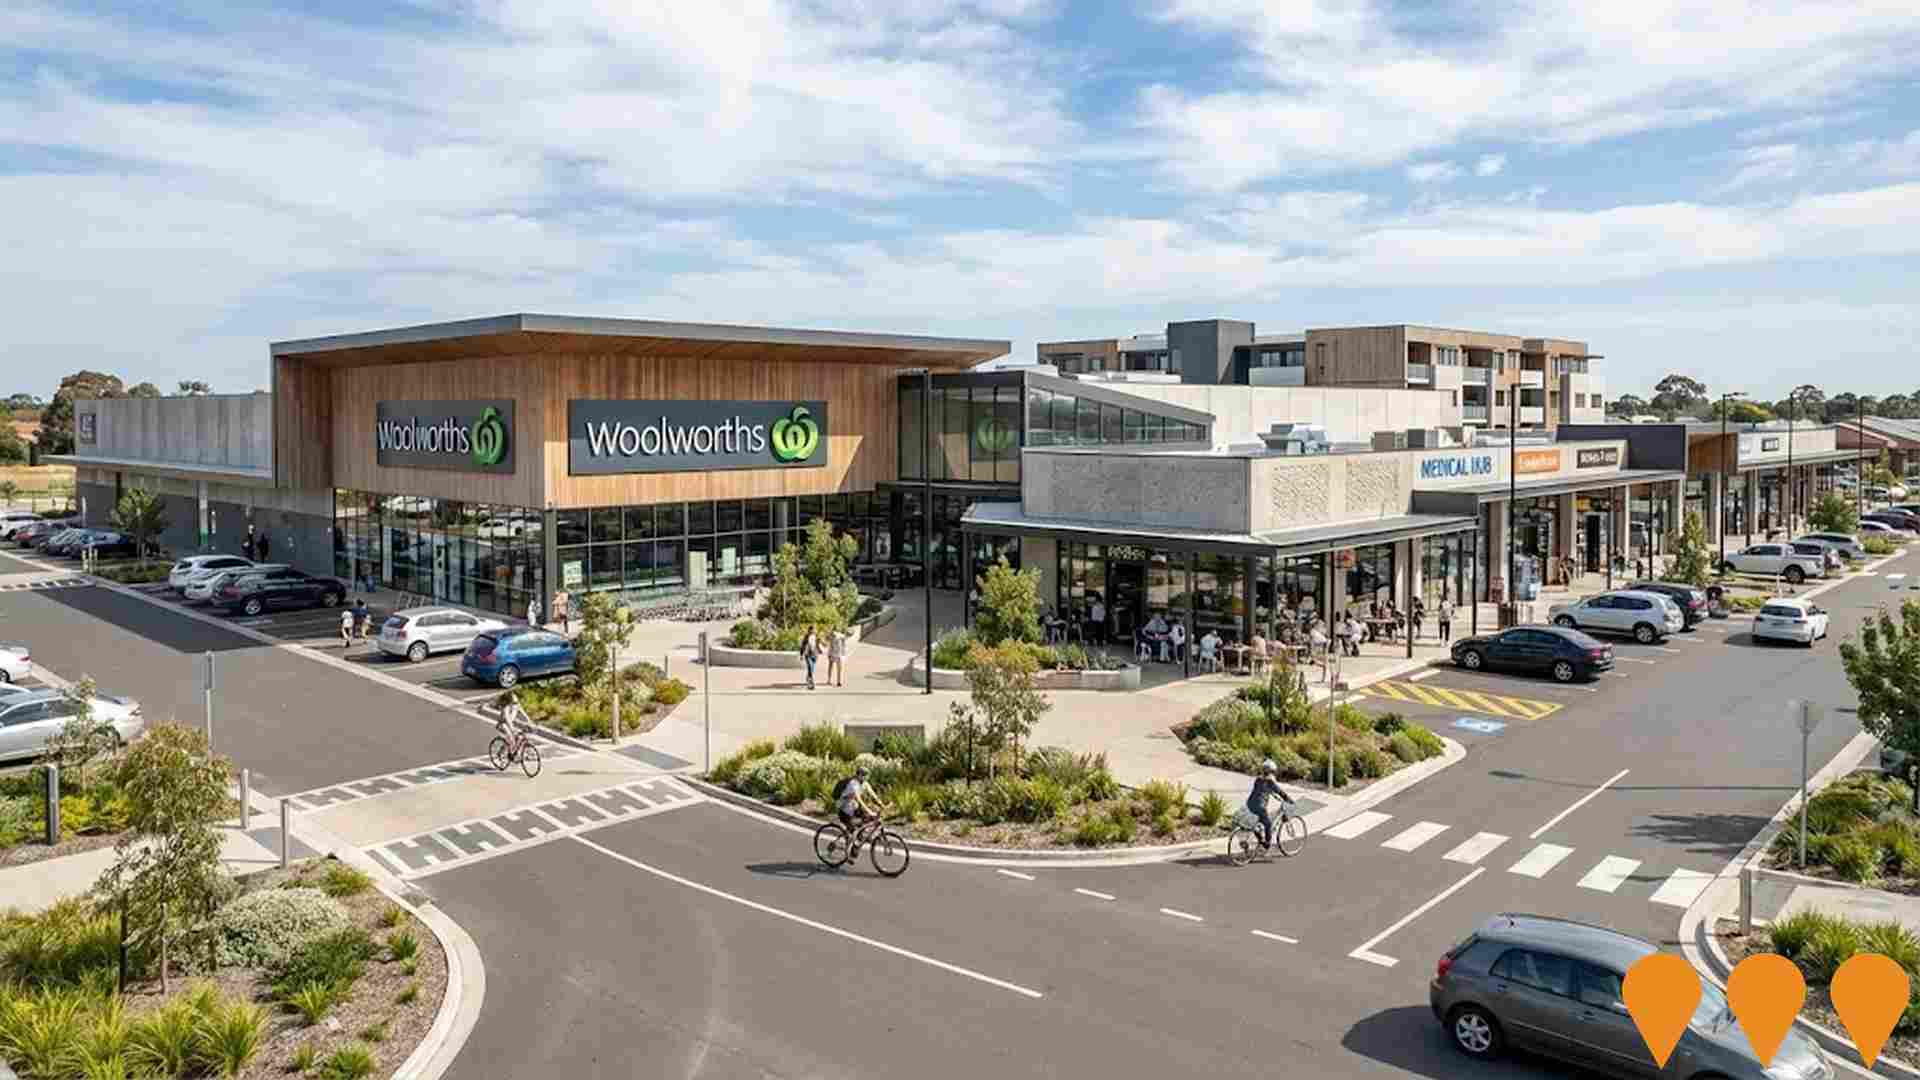
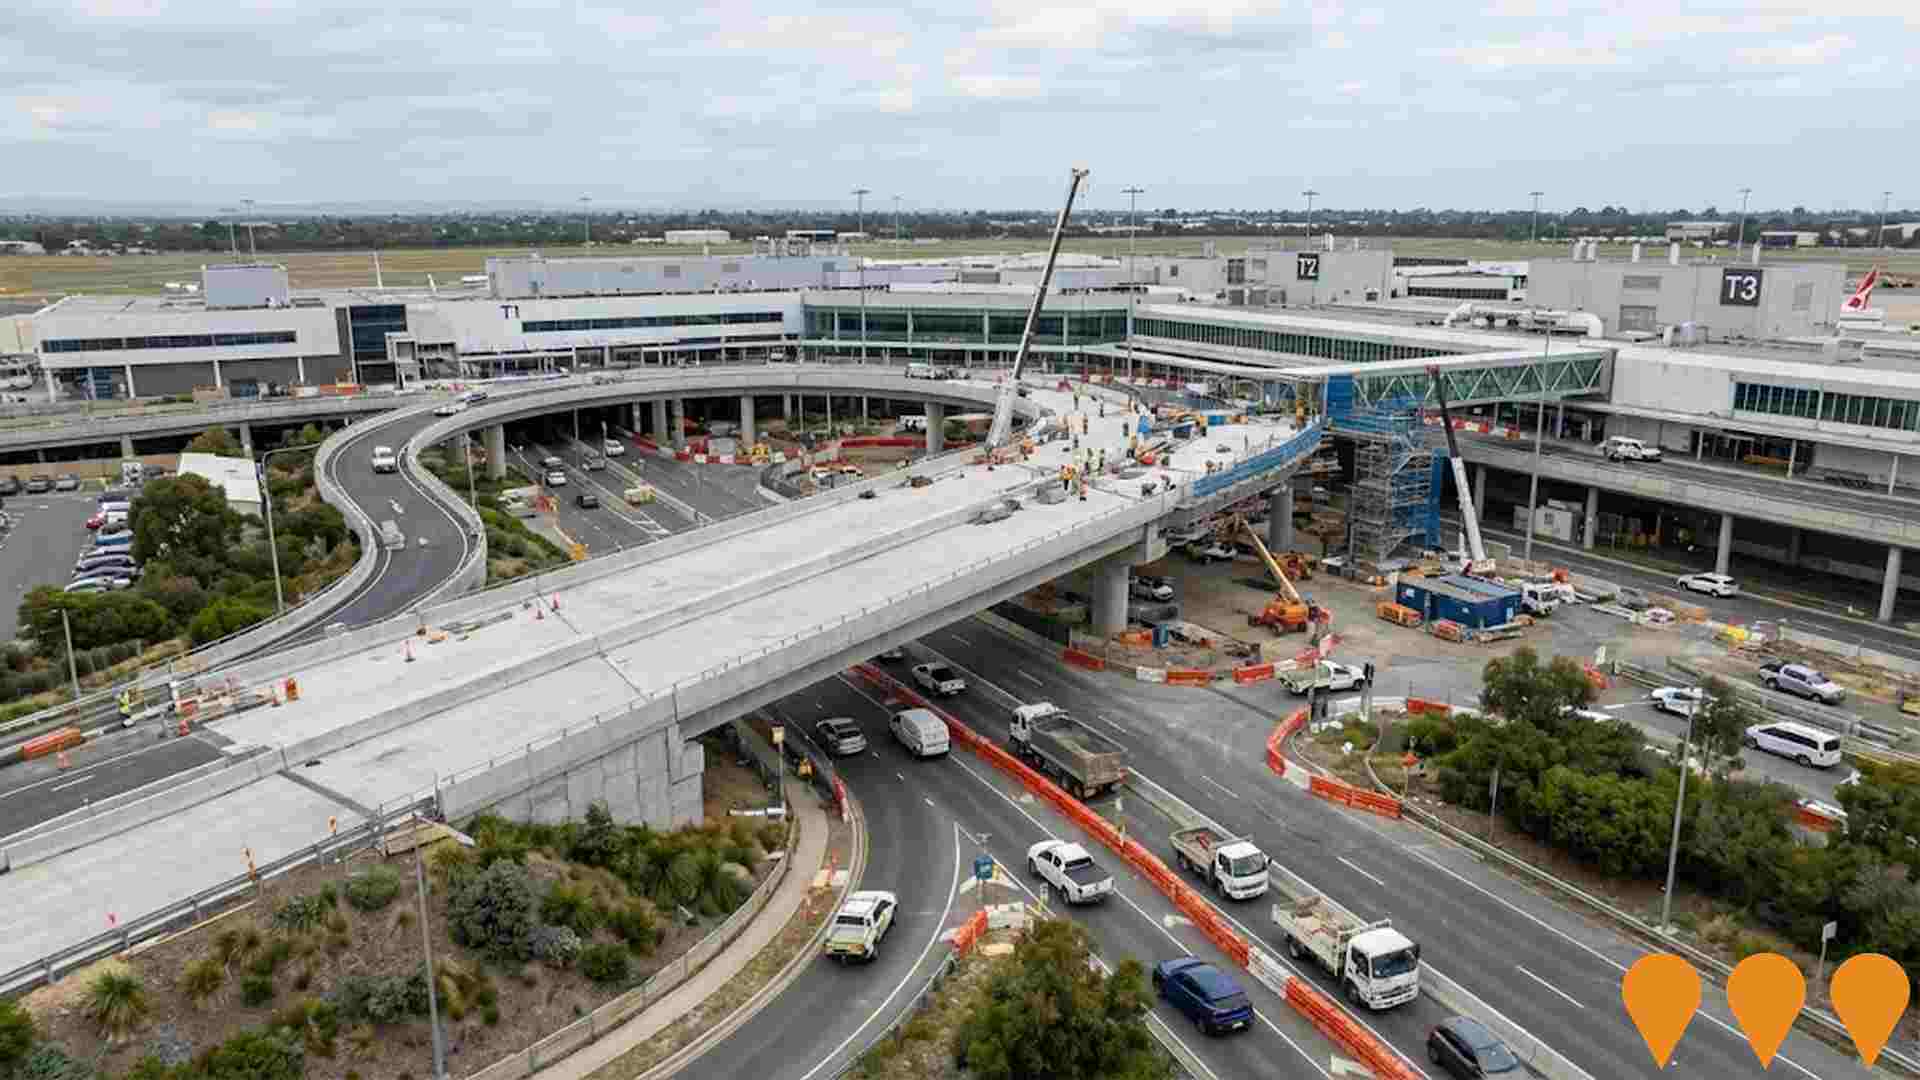
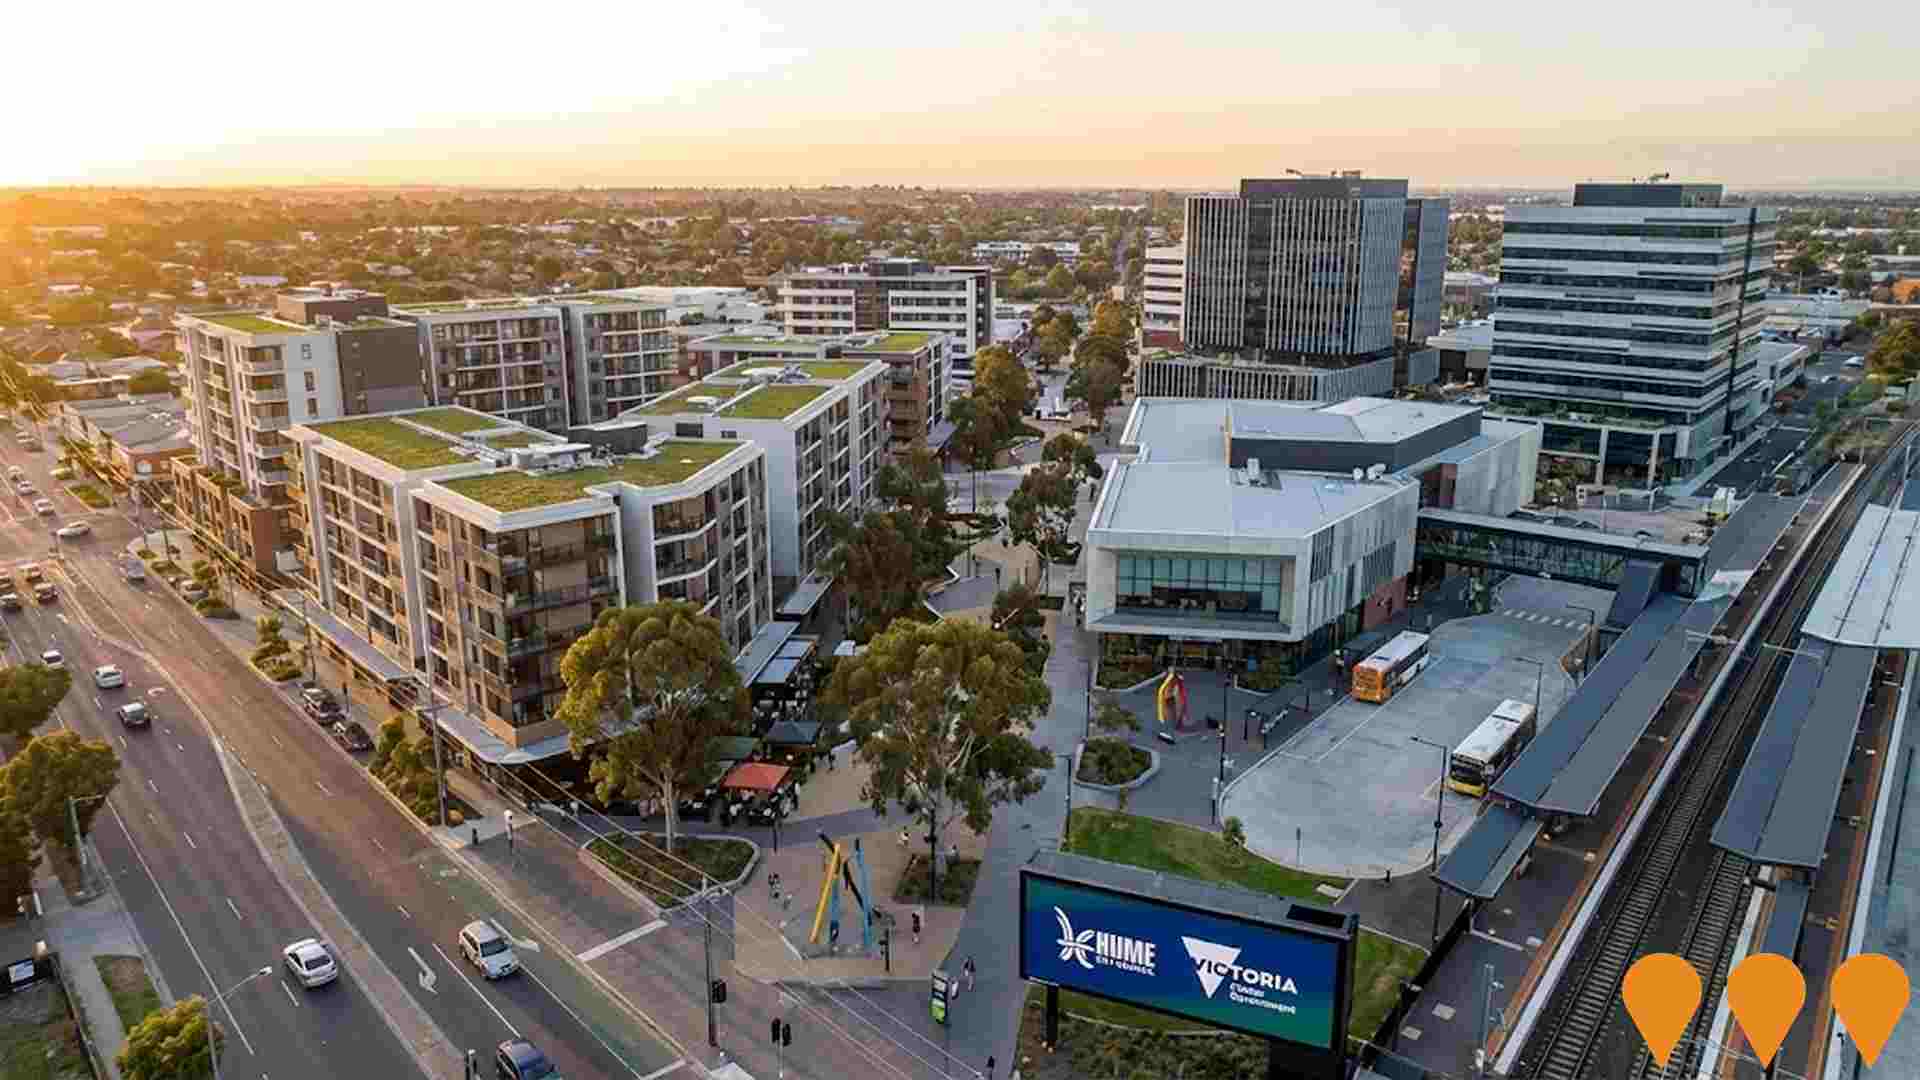
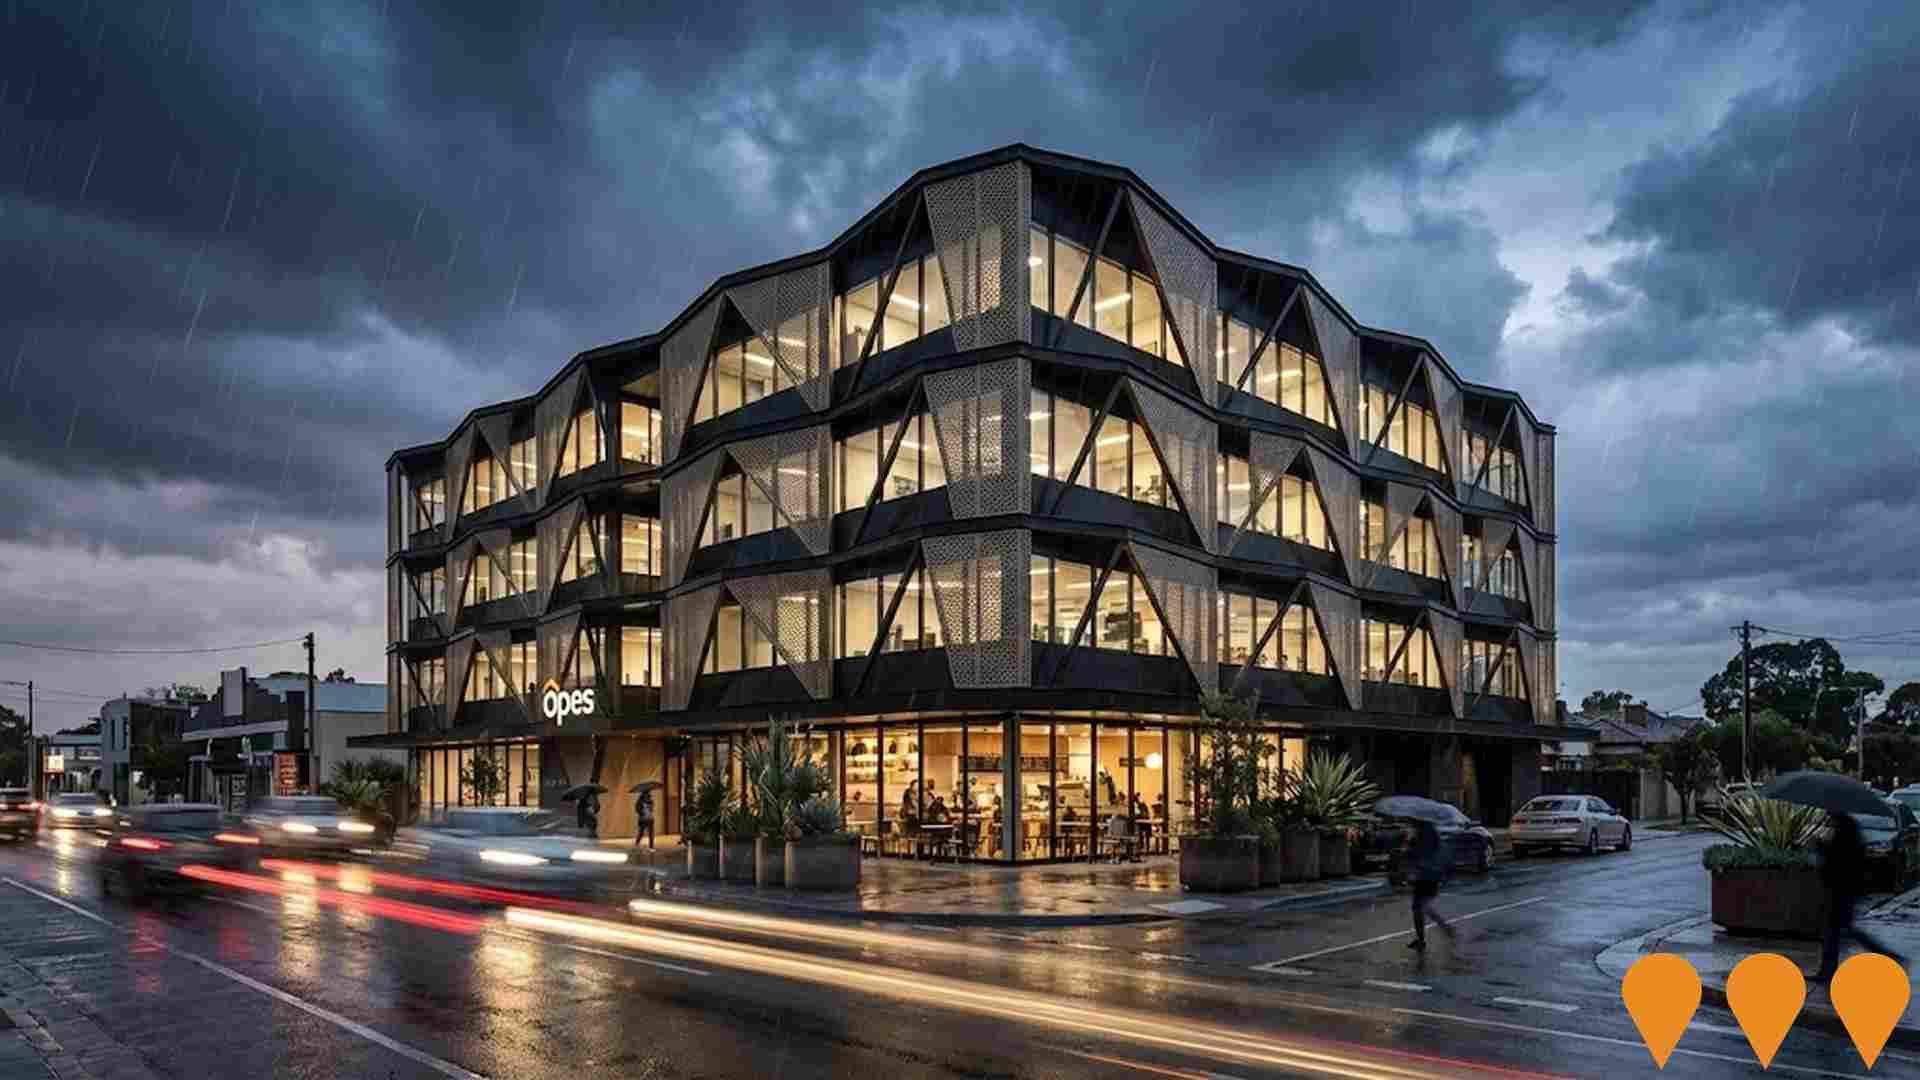
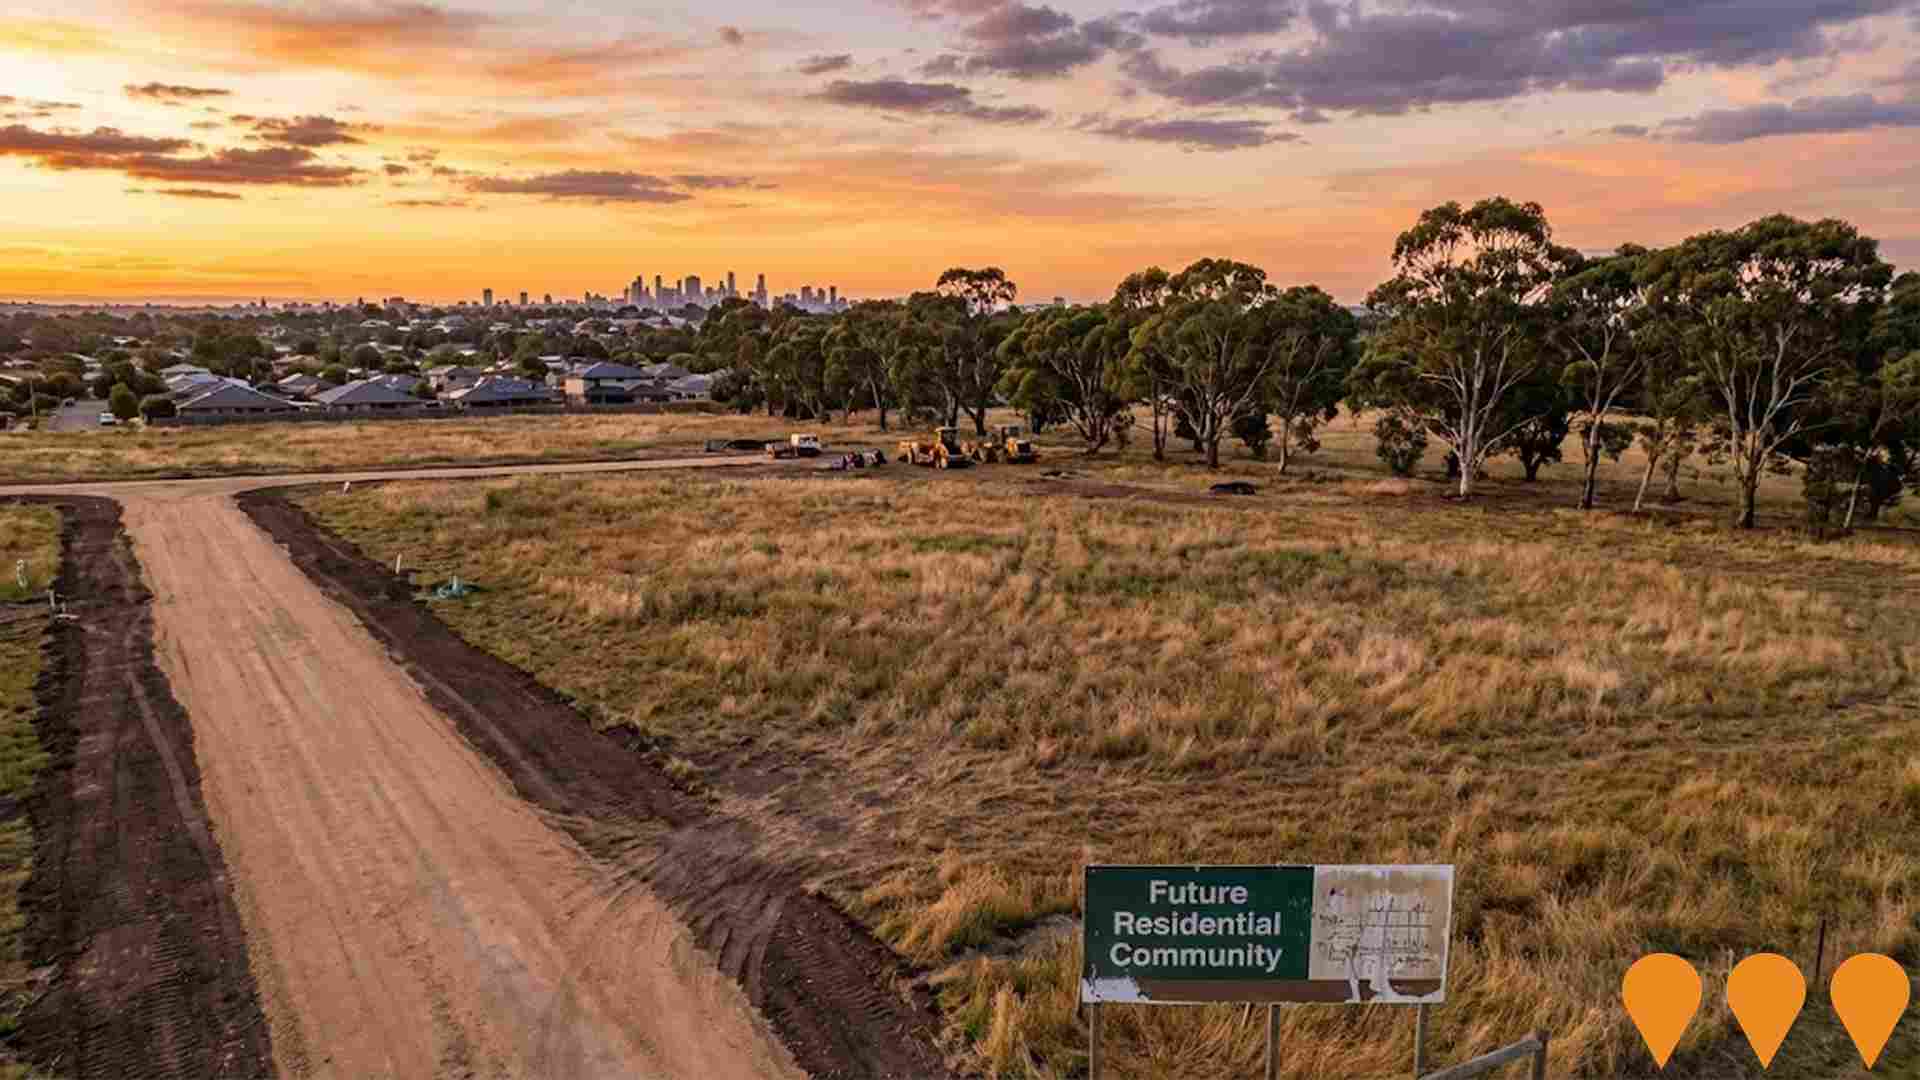
 Denotes AI-based impression for illustrative purposes only, not to be taken as definitive under any circumstances. Please follow links and conduct other investigations from the project's source for actual imagery. Developers and project owners wishing us to use original imagery please Contact Us and we will do so.
Frequently Asked Questions - Infrastructure
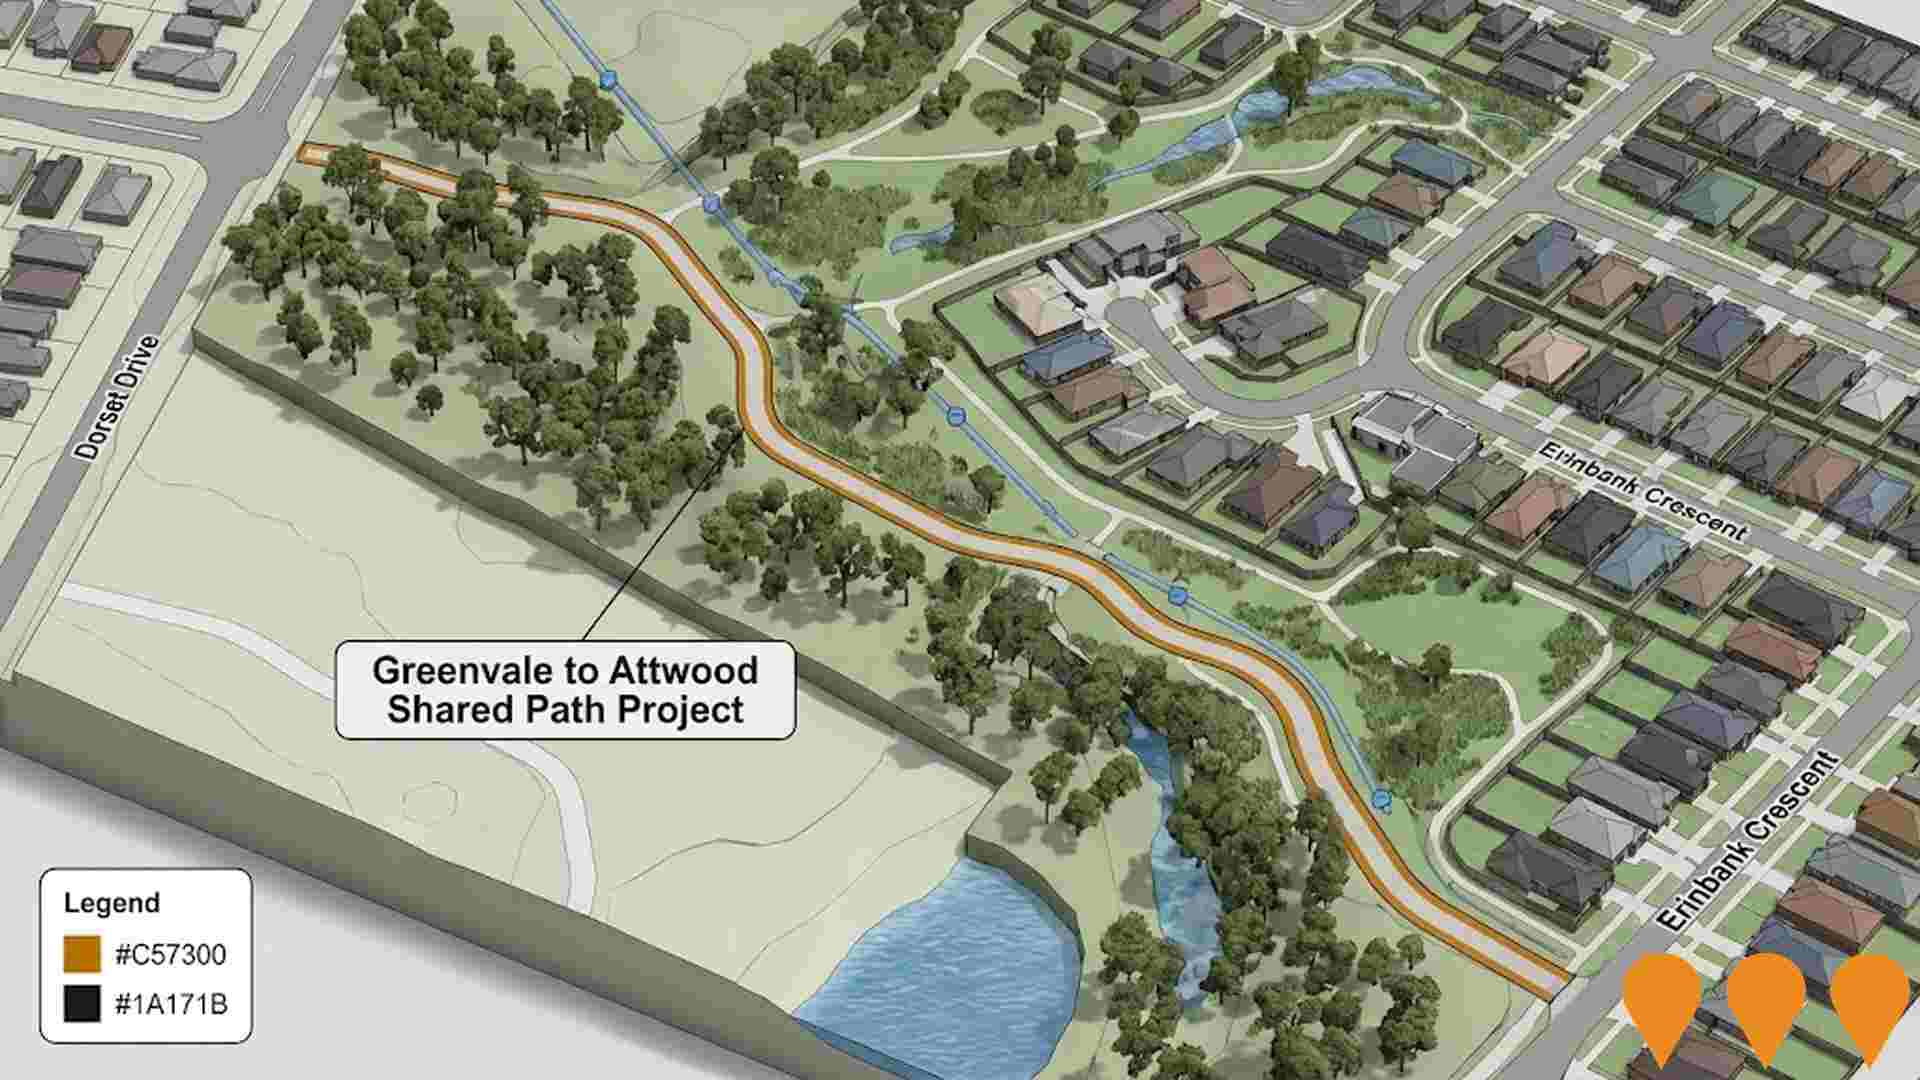
Greenvale to Attwood Shared Path Project
Redevelopment of the shared path along the Melbourne Water Pipe Track between Greenvale and Attwood, creating a 1.6km long, three-metre wide concrete shared path for cyclists and pedestrians.
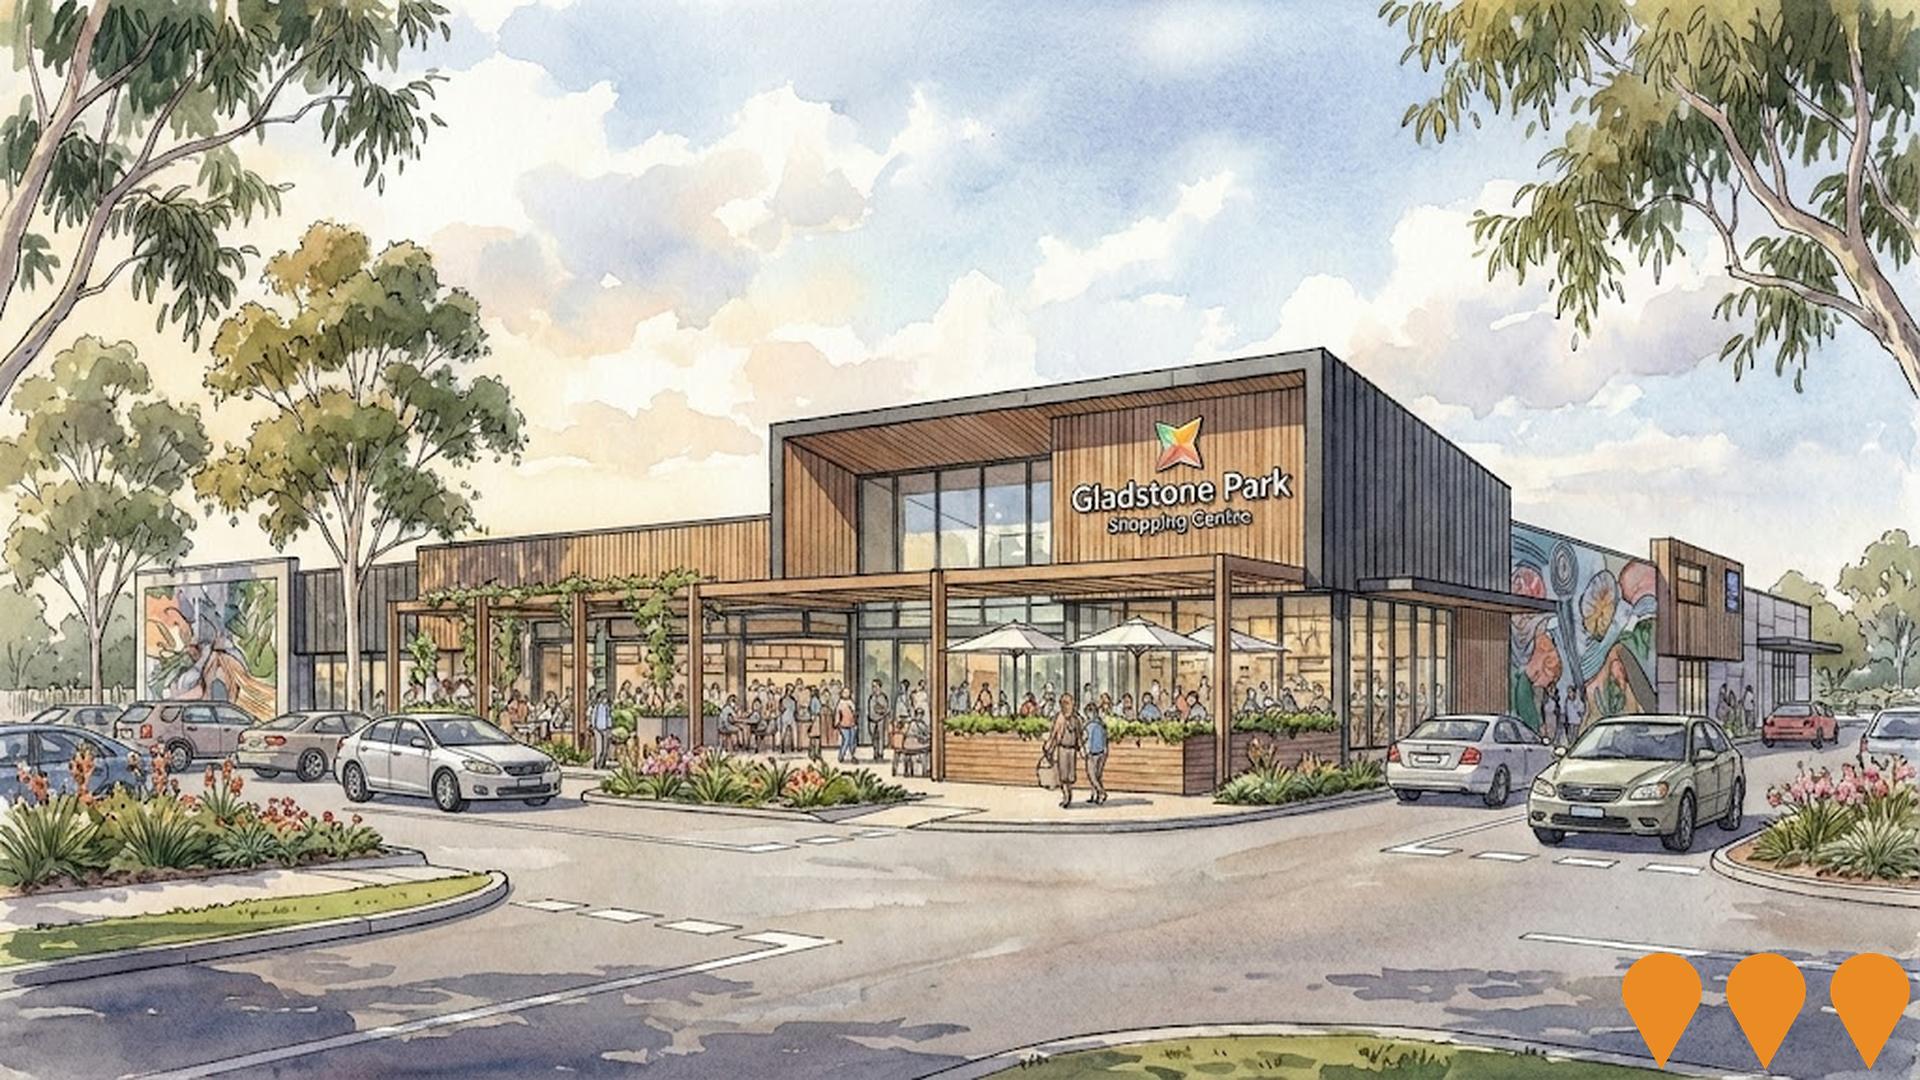
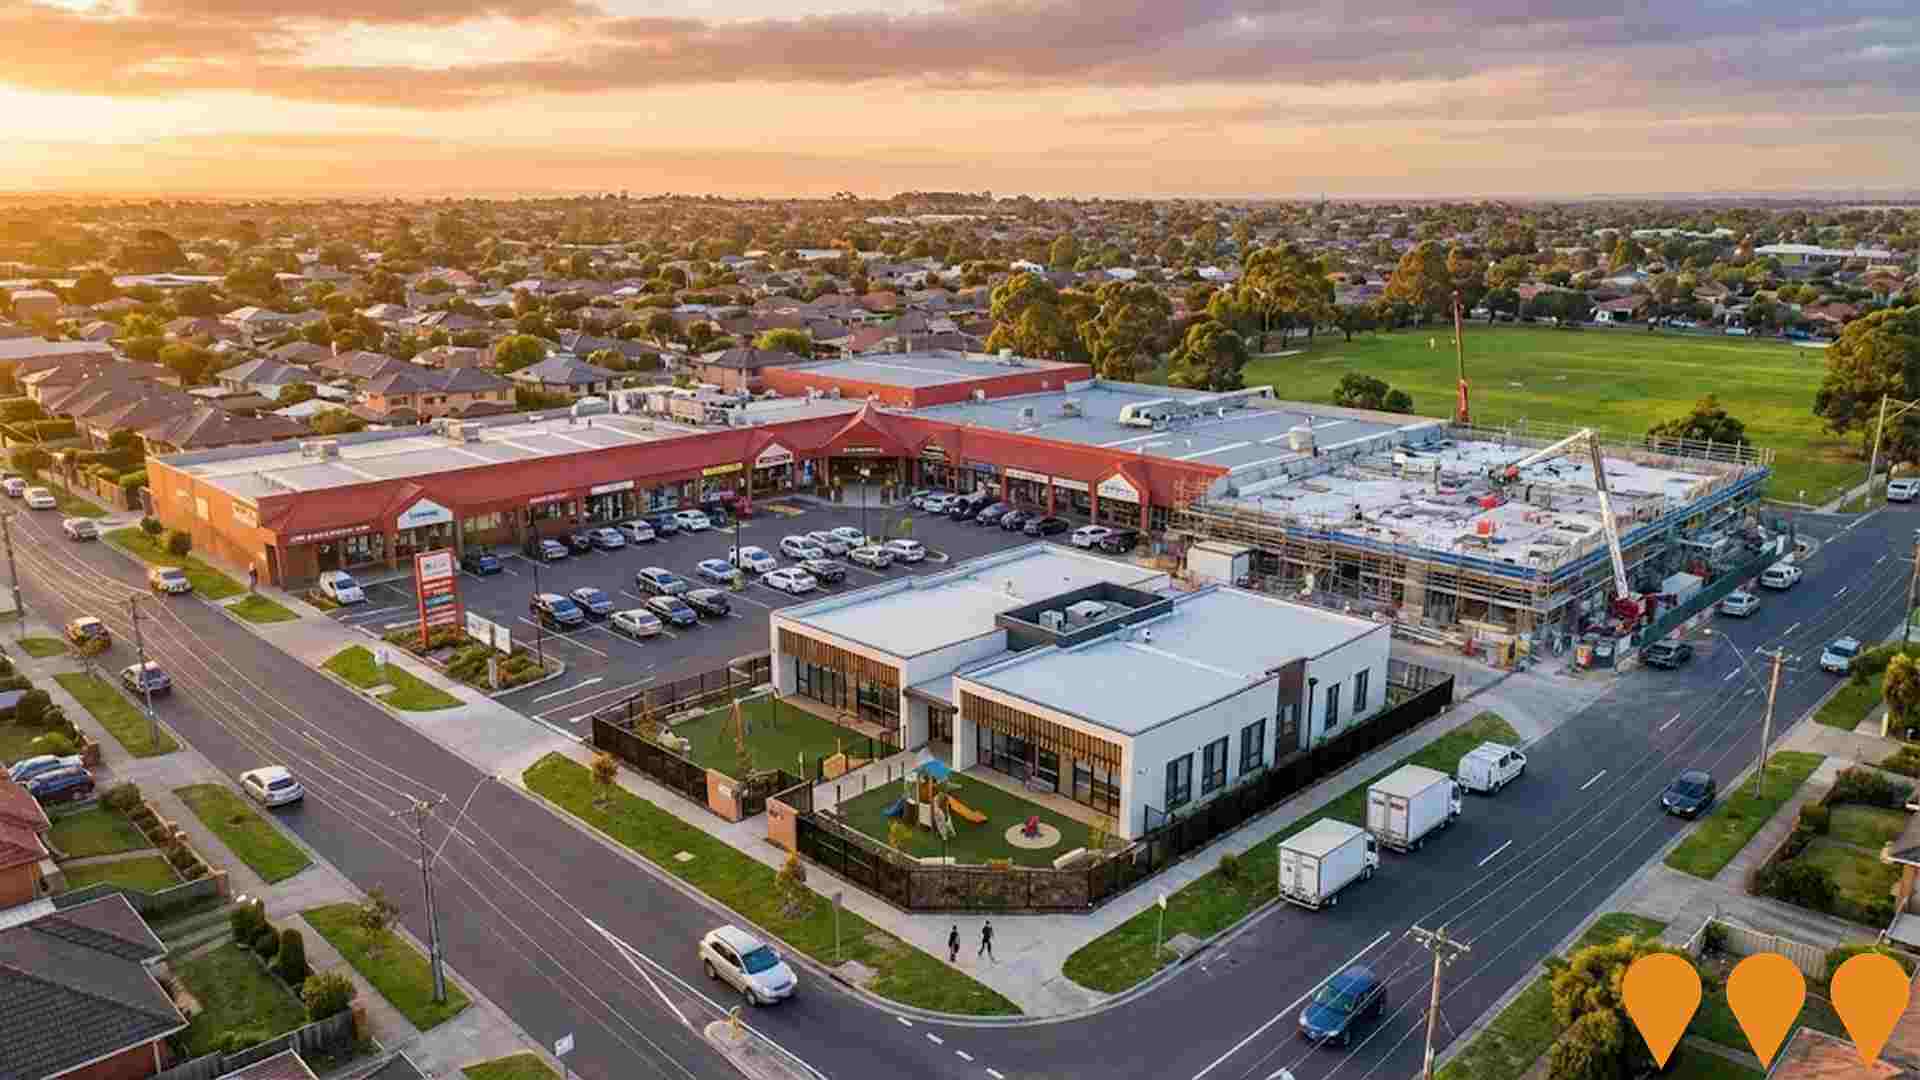
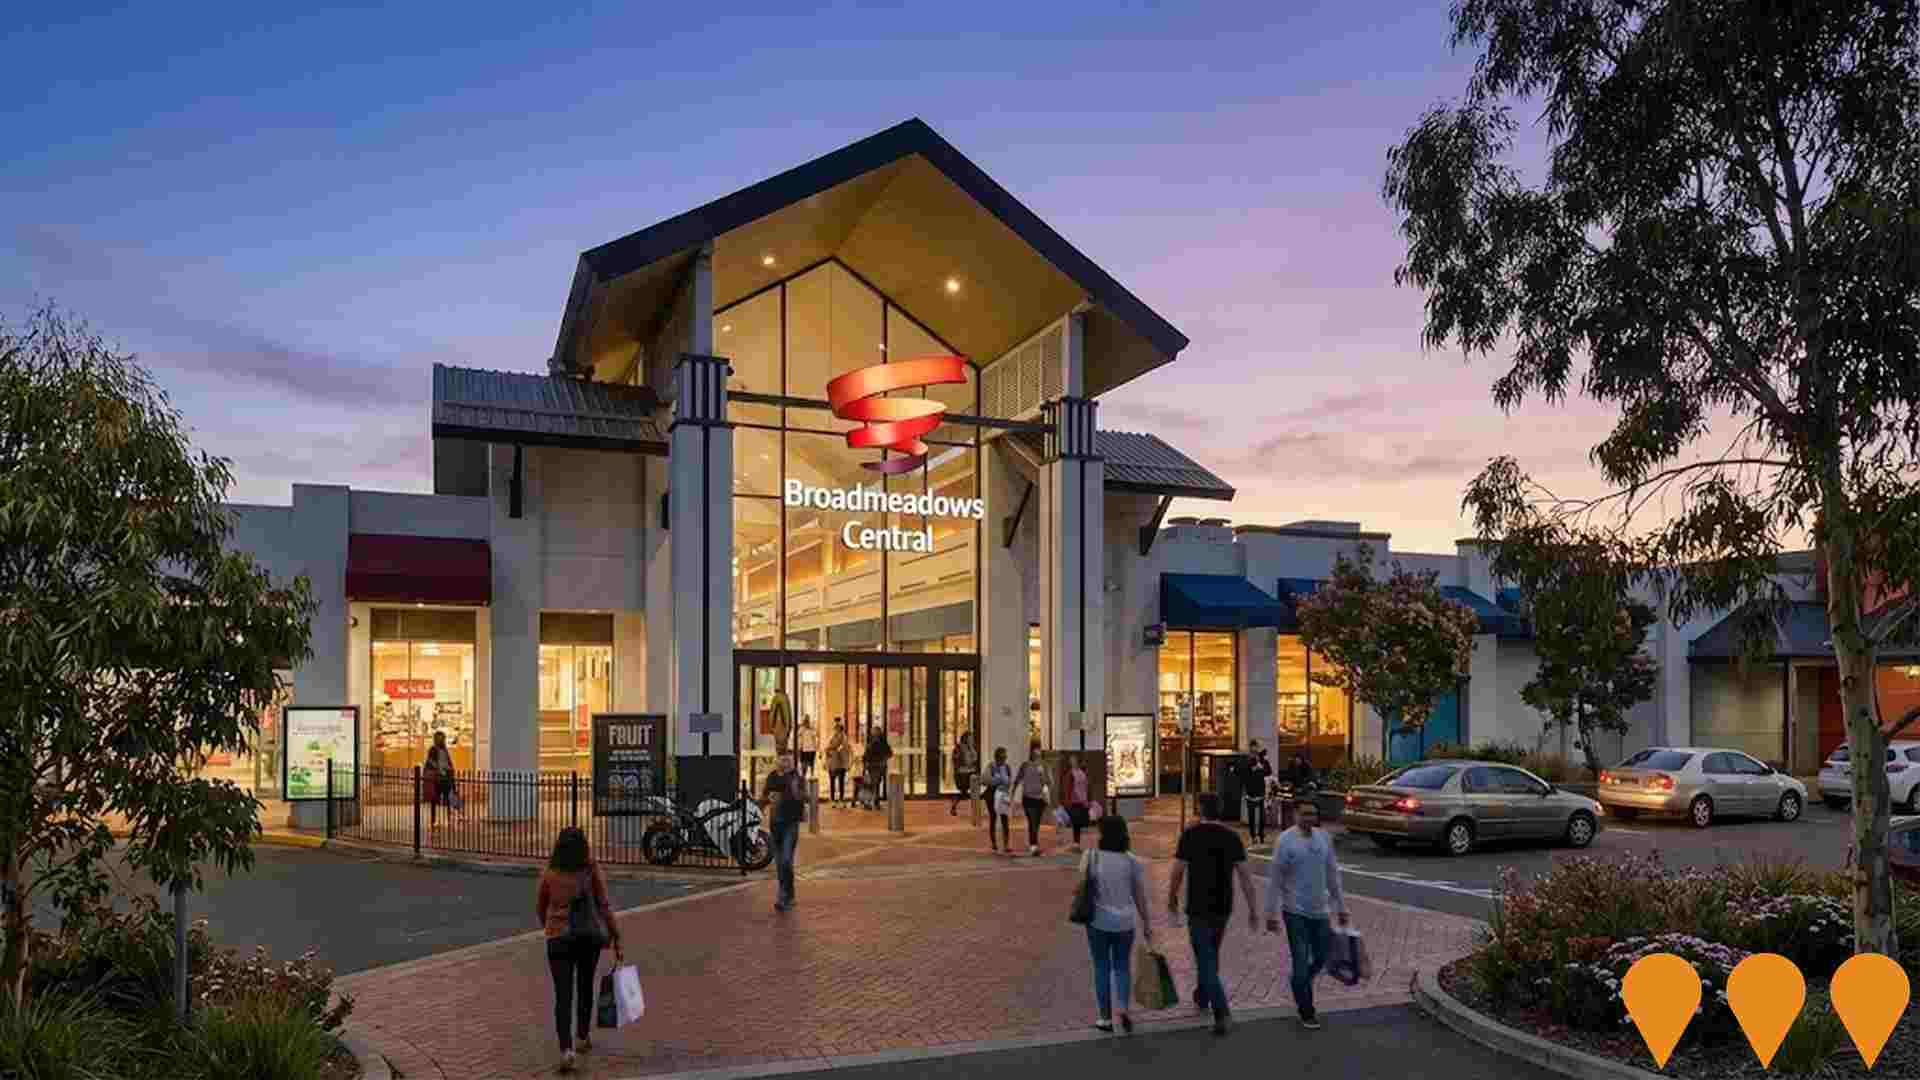
Gladstone Park Shopping Centre Refurbishment and Expansion
The Gladstone Park Shopping Centre refurbishment is a staged modernisation project focused on upgrading facades and common areas, enhancing the dining precinct, and increasing the number of specialty retailers. The plan includes improving site access, circulation, and car parking facilities while maintaining its status as a core neighborhood hub anchored by major supermarkets and community services.
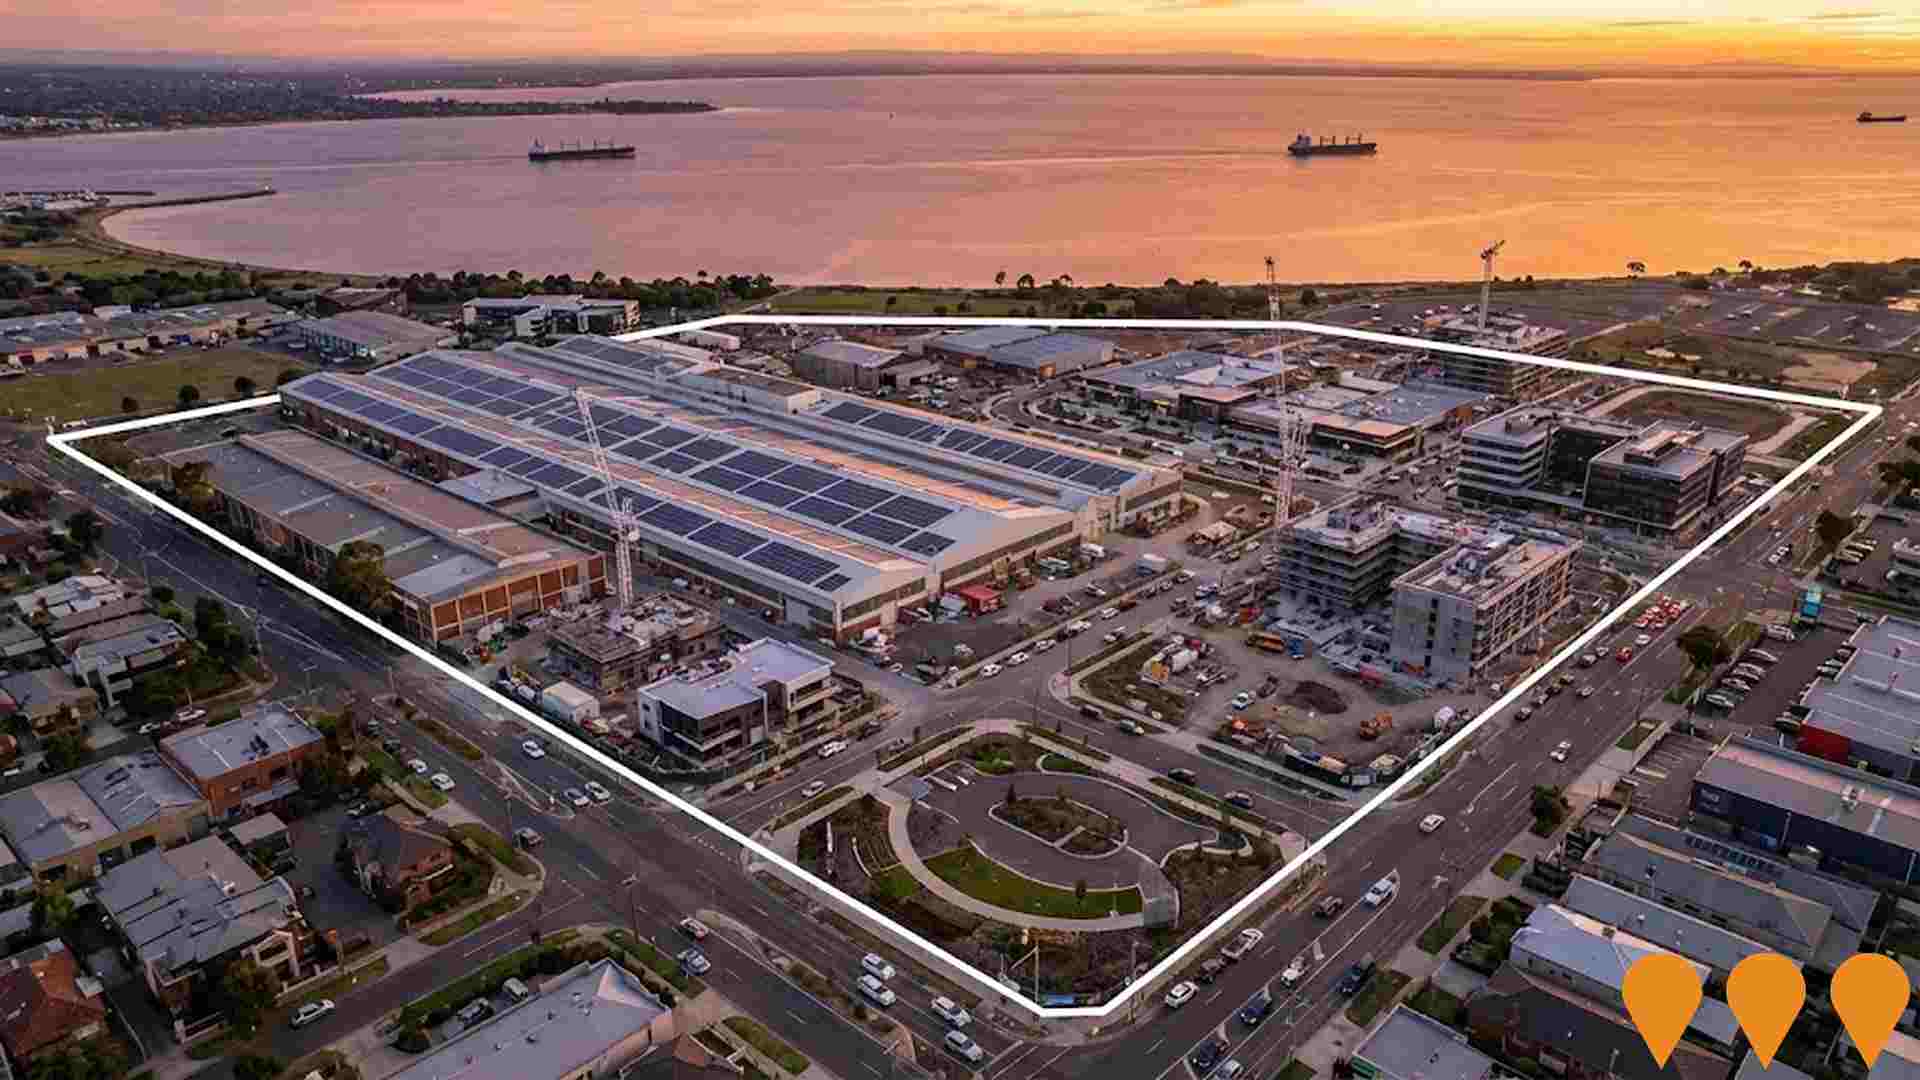
Assembly Broadmeadows
Urban renewal and industrial regeneration of the former 43-hectare Ford Australia manufacturing plant into a multi-use business and technology hub. The masterplanned precinct includes 120,000 square metres of upgraded industrial space, advanced manufacturing, commercial offices, and retail amenities. Redevelopment works and site repurposing are underway with delivery staged across multi-year milestones.
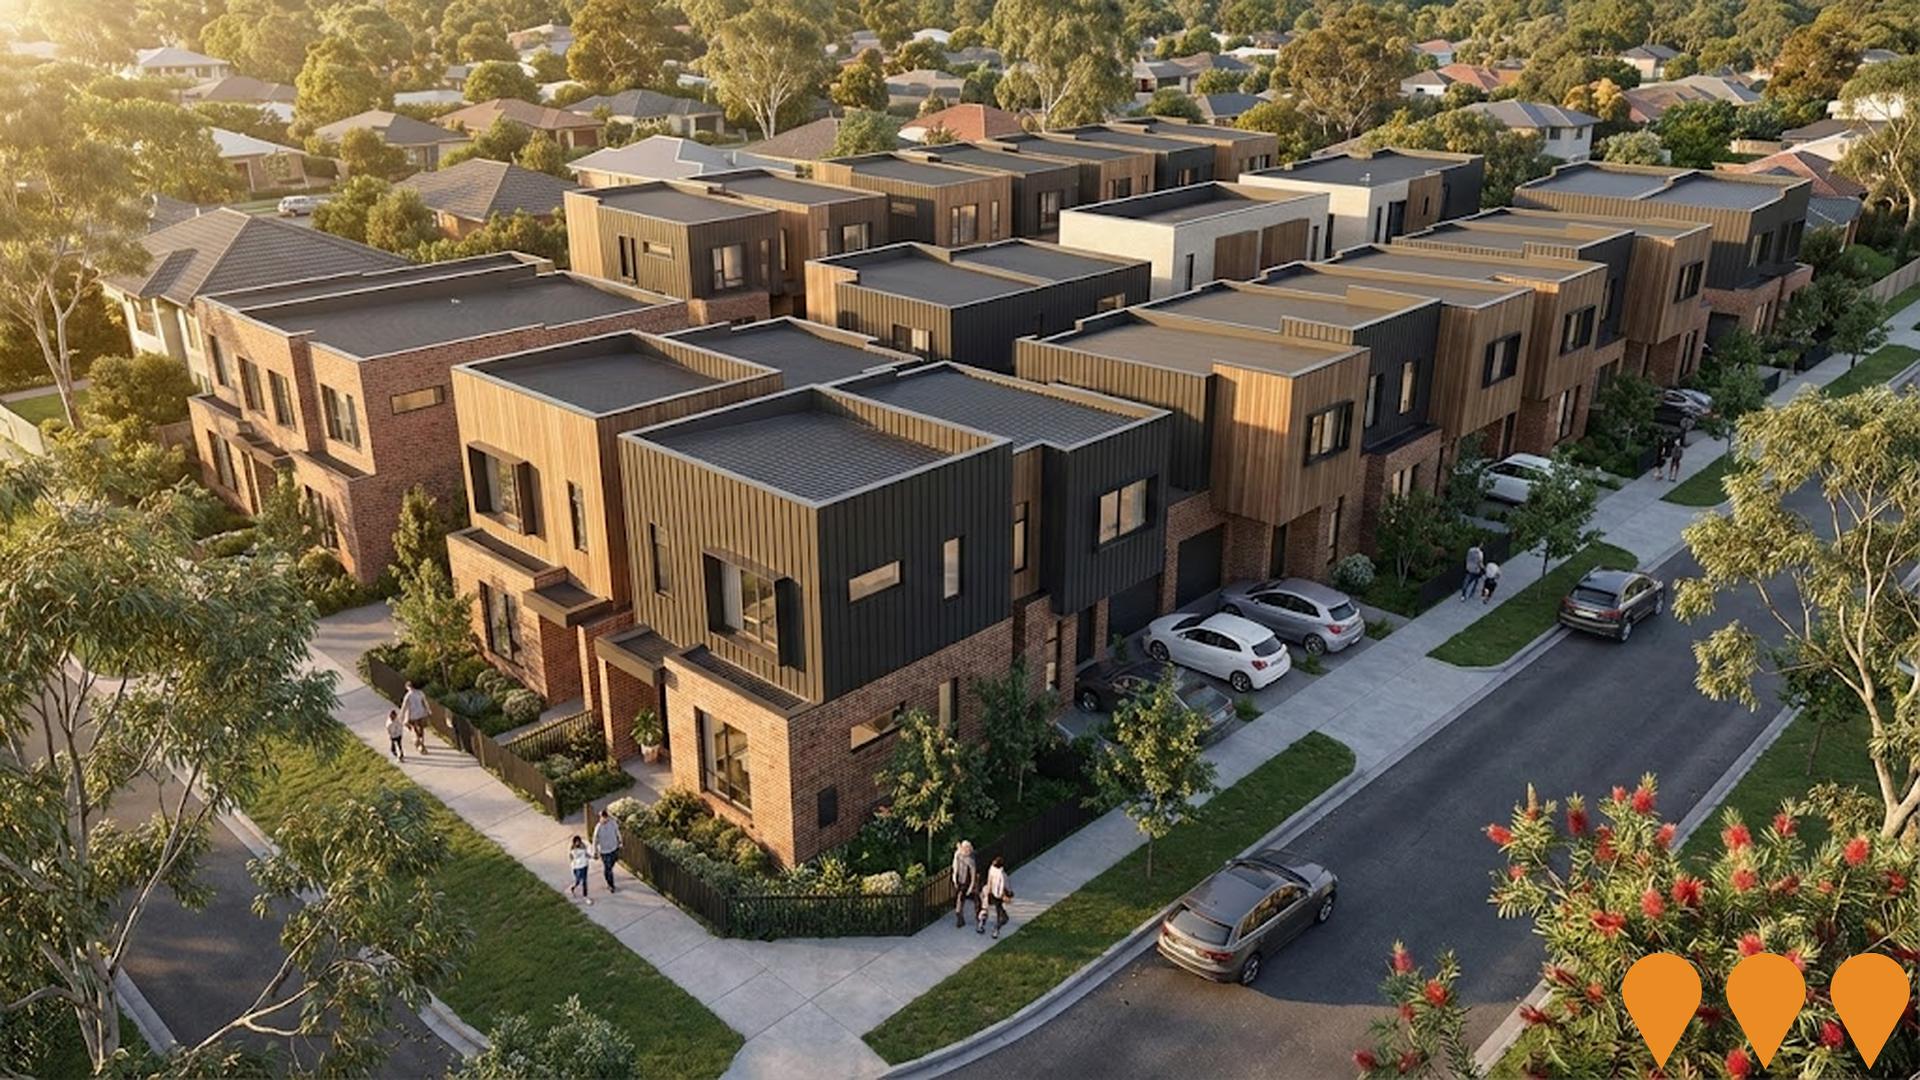
Airla Gladstone Park
Completed collection of 28 modern townhouses for contemporary family living in Gladstone Park, close to local schools, shops and public transport, with construction completed around 2023.
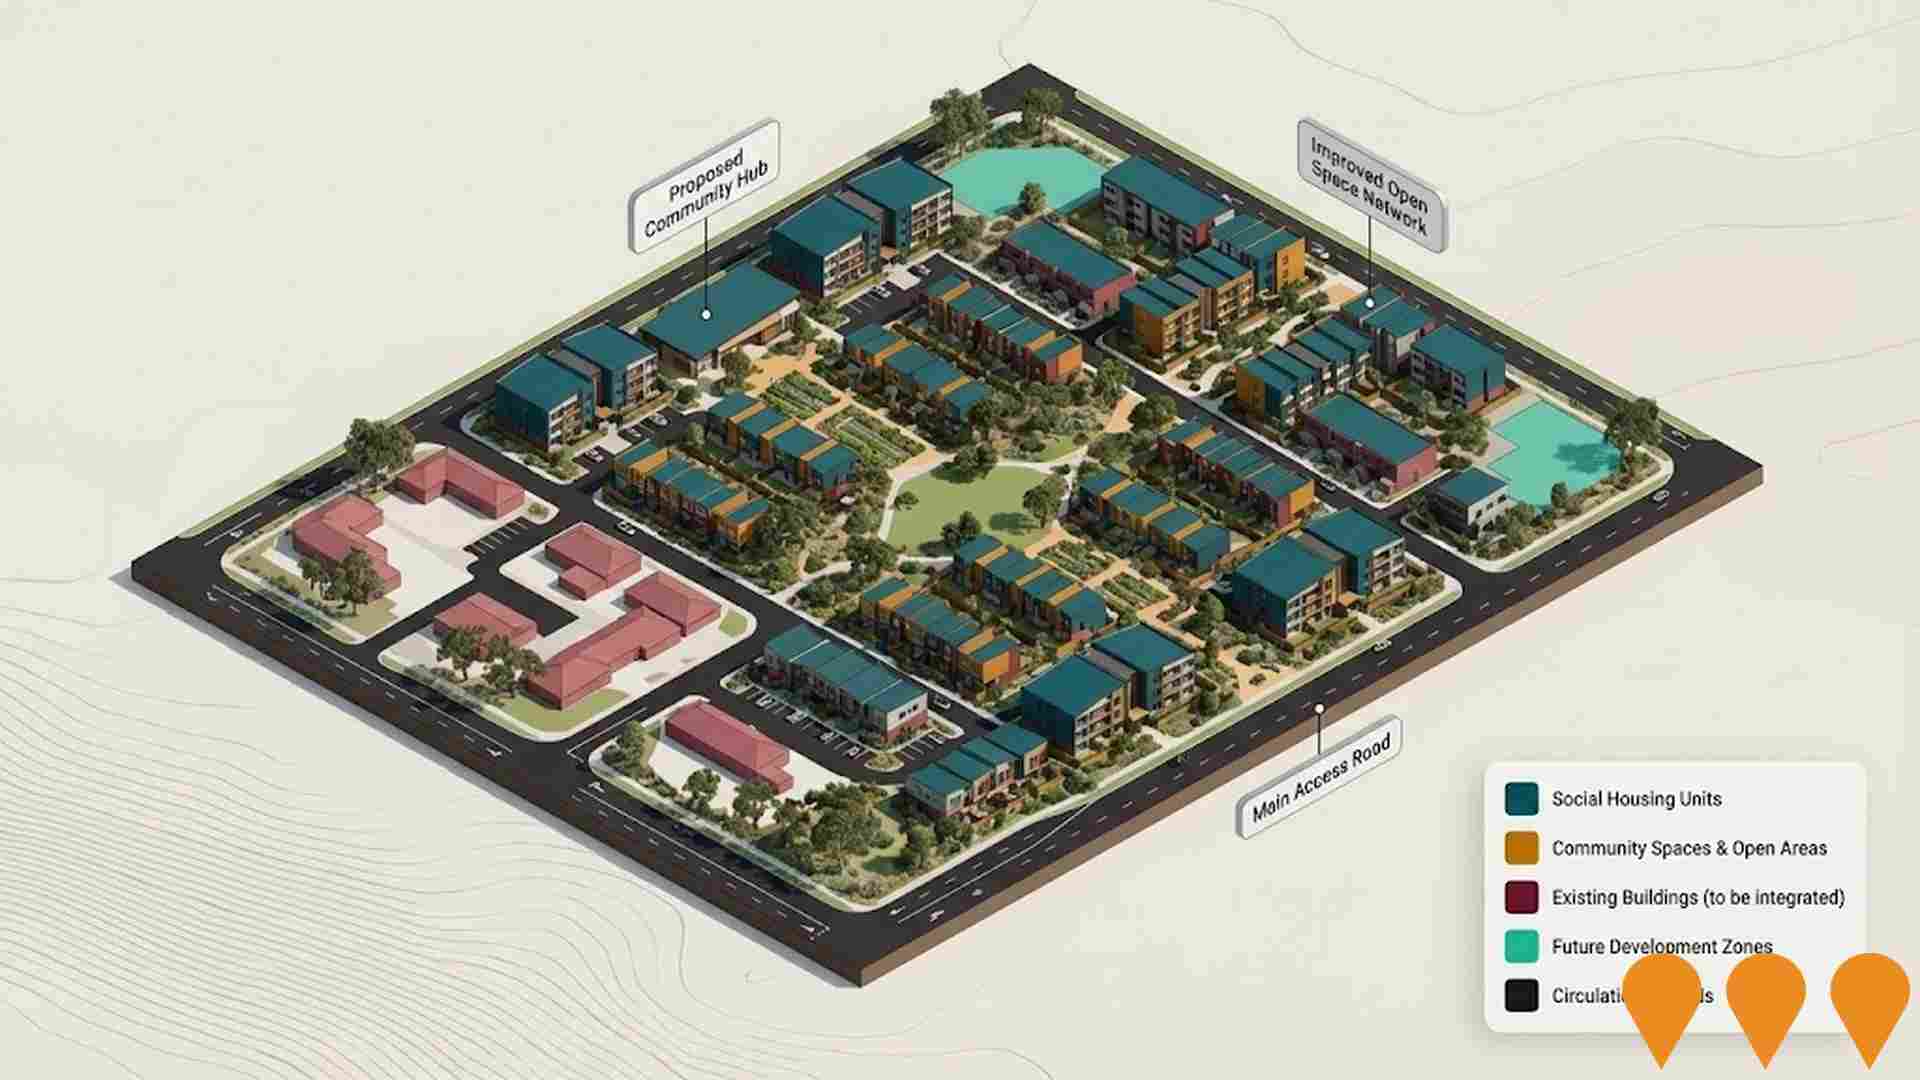
Banksia Gardens Social Housing Development
The project will deliver approximately 120 new social homes that are modern, well-designed, and energy-efficient on an underutilised site. A master plan guides the longer-term renewal of the neighbourhood, including future housing, improved open spaces, and community connections.
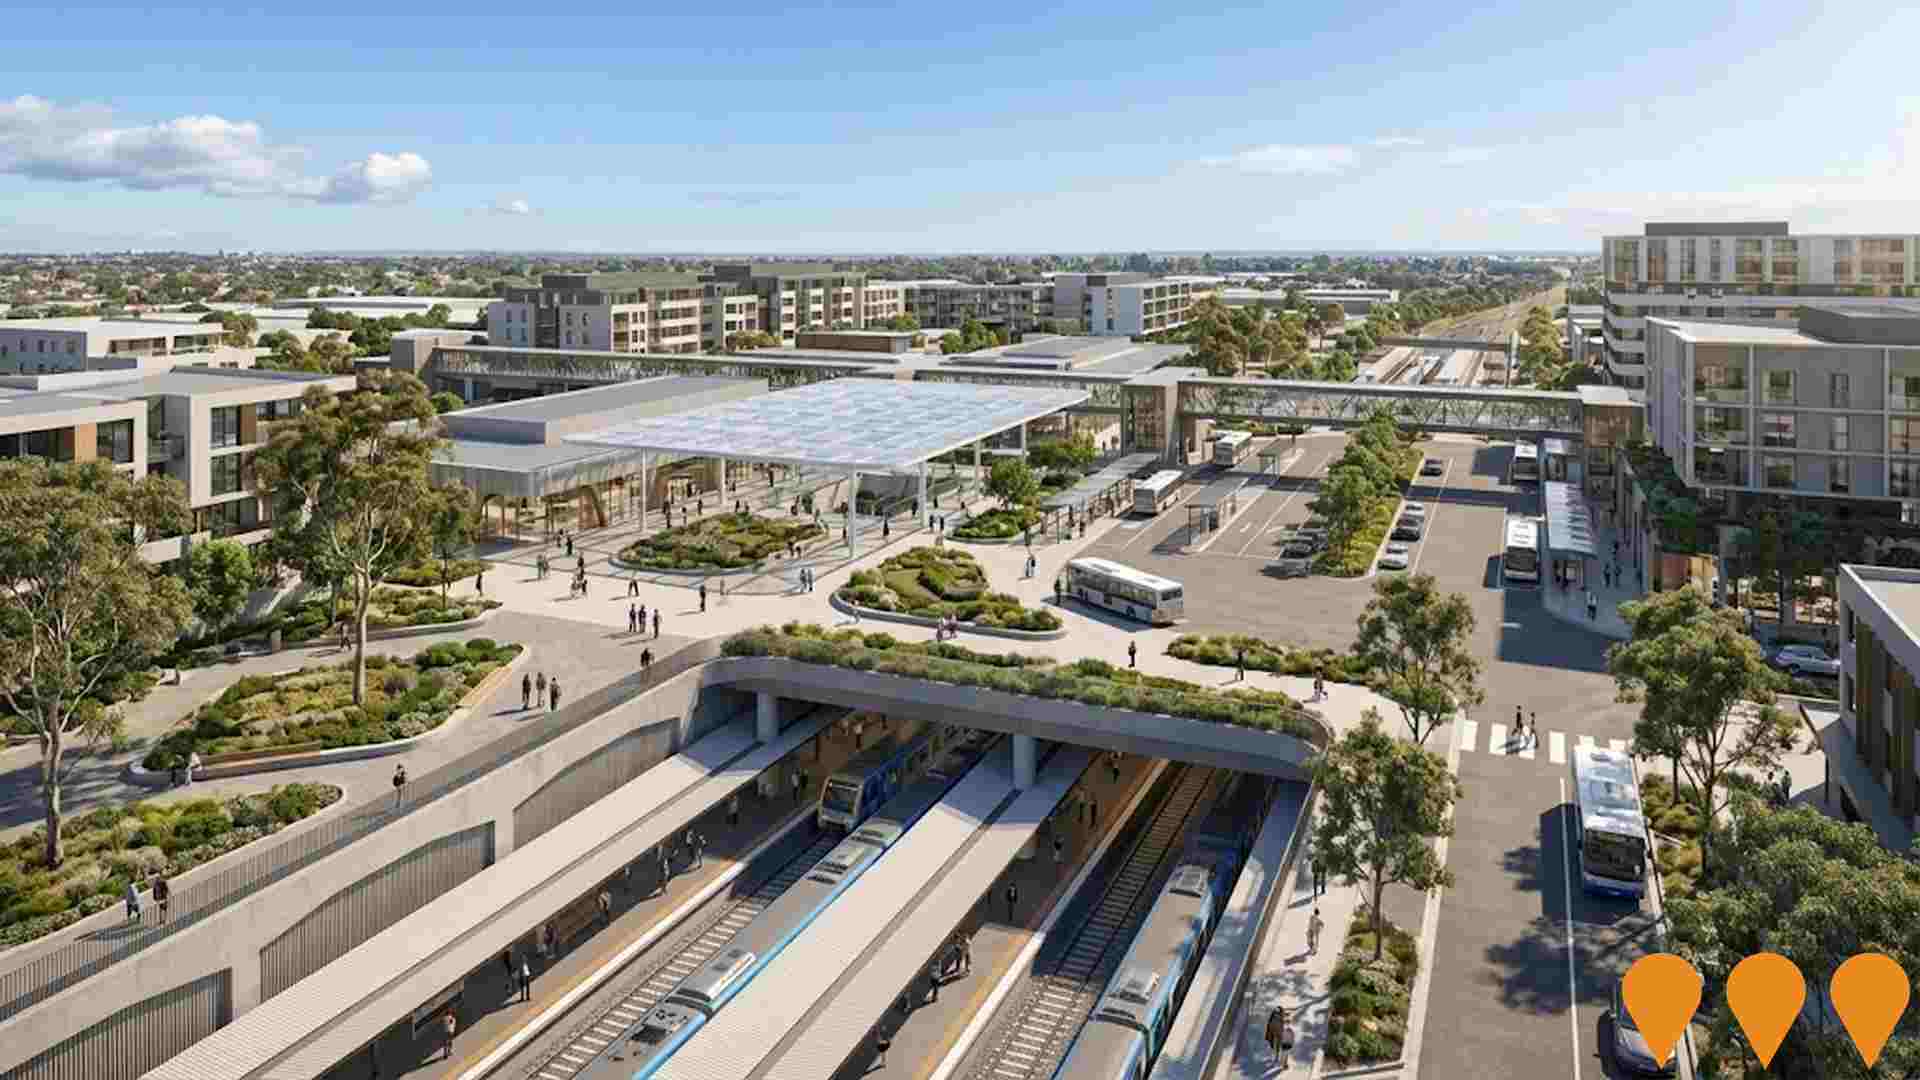
Suburban Rail Loop North - Broadmeadows Station
A new underground transport super hub at Broadmeadows, forming a critical part of the Suburban Rail Loop (SRL) North segment connecting the Craigieburn line and regional V-Line services. The project is currently in early planning and development stages by the Suburban Rail Loop Authority, designed to catalyze urban renewal and support increased housing and employment density.
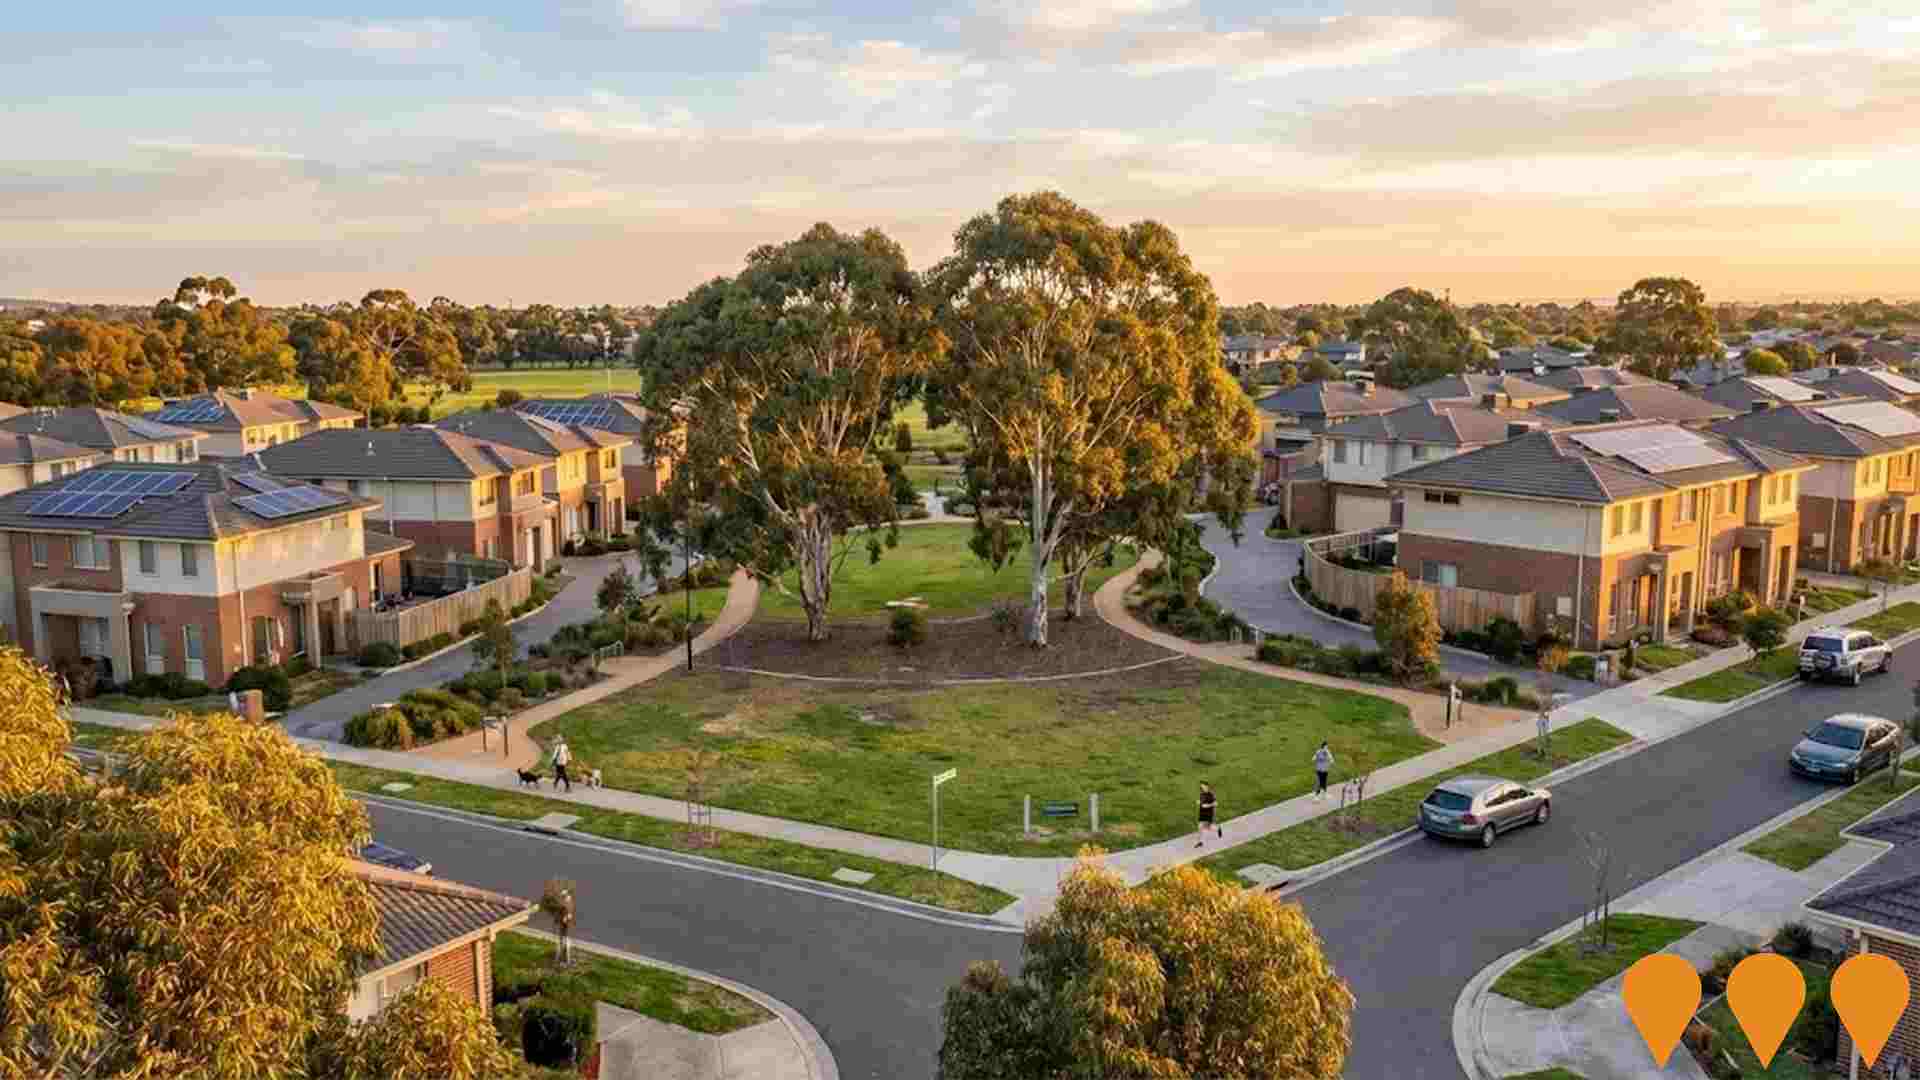
Parkview Broadmeadows
Townhouse community of approx. 65 architect designed 2, 3 and 4 bedroom homes by Met Communities / Moment Group, arranged around a centrally located park of about 7,500 sqm with walking and bike connections to Meadowlink Reserve. Sales underway with civil works commenced, delivering a mix including a small portion for an affordable housing provider under the Inclusionary Housing Pilot.
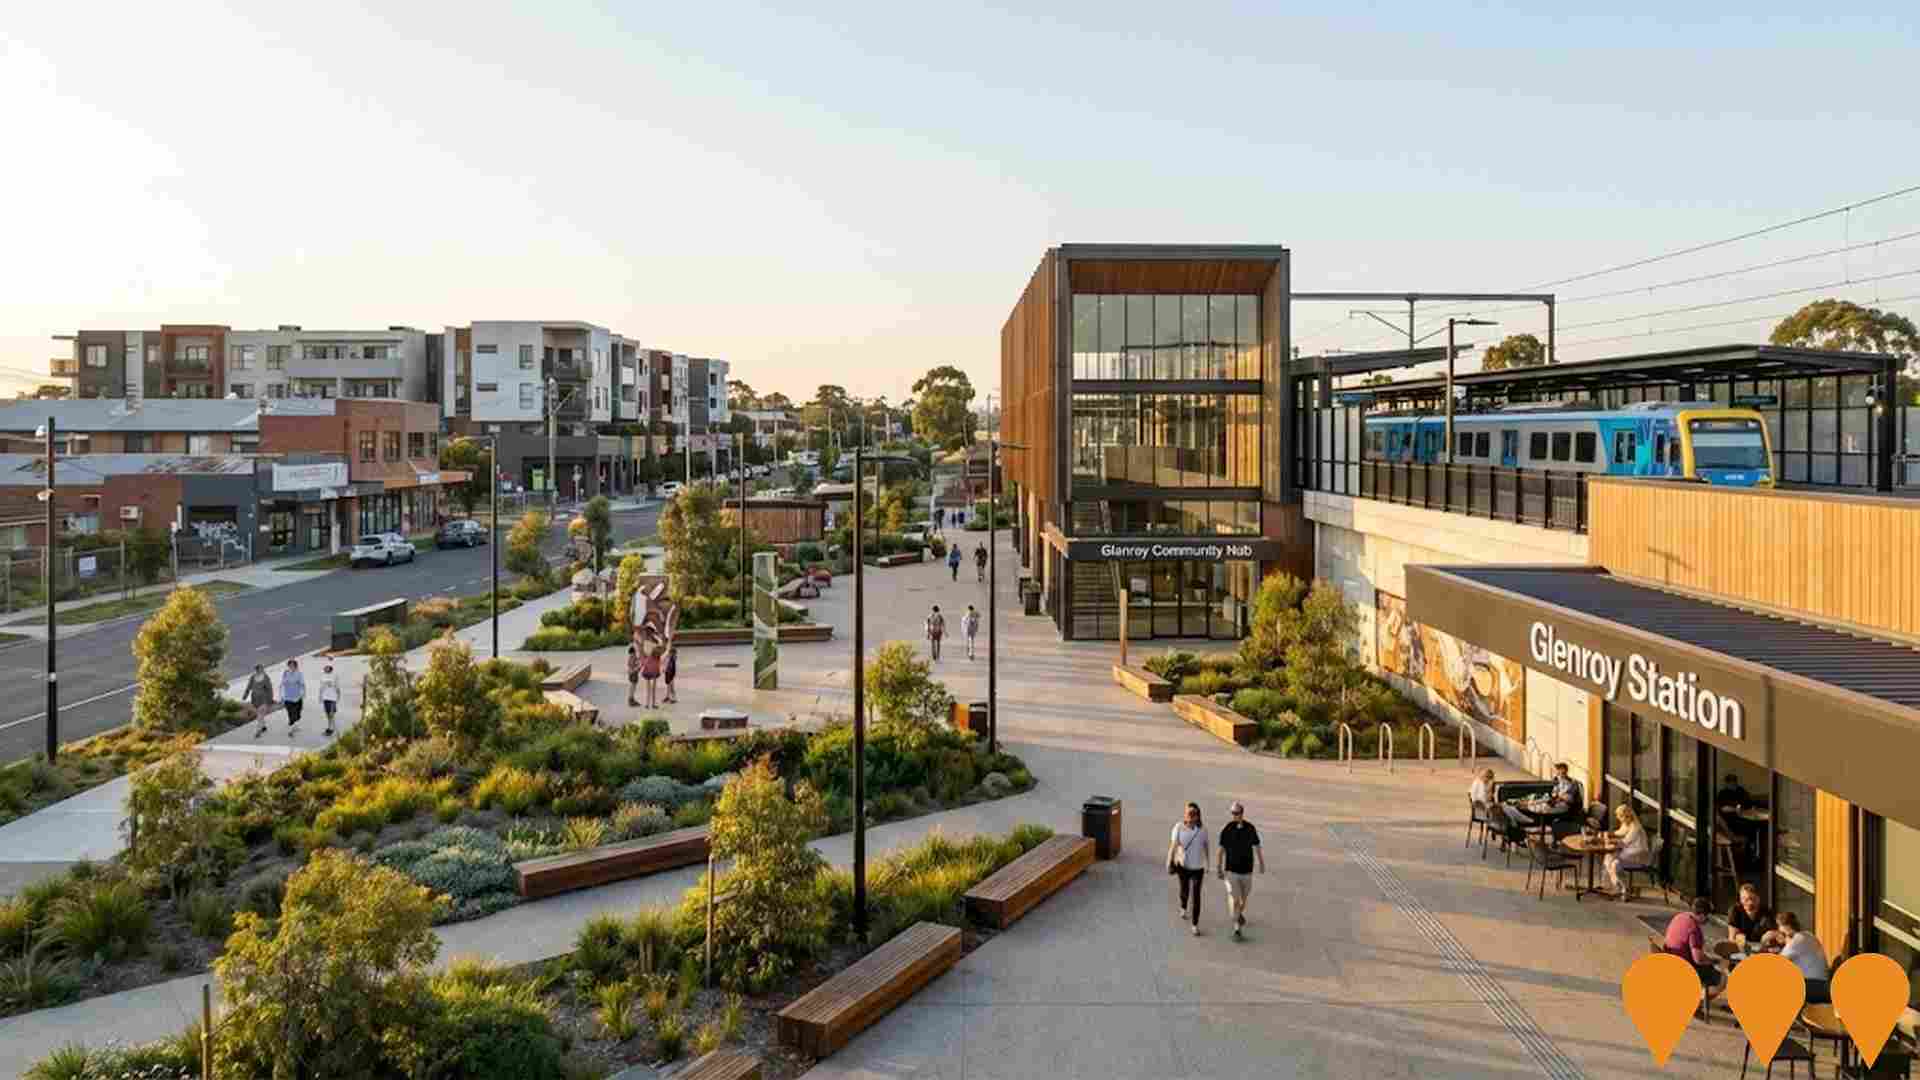
Glenroy Structure Plan
Long-term structure plan guiding regeneration of the Glenroy Activity Centre, including the Pascoe Vale Road and Wheatsheaf Road shopping areas, the industrial area east of the rail line and adjoining land. The plan supports a vibrant mixed-use centre with more services, facilities, activity and residential opportunities. Current implementation includes public realm renewal, with the West Street Shopping Strip Improvement moving into construction from February 2026 for about 10 to 11 months, including footpath upgrades, road works, drainage, traffic calming, new asphalt, safer pedestrian access, seating, landscaping and support for local businesses.
3,492 residents of Westmeadows are employed, from a labour force of 3,717. Unemployment sits at 6.1%, with participation at 64.6%. Weighted for its industry mix, the area's sectors are forecast to grow about 6.1% nationally over five years. That reflects industry composition only and makes no allowance for local population growth. The working-day population is estimated at 6,034, about 88% of the resident population, so more people leave the area for work than travel in. Unemployment and labour force come from ABS Small Area Labour Markets, updated quarterly; the industry and occupation profile is from the 2021 Census.
Detail
Data aggregated across statistical divisions by AreaSearch indicates that Westmeadows features a skilled local labor pool with standout participation in construction trades, an unemployment rate of 6.1%, and annual employment growth estimated at 1.7%. By March 2026, employed residents numbered 3,492, alongside an unemployment rate sitting 1.3% above the 4.8% recorded for Greater Melbourne, while local participation at 64.6% trails the metropolitan figure of 70.1%. Census records show 22.5% of working residents operated from home, though pandemic-era restrictions during Covid-19 provide relevant background. Major employment sectors for local workers include health care & social assistance, construction, as well as education & training.
The suburb exhibits pronounced industry concentration within transport, postal & warehousing, capturing a workforce share 1.8 times the metropolitan baseline. Conversely, professional & technical occupations are under-represented, engaging only 5.6% of the Westmeadows workforce relative to 10.1% across Greater Melbourne, with resident versus local worker comparisons from the Census indicating limited employment hubs within the residential borders. An examination of ABS and SALM figures over the 12 months leading to March 2026 shows that local employment expanded by 1.7% against a 0.2% rise in the labor force, reducing the unemployment rate by 1.4 percentage points. By comparison, Greater Melbourne recorded a 2.1% increase in employment, a 2.3% gain in the labor pool, and a 0.2 percentage point uptick in unemployment. National outlooks from Jobs and Skills Australia as of Mar-26 provide additional context on future workforce needs when mapped against local industry composition. Across the country, job counts are projected to expand by 6.6% over five years and 13.7% over ten years, though sectoral performance varies; applying these industry-weighted rates to the local employment distribution projects employment gains of 6.1% over five years and 12.8% over ten years for Westmeadows (as a baseline illustrative weighting that excludes localized population changes).
Frequently Asked Questions - Employment
Median household income in Westmeadows is $1,564 a week (about $81,000 a year), with median personal income at $694 a week. ATO records put median taxable income at $54,242 a year against an average of $64,056. Household income is from the 2021 Census; taxable income is from ATO Taxation Statistics for the latest financial year available, indexed forward using the ABS Wage Price Index.
Detail
ATO postcode statistics compiled by AreaSearch for financial year 2023 place earnings in the suburb of Westmeadows below national norms, recording a median income of $54,242 and a mean of $64,056, whereas Greater Melbourne registered a median of $57,688 and an average of $75,164. Factoring in a 9.62% increase in the Wage Price Index since financial year 2023, updated estimates as of March 2026 stand at roughly $59,460 for median income and $70,218 for average income. The 2021 Census positioned personal, household, and family earnings modestly between the 27th and 39th percentiles, with the primary cohort consisting of 34.3% earning $1,500 - 2,999 weekly (2,356 residents), closely tracking the 32.8% regional proportion.
Affordability constraints are notable, as remaining income averages 83.9%, ranking in the 39th percentile.
Frequently Asked Questions - Income
Westmeadows had 2,418 occupied dwellings at the 2021 Census, 77% detached houses and 1% apartments. 39% are owned with a mortgage, 26% rented and 35% owned outright. At that Census the median rent was $360 a week and the median mortgage repayment $1,733 a month. Rent absorbs 23.0% of household income here and mortgage repayments 25.6%. Dwelling stock, tenure and housing costs are 2021 Census measures — the only source that counts dwellings at this boundary size.
Detail
At the time of the latest Census, the housing fabric in Westmeadows consisted of 76.9% separate houses alongside 23.1% alternate dwelling types such as apartments and semi-detached properties, contrasting with Melbourne metro where houses constituted 67.9% and other residences made up 32.1%. Outright ownership reached 34.6%, outpacing the metropolitan rate, while 39.2% of homes carried a mortgage and 26.2% were occupied by renters. Typical monthly mortgage payments stood at $1,733, falling below the Melbourne metro figure of $2,000, while median weekly rent was $360 compared to the regional $390. Across Australia, local mortgage payments remain below the national mark of $1,863, and weekly rents sit under the national benchmark of $375.
Frequently Asked Questions - Housing
Westmeadows counted 2,418 households at the 2021 Census, an estimated 2,555 today, averaging 2.5 people each. 30% are couples with children, against 26% couples without children. 26% of households are people living alone, and families average 1.7 children. Household and family composition is measured only by the Census, so these are 2021 figures.
Detail
Families constitute the bulk of living arrangements at 72.2% of total households, encompassing 29.6% couples with children, 25.6% couples without children, and 15.7% single parent families. Non-family dwellings make up 27.8%, split between single-occupant households at 25.6% and share houses at 2.1%. The average household size of 2.5 people sits slightly under the Greater Melbourne benchmark of 2.6.
Frequently Asked Questions - Households
19.5% of adults in Westmeadows hold a university qualification, including 13.6% with a bachelor degree and 3.6% with postgraduate qualifications. A further 23.8% hold a vocational qualification. 1 school serves the area, with 458 enrolment places and an average ICSEA of 999 against a national benchmark of 1,000. Qualifications come from the 2021 Census; school enrolments, ICSEA and results come from ACARA's current release.
Detail
Tertiary qualification levels present an area for community development, with 19.5% holding university credentials compared to 37.0% across Greater Melbourne. Among degree holders, bachelor qualifications represent 13.6%, postgraduate degrees account for 3.6%, and graduate diplomas make up 2.3%. Vocational and technical training forms a substantial foundation, with 35.7% of residents aged 15+ possessing vocational credentials, including 23.8% with certificates and 11.9% holding advanced diplomas. Engagement in formal studies is pronounced throughout the community, with 26.9% of local residents actively undertaking education. Within this student population, primary schooling accounts for 8.7%, secondary institutions enroll 7.0%, and 4.3% are attending tertiary programs.
Frequently Asked Questions - Education
Schools Detail
Public transport in Westmeadows reaches 38 stops on 9 routes, timetabled for about 4,000 services a week. The typical home sits about 270 m from its nearest stop. Buses carry the largest share of public transport commuters. Households keep an average of 1.4 vehicles. Stop and service counts are built from operators' published GTFS timetables and refresh with each timetable release; vehicle ownership is from the 2021 Census.
Detail
Public transit networks in Westmeadows encompass 38 active bus stops that provide 3,954 passenger trips each week across 9 distinct routes. Accessibility across the suburb is favorable, with residents situated an average of 273 meters from the closest boarding point. Because the suburb is primarily residential, outward travel dominates commuter flows, with private vehicles accounting for 90% of journeys and rail transit handling 5%. Vehicle concentration averages 1.4 per household, while 22.5% of workers reported working from home during the 2021 Census, subject to prevailing pandemic conditions. Transit services provide an average daily frequency of 564 trips across the network, delivering approximately 104 weekly departures at each individual stop.
Frequently Asked Questions - Transport
Transport Stops Detail
66.5% of residents in Westmeadows report no long-term health condition. 8.7% need daily assistance with core activities, and 52.2% hold private health cover. The standardised death rate runs at 5.4 per 1,000 residents. Health conditions, assistance needs and insurance are 2021 Census measures; the death rate comes from current ABS releases.
Detail
Chronic illness assessments and mortality metrics evaluated by AreaSearch indicate notable health challenges in Westmeadows, with general medical conditions moderately elevated overall and particularly pronounced among older residents. Meanwhile, private health insurance coverage sits near the SA2 benchmark at roughly 52% of the population (~3,585 people), compared to 56.7% across Greater Melbourne. Arthritis and mental health conditions represent the most prevalent diagnoses locally, affecting 8.9 and 8.0% of the community respectively, while 66.5% of residents reported no chronic health issues, compared to 72.6% regionally. Working-age health outcomes generally align with typical benchmarks.
Residents aged 65 and over constitute 20.4% of the population (1,401 people), exceeding the 15.1% share recorded for Greater Melbourne, and while senior health metrics encounter certain hurdles, their national relative standing remains stronger than that of the broader local demographic.
Frequently Asked Questions - Health
30.0% of Westmeadows residents were born overseas and 31.5% speak a language other than English at home. The largest reported ancestries are Australian (19.5%) and English (19.2%). Ancestry, language and country of birth are counted only by the Census, so these are 2021 figures.
Detail
Cultural diversity in Westmeadows outpaces most comparable markets, with 30.0% of residents having been born overseas and 31.5% using a primary language other than English in their households. Christianity is the predominant faith, practiced by 55.0% of the population. Islamic affiliation shows marked local concentration at 11.9%, considerably higher than the 5.6% recorded across Greater Melbourne. Looking at parental heritage, the most widespread ancestries in Westmeadows comprise Australian at 19.5%, English at 19.2%, and Other backgrounds at 16.5%. Notable representation is also evident across specific communities, including Italian ancestry at 10.6% (compared to 5.2% regionally), Maltese at 2.5% (against 1.1%), and Lebanese at 2.5% (versus 0.8%).
Frequently Asked Questions - Diversity
The median resident of Westmeadows is 39. 26.1% of residents are aged 15 to 34. Age cohorts are not raw Census counts: the Census split is re-based to the latest ABS population estimates and state projections.
Detail
The demographic structure in Westmeadows leans toward mature cohorts. Updates through August 2026 show that seniors and retirees (65+) comprise 20.4% of the community, exceeding the 15.1% share for Greater Melbourne, while adults aged 25 - 44 represent 29.4% against a regional baseline of 32.1%. As at August 2026, the estimated median age remains steady at 39, matching the 2021 Census and exceeding the metropolitan median of 37 recorded during the same Census period. The shift since the Census is most evident in the 65+ cohort, which expanded from 19.0% to an estimated 20.4%.
Heading toward 2041, senior brackets will account for the majority of local population growth, increasing by 814 residents (58%) to reach 2,216.
Frequently Asked Questions - Age
Data & MethodBoundaries, Sources & Method for Westmeadows
9 of 14 data sections on this page were updated within the last 12 months — the newest current to Oct 2026.
Everything is aggregated to the Suburb (SAL) boundary shown above, on a 2021 Census baseline. Only 3 sections — housing, households and cultural diversity — still wait on the 2026 Census.
The ledger — source, cycle and currency by section
| Section | Source & update cycle | Currency |
|---|---|---|
| Updated within the last 12 months 9 sections | ||
| Population | ABS, GNAF, Geoscience Australia Annual (ABS ERP) | Aug 2026 2 months ago headline measures · 2021 Census baseline |
| Re-based to the ABS Estimated Resident Population (June 2025 release) and updated with new dwellings from GNAF address data. Current to Aug 2026, with the 2021 Census supplying the small-area baseline. | ||
| Age profile | ABS, Geoscience Australia, State governments Annual | Aug 2026 2 months ago headline measures · 2021 Census baseline |
| Age cohorts are re-based to the latest ABS population estimates and state projections, current to Aug 2026. Each cohort is held as a Census baseline and a current estimate. | ||
| Development & approvals | ABS, GNAF Monthly (ABS approvals) | Aug 2026 2 months ago headline measures · Jul 2026 baseline |
| Property sales & rents | Valuer General, Rental Board, ABS Weekly sales, quarterly rents | Oct 2026 this month headline measures · Sep 2026 baseline |
| Sales from the state Valuer General register, refreshed weekly, and rents from quarterly rental bond lodgements. Both are read live each time this page loads, current to Oct 2026. | ||
| Infrastructure projects | Infrastructure Australia, State agencies, Local governments Daily | Dec 2025 10 months ago all 3 projects tracked here |
| Project pipeline maintained continuously from Infrastructure Australia, state agencies, local government and public announcements. Records are added and revised daily; this area was last updated Dec 2025. | ||
| Employment | ABS, DEWR, JSA Quarterly (ABS SALM) | Mar 2026 7 months ago headline measures · 2021 Census baseline |
| Unemployment and labour force from ABS Small Area Labour Markets, current to Mar 2026. The growth outlook applies Department of Employment (now Jobs and Skills Australia) forecasts for all 19 industry divisions to the local industry mix, so it measures sector composition rather than local expansion and makes no allowance for population growth. Job demand comes from the same agency via its Internet Vacancy Index; industry and occupation structure from the 2021 Census. | ||
| Education | ABS, ACARA Annual (ACARA) | Sep 2026 last month headline measures · 2021 Census baseline |
| Transport | ABS, State Transport Departments Each timetable release | Jul 2026 3 months ago headline measures · 2021 Census baseline |
| Services & amenities | Provider directories, ACECQA Continuous | Sep 2026 last month all 14 measures |
| Annual and financial-year sources 2 sections | ||
| Income | ABS, ATO Annual (ATO) | FY 2023 3 years ago headline measures · 2021 Census baseline |
| ATO taxable income statistics for FY 2023, indexed forward using the Wage Price Index. Census household income provides the distribution detail. | ||
| Health | ABS, ATO Annual | 2024 2 years ago headline measures · 2021 Census baseline |
| Census-measured — next update: 2026 Census 3 sections No more current small-area source exists for these, so they are labelled as Census-measured rather than implied to be current. | ||
| Housing | ABS 5-yearly (Census) | 2021 Census next update 2026 all 30 measures |
| Households | ABS 5-yearly (Census) | 2021 Census next update 2026 all 18 measures |
| Cultural diversity | ABS, Geoscience Australia 5-yearly (Census) | 2021 Census next update 2026 all 44 measures |
"Currency" is the most recent release feeding that section. Where the Census supplies the structural baseline underneath a current headline figure, the row says so.
How the numbers are built
Population
The Census provides the small-area baseline, aggregated from mesh blocks to this boundary. It is then re-based to the ABS Estimated Resident Population (June 2025 release), and new dwellings built since Census night are counted from address data — 61 validated new addresses here. The headline figure is therefore a current estimate for Aug 2026, not a 2021 count (6,502 at the 2021 Census → 6,871 now). Annual growth rates are compound (CAGR), not simple averages.
Age profile
Cohort shares are not raw Census counts. Every cohort is held as a pair — the Census baseline and a current estimate — and the split is re-based using ERP and state population projections, current to Aug 2026. Median age is the Census median plus modelled change since. Charts that show both are labelled "2021 Census vs Current Estimate".
Property sales
Sourced from the state valuation authority's sales register — current, not Census, and refreshed weekly. Medians are calculated from settled transactions in the period shown; periods with very low transaction counts are flagged or suppressed, because a handful of sales can move a median substantially.
Rents
Derived from state rental bond lodgement data, by dwelling type and bedroom count. Bonds are lodged at the start of a new tenancy, so this reflects new lettings, not the whole rented stock.
Development & infrastructure
Building approvals come from current ABS releases; development applications are collected from council and state planning portals; the infrastructure pipeline is compiled from Infrastructure Australia and local government sources. Applications are matched to this boundary by address or coordinates, so very recent lodgements may not yet appear.
Employment & income
Industry and occupation structure comes from the Census, but the headline labour-market indicators do not. Unemployment and labour force are derived from ABS Small Area Labour Markets (quarterly). The employment outlook applies Department of Employment forecasts for all 19 industry divisions to this area's own industry mix (the agency is now Jobs and Skills Australia), as does the Internet Vacancy Index used for job demand. Because it is weighted on industry composition alone, that outlook carries no allowance for local population growth — in fast-growing areas the real rise in local jobs will typically be higher. Income combines Census household income with ATO taxable-income statistics for FY 2023, indexed forward using the Wage Price Index.
Education, transport & amenities
School enrolments, ICSEA and performance come from ACARA's current release, not the Census. Public transport stops and service frequency are derived from GTFS timetable feeds published by state transport departments. Services and amenities are proximity and count scores built from provider directories, refreshed on their own cycle. The Census contributes only the travel-to-work and qualification measures.
Rankings and benchmarks. Where we rank this area, the comparison set is every area of the same boundary type — suburbs against suburbs, SA2s against SA2s. Benchmarks compare this area against its greater capital city region and the national figure for the same measure and period.
Limits worth knowing. Small areas carry larger error margins, and the ABS introduces small random adjustments to Census counts to protect confidentiality — so totals may not sum exactly. Estimates re-based from regional data describe the area's expected trajectory, not a direct count of it. Figures are indicative for research and are not financial, planning or valuation advice.
Cross-check us. The Census baseline for this boundary is at ABS 2021 Census QuickStats (SAL22761). QuickStats reports 2021 only — the figures on this page are more current wherever the ledger shows a later date.