Chart Color Schemes
This analysis uses ABS Statistical Areas Level 2 (SA2) boundaries, which can materially differ from Suburbs and Localities (SAL) even when sharing similar names.
SA2 boundaries are defined by the Australian Bureau of Statistics and are designed to represent communities for statistical reporting (e.g., census and ERP).
Suburbs and Localities (SAL) represent commonly-used suburb/locality names (postal-style areas) and may use different geographic boundaries. For comprehensive analysis, consider reviewing both boundary types if available.
est. as @ -- *
ABS ERP | -- people | --
2021 Census | -- people
Sales Activity
Curious about local property values? Filter the chart to assess the volume and appreciation (including resales) trends and regional comparisons, or scroll to the map below view this information at an individual property level.
Find a Recent Sale
Sales Detail
Population
Bridgeman Downs lies within the top quartile of areas nationally for population growth performance according to AreaSearch analysis of recent, and medium to long-term trends
Bridgeman Downs' population is approximately 12,092 as of November 2025. This figure represents a growth of 1,591 people since the 2021 Census, which reported a population of 10,501. The increase is inferred from an estimated resident population of 11,675 in June 2024 and an additional 311 validated new addresses since the Census date. This results in a population density ratio of 1,275 persons per square kilometer, higher than the average across national locations assessed by AreaSearch. Bridgeman Downs' growth rate of 15.2% since the 2021 census exceeds both the SA4 region's 8.6% and the national average, positioning it as a growth leader in the area. Interstate migration contributed approximately 54.5% of overall population gains during recent periods, with other factors such as overseas migration and natural growth also being positive contributors.
AreaSearch uses ABS/Geoscience Australia projections for each SA2 area released in 2024 with a base year of 2022. For areas not covered by this data and years post-2032, Queensland State Government's SA2 area projections from 2023 based on 2021 data are adopted, with proportional growth weightings applied for age cohorts in line with ABS Greater Capital Region projections released in 2023 using 2022 data. Projected demographic shifts indicate a significant population increase in the top quartile of national areas by 2041, with Bridgeman Downs expected to gain an additional 3,330 persons, reflecting a total growth of 24.1% over the 17 years.
Frequently Asked Questions - Population
Development
AreaSearch assessment of residential development activity positions Bridgeman Downs among the top 25% of areas assessed nationwide
Bridgeman Downs has recorded approximately 82 residential properties granted approval annually. Over the past five financial years, from FY-21 to FY-25, a total of 414 homes were approved, with an additional 38 approved so far in FY-26. On average, around five new residents arrive per dwelling constructed each year over this period.
This indicates that supply is lagging behind demand, which typically leads to heightened buyer competition and pricing pressures. The average expected construction cost value for new dwellings is $383,000, slightly above the regional average, suggesting a focus on quality developments. In FY-26, $1.0 million in commercial development approvals have been recorded, indicating a predominantly residential focus.
Compared to Greater Brisbane, Bridgeman Downs shows moderately higher construction activity, with 32.0% more activity per person over the five-year period from FY-21 to FY-25. This balances buyer choice while supporting current property values, although construction activity has eased recently. New development consists of 77.0% detached houses and 23.0% attached dwellings, preserving the area's suburban nature with an emphasis on detached housing attracting space-seeking buyers. With around 234 people per dwelling approval, Bridgeman Downs shows a developing market. Looking ahead, Bridgeman Downs is expected to grow by approximately 2,913 residents through to 2041, according to the latest AreaSearch quarterly estimate. If current construction levels continue, housing supply should adequately meet demand, creating favourable conditions for buyers while potentially enabling growth that exceeds current forecasts.
Frequently Asked Questions - Development
Infrastructure
Bridgeman Downs has strong levels of nearby infrastructure activity, ranking in the top 30% nationally
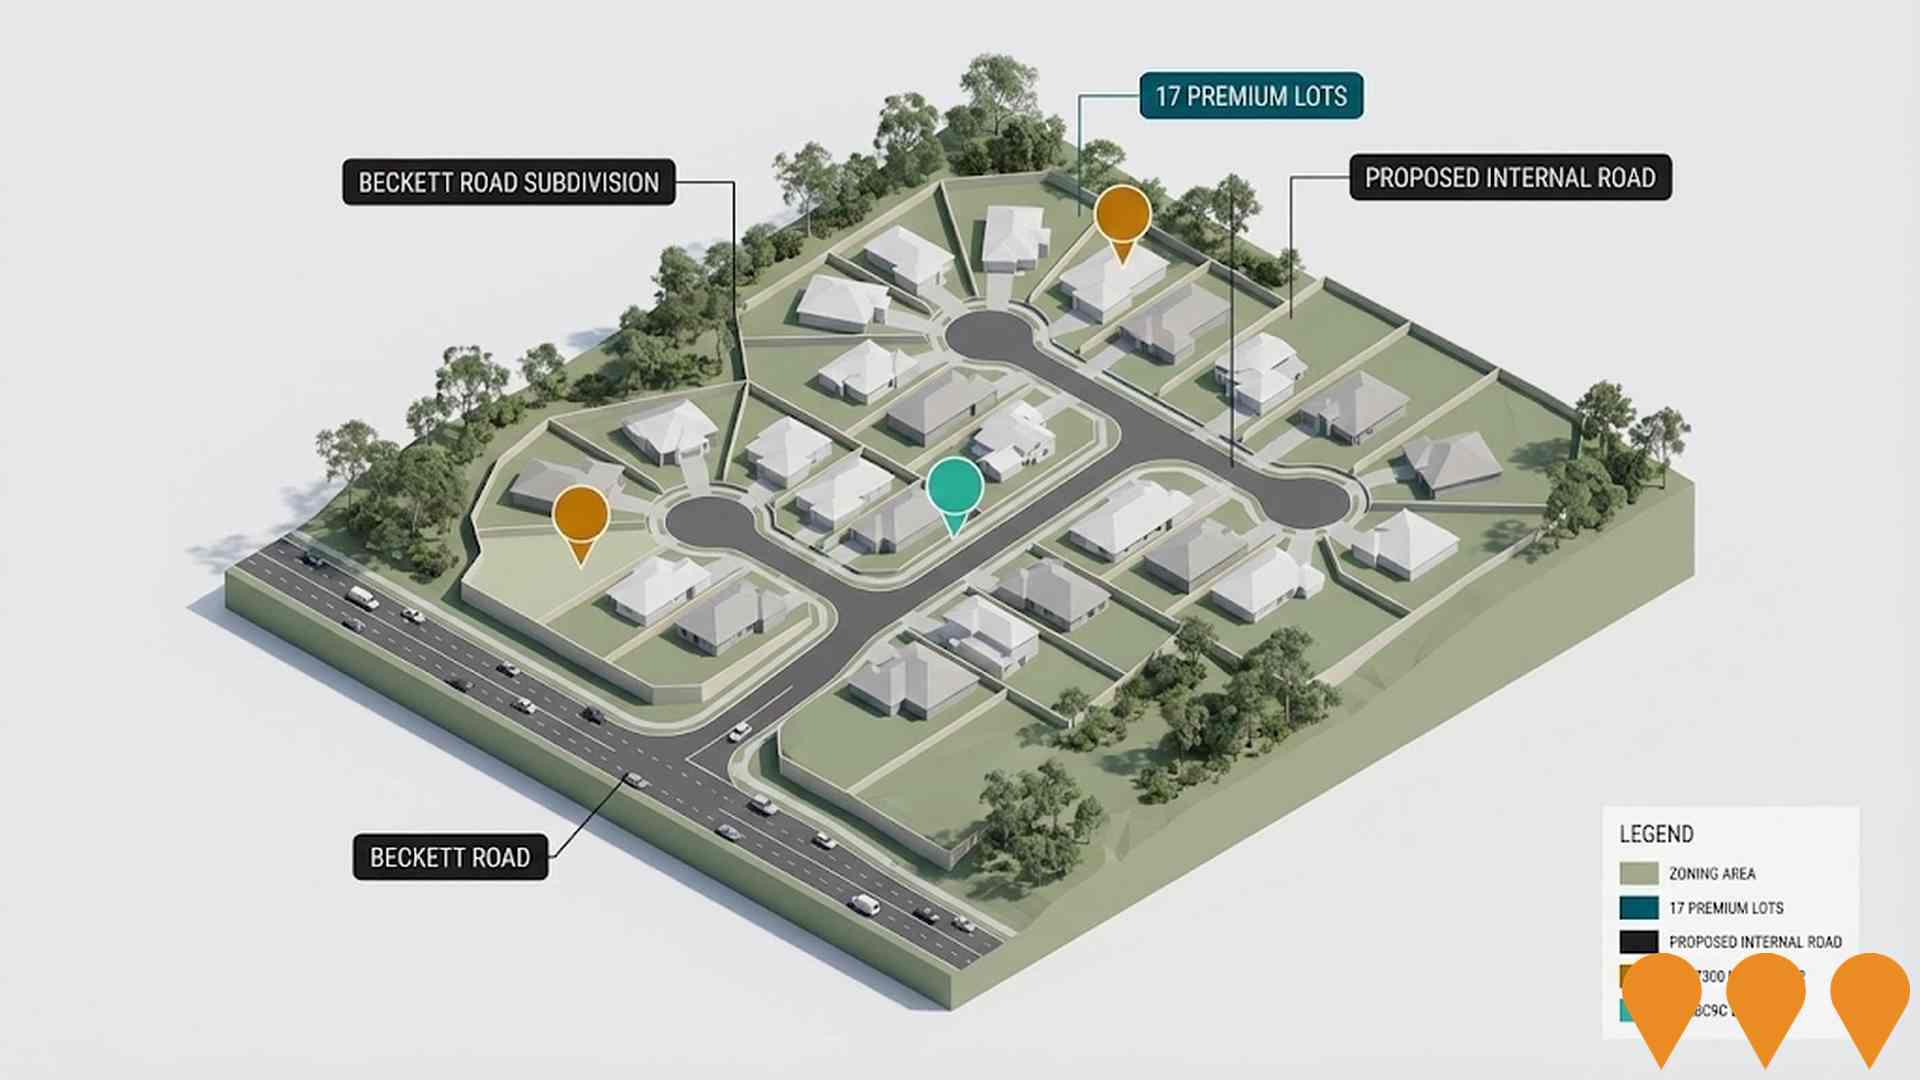
Changes in local infrastructure significantly affect an area's performance. AreaSearch has identified 18 projects that could impact the region. Notable projects include Northern Brisbane Green Corridors, Grevillea on Graham, Grevillea on Idonia, and Beckett Road Subdivision. The following list details those likely to be most relevant.
Professional plan users can use the search below to filter and access additional projects.
INFRASTRUCTURE SEARCH
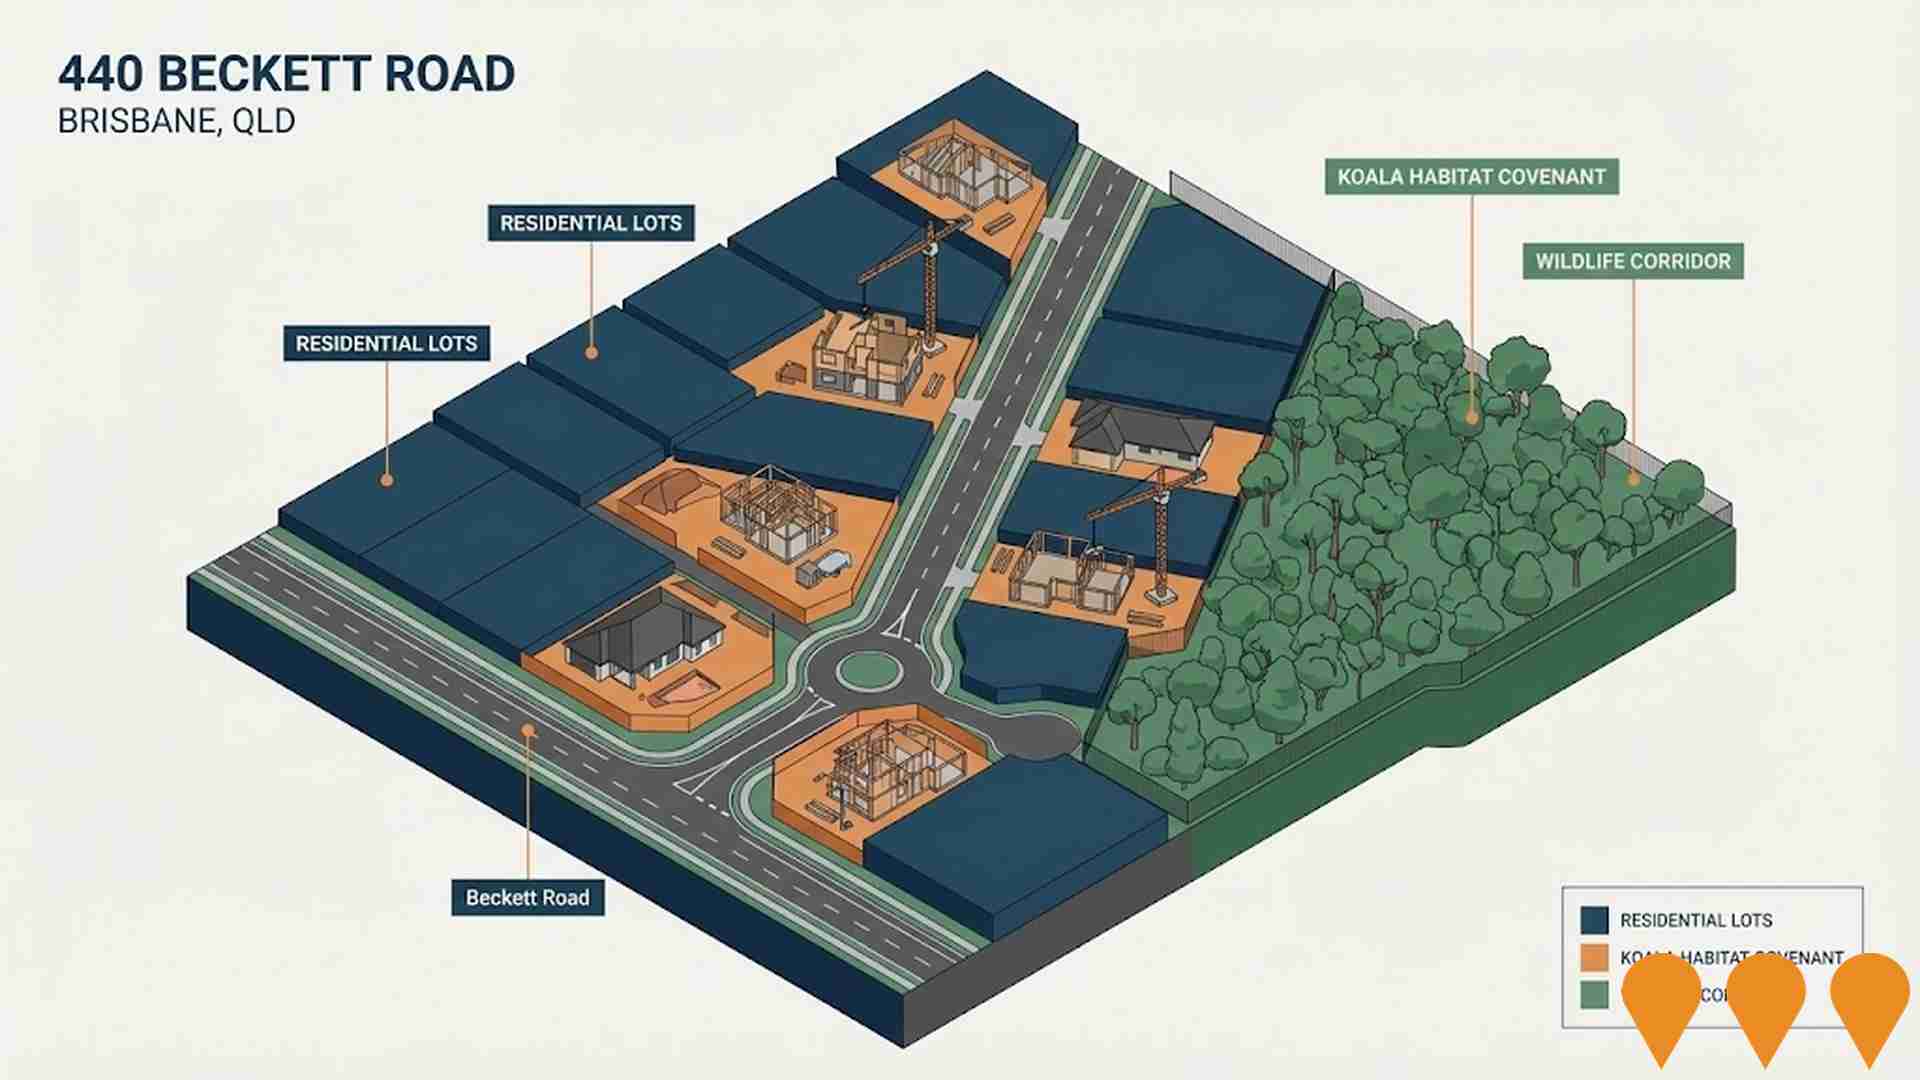
 Denotes AI-based impression for illustrative purposes only, not to be taken as definitive under any circumstances. Please follow links and conduct other investigations from the project's source for actual imagery. Developers and project owners wishing us to use original imagery please Contact Us and we will do so.
Frequently Asked Questions - Infrastructure
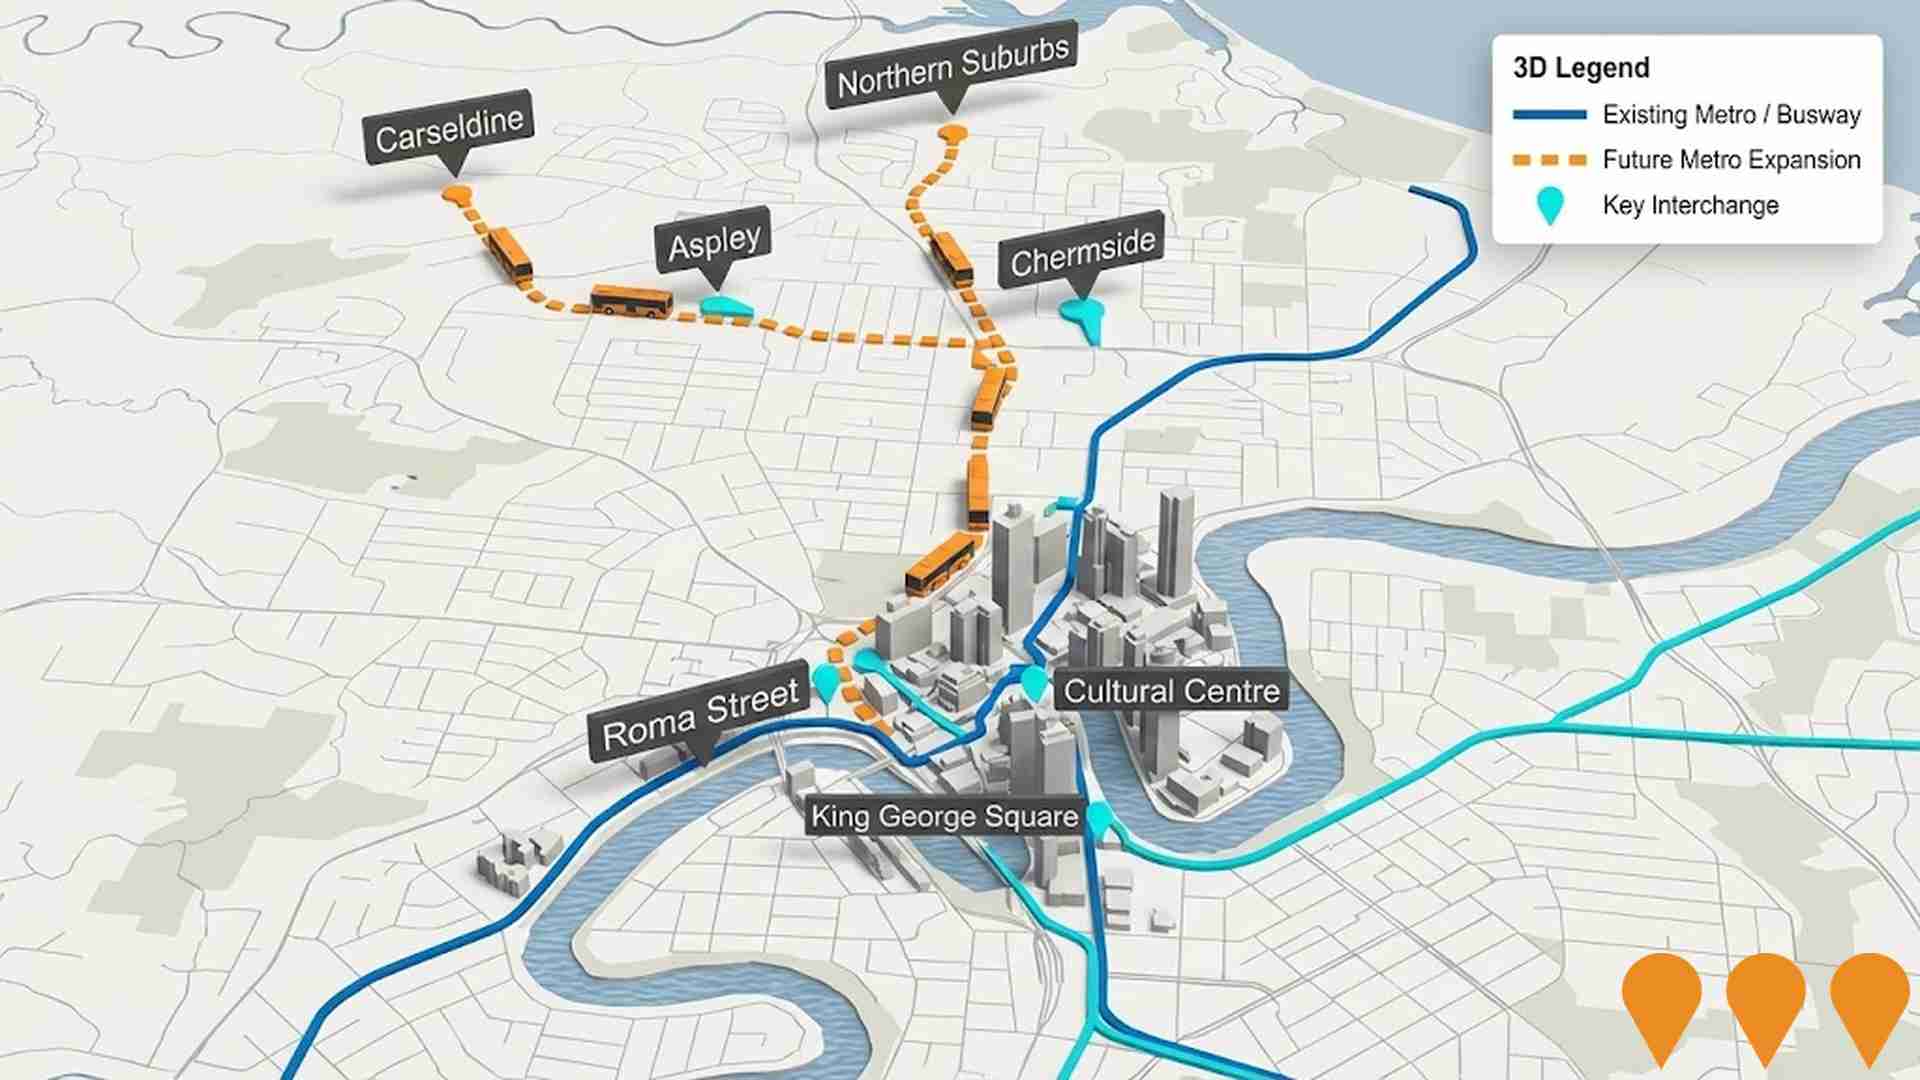
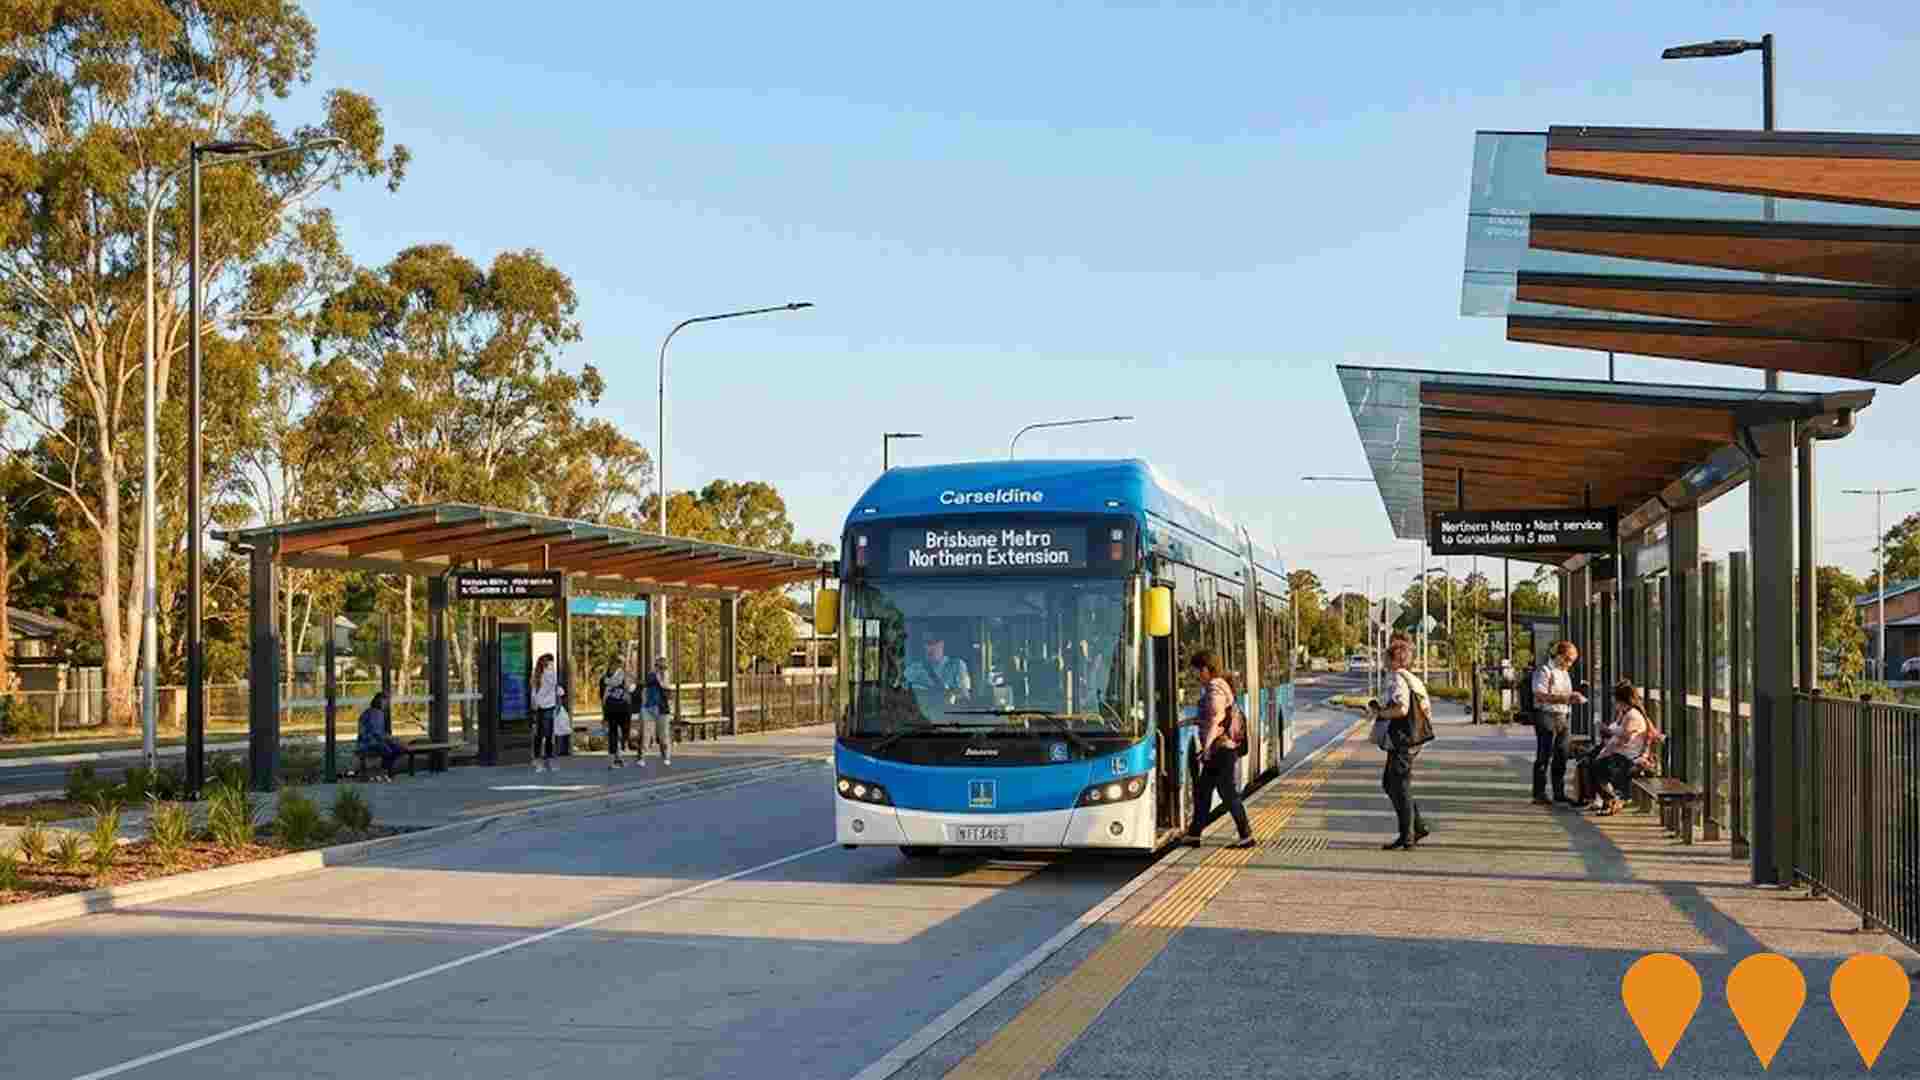
Brisbane Metro Northern Extension (Northern Metro)
Extension of the Brisbane Metro rapid bus transit system north from the Brisbane CBD to Carseldine (officially referred to as Northern Metro), delivering high-frequency, high-capacity fully electric metro services via dedicated infrastructure. The corridor includes new or extended stations at Lutwyche, Kedron, Chermside, Aspley and Carseldine, linking Moreton Bay communities to Brisbane employment centres ahead of the 2032 Olympic and Paralympic Games. A joint Brisbane City Council and Queensland Government project, supported by the Federal Government, currently in rapid business case phase with $50 million federal funding allocated for the business case.
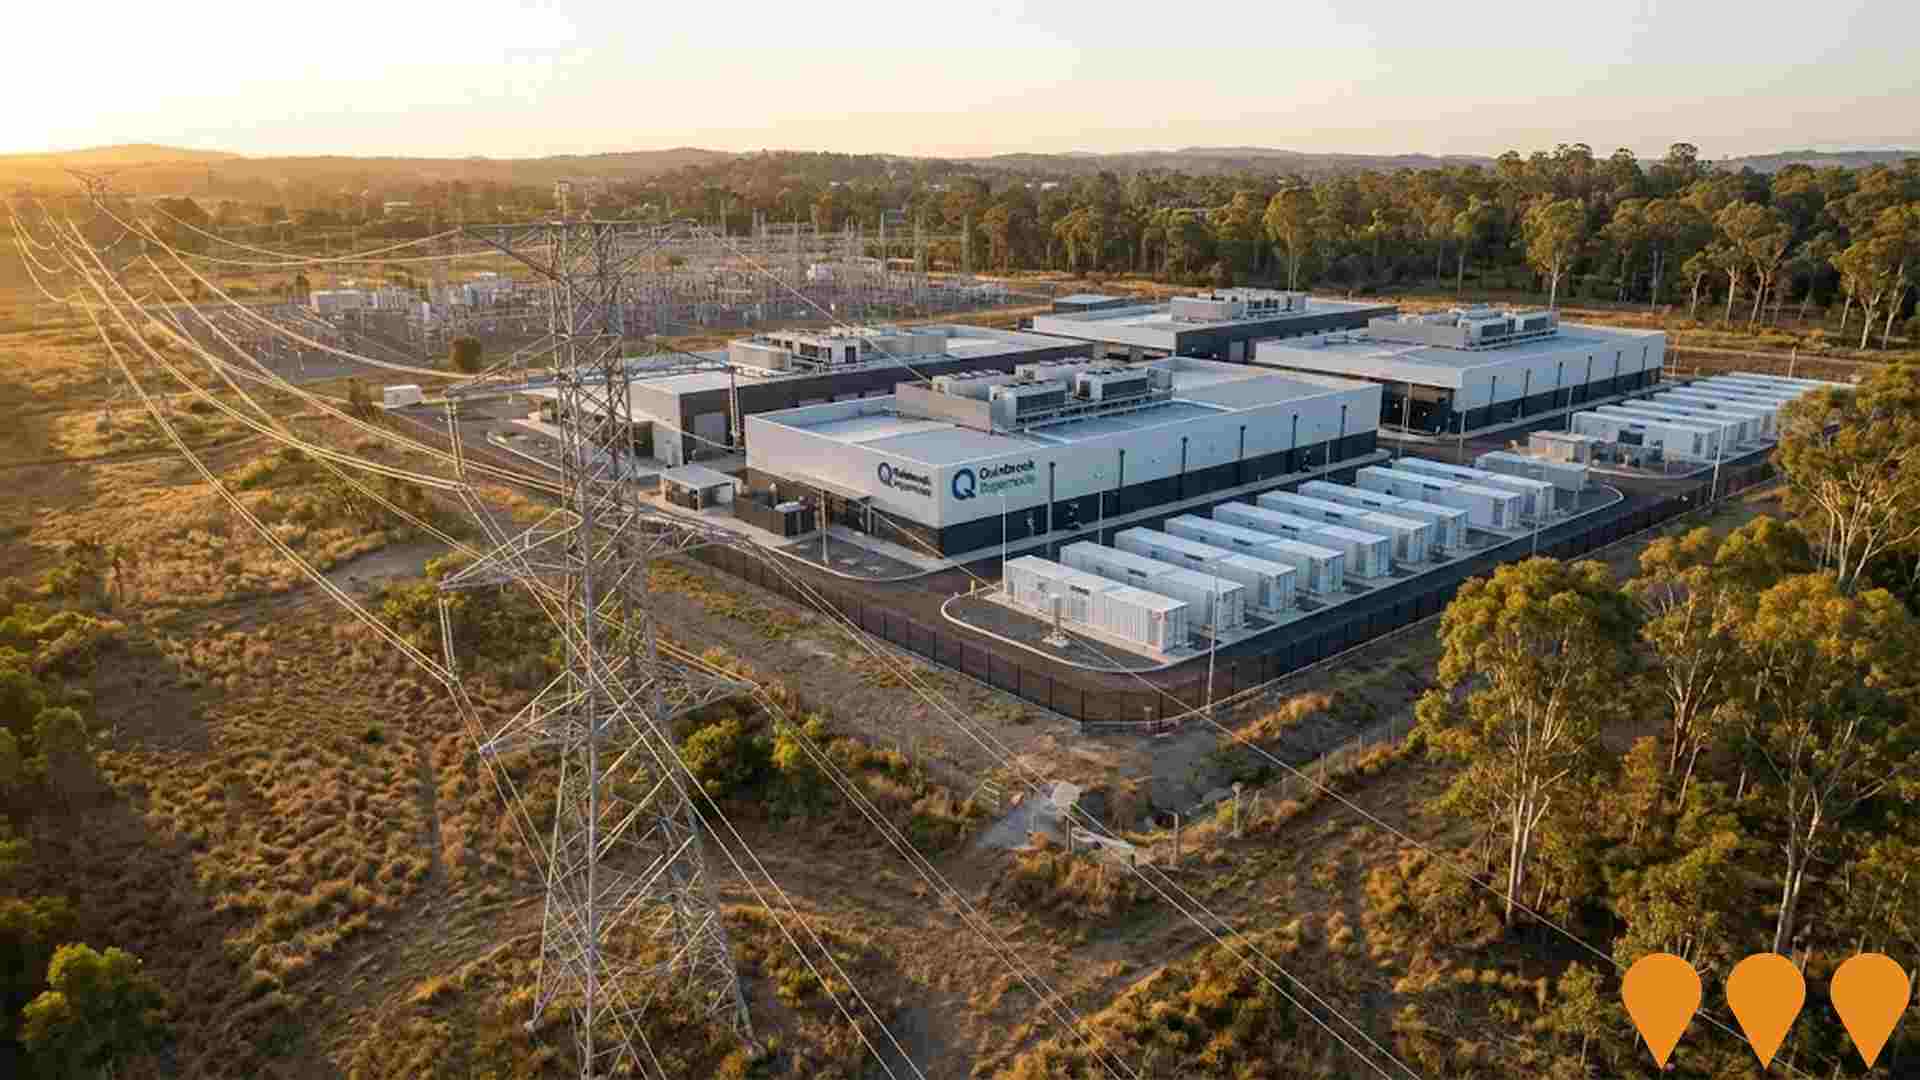
Supernode (Quinbrook Supernode Data Centre & BESS)
The $2.5 billion Supernode project in Brendale (north Brisbane) is a sustainable hyperscale data centre campus with up to 800 MW IT capacity across four buildings and a co-located Battery Energy Storage System (BESS) of up to 780 MW / 3,096 MWh. Stage 1 of the BESS (250 MW / 500 MWh) is under construction and due for completion in late 2025, with the full data centre campus and expanded BESS expected by 2027-2028. Powered entirely by renewable energy and connected directly to the 275 kV South Pine substation, Supernode is designed to support Queensland's energy transition and provide high-performance computing/AI workloads.
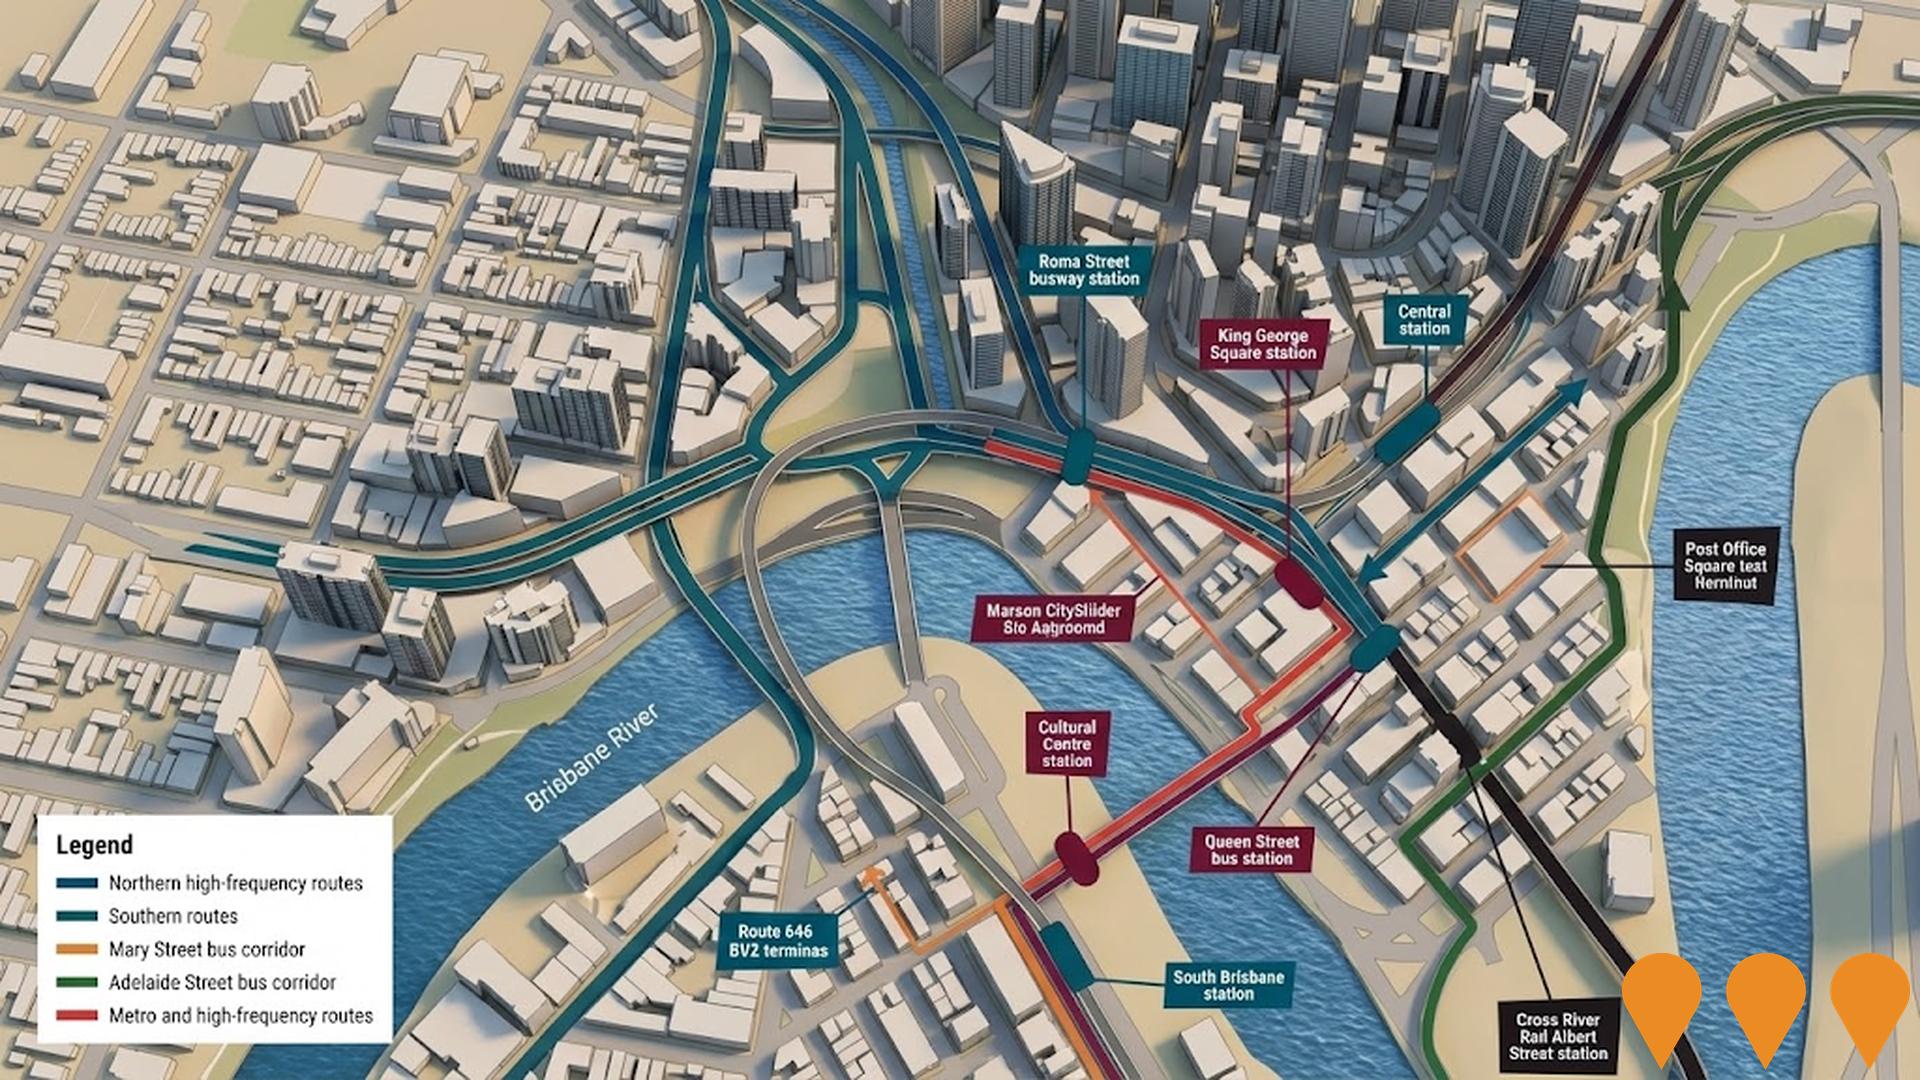
Brisbane Metro Extension - Northern Transitway
The Brisbane Metro Extension - Northern Transitway project would extend high frequency Brisbane Metro services north from the CBD by using the Northern Transitway bus lanes along Gympie Road between Kedron and Chermside, the existing Northern Busway between RBWH and Kedron Brook, and a future busway tunnel as part of a Gympie Road bypass. Northern Transitway bus priority works on Gympie Road were delivered in 2024, improving peak bus travel times between Kedron and Chermside and setting up the corridor for future Metro operations. Brisbane City Council and the Queensland Government are now preparing a rapid business case, supported by federal funding, to confirm the alignment, new stations, depot locations and delivery phasing for a Northern Metro route from the CBD through Lutwyche, Kedron and Chermside to Carseldine ahead of the 2032 Olympic and Paralympic Games. Detailed design and construction timeframes for the Metro extension are subject to the outcomes of this business case and subsequent funding approvals.
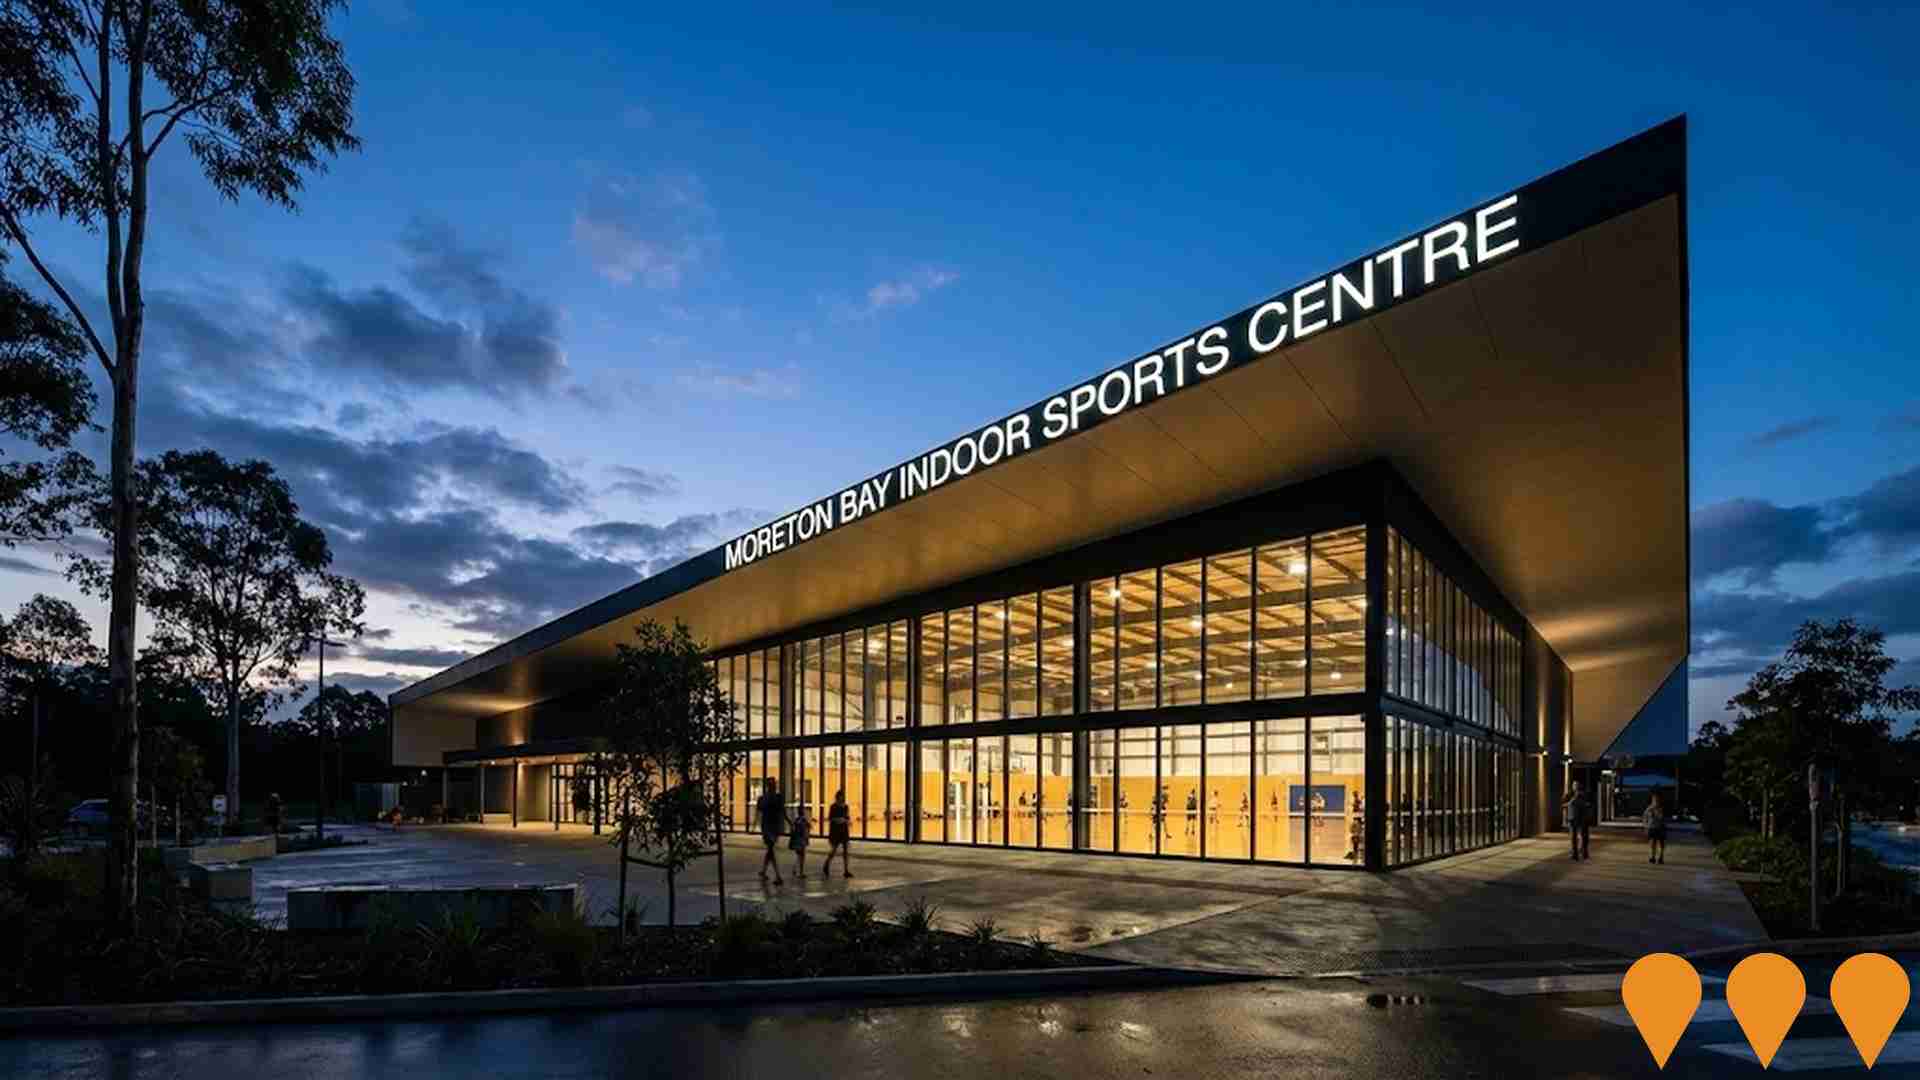
Moreton Bay Indoor Sports Centre
A state-of-the-art $205 million multi-sport facility at The Mill Precinct, Petrie, designed for the Brisbane 2032 Olympic and Paralympic Games. Features 12 courts across two halls for sports including basketball, netball, boxing, volleyball, badminton, futsal, wheelchair rugby, pickleball, gymnastics, fencing, table tennis, taekwondo, handball, sitting volleyball, and wheelchair basketball. Accommodates up to 10,000 spectators for Olympic boxing events. Includes a cafe, 302 car parks, and meeting rooms. Enabling works have commenced on-site, with procurement underway for a Principal Design Consultant and earthworks tender announced. Expected to create 178 construction jobs and be operational by 2028.
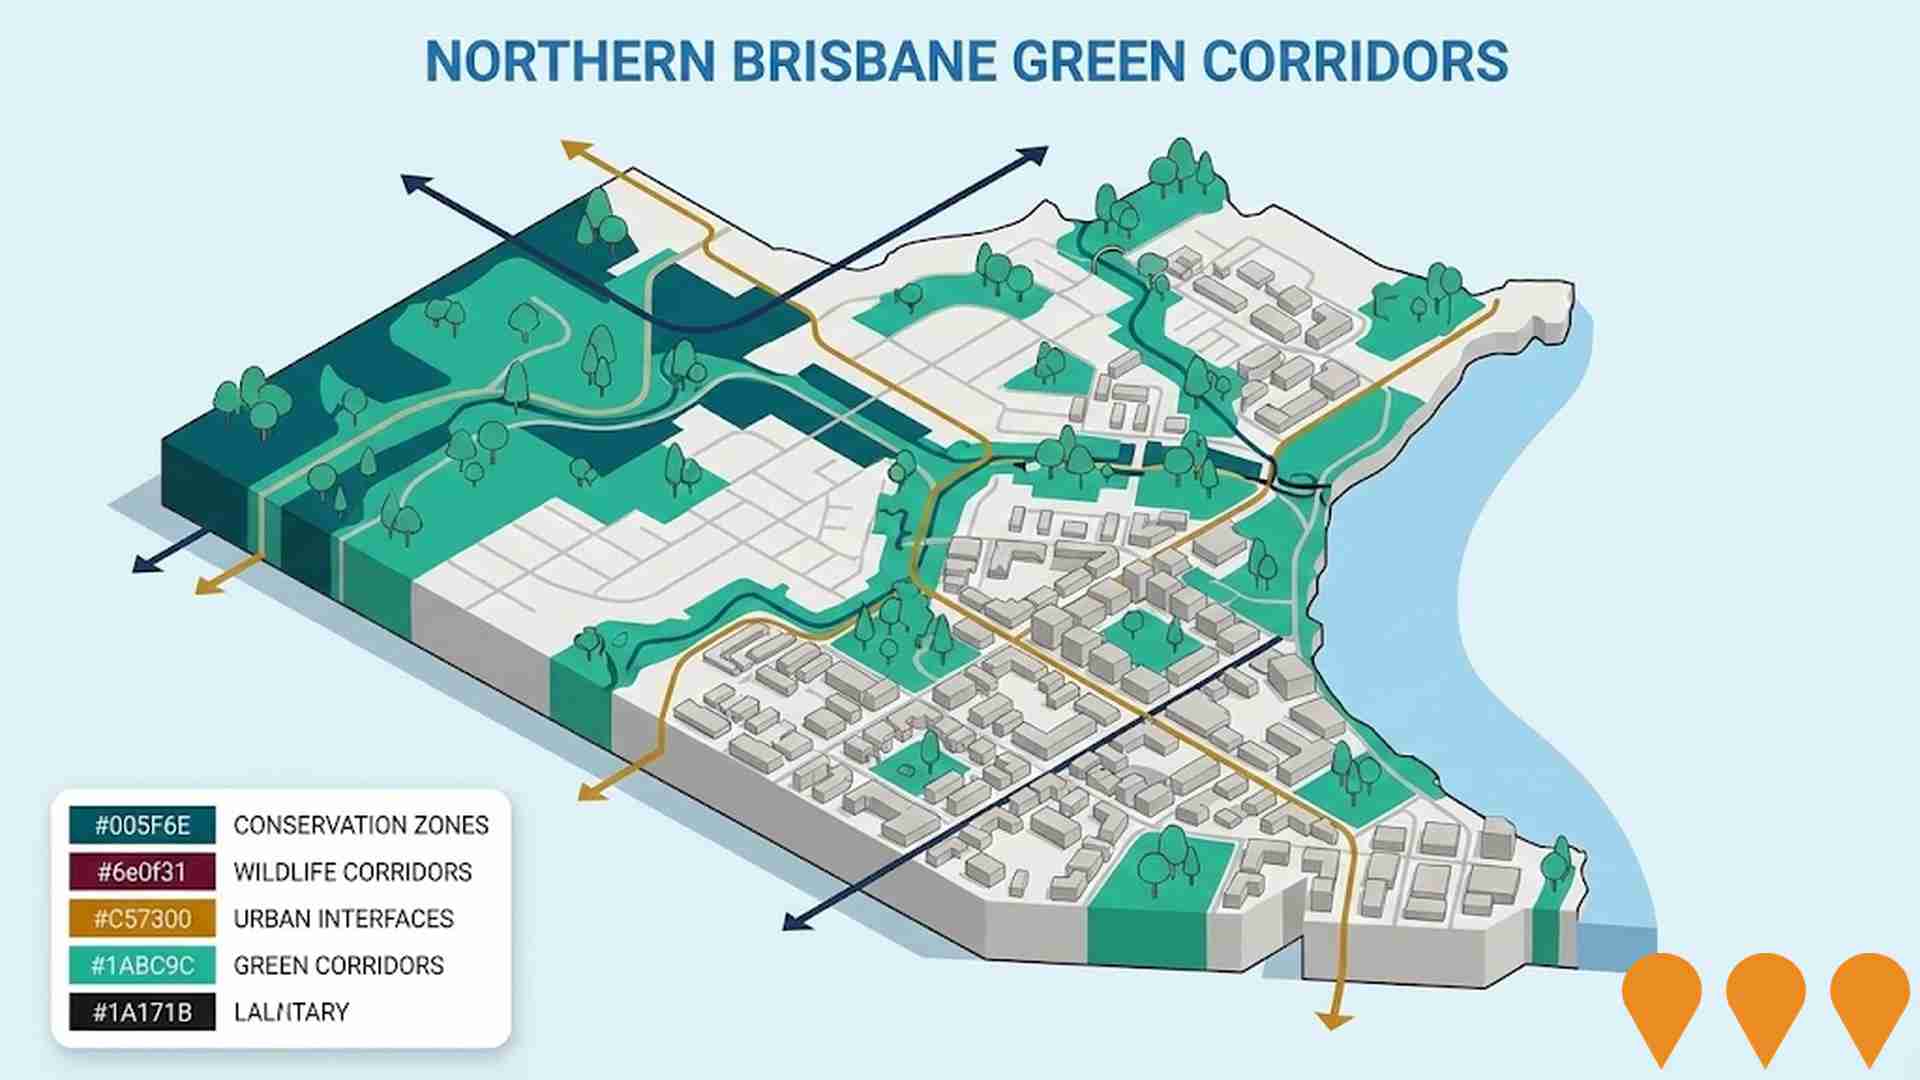
Northern Brisbane Green Corridors
Environmental conservation and enhancement project creating connected green spaces, wildlife corridors, and improved biodiversity across northern Brisbane suburbs including areas adjacent to Wavell Heights.
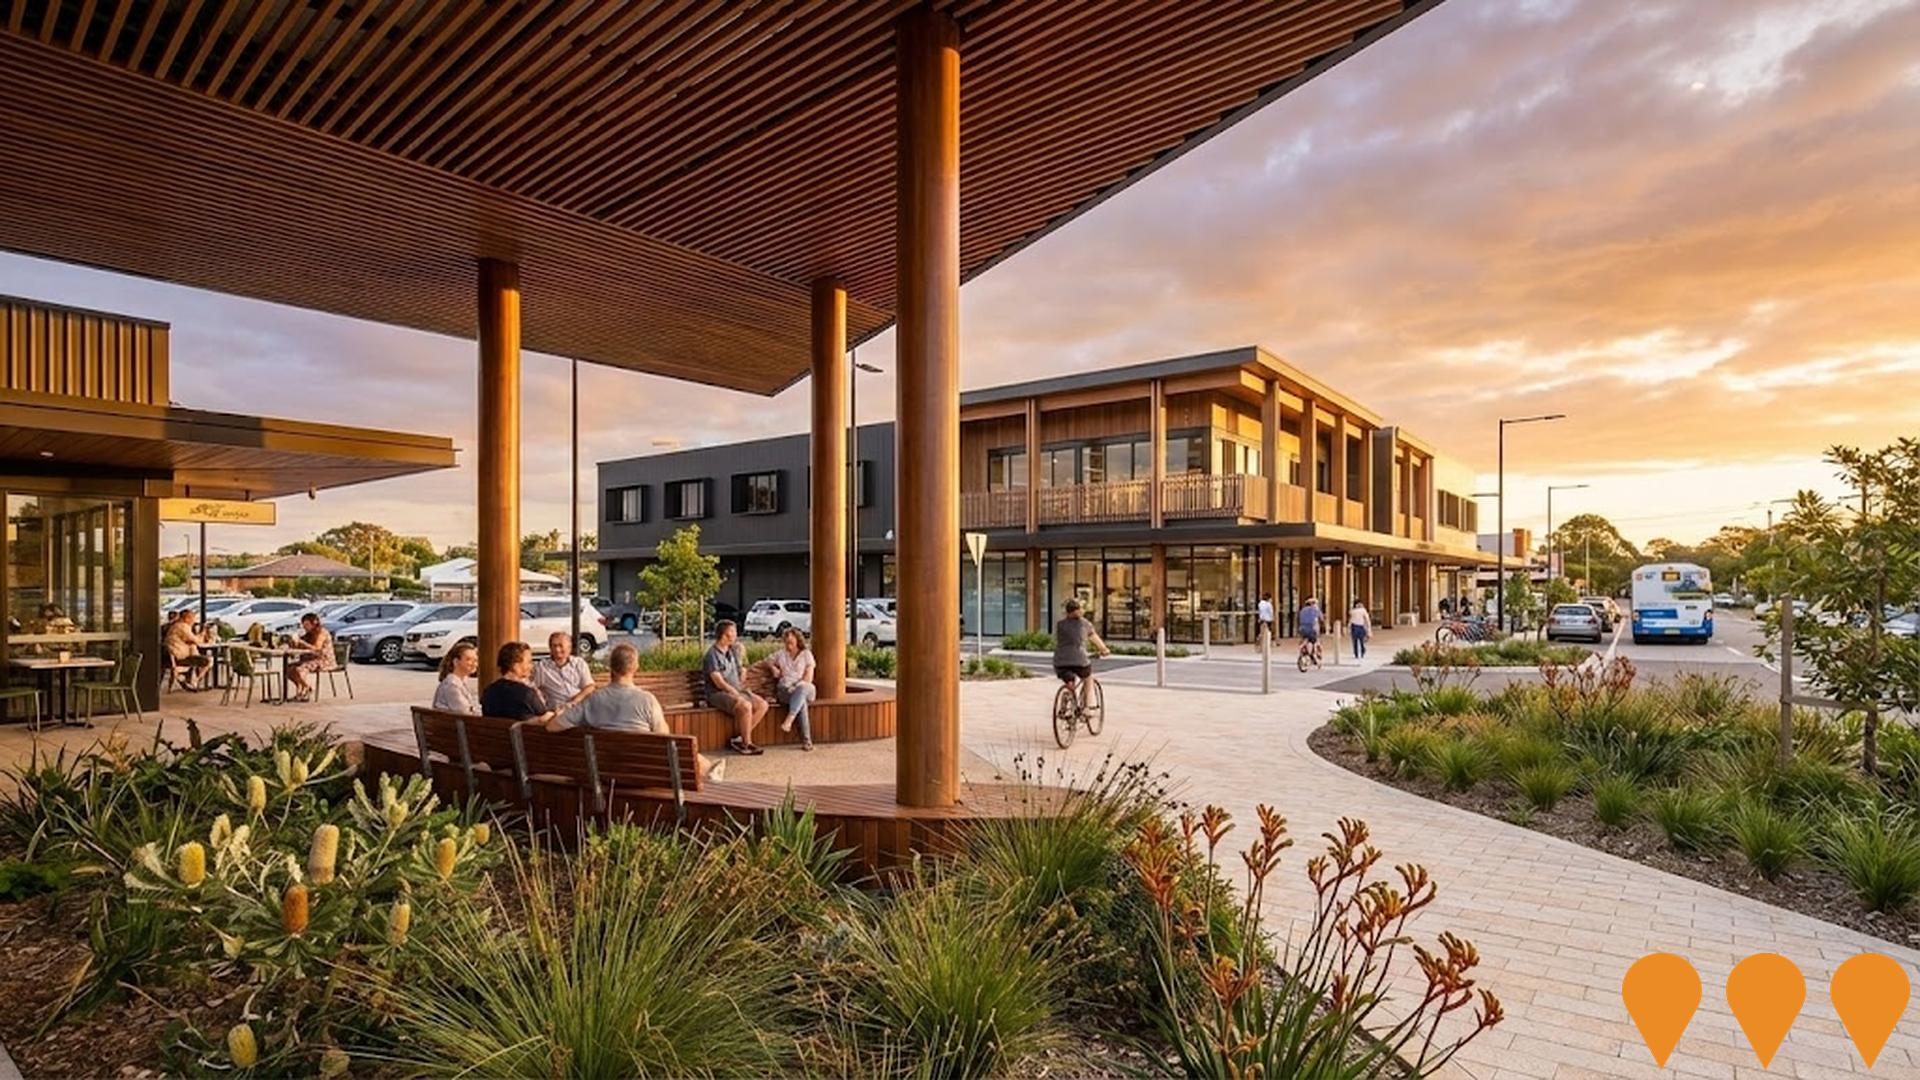
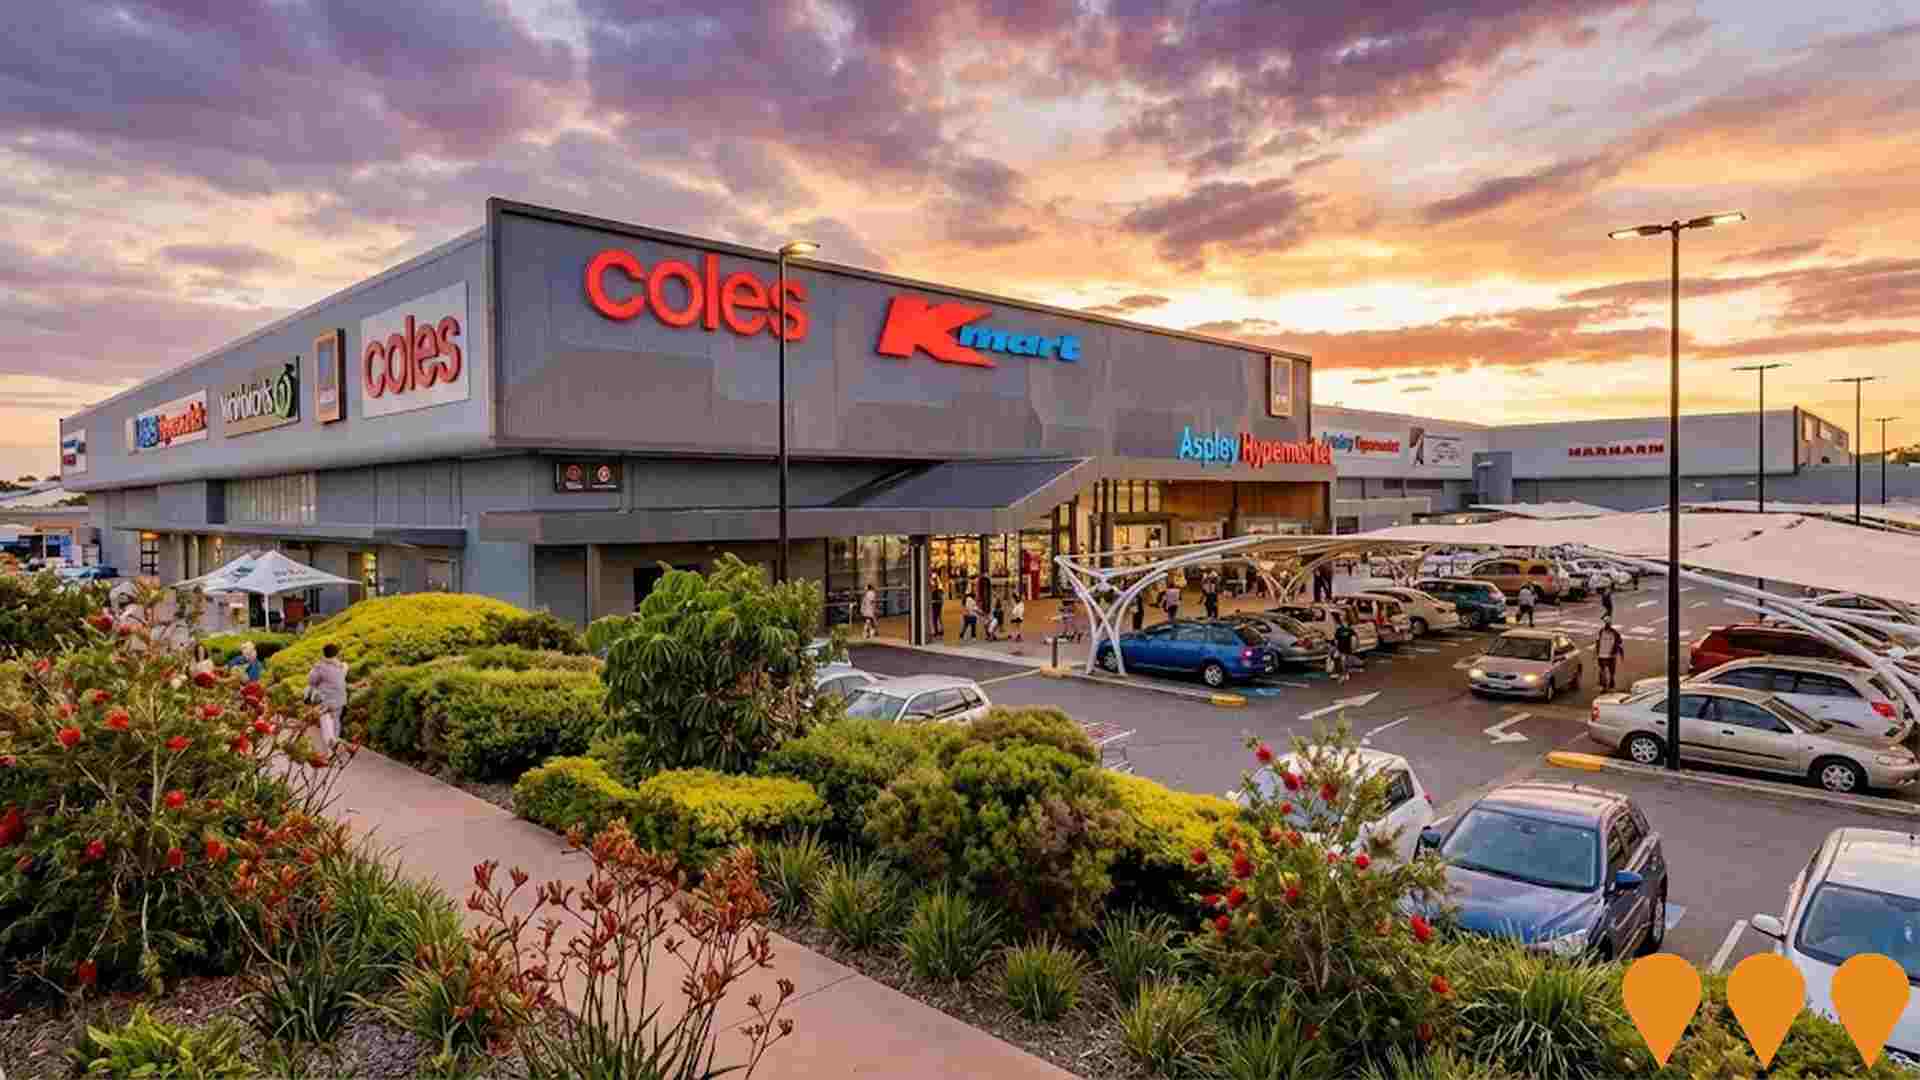
Aspley Hypermarket Redevelopment & Extension
$50 million redevelopment and extension of Aspley Hypermarket including new Woolworths store, expanded retail offerings, improved parking facilities and enhanced customer experience. Major retail infrastructure upgrade serving northern Brisbane communities. Originally built by Pick 'n Pay in 1984, now anchored by Coles, Kmart, ALDI, Woolworths and Sunlit Asian Supermarket.
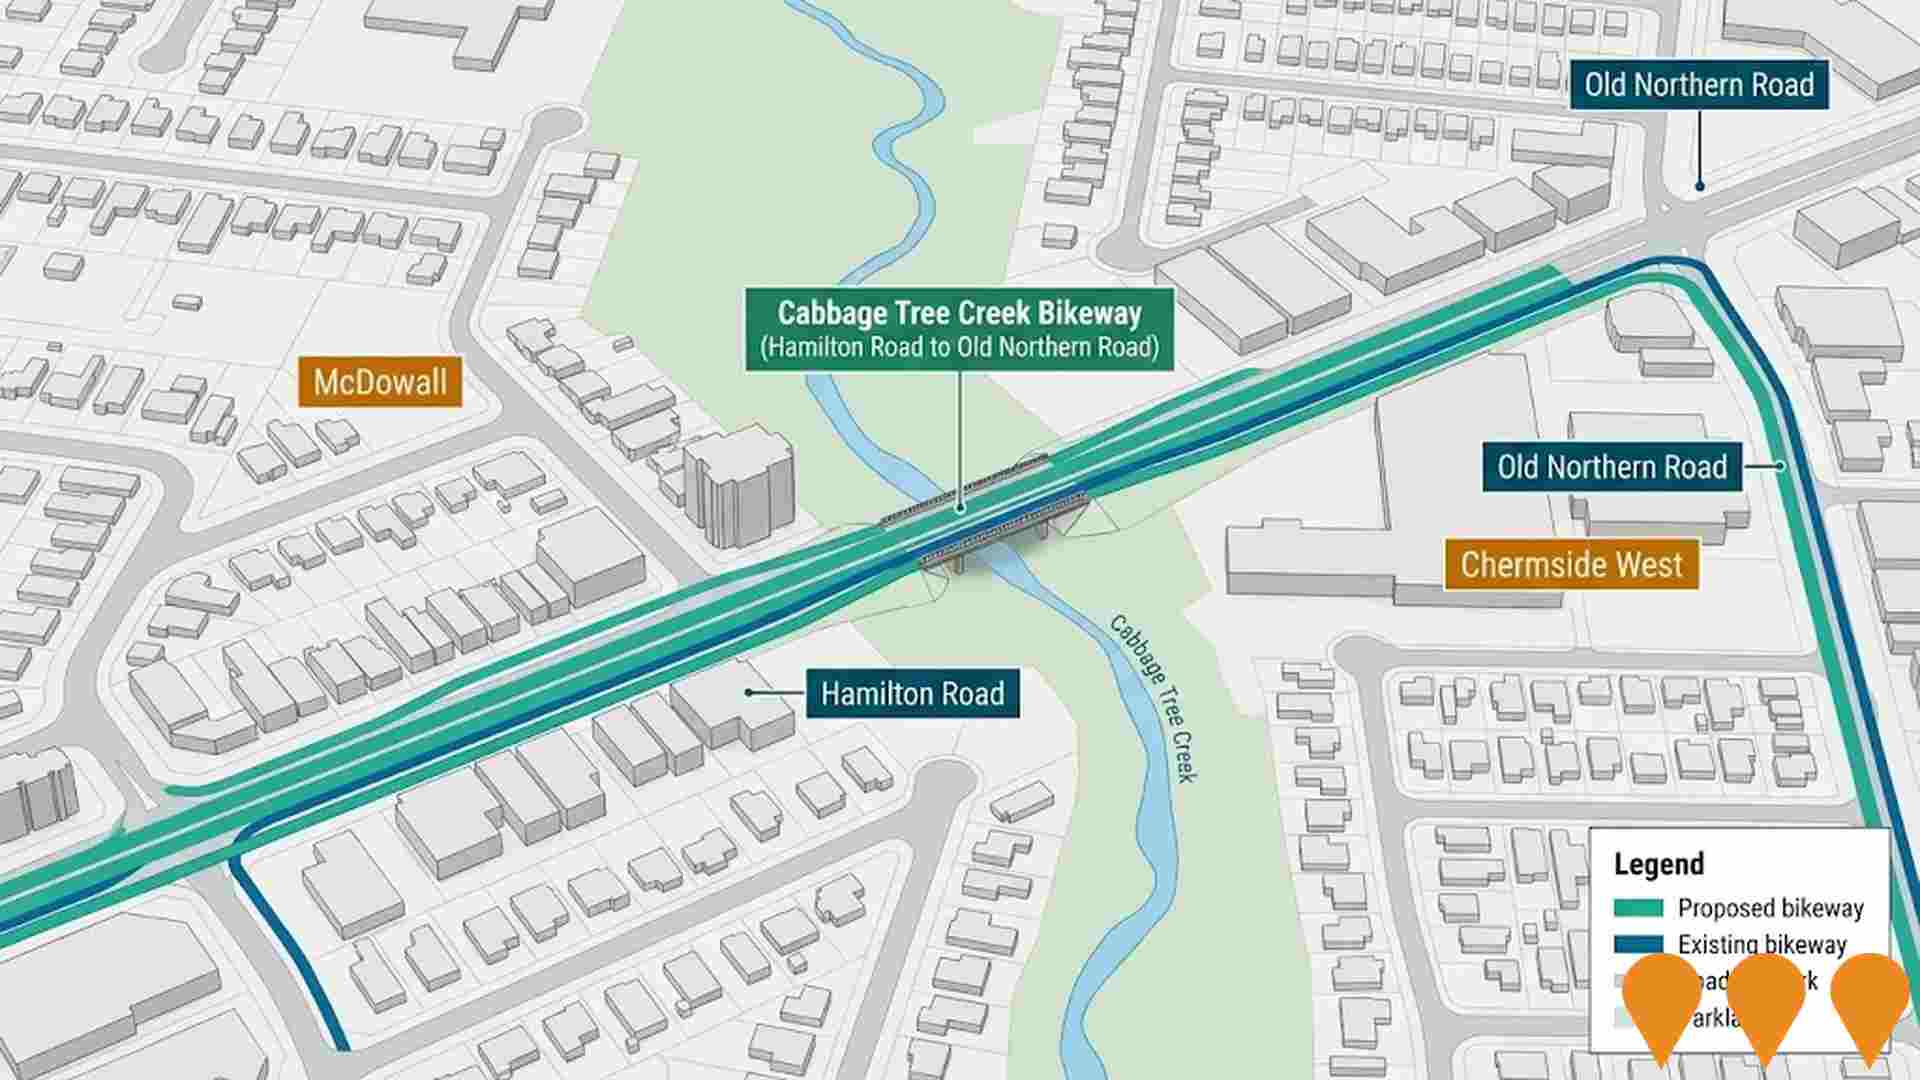
Cabbage Tree Creek Bikeway (Hamilton Road to Old Northern Road)
Hamilton Road and Old Northern Road Active Transport Corridor is a planned local bikeway and shared path upgrade delivered by Brisbane City Council along the Hamilton Road corridor between McDowall and Chermside West. It will improve walking and cycling links between suburbs and connect into the existing Cabbage Tree Creek Bikeway, supporting safer east west movements to local parks, schools and centres. Council has identified this section as a trunk active transport project in its pathway network schedule under the name Cabbage Tree Creek Bikeway (Hamilton Road to Old Northern Road), a secondary cycle route with an indicative delivery window of 2021 to 2026. The project is expected to involve new or widened shared paths, safer road crossings and local intersection improvements, aligning with the broader program of bikeway upgrades across Brisbane. :contentReference[oaicite:0]{index=0} :contentReference[oaicite:1]{index=1} :contentReference[oaicite:2]{index=2}
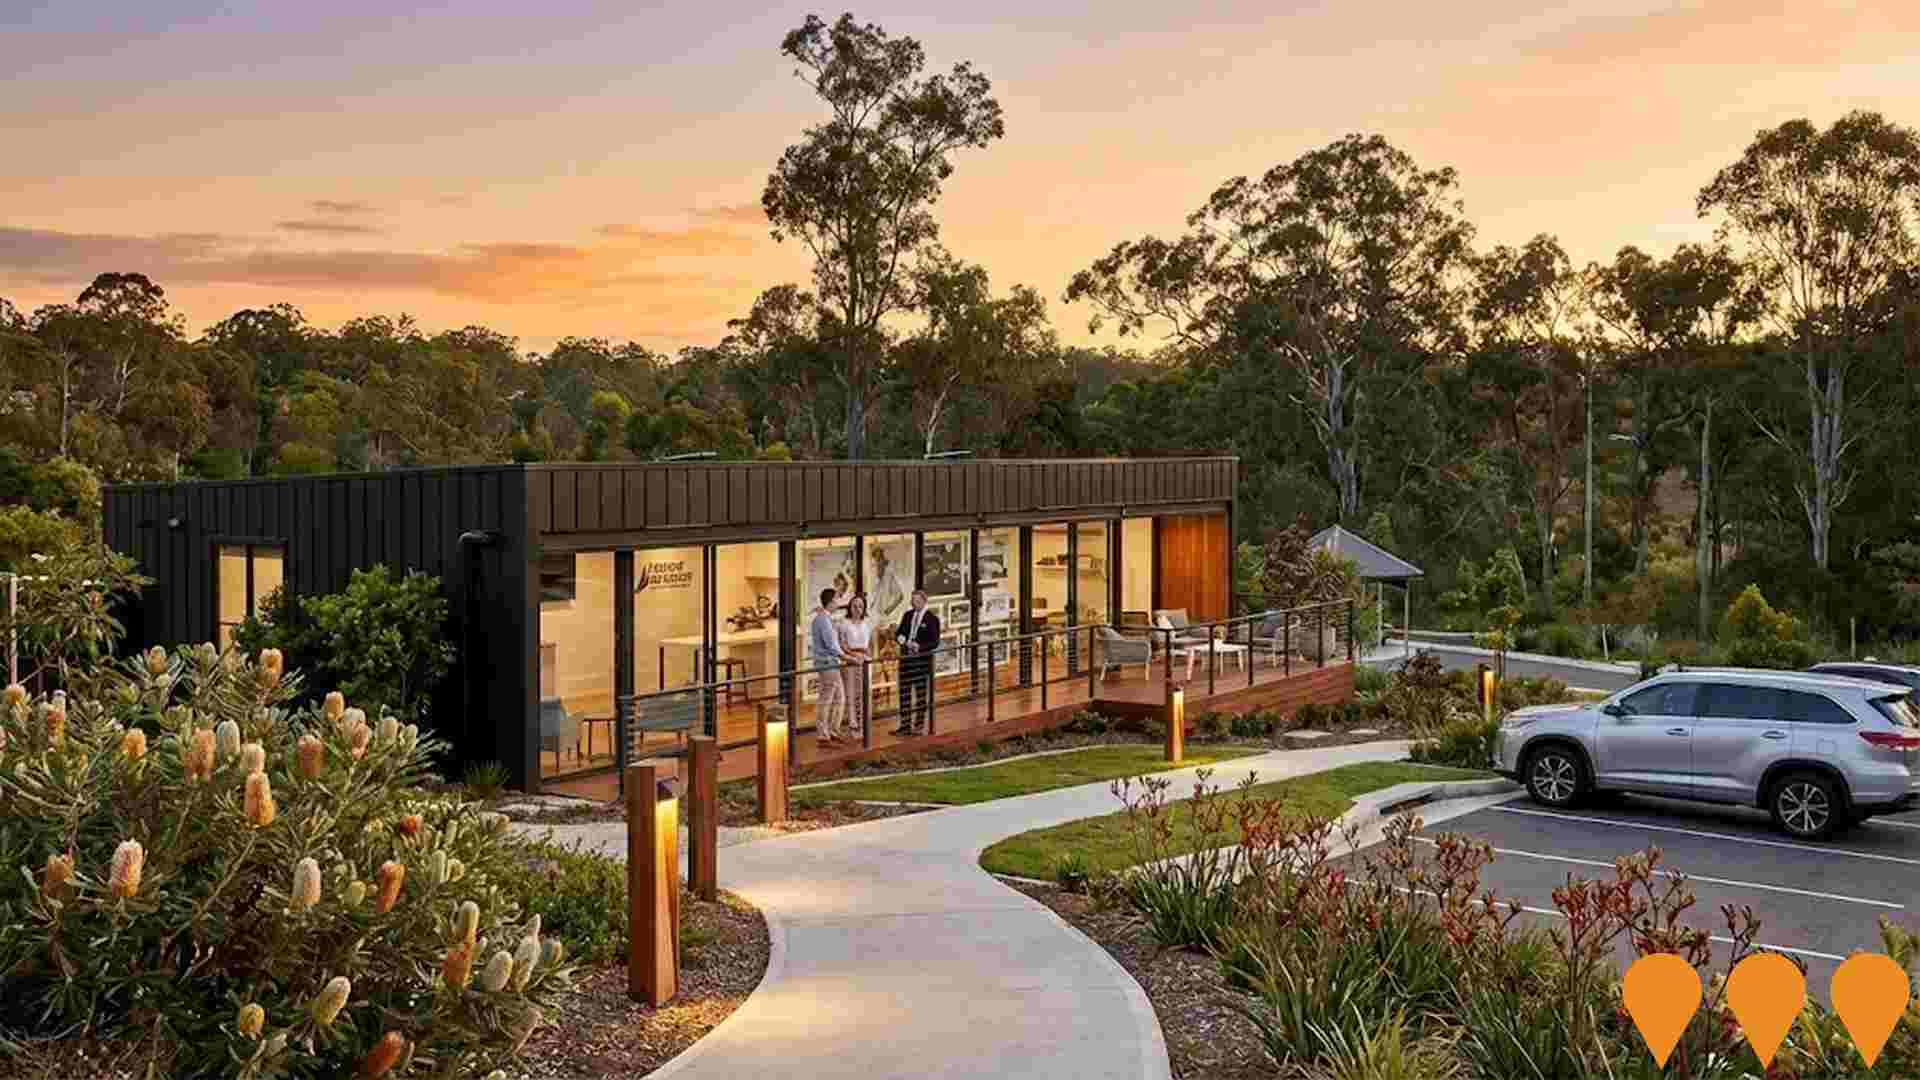
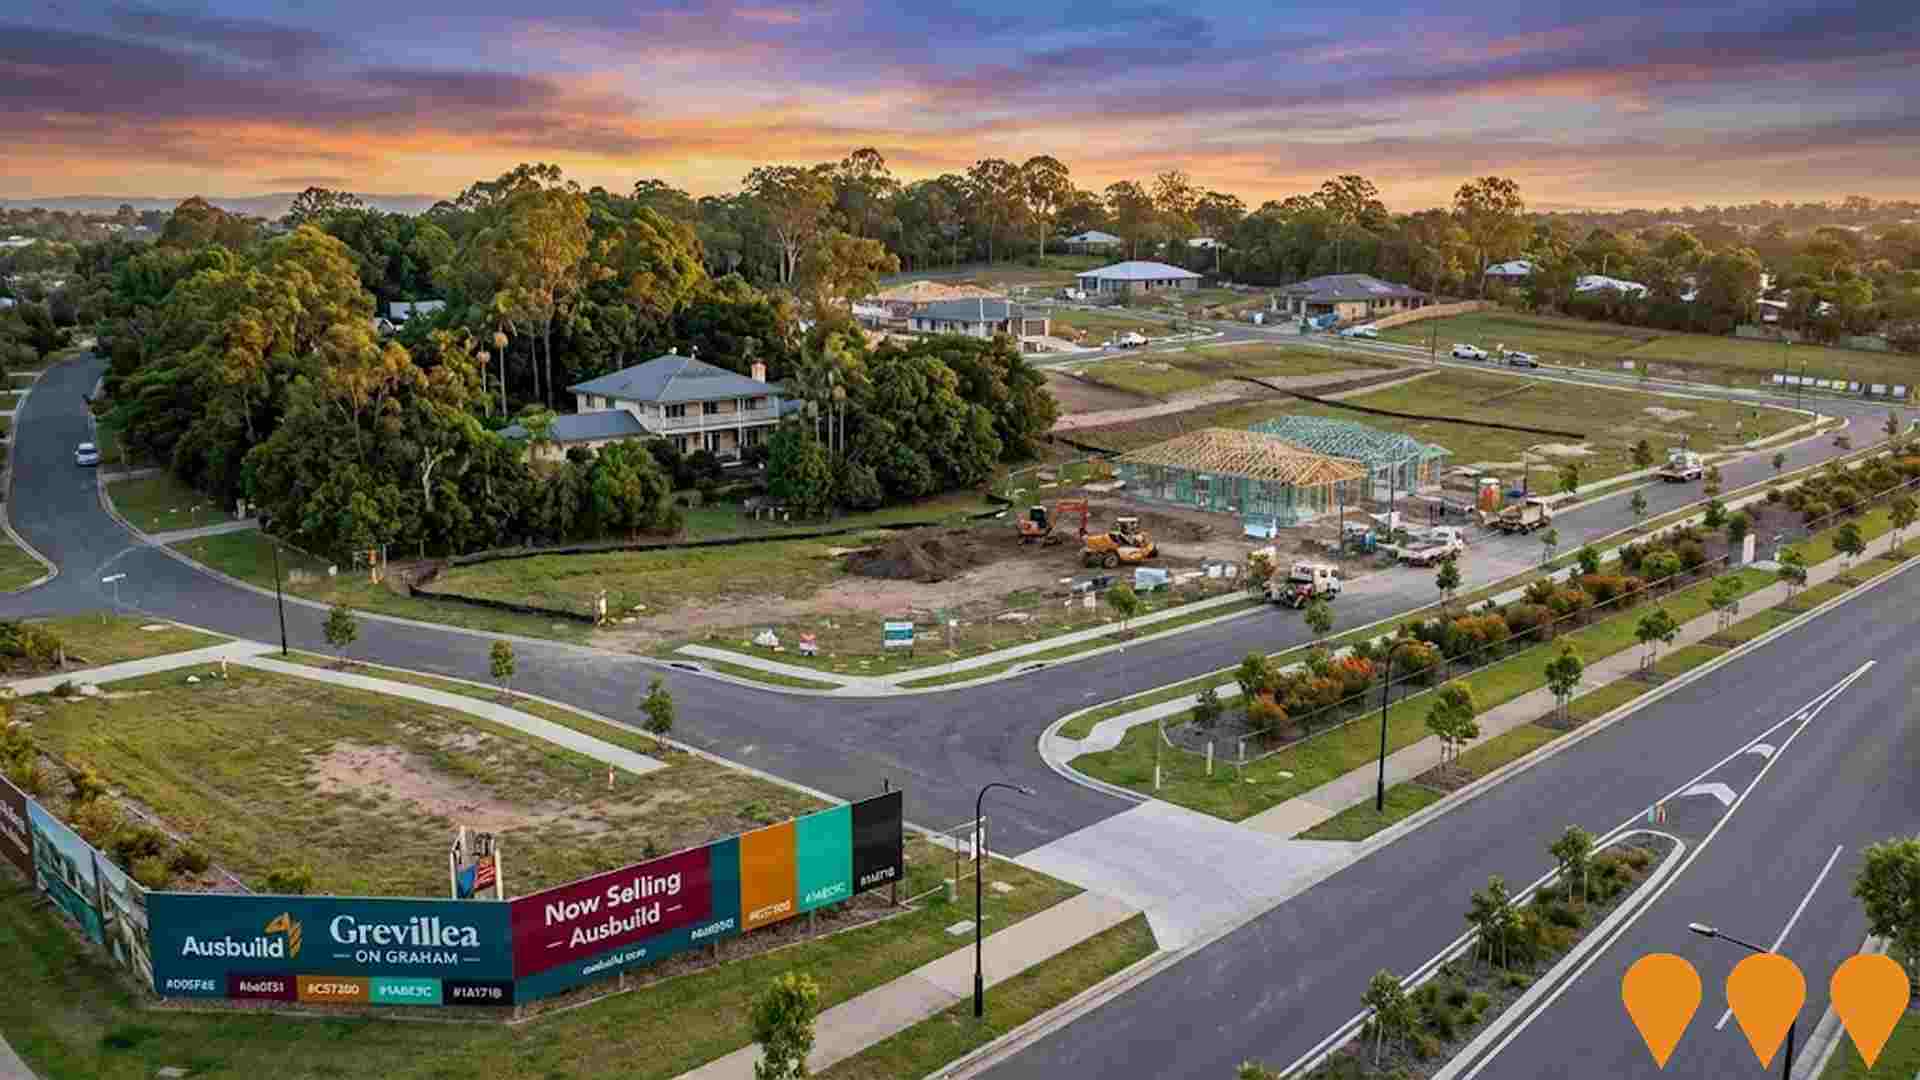
Grevillea on Graham
Boutique estate by Ausbuild with 29 homesites (approx. 500-663 sqm) in a quiet Bridgeman Downs pocket. Active sales with house-and-land packages; local streets and lots delivered in stages. Close to parks, schools and major retail with convenient access to transport.
Employment
AreaSearch analysis of employment trends sees Bridgeman Downs performing better than 90% of local markets assessed across Australia
Bridgeman Downs has a highly educated workforce with professional services well represented. Its unemployment rate was 1.6% in September 2025.
Over the past year, employment grew by an estimated 11.4%. As of that date, 7,110 residents were employed while the unemployment rate was 2.4% lower than Greater Brisbane's rate of 4.0%. Workforce participation was fairly standard at 68.8%, compared to Greater Brisbane's 64.5%. Key industries for employment among residents are health care & social assistance, professional & technical services, and retail trade.
Health care & social assistance has a particularly high share of employment, at 1.2 times the regional level. Manufacturing, however, has limited presence with 4.2% employment compared to 6.4% regionally. The area appears to offer limited local employment opportunities, as indicated by the count of Census working population versus resident population. Between September 2024 and September 2025, employment levels increased by 11.4% and labour force increased by 11.1%, causing a drop in unemployment rate by 0.3 percentage points. In contrast, Greater Brisbane experienced employment growth of 3.8% and labour force growth of 3.3%, with a 0.5 percentage point drop in unemployment rate. State-level data to 25-Nov-25 shows Queensland's employment contracted by 0.01% (losing 1,210 jobs), with the state unemployment rate at 4.2%, broadly in line with the national rate of 4.3%. Jobs and Skills Australia's national employment forecasts from May-25 suggest that national employment should expand by 6.6% over five years and 13.7% over ten years, though growth rates differ significantly between industry sectors. Applying these projections to Bridgeman Downs' employment mix suggests local employment should increase by 7.2% over five years and 14.6% over ten years, assuming constant population projections.
Frequently Asked Questions - Employment
Income
The economic profile demonstrates exceptional strength, placing the area among the top 10% nationally based on comprehensive AreaSearch income analysis
Bridgeman Downs SA2 had a median taxpayer income of $62,501 and an average of $82,027 in financial year 2022, according to postcode level ATO data aggregated by AreaSearch. This was among the highest in Australia, compared to Greater Brisbane's median income of $55,645 and average income of $70,520. As of September 2025, estimated incomes would be approximately $71,245 (median) and $93,503 (average), based on Wage Price Index growth of 13.99% since financial year 2022. Census data shows Bridgeman Downs' household, family, and personal incomes rank highly nationally, between the 85th and 95th percentiles. The $4000+ income bracket dominated with 31.5% of residents (3,808 people), unlike regional trends where 33.3% fall within the $1,500 - 2,999 range. A substantial proportion of high earners (47.6%) above $3,000/week indicated strong economic capacity throughout Bridgeman Downs. After housing costs, residents retained 88.0% of income, reflecting strong purchasing power. The area's SEIFA income ranking placed it in the 9th decile.
Frequently Asked Questions - Income
Housing
Bridgeman Downs is characterized by a predominantly suburban housing profile, with above-average rates of outright home ownership
Bridgeman Downs dwelling structure, as per the latest Census, was 87.9% houses and 12.2% other dwellings (semi-detached, apartments, 'other' dwellings), compared to Brisbane metro's 77.8% houses and 22.1% other dwellings. Home ownership in Bridgeman Downs stood at 39.3%, with mortgaged dwellings at 45.2% and rented ones at 15.5%. The median monthly mortgage repayment was $2,500, higher than Brisbane metro's average of $2,000. Median weekly rent in Bridgeman Downs was $525, compared to Brisbane metro's $430. Nationally, Bridgeman Downs's median monthly mortgage repayments were significantly higher at $2,500 against the Australian average of $1,863, while median weekly rents were substantially above the national figure of $375.
Frequently Asked Questions - Housing
Household Composition
Bridgeman Downs features high concentrations of family households, with a higher-than-average median household size
Family households account for 86.6% of all households, including 48.1% couples with children, 29.2% couples without children, and 8.2% single parent families. Non-family households constitute the remaining 13.4%, with lone person households at 11.8% and group households making up 1.7%. The median household size is 3.0 people, larger than the Greater Brisbane average of 2.7.
Frequently Asked Questions - Households
Local Schools & Education
The educational profile of Bridgeman Downs exceeds national averages, with above-average qualification levels and academic performance metrics
In Bridgeman Downs, the educational attainment is notably higher than broader averages. Among residents aged 15+, 41.4% have university qualifications, compared to 25.7% in Queensland and 30.4% nationally. Bachelor degrees are the most common at 27.3%, followed by postgraduate qualifications (10.7%) and graduate diplomas (3.4%). Vocational credentials are also prevalent with 27.0% of residents holding them, including advanced diplomas (11.0%) and certificates (16.0%).
Educational participation is high, with 30.7% currently enrolled in formal education. This includes 9.5% in primary, 9.2% in secondary, and 7.2% in tertiary education.
Frequently Asked Questions - Education
Schools Detail
Nearby Services & Amenities
Transport
Transport servicing is moderate compared to other areas nationally based on assessment of service frequency, route connectivity and accessibility
Bridgeman Downs has 18 active public transport stops, all of which are bus stops. These stops are served by 7 different routes that together facilitate 1,163 weekly passenger trips. The area's transport accessibility is considered good, with residents on average being located 375 meters from the nearest stop.
Across all routes, there is an average of 166 trips per day, which translates to approximately 64 weekly trips per individual stop.
Frequently Asked Questions - Transport
Transport Stops Detail
Health
Bridgeman Downs's residents are extremely healthy with both young and old age cohorts seeing low prevalence of common health conditions
Analysis of health metrics shows strong performance throughout Bridgeman Downs. Both young and old age cohorts have a low prevalence of common health conditions. The rate of private health cover is exceptionally high at approximately 61% of the total population (7351 people), compared to 56.2% across Greater Brisbane, which is higher than the national average of 55.3%.
The most common medical conditions in the area are asthma and arthritis, impacting 6.7% and 6.2% of residents respectively. A total of 74.1% of residents declare themselves completely clear of medical ailments, compared to 70.5% across Greater Brisbane. The area has 17.6% of residents aged 65 and over (2131 people), which is higher than the 16.6% in Greater Brisbane. Health outcomes among seniors are particularly strong, broadly in line with the general population's health profile.
Frequently Asked Questions - Health
Cultural Diversity
Bridgeman Downs was found to be more culturally diverse than the vast majority of local markets in Australia, upon assessment of a range of language and cultural background related metrics
Bridgeman Downs had a higher cultural diversity than most local markets, with 25.9% of its population speaking languages other than English at home and 33.6% born overseas. Christianity was the predominant religion in Bridgeman Downs, accounting for 58.6% of the population. However, Hinduism stood out as it comprised 7.3%, compared to the regional average of 4.5%.
The top three ancestry groups were English at 24.0%, Australian at 20.1%, and Other at 10.2%. Notably, Indian (6.9% vs 4.3%), South African (1.1% vs 0.7%), and Italian (4.3% vs 3.8%) ethnic groups were overrepresented compared to the Greater Brisbane region.
Frequently Asked Questions - Diversity
Age
Bridgeman Downs's population is slightly older than the national pattern
The median age in Bridgeman Downs is 40 years, which is higher than Greater Brisbane's average of 36 years and slightly exceeds the national average of 38 years. Compared to Greater Brisbane, the cohort aged 5-14 is over-represented at 14.7% locally, while those aged 25-34 are under-represented at 7.4%. Post-2021 Census data shows that the 35 to 44 age group has increased from 14.1% to 15.5% of the population, while the 25 to 34 cohort has decreased from 9.8% to 7.4%. Population forecasts for 2041 indicate significant demographic changes in Bridgeman Downs. The 45 to 54 age group is projected to grow by 44%, reaching 2,420 people from the current 1,685. Conversely, both the 0 to 4 and 25 to 34 age groups are expected to decrease in number.
