Chart Color Schemes
This analysis uses ABS Statistical Areas Level 2 (SA2) boundaries, which can materially differ from Suburbs and Localities (SAL) even when sharing similar names.
SA2 boundaries are defined by the Australian Bureau of Statistics and are designed to represent communities for statistical reporting (e.g., census and ERP).
Suburbs and Localities (SAL) represent commonly-used suburb/locality names (postal-style areas) and may use different geographic boundaries. For comprehensive analysis, consider reviewing both boundary types if available.
est. as @ -- *
ABS ERP | -- people | --
2021 Census | -- people
Sales Activity
Curious about local property values? Filter the chart to assess the volume and appreciation (including resales) trends and regional comparisons, or scroll to the map below view this information at an individual property level.
Find a Recent Sale
Sales Detail
Population
Everton Park lies within the top quartile of areas nationally for population growth performance according to AreaSearch analysis of recent, and medium to long-term trends
Everton Park's population was approximately 11,170 as of November 2025. This figure represents an increase of 1,126 people, a rise of 11.2% since the 2021 Census which reported a population of 10,044. The change is inferred from ABS's estimated resident population of 10,998 in June 2024 and an additional 222 validated new addresses since the Census date. This results in a population density ratio of 2,678 persons per square kilometer, placing Everton Park in the upper quartile relative to national locations assessed by AreaSearch. Everton Park's growth rate exceeded both the SA4 region (8.6%) and the national average, marking it as a growth leader in the region. Overseas migration contributed approximately 47.0% of overall population gains during recent periods, although all drivers including natural growth and interstate migration were positive factors.
AreaSearch adopts ABS/Geoscience Australia projections for each SA2 area, released in 2024 with 2022 as the base year. For areas not covered by this data and years post-2032, Queensland State Government's SA2 area projections are adopted, released in 2023 based on 2021 data. However, these state projections do not provide age category splits, so AreaSearch applies proportional growth weightings in line with ABS Greater Capital Region projections for each age cohort, released in 2023 based on 2022 data. Based on demographic trends and the latest annual ERP population numbers, Everton Park is projected to grow by 2,417 persons to 2041, reflecting an increase of 20.1% over the 17 years.
Frequently Asked Questions - Population
Development
AreaSearch assessment of residential development activity positions Everton Park among the top 25% of areas assessed nationwide
Everton Park has recorded approximately 64 residential properties granted approval annually over the past five financial years, totalling 323 homes. As of FY-26, 61 approvals have been recorded. On average, 3.4 people have moved to the area each year for each dwelling built between FY-21 and FY-25. Demand significantly outpaces supply, which typically influences prices upwards and intensifies competition among buyers.
New homes are constructed at an average value of $343,000. In FY-26, $42.1 million in commercial approvals have been registered, indicating high local commercial activity. Everton Park maintains similar construction rates per person compared to Greater Brisbane, preserving market equilibrium with surrounding areas. Building activity comprises 41.0% standalone homes and 59.0% townhouses or apartments. This shift towards higher-density living creates more affordable entry points, appealing to downsizers, investors, and first-home buyers.
It reflects reduced development site availability and addresses evolving lifestyle demands and affordability requirements. Currently, 61.0% of housing is composed of houses. Everton Park is projected to grow by 2,245 residents by 2041. Development keeps pace with projected growth, but increasing population may intensify competition among buyers.
Frequently Asked Questions - Development
Infrastructure
Everton Park has strong levels of nearby infrastructure activity, ranking in the top 40% nationally
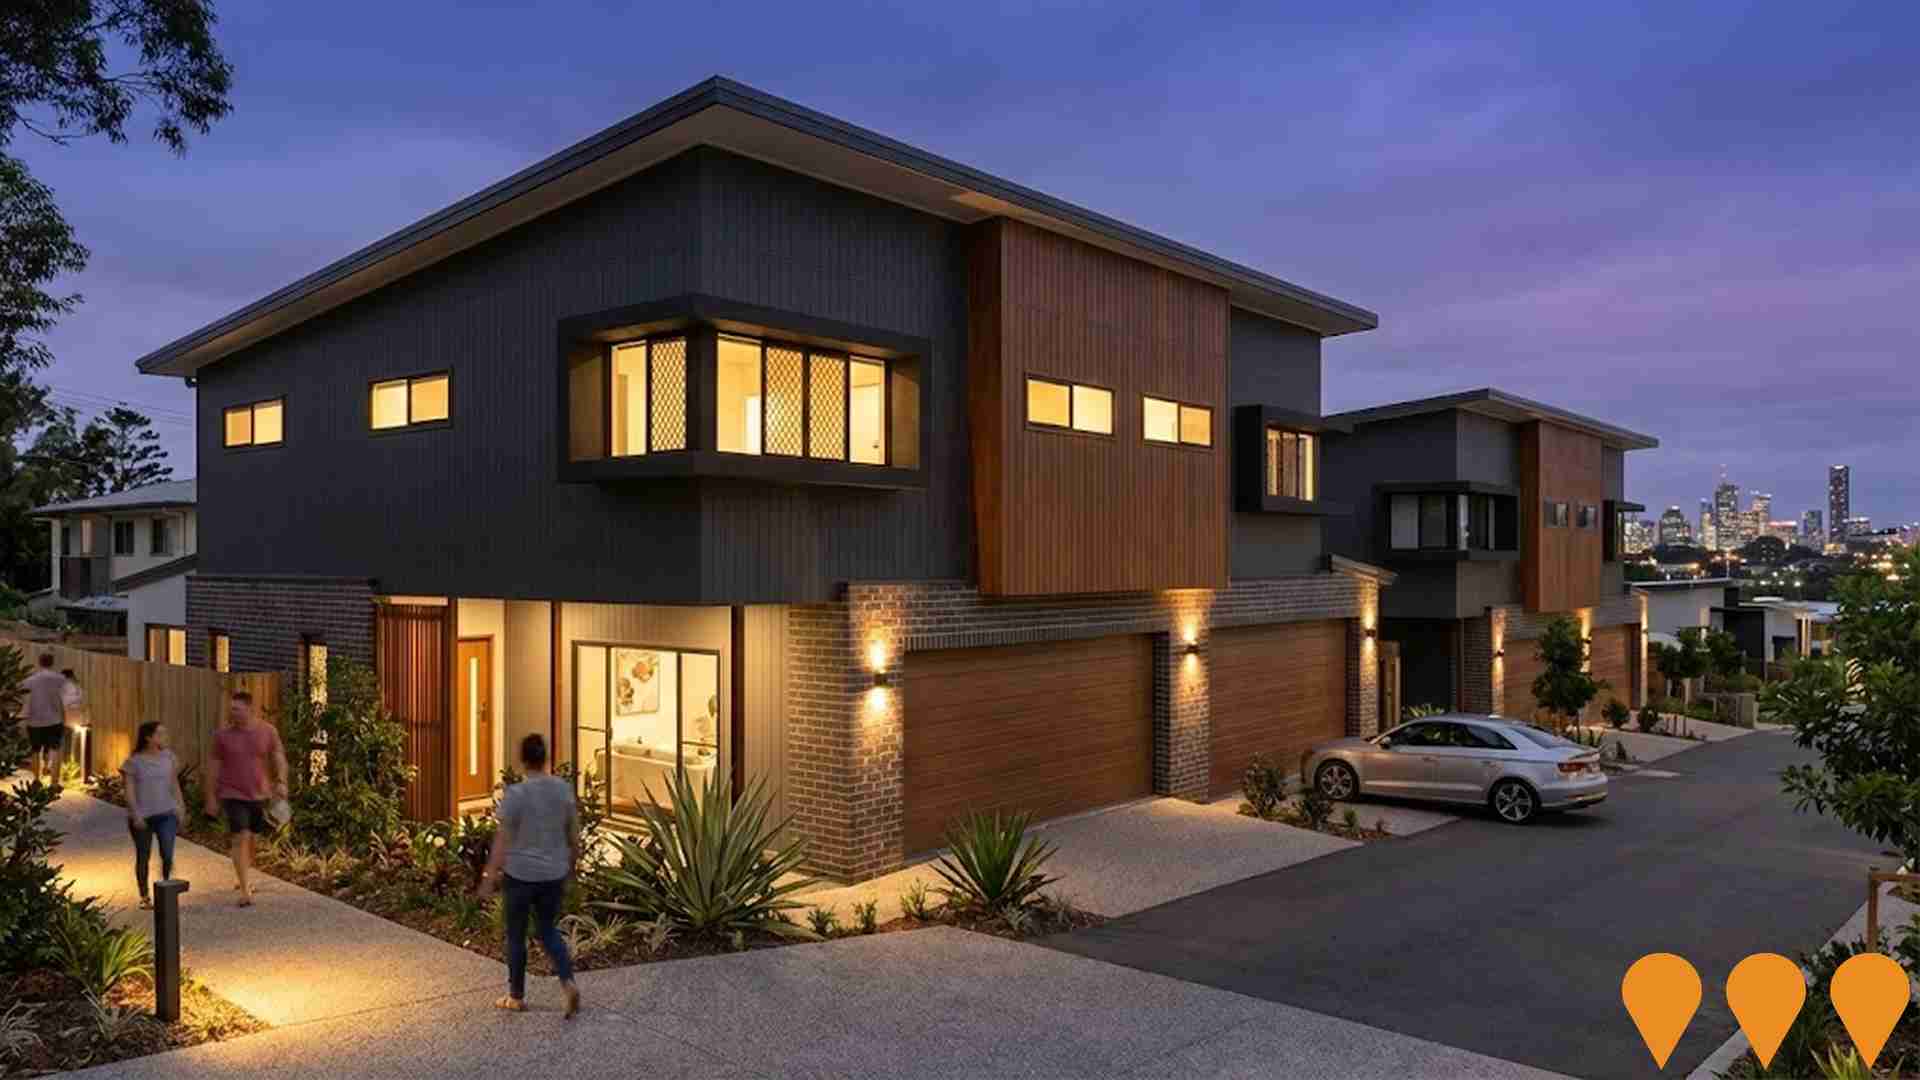
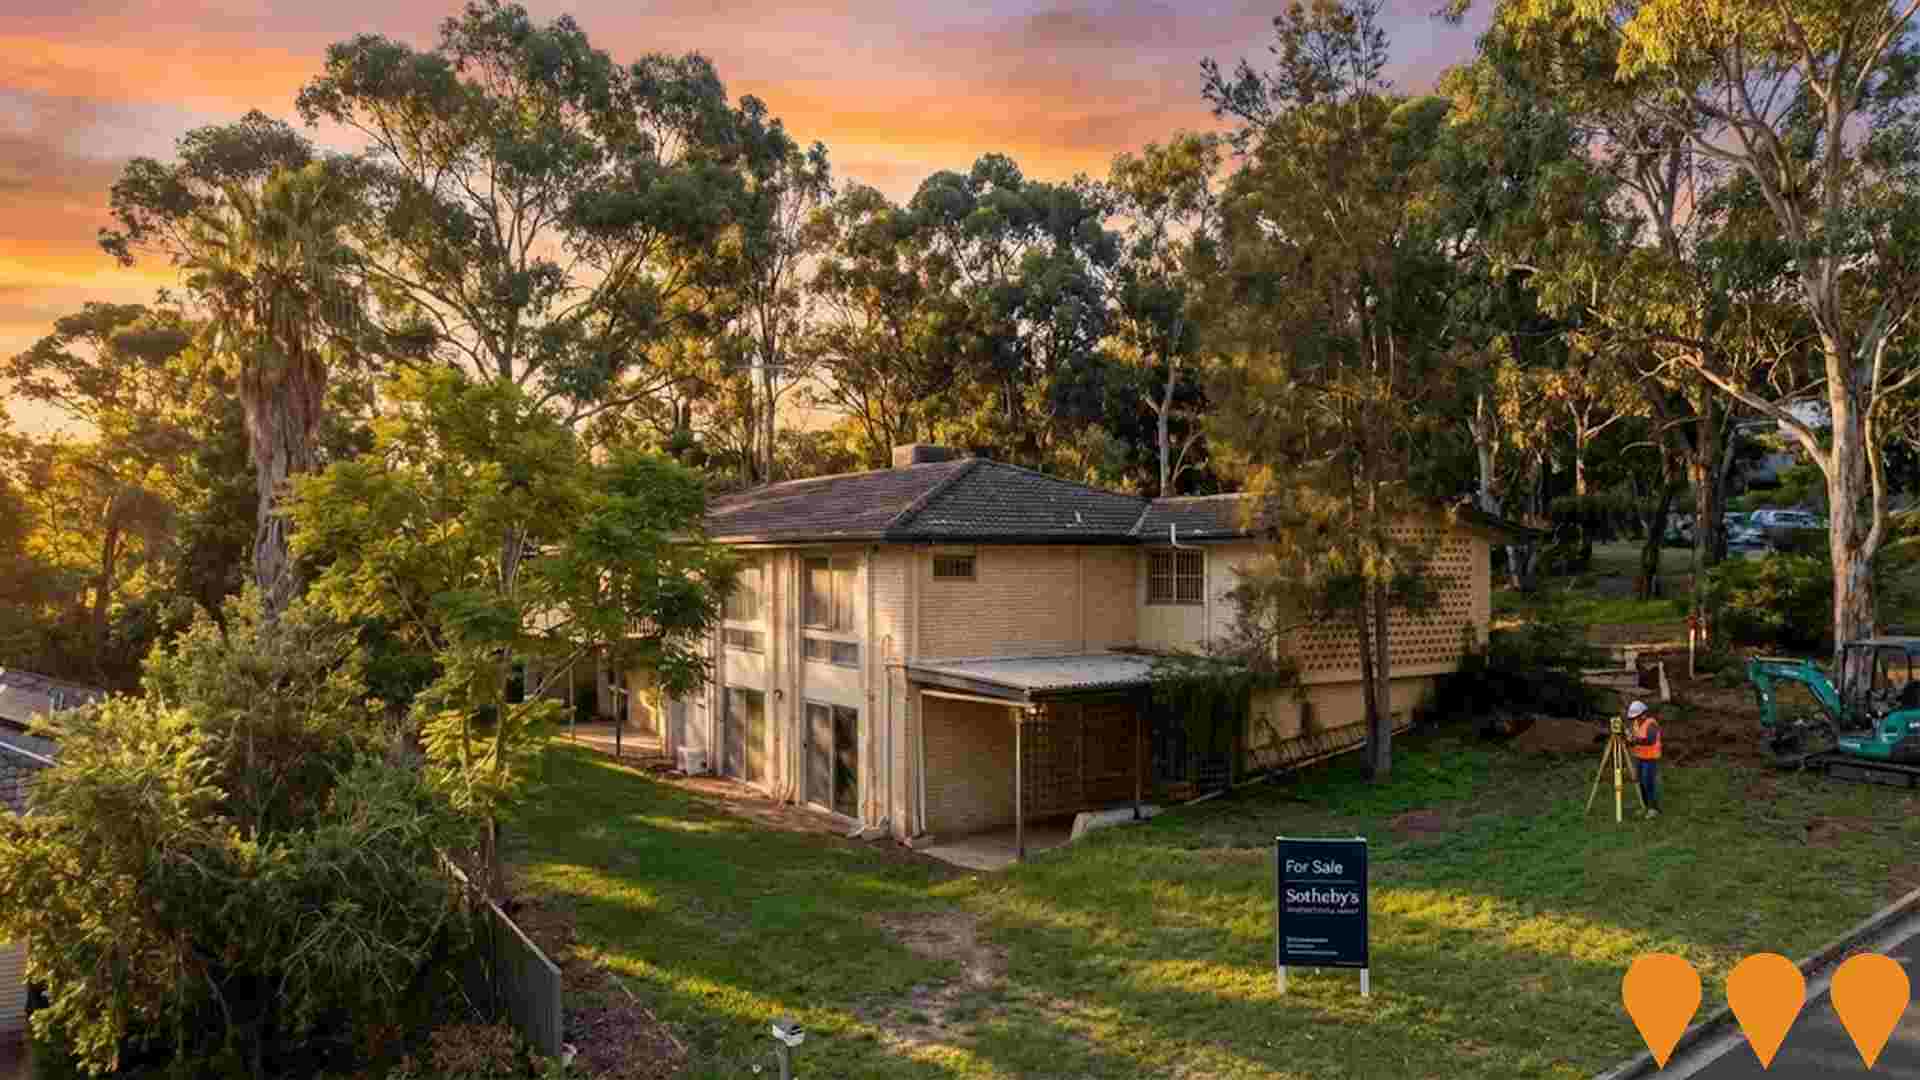
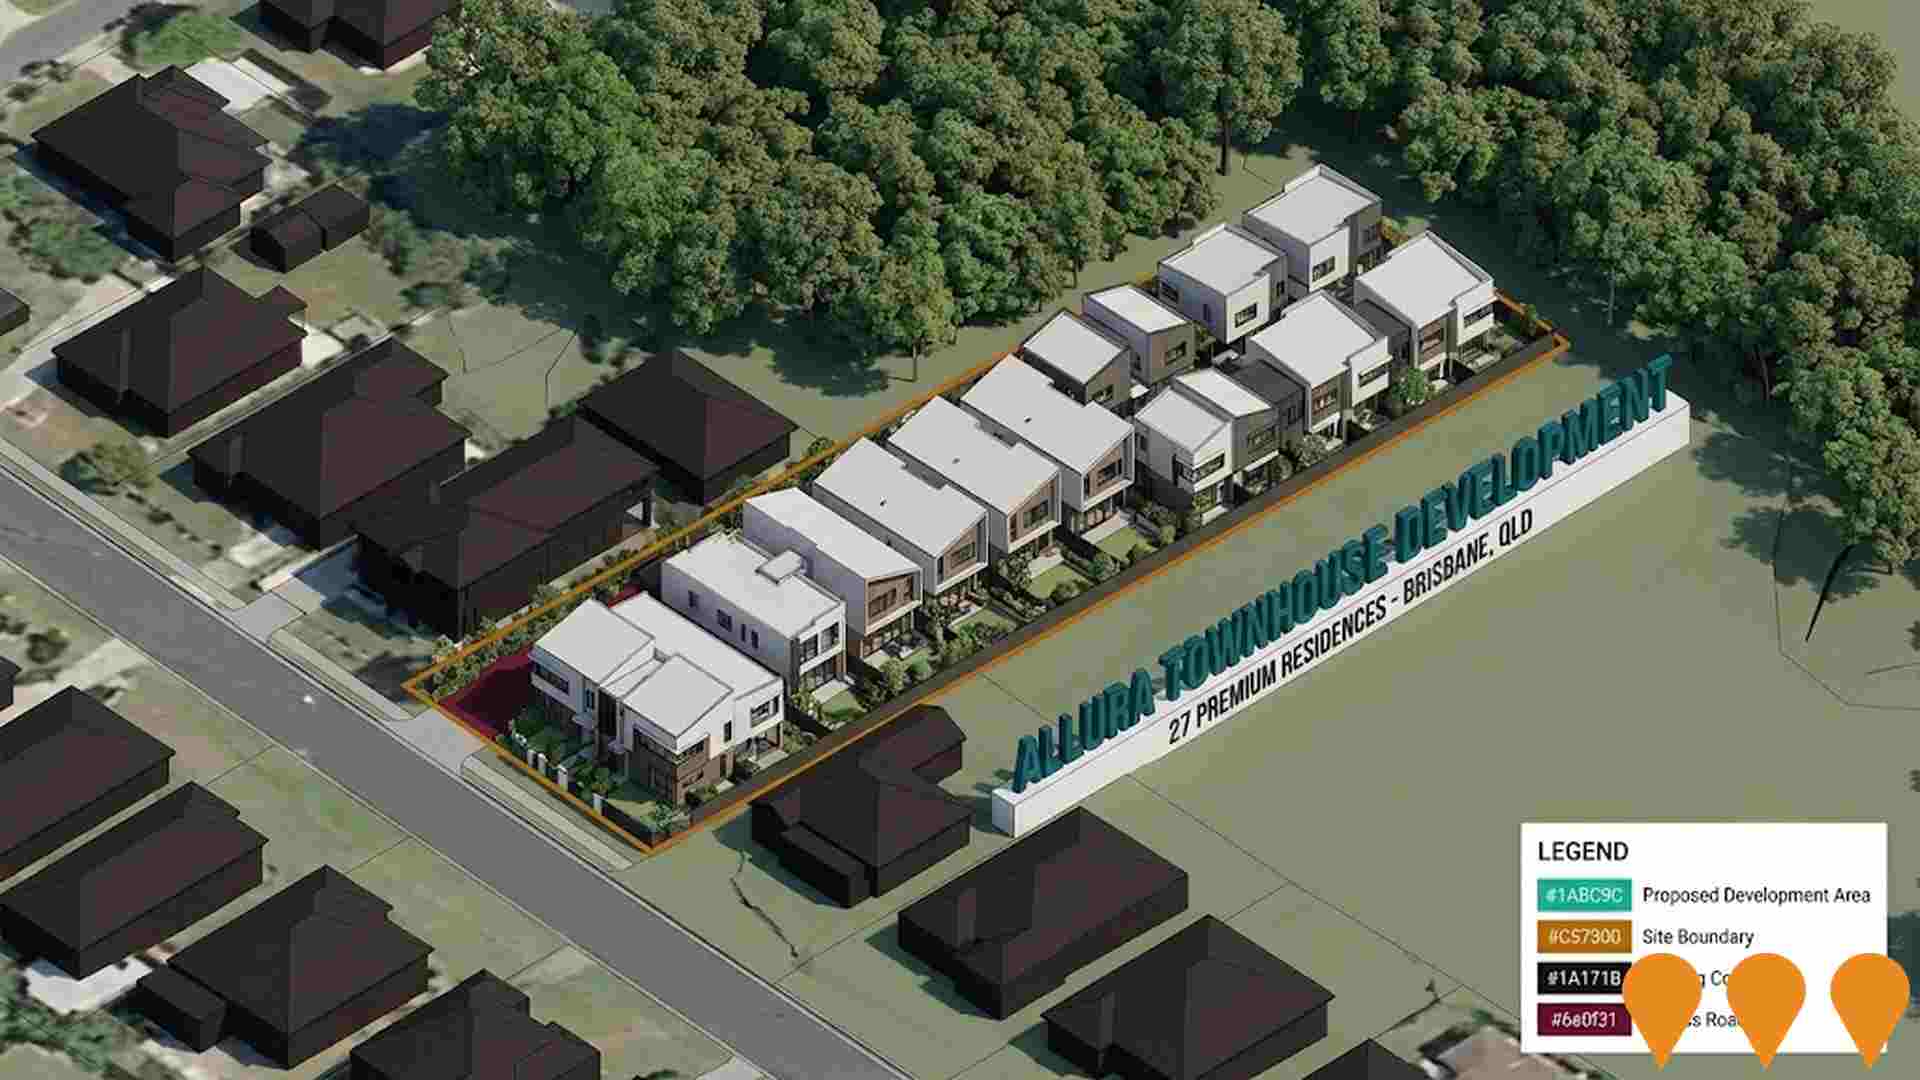
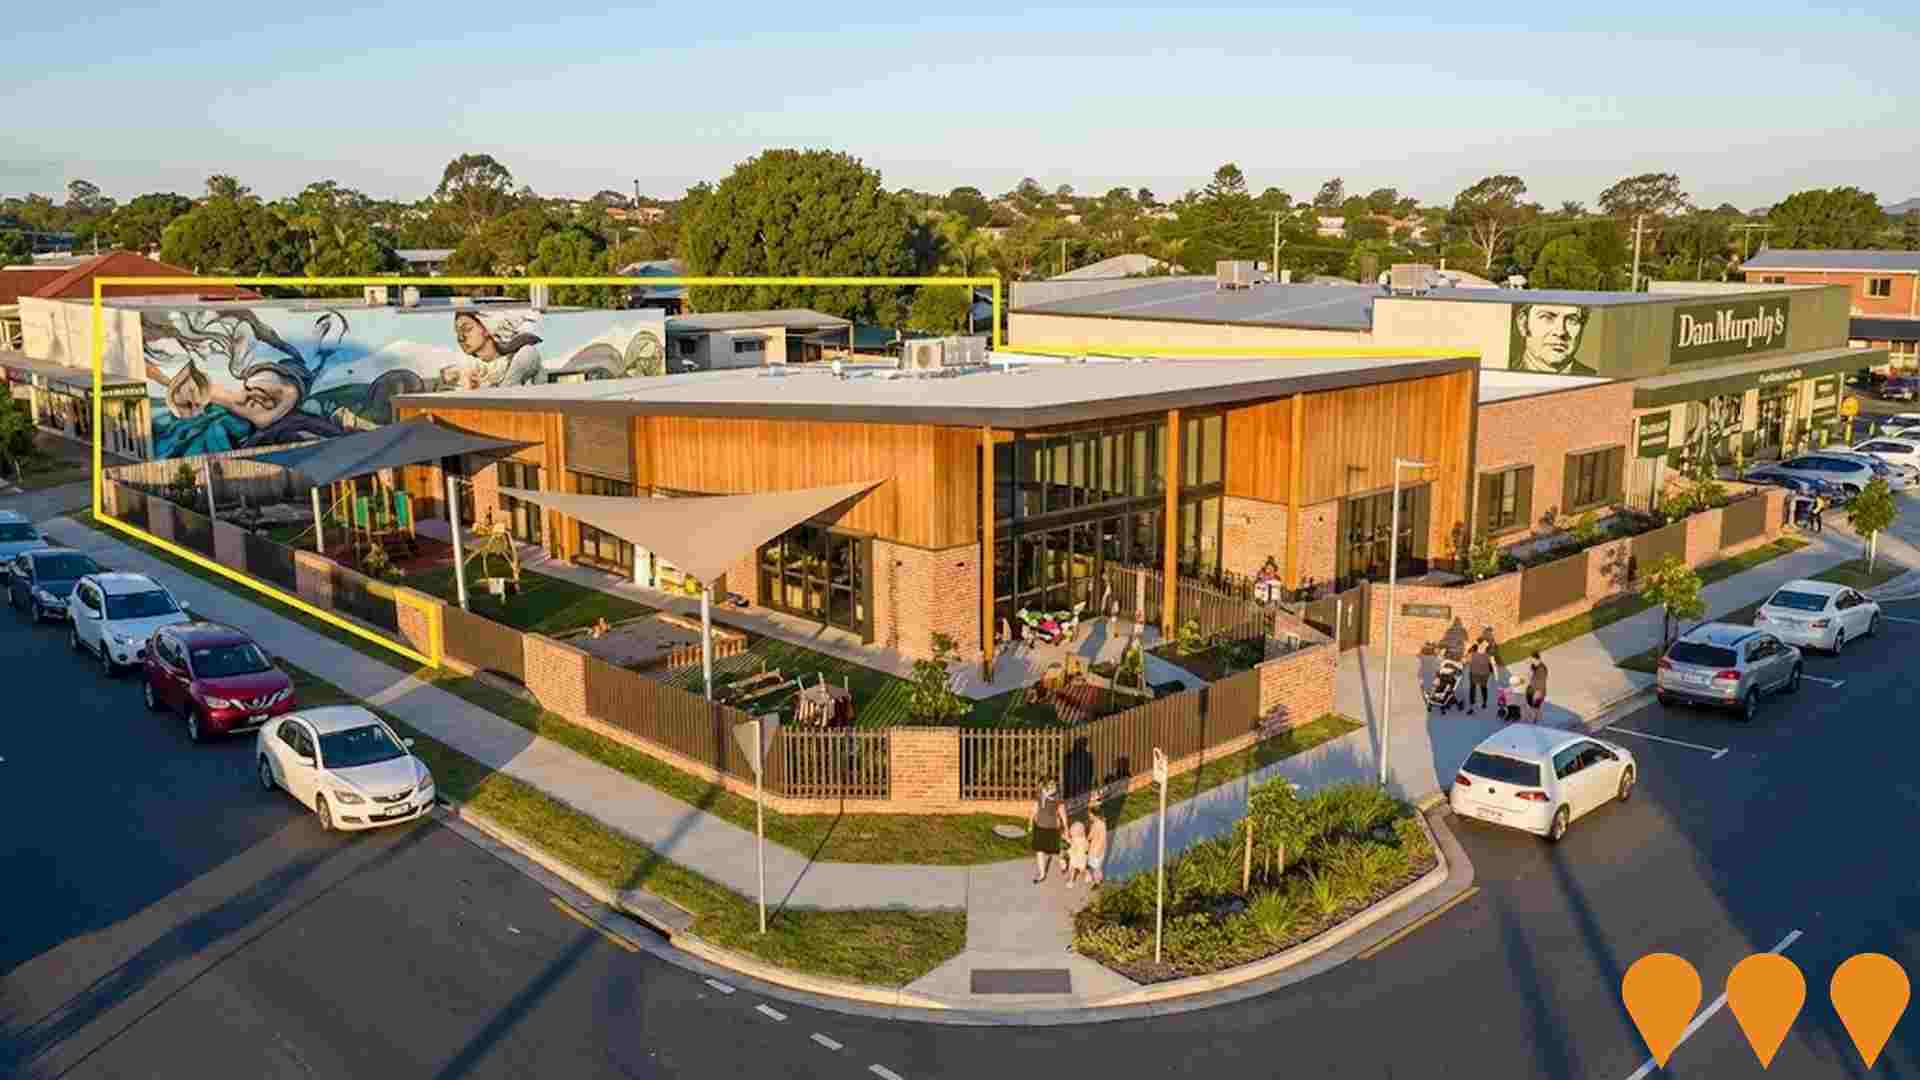
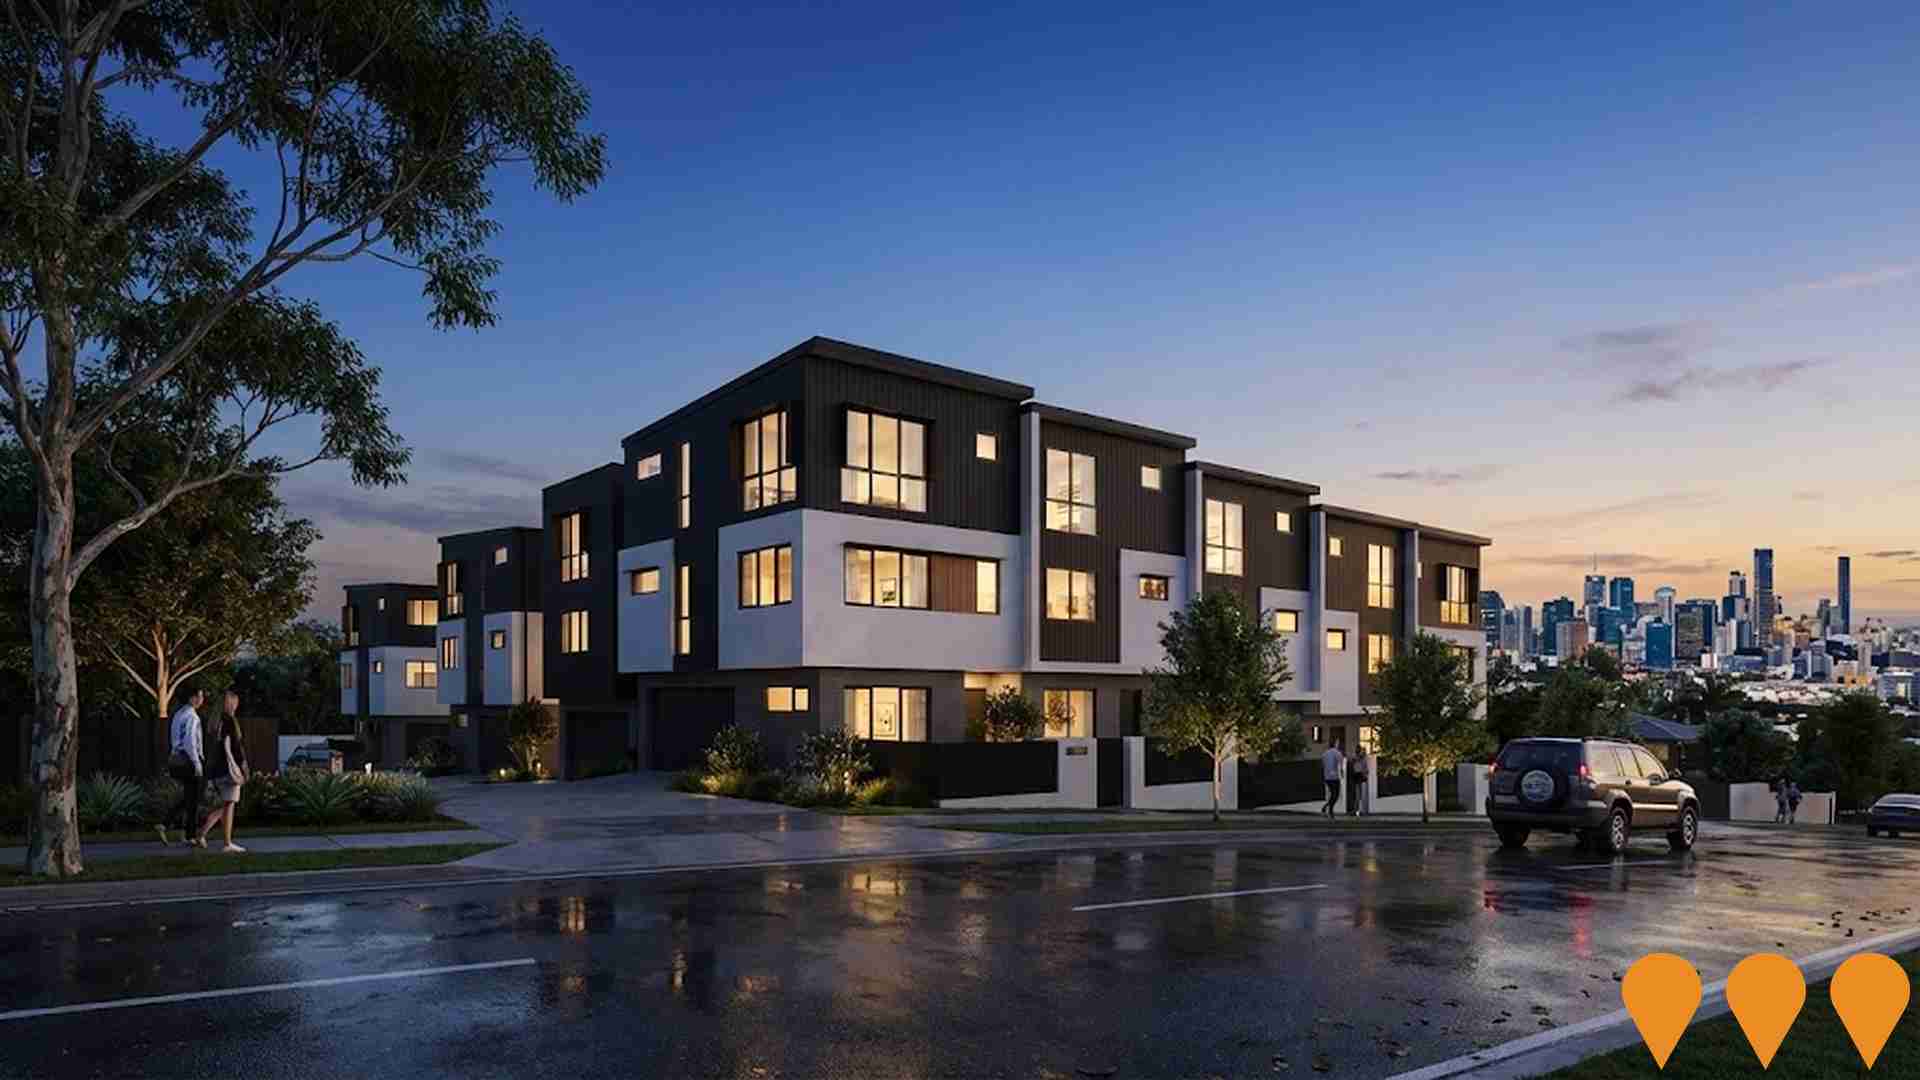
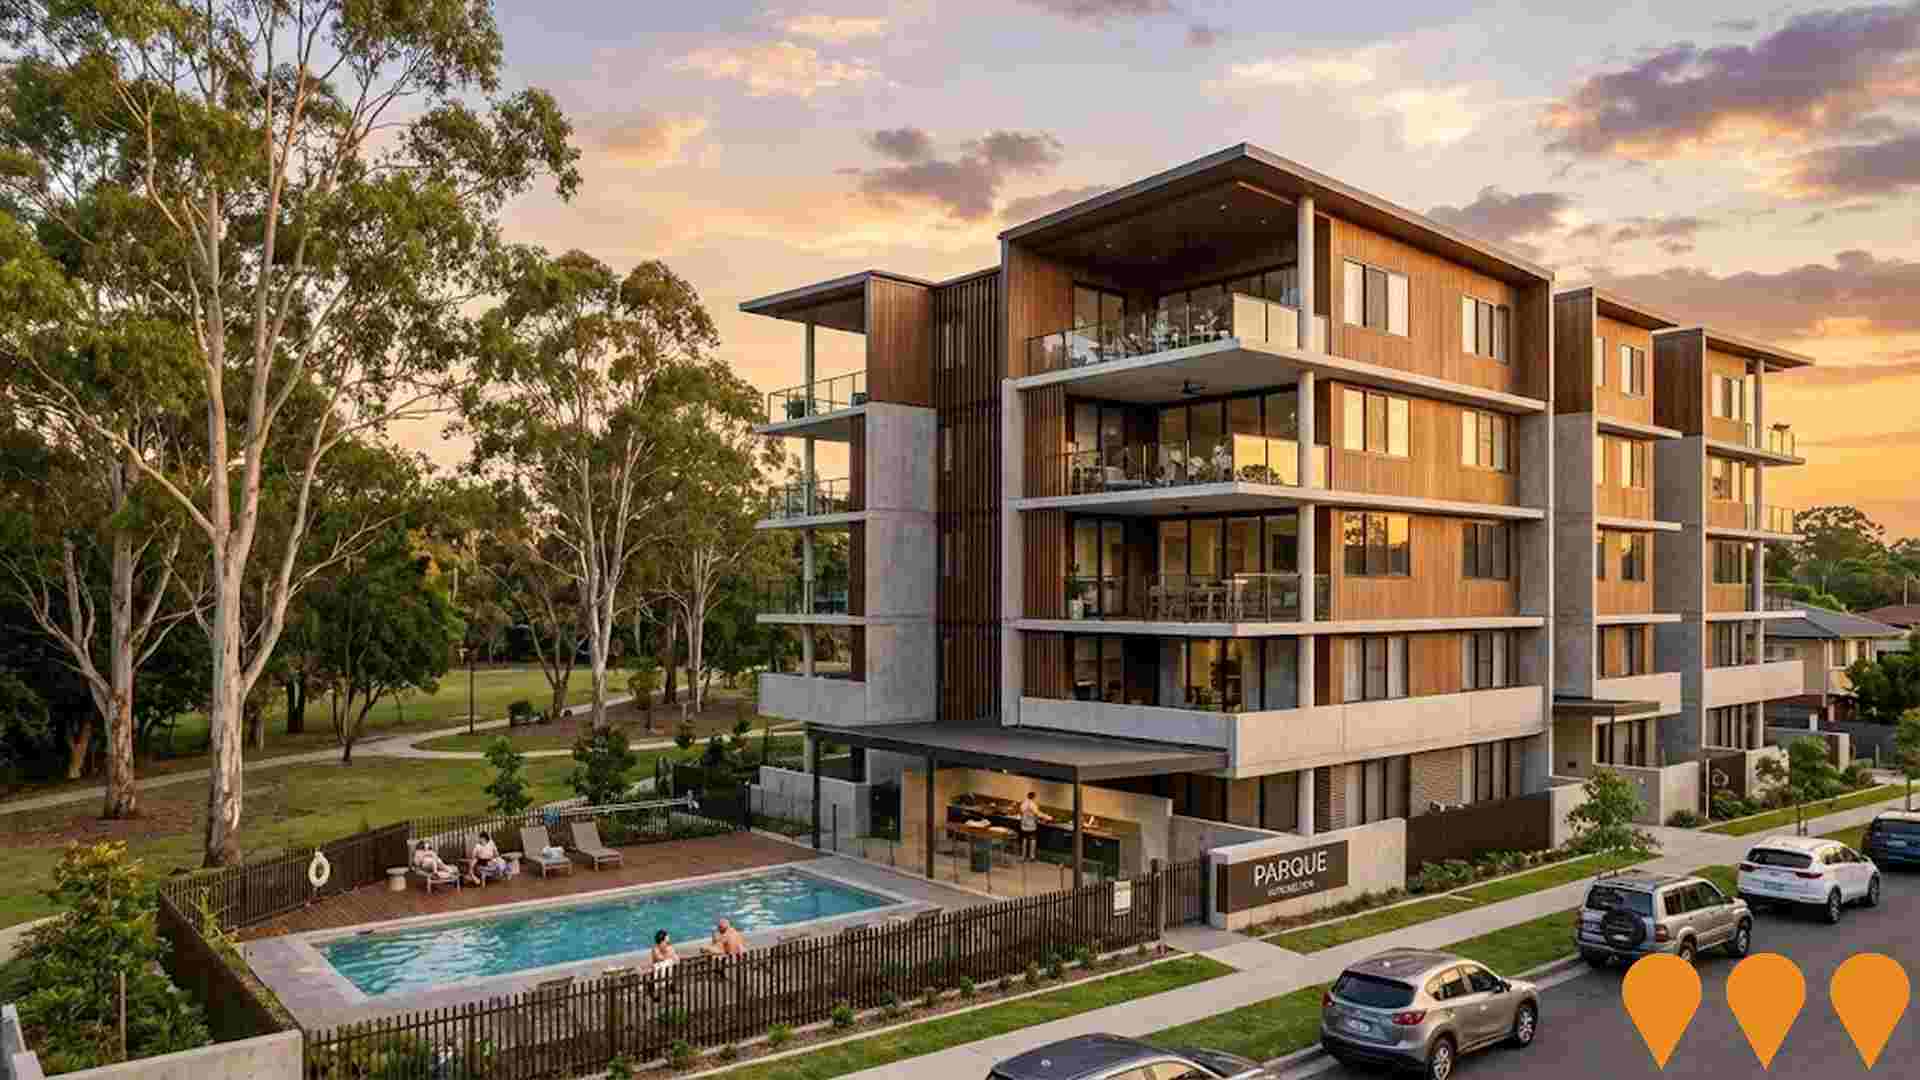
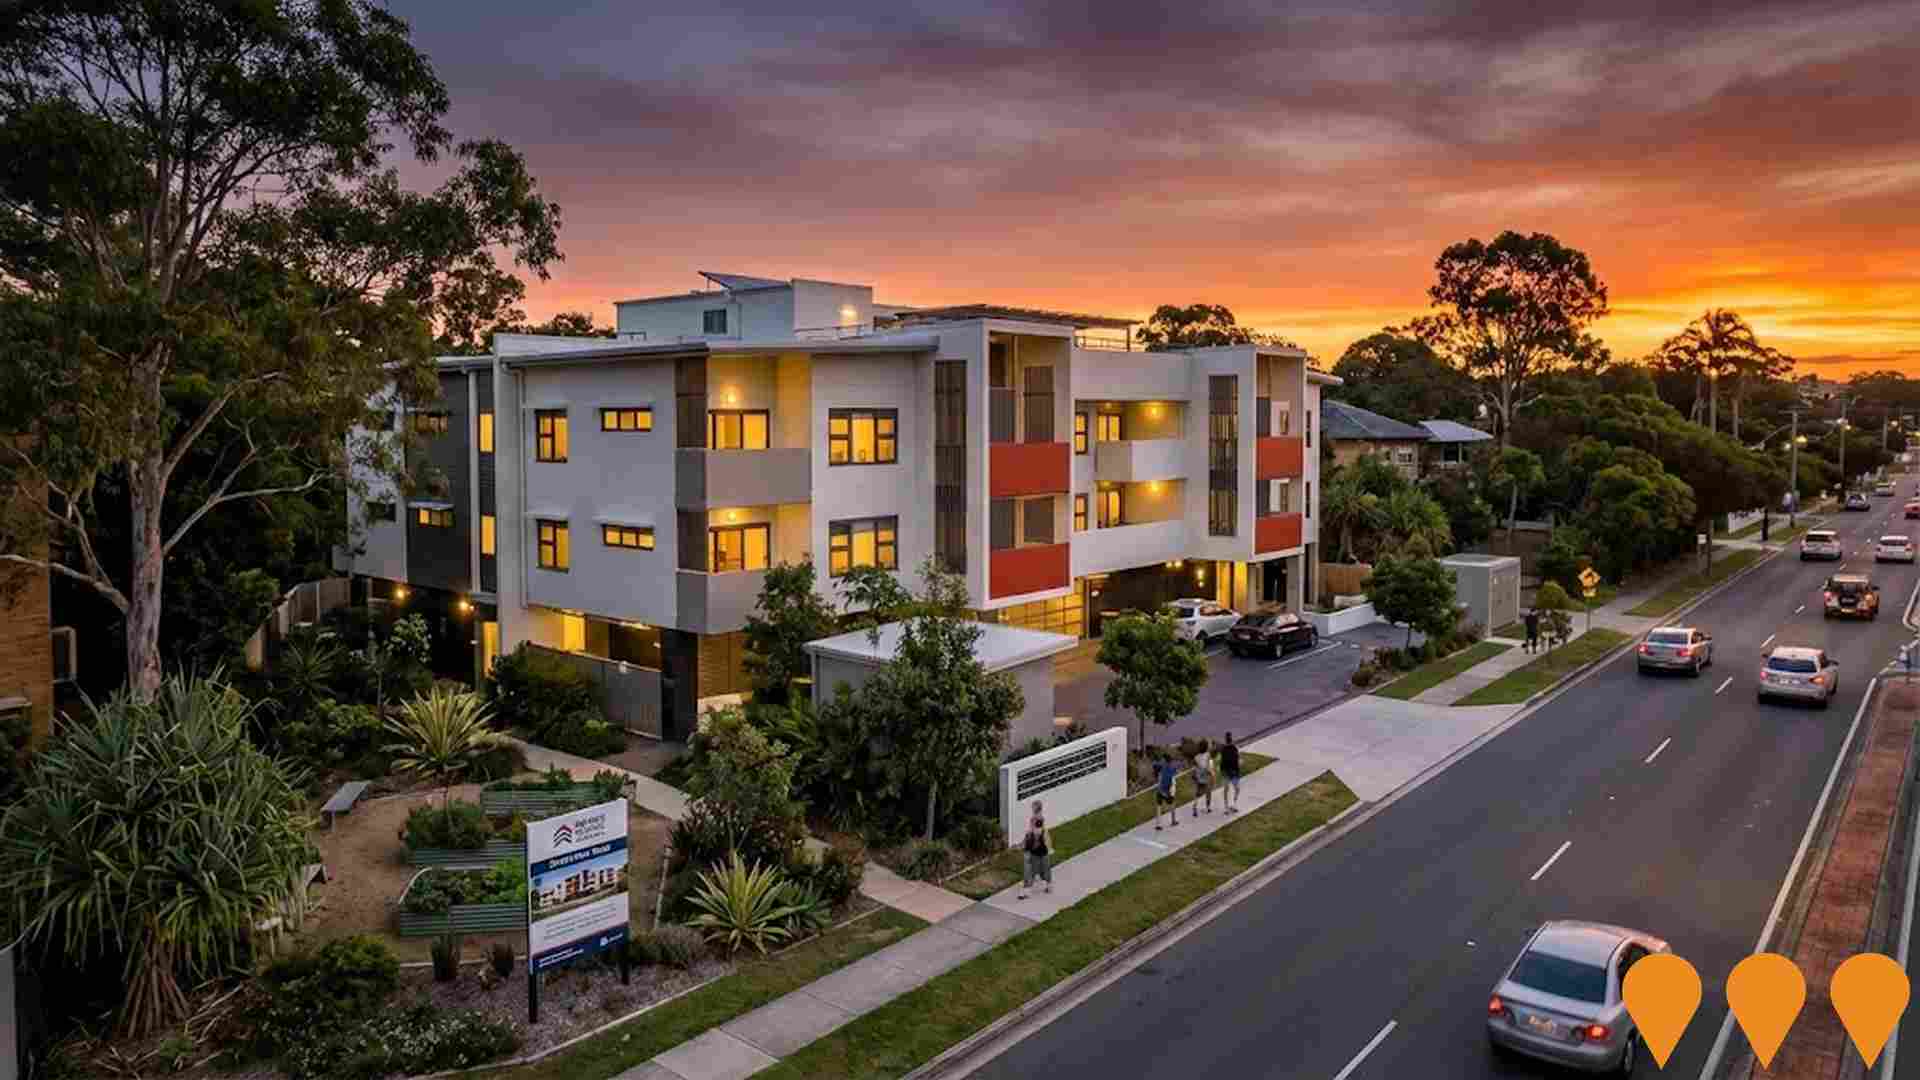
Changes to local infrastructure significantly influence an area's performance. AreaSearch has identified 29 projects likely impacting the area. Notable projects include Everton Park Urban Village, MONARC Mixed-Use Precinct, Ashmore Residences, and Flockton Street Development Site. The following list details those most relevant.
Professional plan users can use the search below to filter and access additional projects.
INFRASTRUCTURE SEARCH
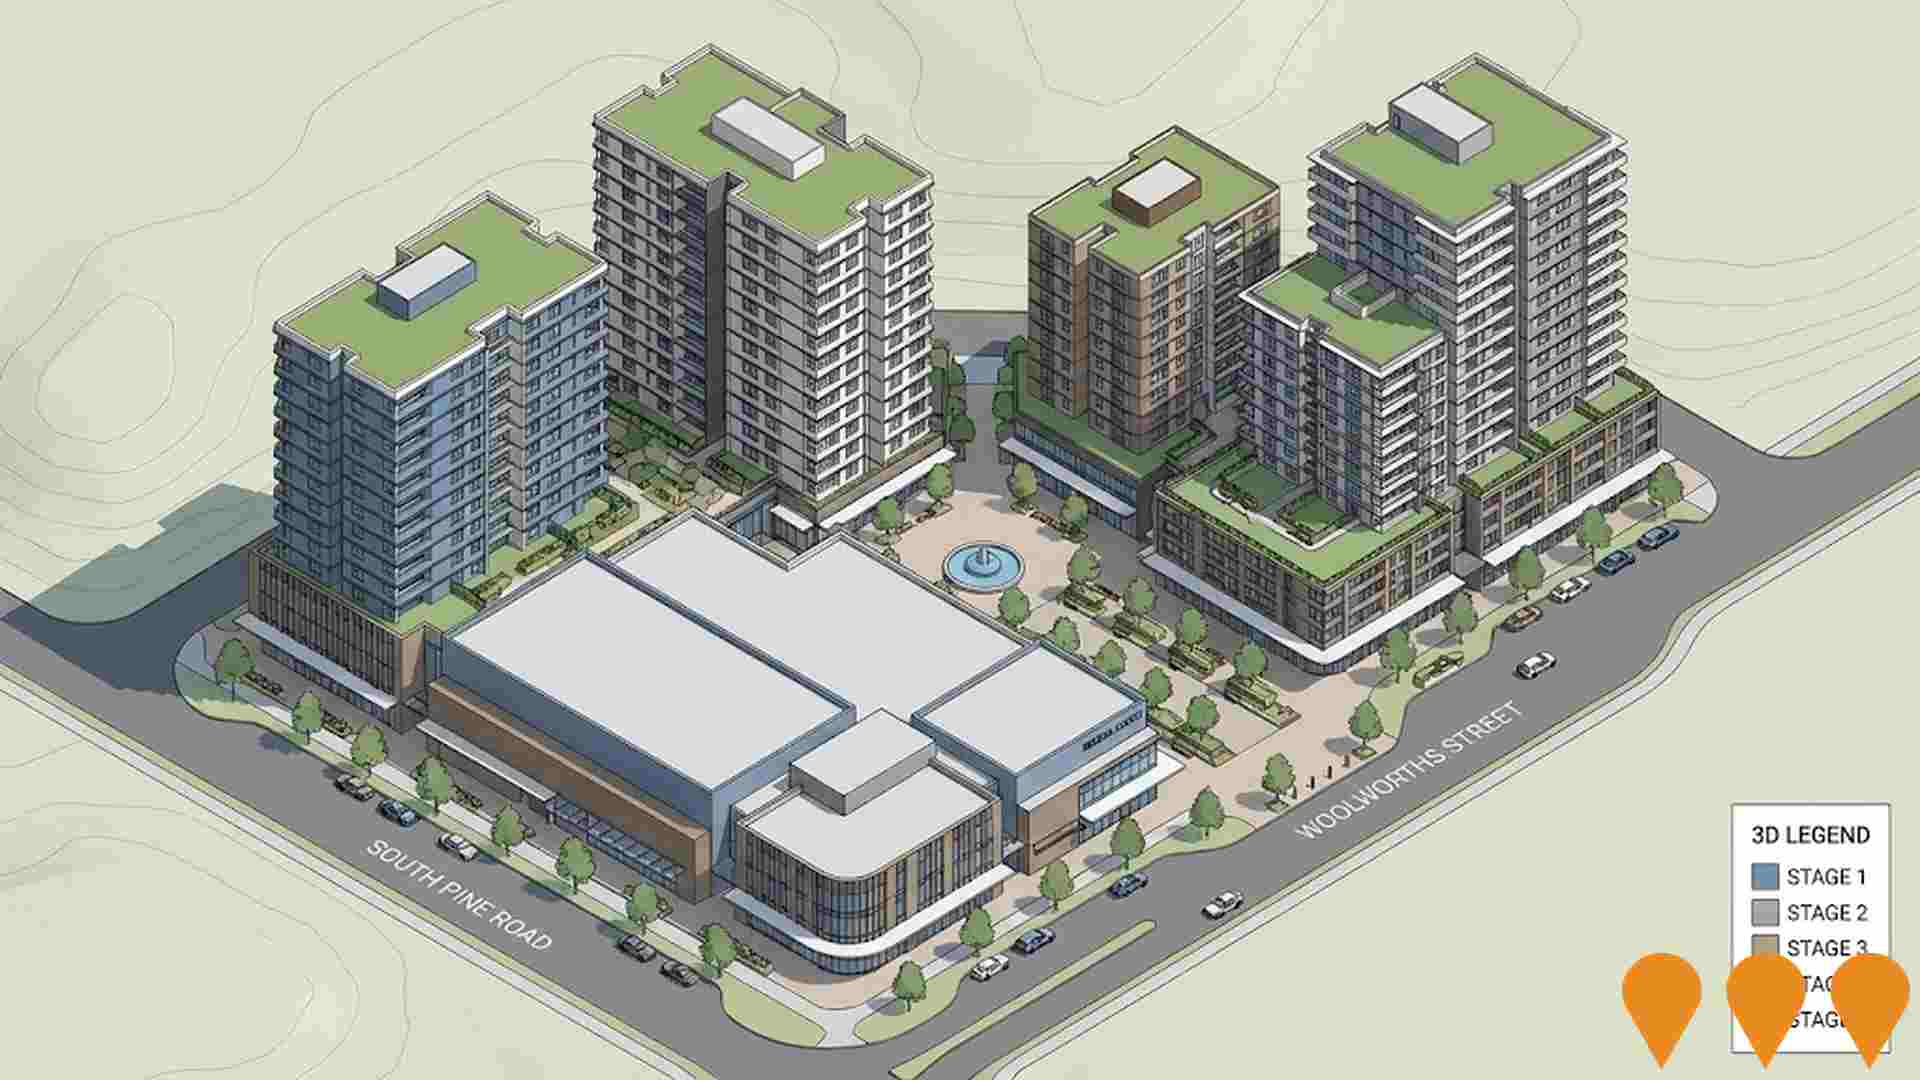
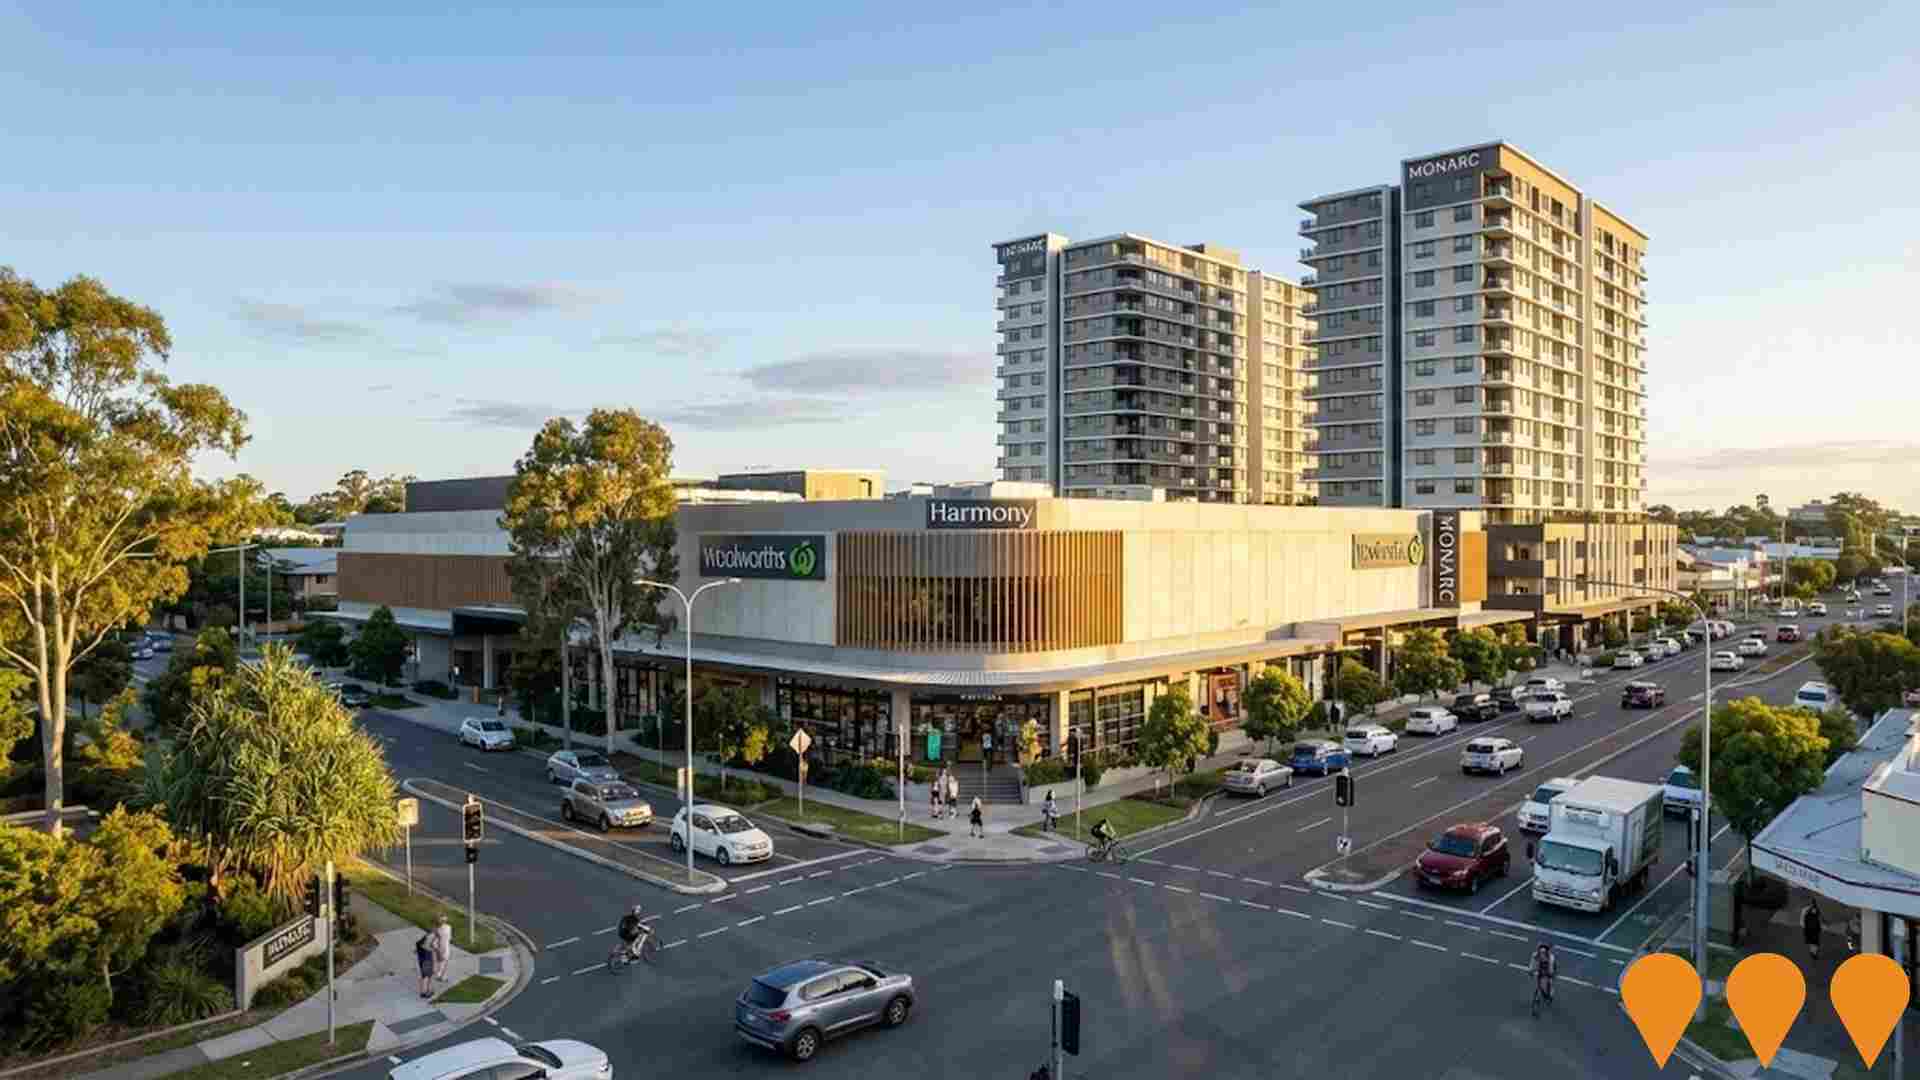
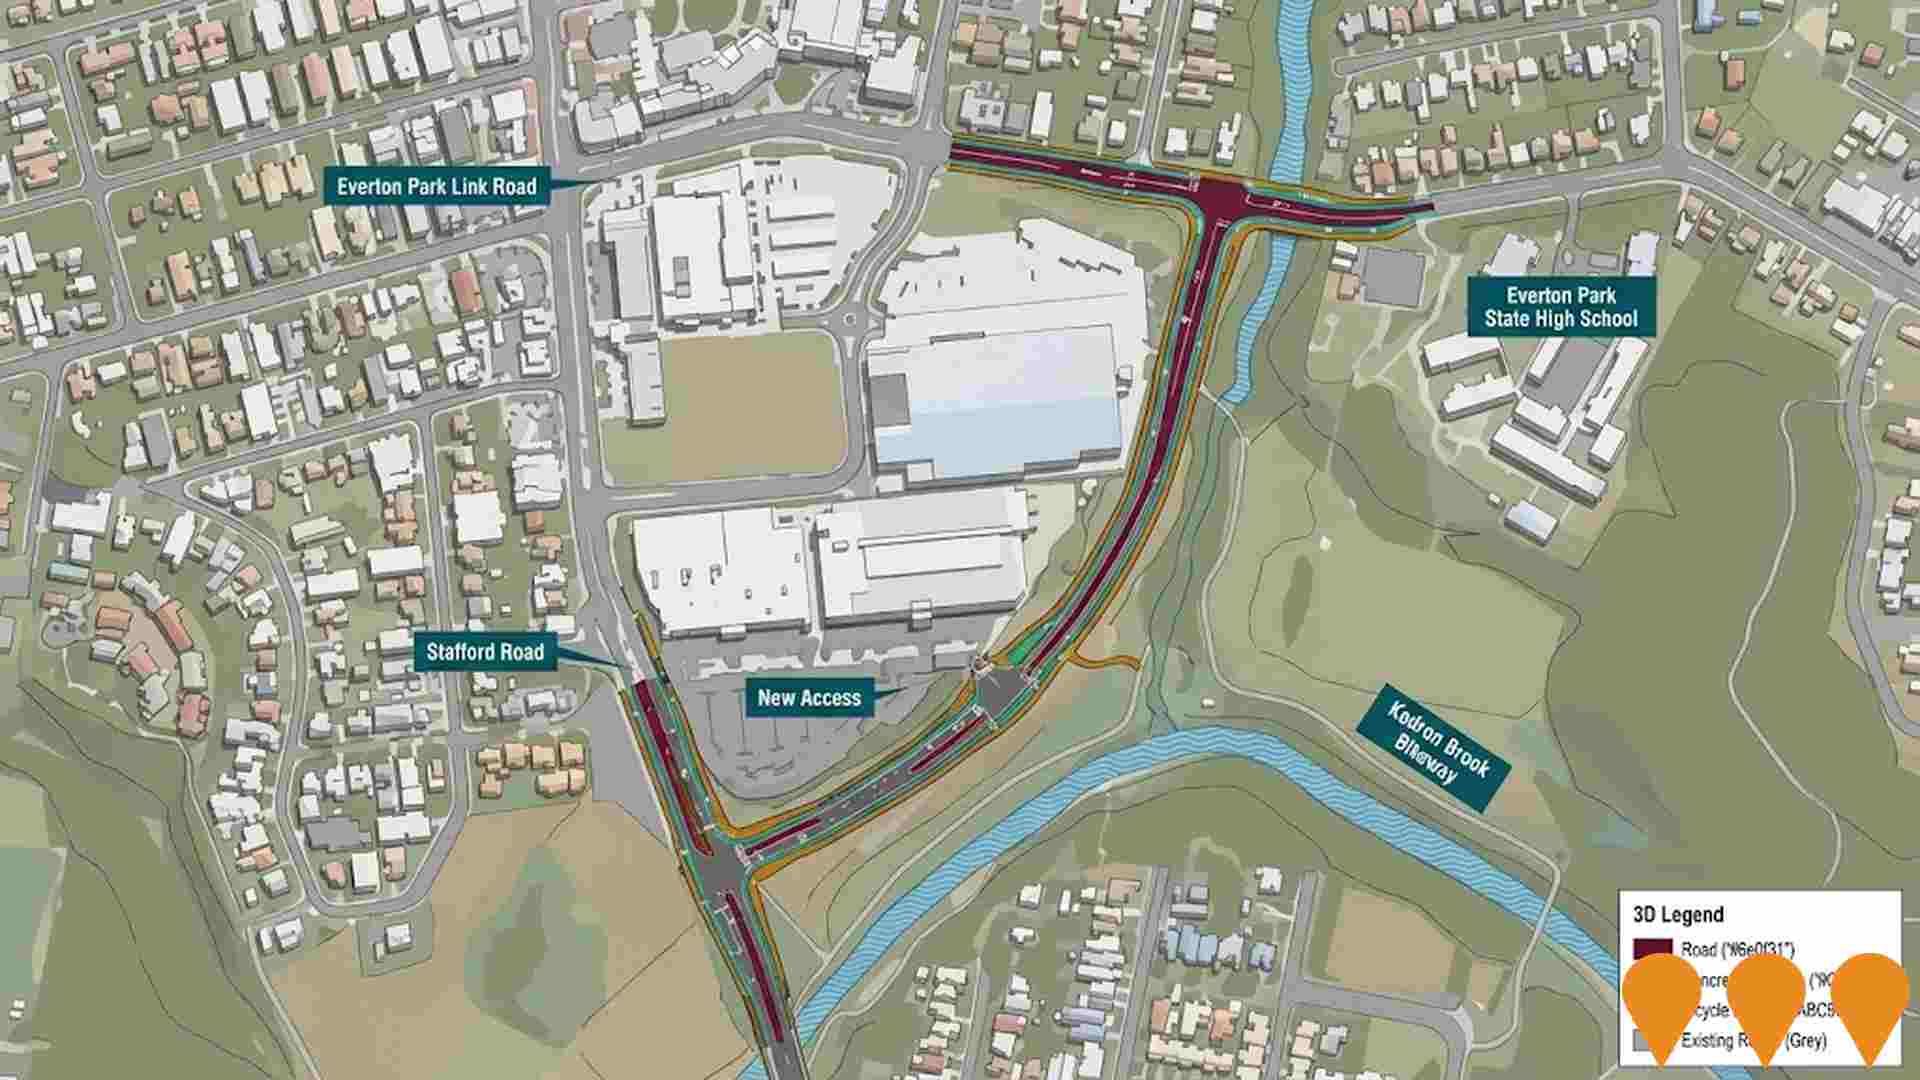
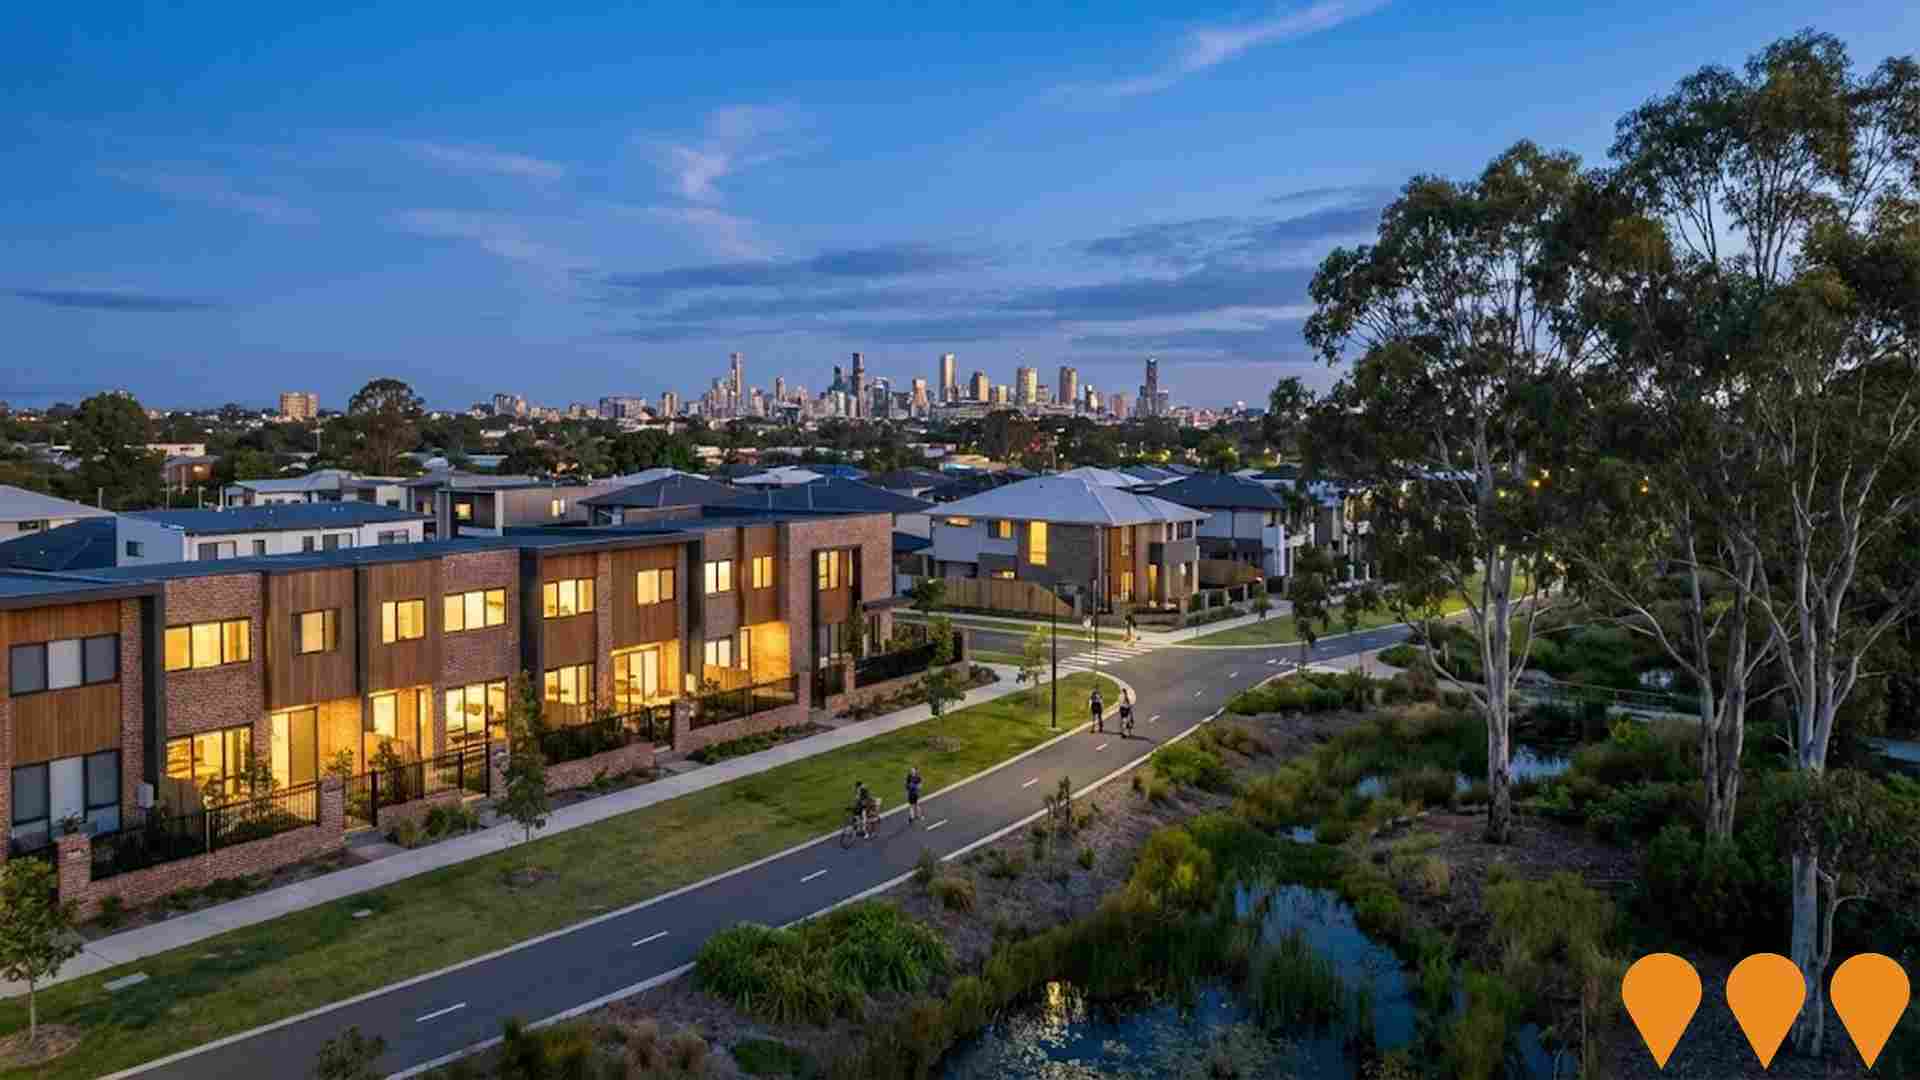
 Denotes AI-based impression for illustrative purposes only, not to be taken as definitive under any circumstances. Please follow links and conduct other investigations from the project's source for actual imagery. Developers and project owners wishing us to use original imagery please Contact Us and we will do so.
Frequently Asked Questions - Infrastructure
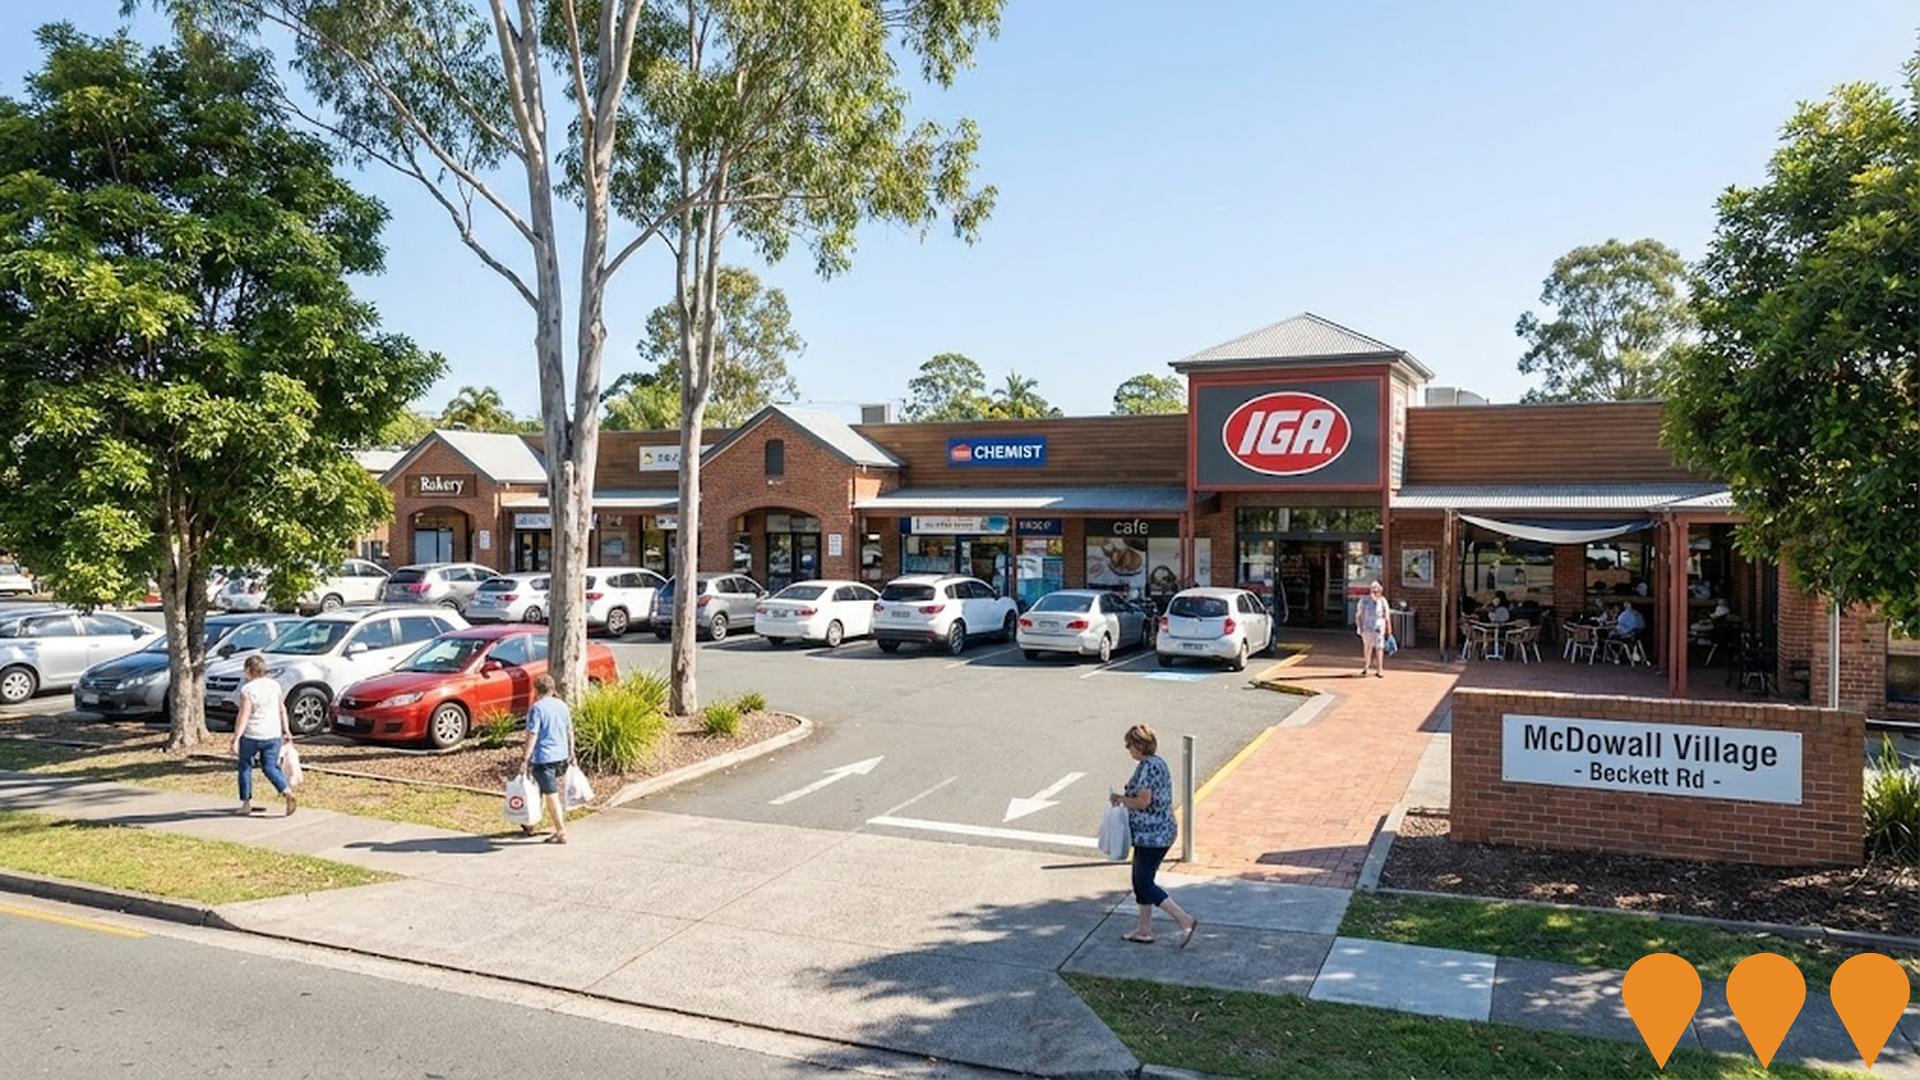
McDowall Village Master Plan Redevelopment
Concept master plan to refurbish and modestly expand McDowall Village Shopping Centre, an IGA anchored neighbourhood centre in northern Brisbane. The indicative scope includes upgrading facades and public areas, reconfiguring selected tenancies to attract new convenience and services retail, improving pedestrian links around the Beckett Road and Hamilton Road frontages, and enhancing small community gathering spaces. As at late 2025 no major development application or construction program has been announced and the project remains in early planning and feasibility stages guided by the centre owner and its property management team.
Everton Park Urban Village
Mixed-use development featuring 378 residential apartments across four towers (9-16 storeys), retail spaces, medical centre, pharmacy, and childcare centre. The development includes a central pedestrian plaza and boulevard connecting to Woolworths Street.
MONARC Mixed-Use Precinct
A 10,000 square metre mixed-use destination precinct at 768 Stafford Road, developed by Rogerscorp in collaboration with Woolworths. The project includes medical facilities, retail spaces, childcare, residential components and a healthcare super clinic serving Defence Force and Emergency Services.
Retail and Dining Expansion at Everton Plaza
A three-storey retail and dining expansion of Precinct 5 at Everton Plaza Shopping Centre, introducing three new food and beverage tenancies with a total gross floor area of 842 square metres. The development features ground floor retail venues fronting Stafford Road with alfresco dining areas to the rear, designed to integrate with the existing Park Lane dining precinct. The new building will enhance the shopping centre's food and beverage offerings and strengthen its position as a neighbourhood dining destination in Brisbane's northern suburbs.

Everton Park Link Road
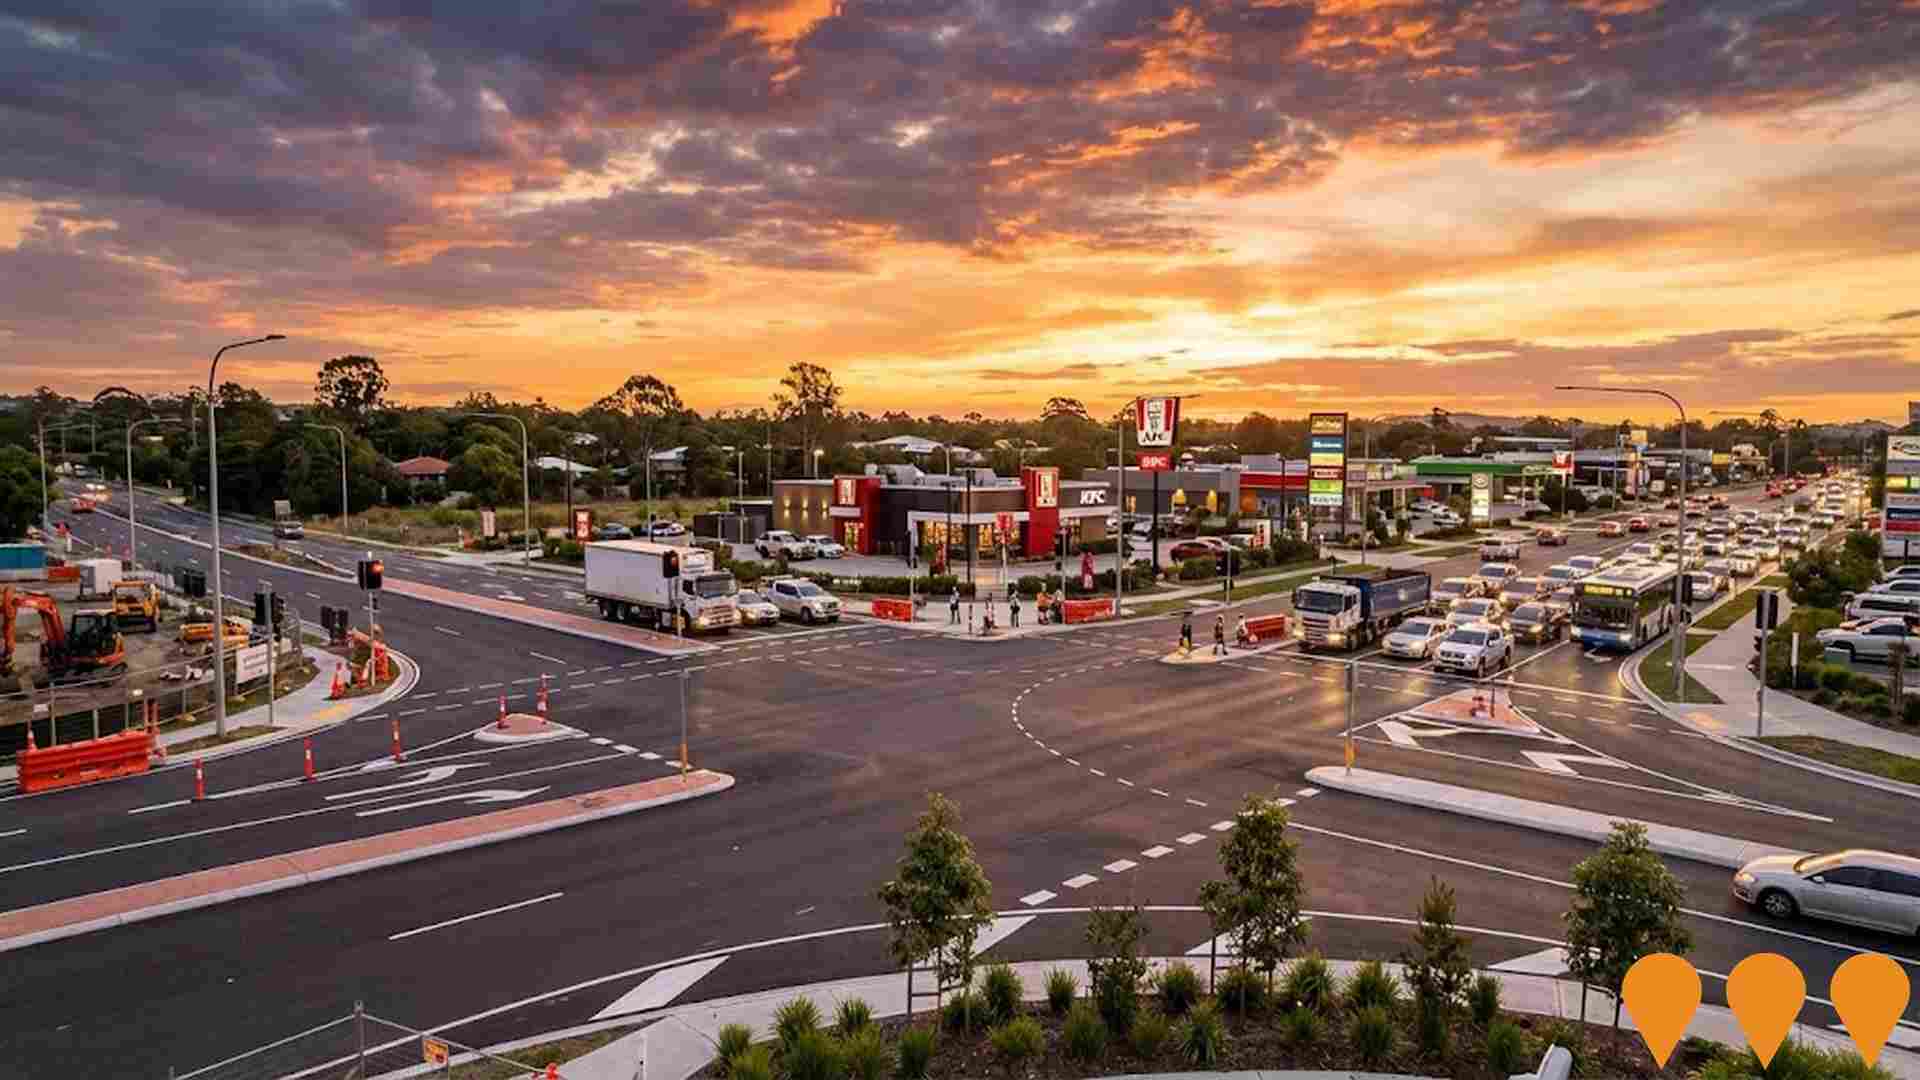
A $26 million link road connecting South Pine Road to Stafford Road, completed in 2021. The project includes dedicated cycling and pedestrian infrastructure, reducing traffic congestion at the busy Stafford Road and South Pine Road intersection.
Stafford Heights Aged Care & Retirement Village Expansion
Significant expansion of the existing Churches of Christ aged care and retirement living precinct in Stafford Heights, QLD, adding 80+ new independent living units and enhanced care facilities. The project is being developed by Churches of Christ in Queensland.
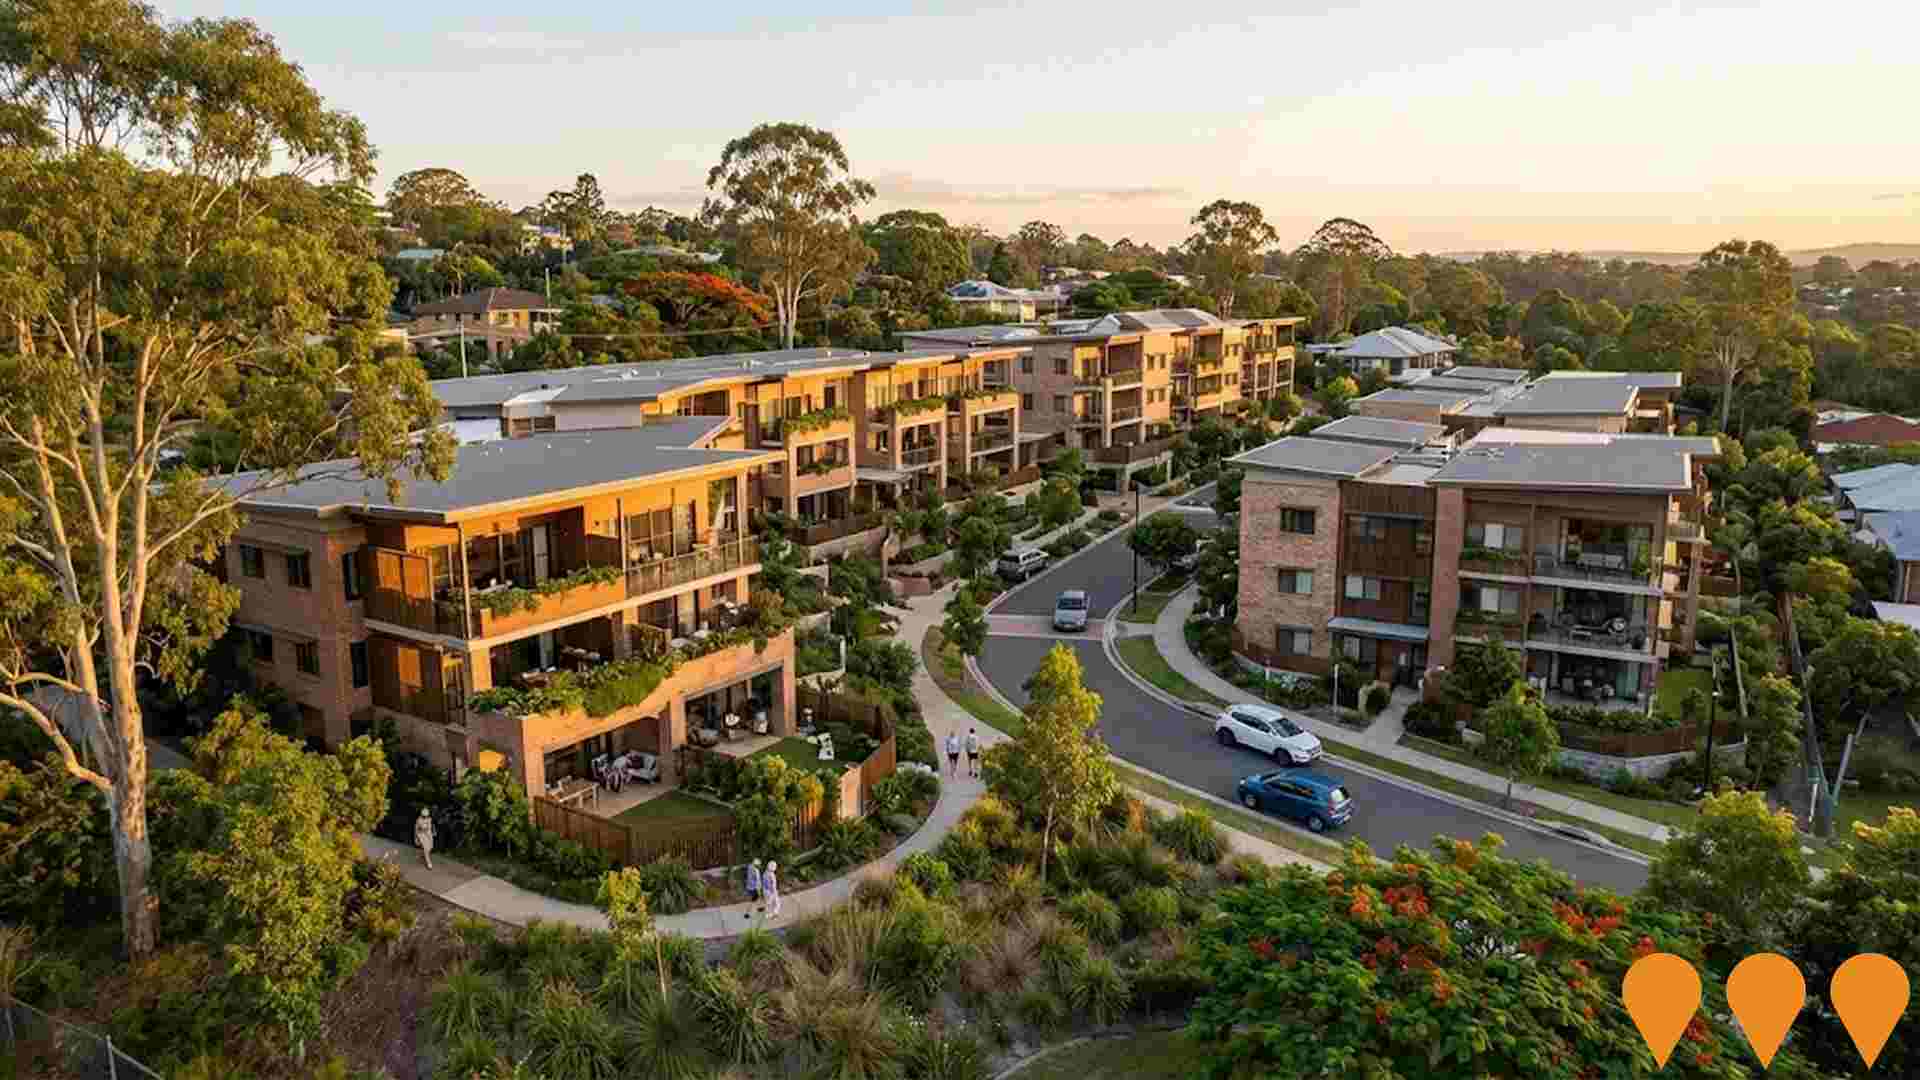
Ashmore Residences
A major residential development by Mirvac comprising 139 lots including 54 free-standing homes and 84 townhouses. The development reserves 1.1 hectares for green space with wetland and parks around Kedron Brook Bike Path.
Stafford Road and South Pine Road Intersection Upgrade (Stage 2)
Stage 2 of a two-stage traffic improvement plan to upgrade and modify intersections at and adjacent to the existing Stafford Road and South Pine Road intersection. This stage aims to improve safety and accessibility for all road users, improve intersection geometry, and resurface pavement. Stage 1 (Everton Park Link Road) was completed in May 2021. Stage 2 currently has a finalized concept plan but remains unfunded and awaiting budget allocation from the Queensland Government.
Employment
AreaSearch analysis reveals Everton Park significantly outperforming the majority of regions assessed nationwide
Everton Park's workforce is well-educated with strong professional services representation. The unemployment rate was 3.3% in September 2021.
Employment growth over the past year was estimated at 11.1%. As of September 2025, 7,154 residents are employed, with an unemployment rate of 0.7% below Greater Brisbane's rate of 4.0%, and workforce participation at 73.1% compared to Greater Brisbane's 64.5%. Key industries include health care & social assistance, public administration & safety, and education & training. Public administration & safety shows notable concentration with employment levels at 1.7 times the regional average.
Manufacturing has lower representation at 3.3%, versus the regional average of 6.4%. The area offers limited local employment opportunities. Between September 2024 and September 2025, employment levels increased by 11.1% and labour force by 11.0%, with unemployment remaining essentially unchanged. Greater Brisbane recorded employment growth of 3.8% and labour force growth of 3.3%, with unemployment falling 0.5 percentage points during the same period. State-level data to 25-Nov-25 shows QLD employment contracted by 0.01%, losing 1,210 jobs, with a state unemployment rate of 4.2%. National employment forecasts from May-25 suggest national employment should expand by 6.6% over five years and 13.7% over ten years. Applying these projections to Everton Park's employment mix suggests local employment should increase by 6.9% over five years and 14.1% over ten years, based on a simple weighting extrapolation for illustrative purposes.
Frequently Asked Questions - Employment
Income
Income metrics indicate excellent economic conditions, with the area achieving higher performance than 75% of national locations assessed by AreaSearch
AreaSearch reports that median income among taxpayers in Everton Park SA2 was $64,652 and average income was $77,731 based on postcode level ATO data for the financial year 2022. Nationally, these figures are high compared to Greater Brisbane's median of $55,645 and average of $70,520. By September 2025, estimated median income is approximately $73,697 and average income is around $88,606, adjusted for Wage Price Index growth of 13.99% since financial year 2022. According to the 2021 Census, individual earnings in Everton Park SA2 are at the 82nd percentile nationally ($1,042 weekly). Income distribution shows that 34.6% of the population (3,864 individuals) fall within the $1,500 - $2,999 income range, similar to regional levels where 33.3% occupy this range. High housing costs consume 16.0% of income, but strong earnings place disposable income at the 67th percentile nationally. The area's SEIFA income ranking places it in the 7th decile.
Frequently Asked Questions - Income
Housing
Everton Park displays a diverse mix of dwelling types, with a higher proportion of rental properties than the broader region
Everton Park's dwellings were primarily houses (61.4%) with other types such as semi-detached homes, apartments, and others comprising 38.5%. This differed from Brisbane metropolitan area's dwelling composition of 77.8% houses and 22.1% other dwellings. Home ownership in Everton Park stood at 25.5%, lower than Brisbane metro's rate. Mortgaged dwellings accounted for 34.2%, while rented dwellings were 40.3%. The median monthly mortgage repayment was $1,950, below the Brisbane metro average of $2,000 and above the national average of $1,863. The median weekly rent in Everton Park was $420, higher than Brisbane's $430 but lower than the national figure of $375.
Frequently Asked Questions - Housing
Household Composition
Everton Park features high concentrations of group households, with a lower-than-average median household size
Family households account for 67.0% of all households, including 28.8% couples with children, 25.0% couples without children, and 11.7% single parent families. Non-family households make up the remaining 33.0%, with lone person households at 27.7% and group households comprising 5.1% of the total. The median household size is 2.4 people, which is smaller than the Greater Brisbane average of 2.7.
Frequently Asked Questions - Households
Local Schools & Education
The educational profile of Everton Park exceeds national averages, with above-average qualification levels and academic performance metrics
Everton Park's educational attainment is notably higher than broader benchmarks. Among residents aged 15 and above, 37.0% have university qualifications, compared to 25.7% in Queensland (QLD) and 30.4% nationally. The most common university-level qualification is the Bachelor degree, held by 25.4%. Postgraduate qualifications and graduate diplomas are held by 7.6% and 4.0%, respectively.
Vocational credentials are also prominent, with 31.4% of residents aged 15 and above holding such qualifications. Advanced diplomas account for 11.1%, while certificates make up 20.3%. Educational participation is high in Everton Park, with 27.7% of residents currently enrolled in formal education. This includes 8.4% in primary education, 7.1% in tertiary education, and 6.5% pursuing secondary education.
Frequently Asked Questions - Education
Schools Detail
Nearby Services & Amenities
Transport
Transport servicing is moderate compared to other areas nationally based on assessment of service frequency, route connectivity and accessibility
Everton Park has 48 active public transport stops, all of which are bus stops. These stops are served by 13 different routes that combined provide 1,247 weekly passenger trips. The accessibility to these stops is rated as excellent, with residents typically living just 178 meters from the nearest stop.
On average, there are 178 trips per day across all routes, which translates to approximately 25 weekly trips per individual stop.
Frequently Asked Questions - Transport
Transport Stops Detail
Health
The level of general health in Everton Park is notably higher than the national average with prevalence of common health conditions low among the general population though higher than the nation's average across older, at risk cohorts
Everton Park shows better-than-average health outcomes with low prevalence of common conditions among its general population. However, older, at-risk cohorts have a higher prevalence compared to national averages.
Private health cover is exceptionally high at approximately 59% (6,567 people), compared to 56.2% in Greater Brisbane. Mental health issues and asthma are the most common medical conditions, affecting 9.8 and 7.6% of residents respectively. 70.1% of residents report being completely clear of medical ailments, similar to the 70.5% across Greater Brisbane. The area has a lower proportion of residents aged 65 and over at 13.0% (1,453 people), compared to 16.6% in Greater Brisbane.
Frequently Asked Questions - Health
Cultural Diversity
In terms of cultural diversity, Everton Park records figures broadly comparable to the national average, as found in AreaSearch's assessment of a number of language and cultural background related metrics
Everton Park's cultural diversity was above average, with 21.5% of its population born overseas and 13.6% speaking a language other than English at home. Christianity was the predominant religion in Everton Park, comprising 50.3% of people. Hinduism was overrepresented compared to Greater Brisbane, making up 1.9% versus 4.5%.
The top three ancestry groups were English (27.0%), Australian (24.1%), and Irish (10.4%). Notably, New Zealanders were equally represented at 0.9%, Germans were slightly overrepresented at 4.2% compared to the regional average of 3.9%, and Scots were also overrepresented at 8.3%.
Frequently Asked Questions - Diversity
Age
Everton Park's population is younger than the national pattern
Everton Park's median age is 35 years, nearly matching Greater Brisbane's average of 36 years but younger than Australia's median age of 38 years. Compared to Greater Brisbane, Everton Park has a higher proportion of residents aged 25-34 (18.2%) but fewer residents aged 65-74 (6.2%). Between the 2021 Census and the present, the proportion of the population aged 35-44 has increased from 15.4% to 16.9%, while the proportion aged 25-34 has decreased from 19.1% to 18.2%. By 2041, Everton Park's population is projected to experience significant demographic changes. The 45-54 age group is expected to grow by 39%, adding 576 residents and reaching a total of 2,071. Conversely, population declines are forecast for the 0-4 and 25-34 age cohorts.
