Chart Color Schemes
This analysis uses ABS Statistical Areas Level 2 (SA2) boundaries, which can materially differ from Suburbs and Localities (SAL) even when sharing similar names.
SA2 boundaries are defined by the Australian Bureau of Statistics and are designed to represent communities for statistical reporting (e.g., census and ERP).
Suburbs and Localities (SAL) represent commonly-used suburb/locality names (postal-style areas) and may use different geographic boundaries. For comprehensive analysis, consider reviewing both boundary types if available.
est. as @ -- *
ABS ERP | -- people | --
2021 Census | -- people
Sales Activity
Curious about local property values? Filter the chart to assess the volume and appreciation (including resales) trends and regional comparisons, or scroll to the map below view this information at an individual property level.
Find a Recent Sale
Sales Detail
Population
An assessment of population growth drivers in The Hills District reveals an overall ranking slightly below national averages considering recent, and medium term trends
The Hills District's population is approximately 25,983 as of November 2025. This figure represents an increase of 1,670 people from the 2021 Census count of 24,313. The estimated resident population in June 2024 was 25,967, with an additional 259 validated new addresses since the Census date contributing to this growth. This results in a population density ratio of 821 persons per square kilometer, comparable to averages seen across other locations assessed by AreaSearch. The Hills District's population growth rate of 6.9% since the census is within 0.5 percentage points of the SA3 area's growth rate of 7.4%, indicating competitive growth fundamentals. Natural growth accounted for approximately 51.3% of overall population gains during recent periods in the area.
AreaSearch uses ABS/Geoscience Australia projections for each SA2 area, released in 2024 with a base year of 2022. For areas not covered by this data and years post-2032, Queensland State Government's SA2 area projections from 2023 based on 2021 data are adopted. However, these state projections do not provide age category splits, so AreaSearch applies proportional growth weightings in line with ABS Greater Capital Region projections released in 2023 and based on 2022 data for each age cohort. Future population trends suggest a growth of 1,642 persons by 2041, reflecting an increase of 6.3% over the 17-year period, based on the latest annual ERP population numbers.
Frequently Asked Questions - Population
Development
Recent residential development output has been above average within The Hills District when compared nationally
The Hills District has averaged approximately 68 new dwelling approvals annually over the past five financial years, totalling 341 homes. As of FY-26, 16 approvals have been recorded. On average, 3.9 new residents arrive per year for each dwelling constructed between FY-21 and FY-25, indicating demand significantly exceeds supply. New properties are constructed at an average expected cost of $334,000.
This financial year has seen $12.4 million in commercial approvals, suggesting balanced commercial development activity. Compared to Greater Brisbane, The Hills District has around two-thirds the rate of new dwelling approvals per person and ranks among the 29th percentile nationally, resulting in relatively constrained buyer choice and supporting interest in existing dwellings. New development consists of 47.0% detached dwellings and 53.0% townhouses or apartments, reflecting a trend towards denser development to provide accessible entry options for downsizers, investors, and entry-level buyers. The estimated population density is 549 people per dwelling approval, indicative of its quiet, low activity development environment. Future projections suggest The Hills District will add 1,626 residents by 2041, with current development rates expected to comfortably meet demand, providing good conditions for buyers and potentially supporting growth beyond current population projections.
Future projections show The Hills District adding 1,626 residents by 2041 (from the latest AreaSearch quarterly estimate). At current development rates, new housing supply should comfortably meet demand, providing good conditions for buyers and potentially supporting growth beyond current population projections.
Frequently Asked Questions - Development
Infrastructure
The Hills District has moderate levels of nearby infrastructure activity, ranking in the 42ndth percentile nationally
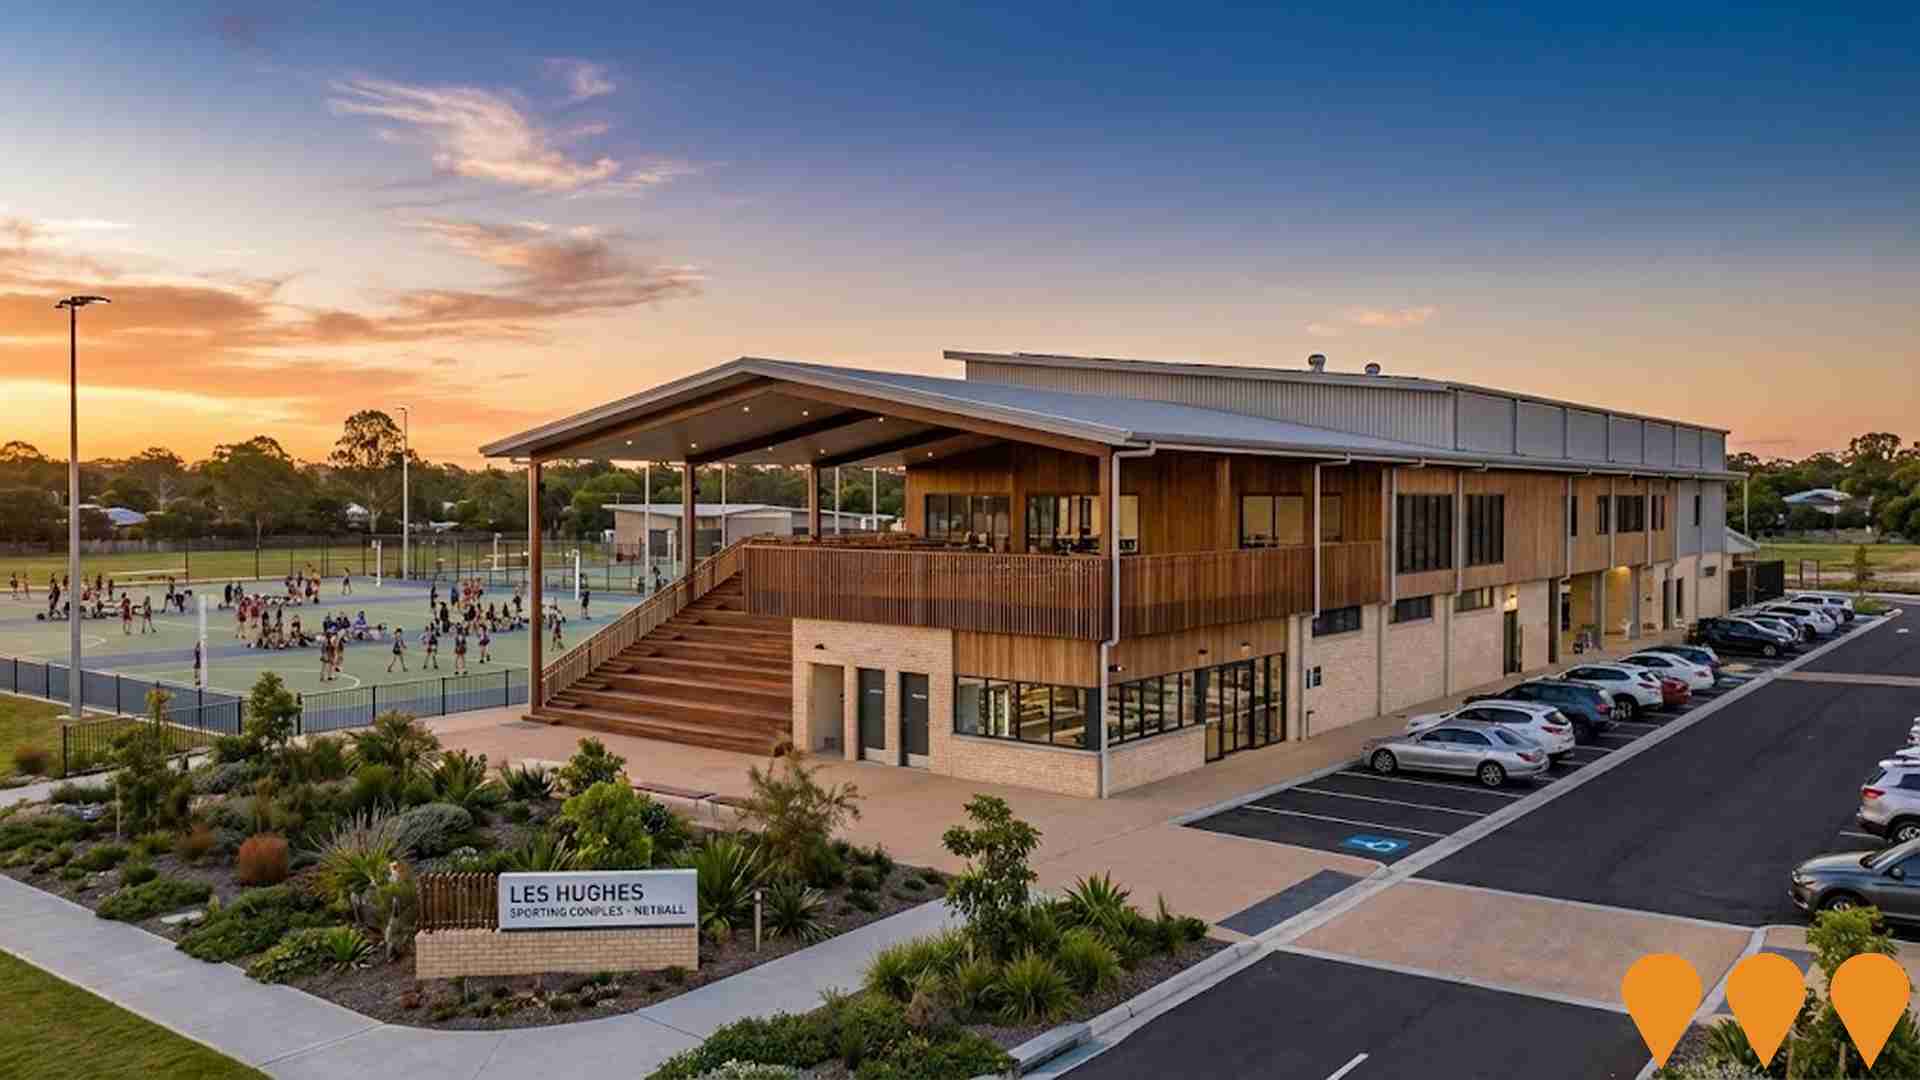
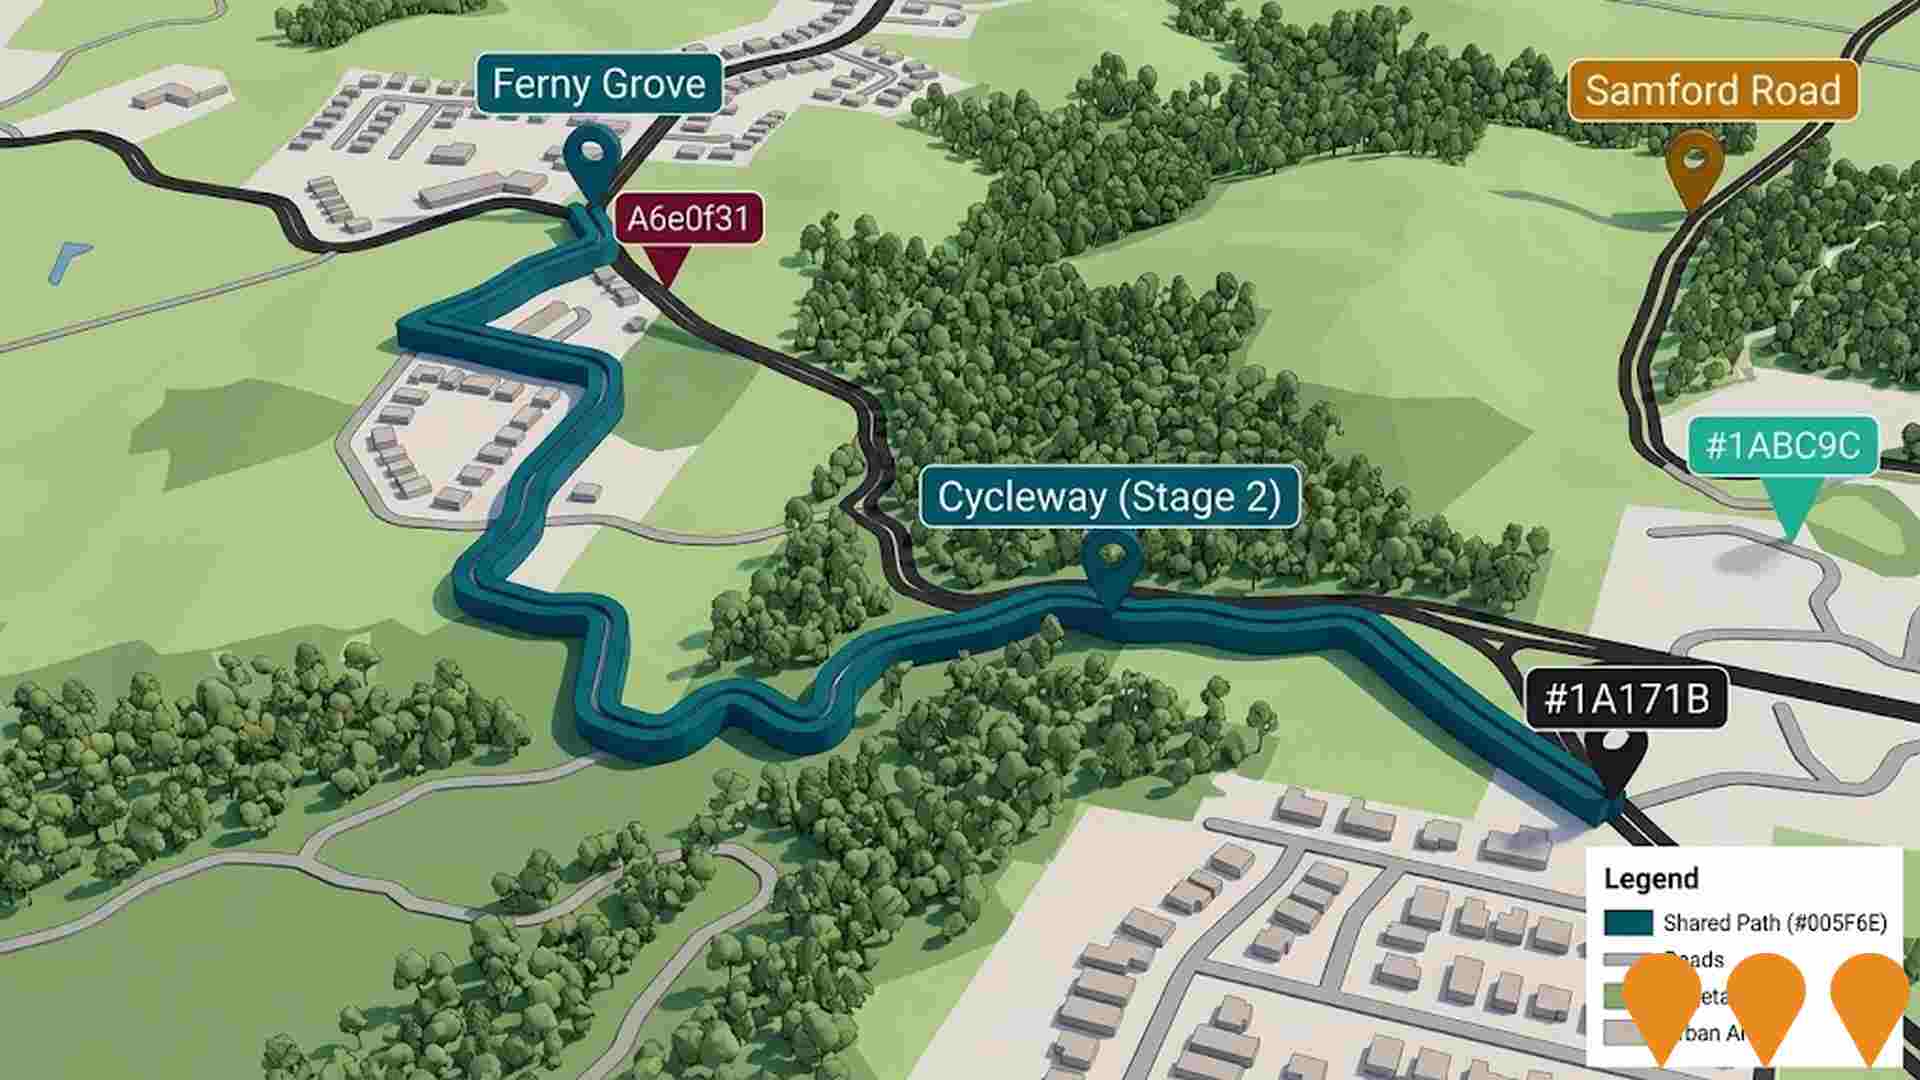
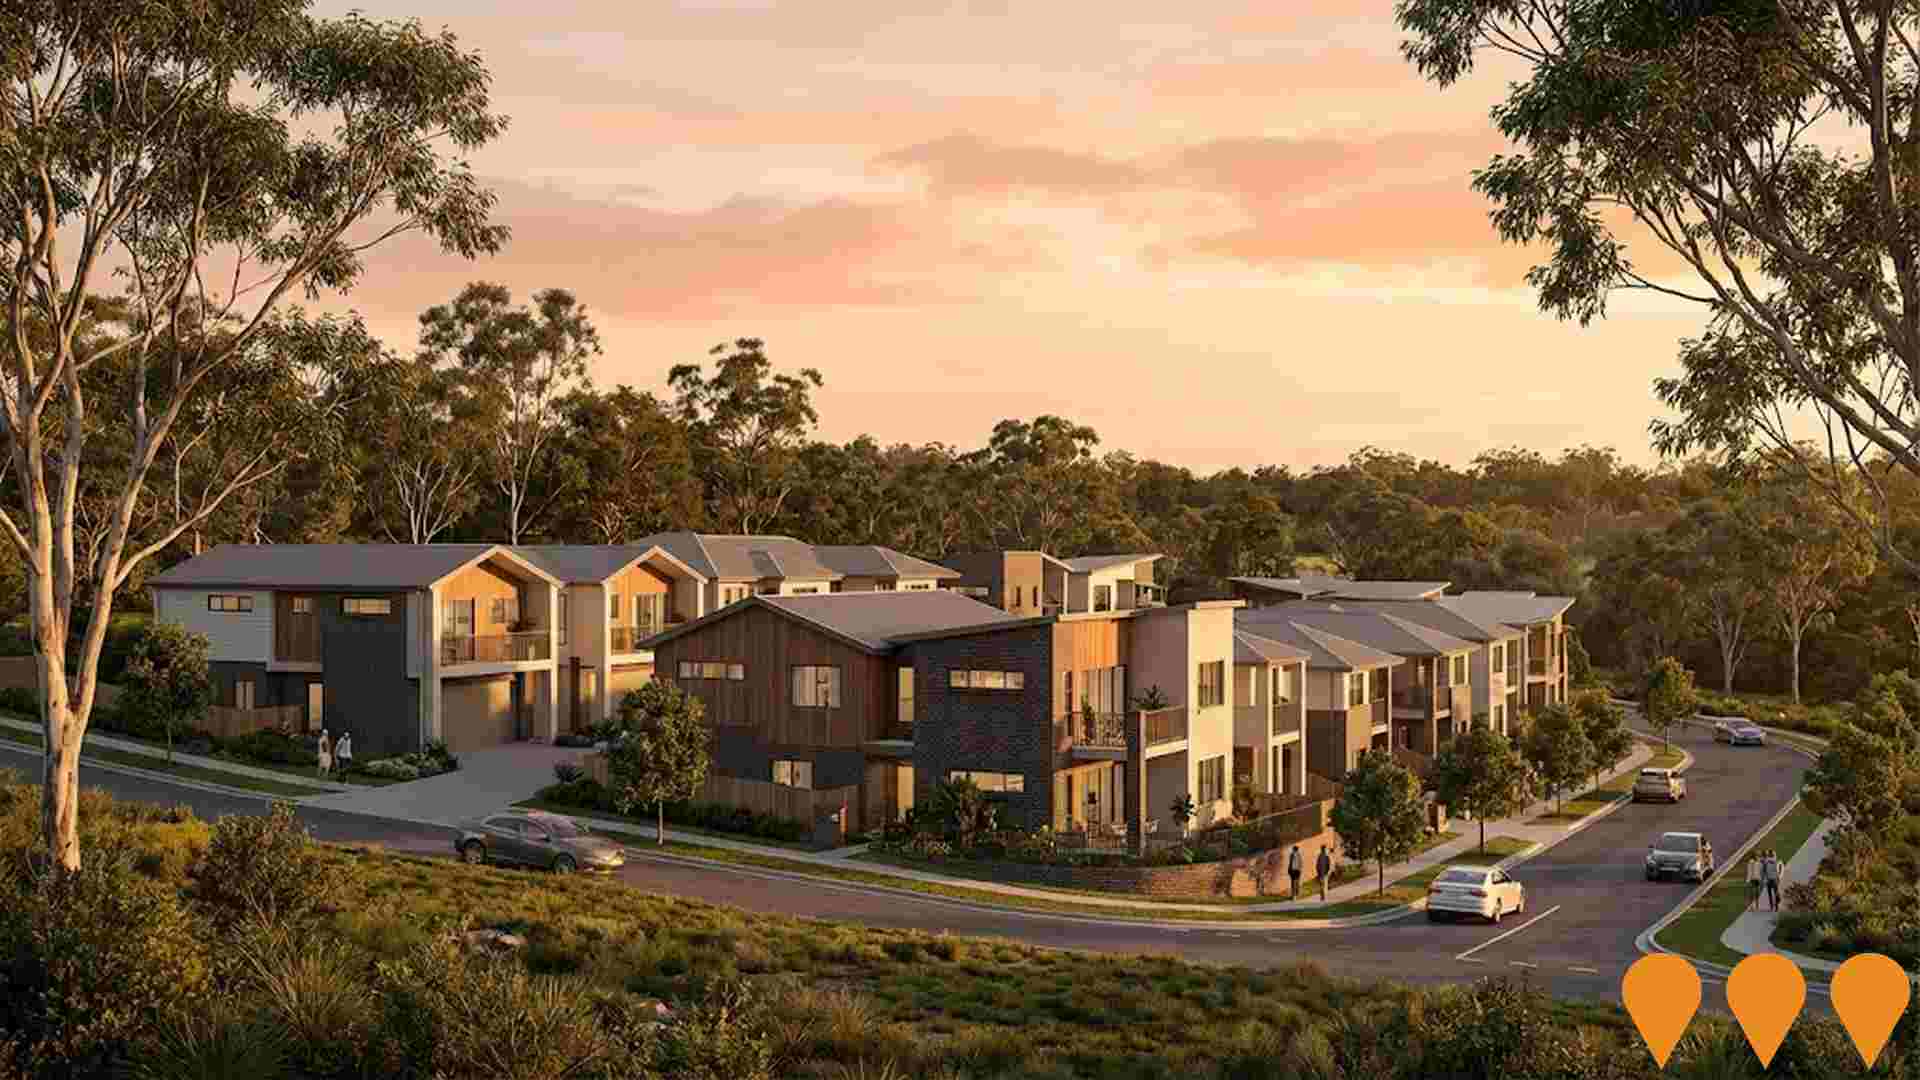
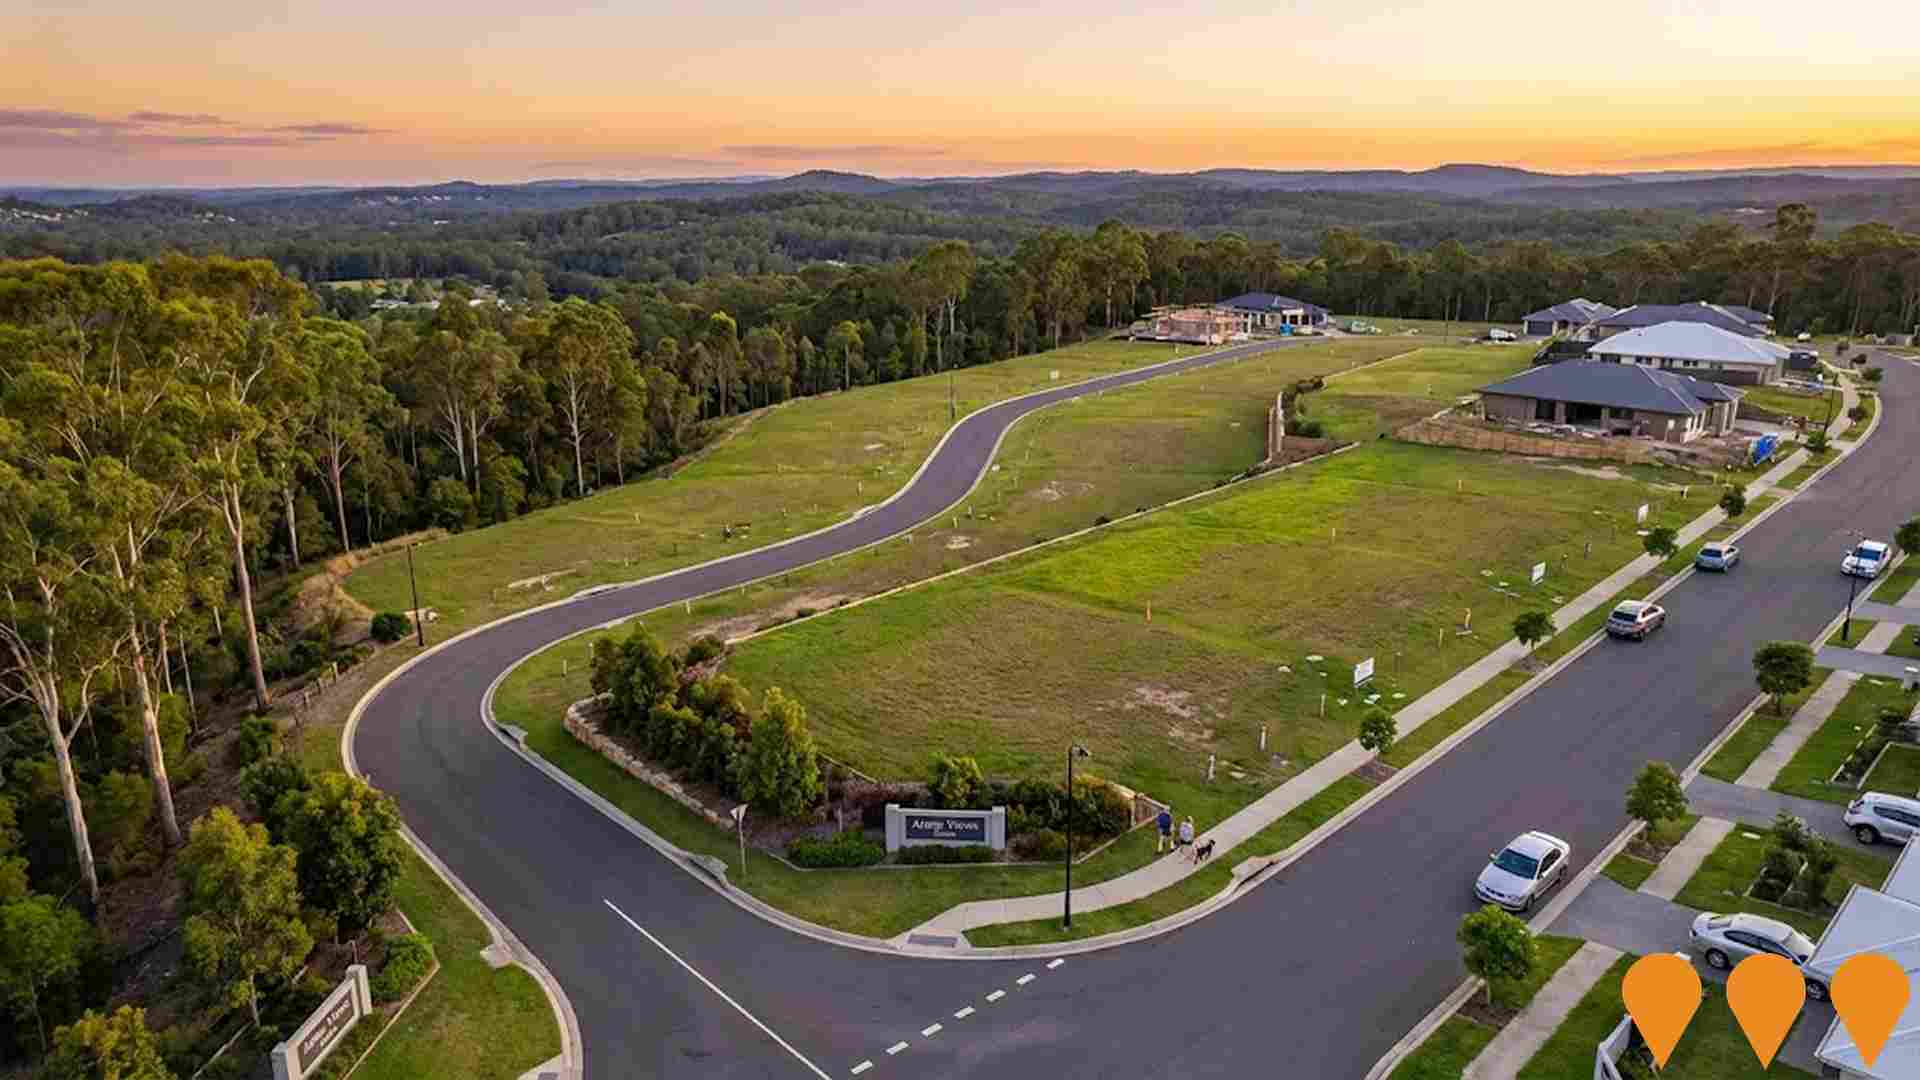
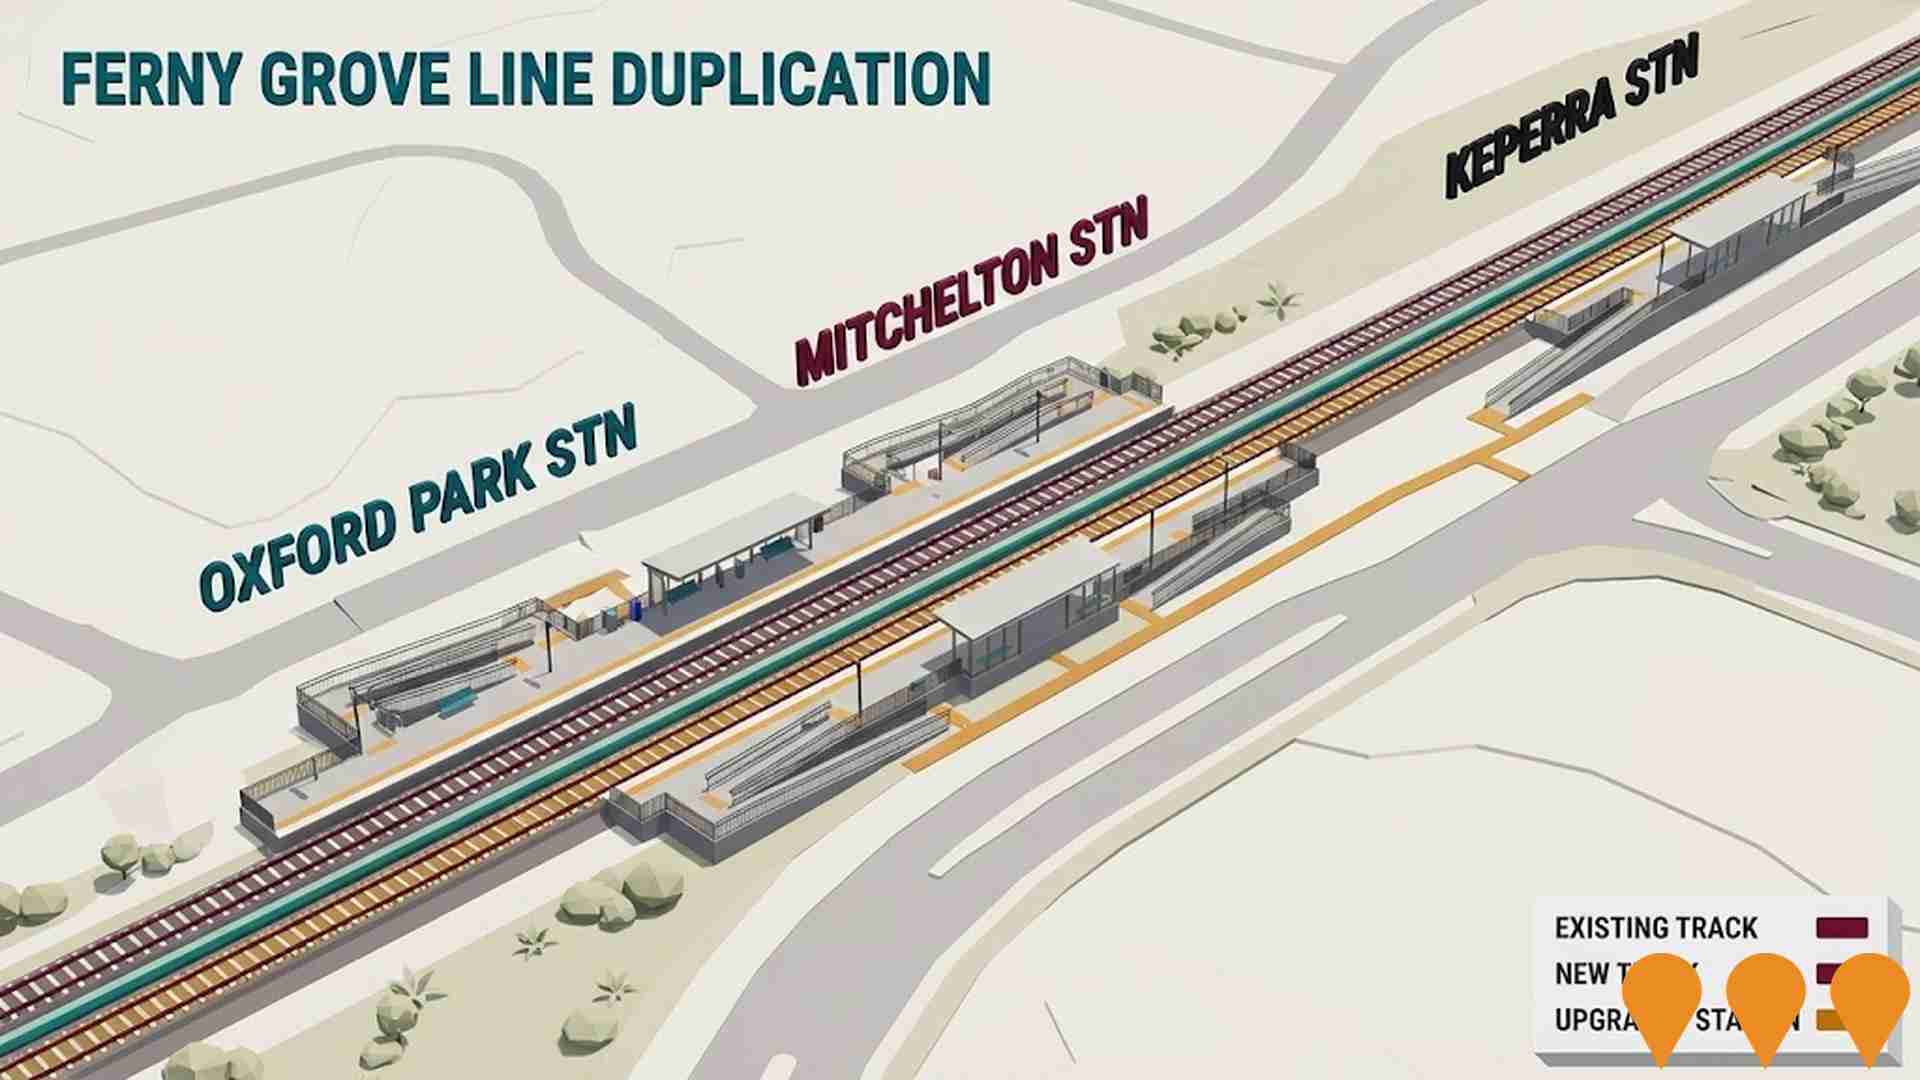
Changes in local infrastructure significantly affect an area's performance. AreaSearch has identified 48 projects that may impact this region. Notable projects are Hills Quarter Everton Hills, Arana Hills Plaza Ambience Upgrade, Everton Rise, and Everton Hills Central. The following details those likely most relevant.
Professional plan users can use the search below to filter and access additional projects.
INFRASTRUCTURE SEARCH
 Denotes AI-based impression for illustrative purposes only, not to be taken as definitive under any circumstances. Please follow links and conduct other investigations from the project's source for actual imagery. Developers and project owners wishing us to use original imagery please Contact Us and we will do so.
Frequently Asked Questions - Infrastructure
Arana Hills Plaza Ambience Upgrade
Arana Hills Plaza Ambience Upgrade is a Charter Hall project delivering significant external ambience works and refreshed branding for the existing convenience based shopping centre at the corner of Patricks Road and Dawson Parade in Arana Hills, Queensland. Construction works are underway while the centre continues trading, with upgrades focused on improving the shopper experience and reflecting the surrounding hills and bushland context. :contentReference[oaicite:0]{index=0} :contentReference[oaicite:1]{index=1}

The Quarry by Frasers Property Keperra
Iconic Brisbane hillside transformation rising 170 metres above sea level. Large-scale residential community development featuring quality homes, parklands, and recreational facilities in a elevated bushland setting.

Retail and Dining Expansion at Everton Plaza
A three-storey retail and dining expansion of Precinct 5 at Everton Plaza Shopping Centre, introducing three new food and beverage tenancies with a total gross floor area of 842 square metres. The development features ground floor retail venues fronting Stafford Road with alfresco dining areas to the rear, designed to integrate with the existing Park Lane dining precinct. The new building will enhance the shopping centre's food and beverage offerings and strengthen its position as a neighbourhood dining destination in Brisbane's northern suburbs.

Everton Hills Central
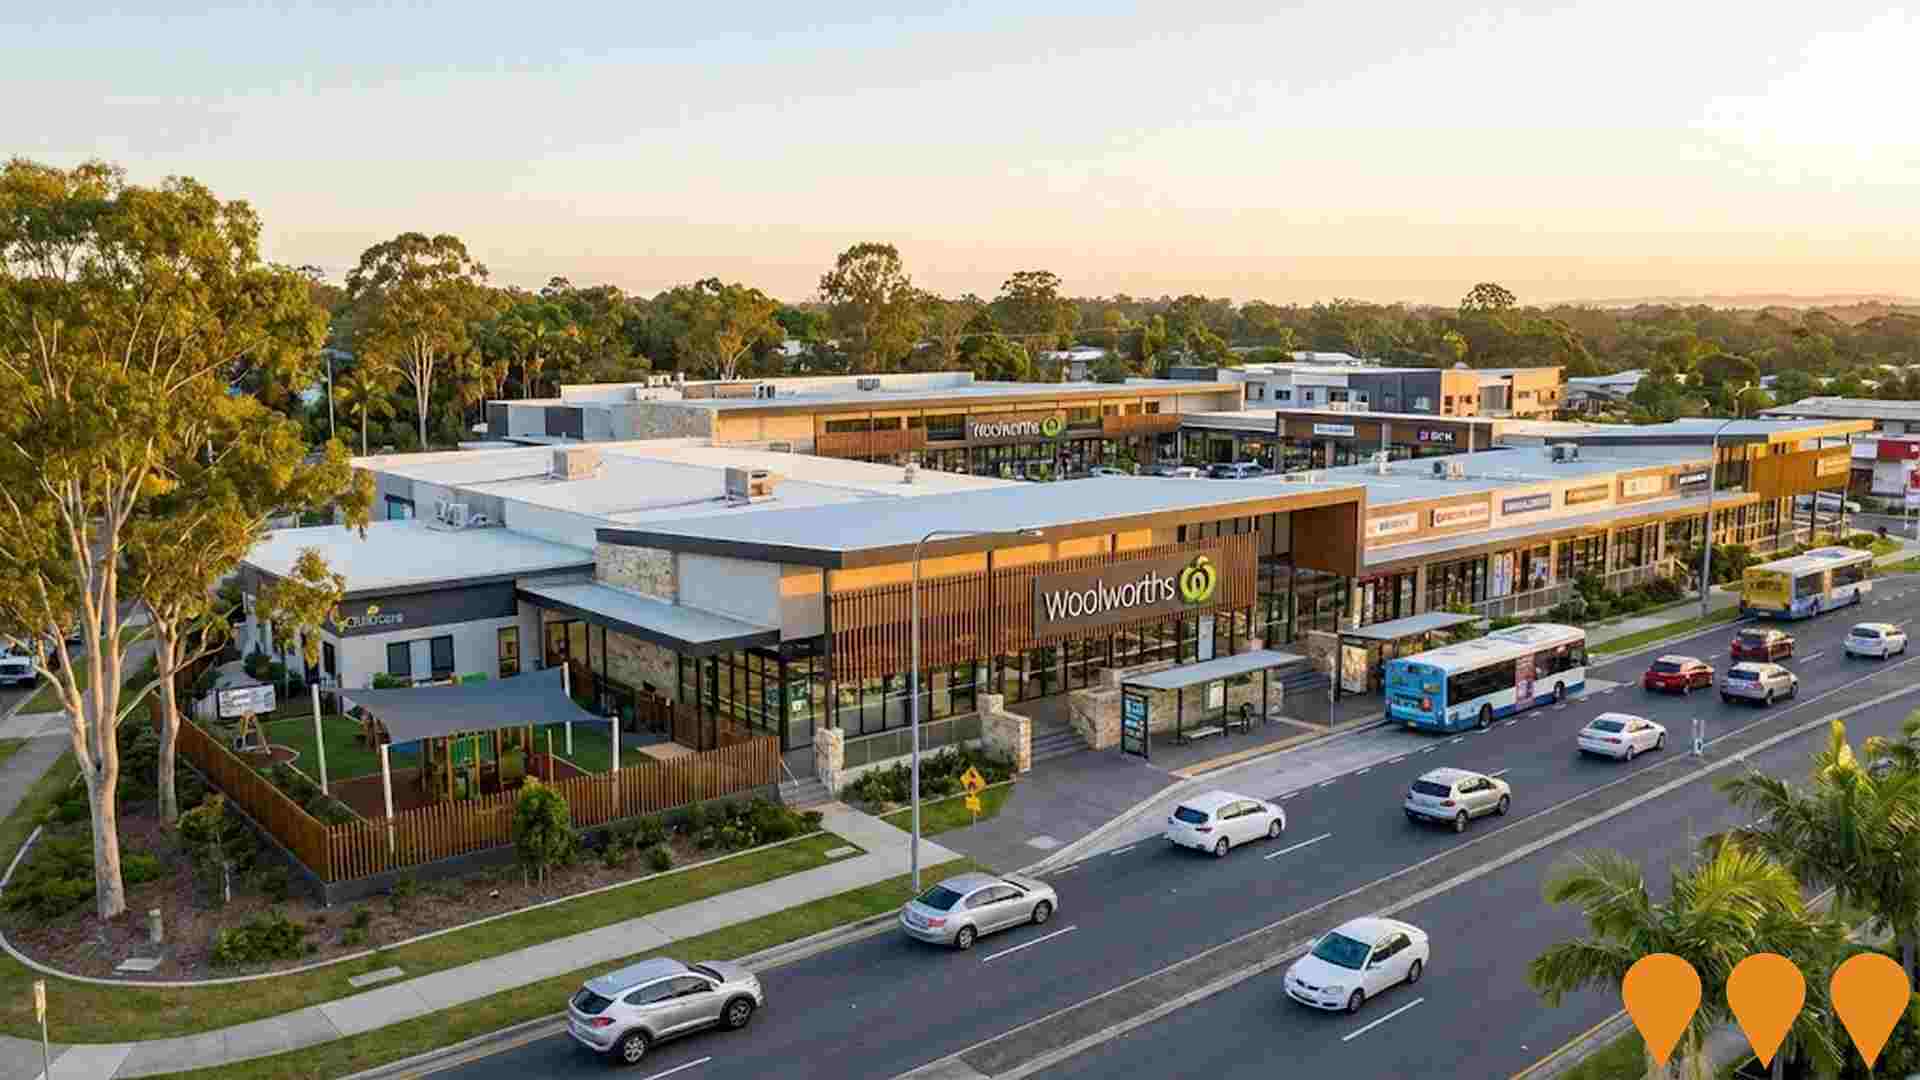
A new neighbourhood shopping centre anchored by a full-line Woolworths supermarket, including specialty retail, medical centre, gym, and childcare facility with direct frontage to South Pine Road.
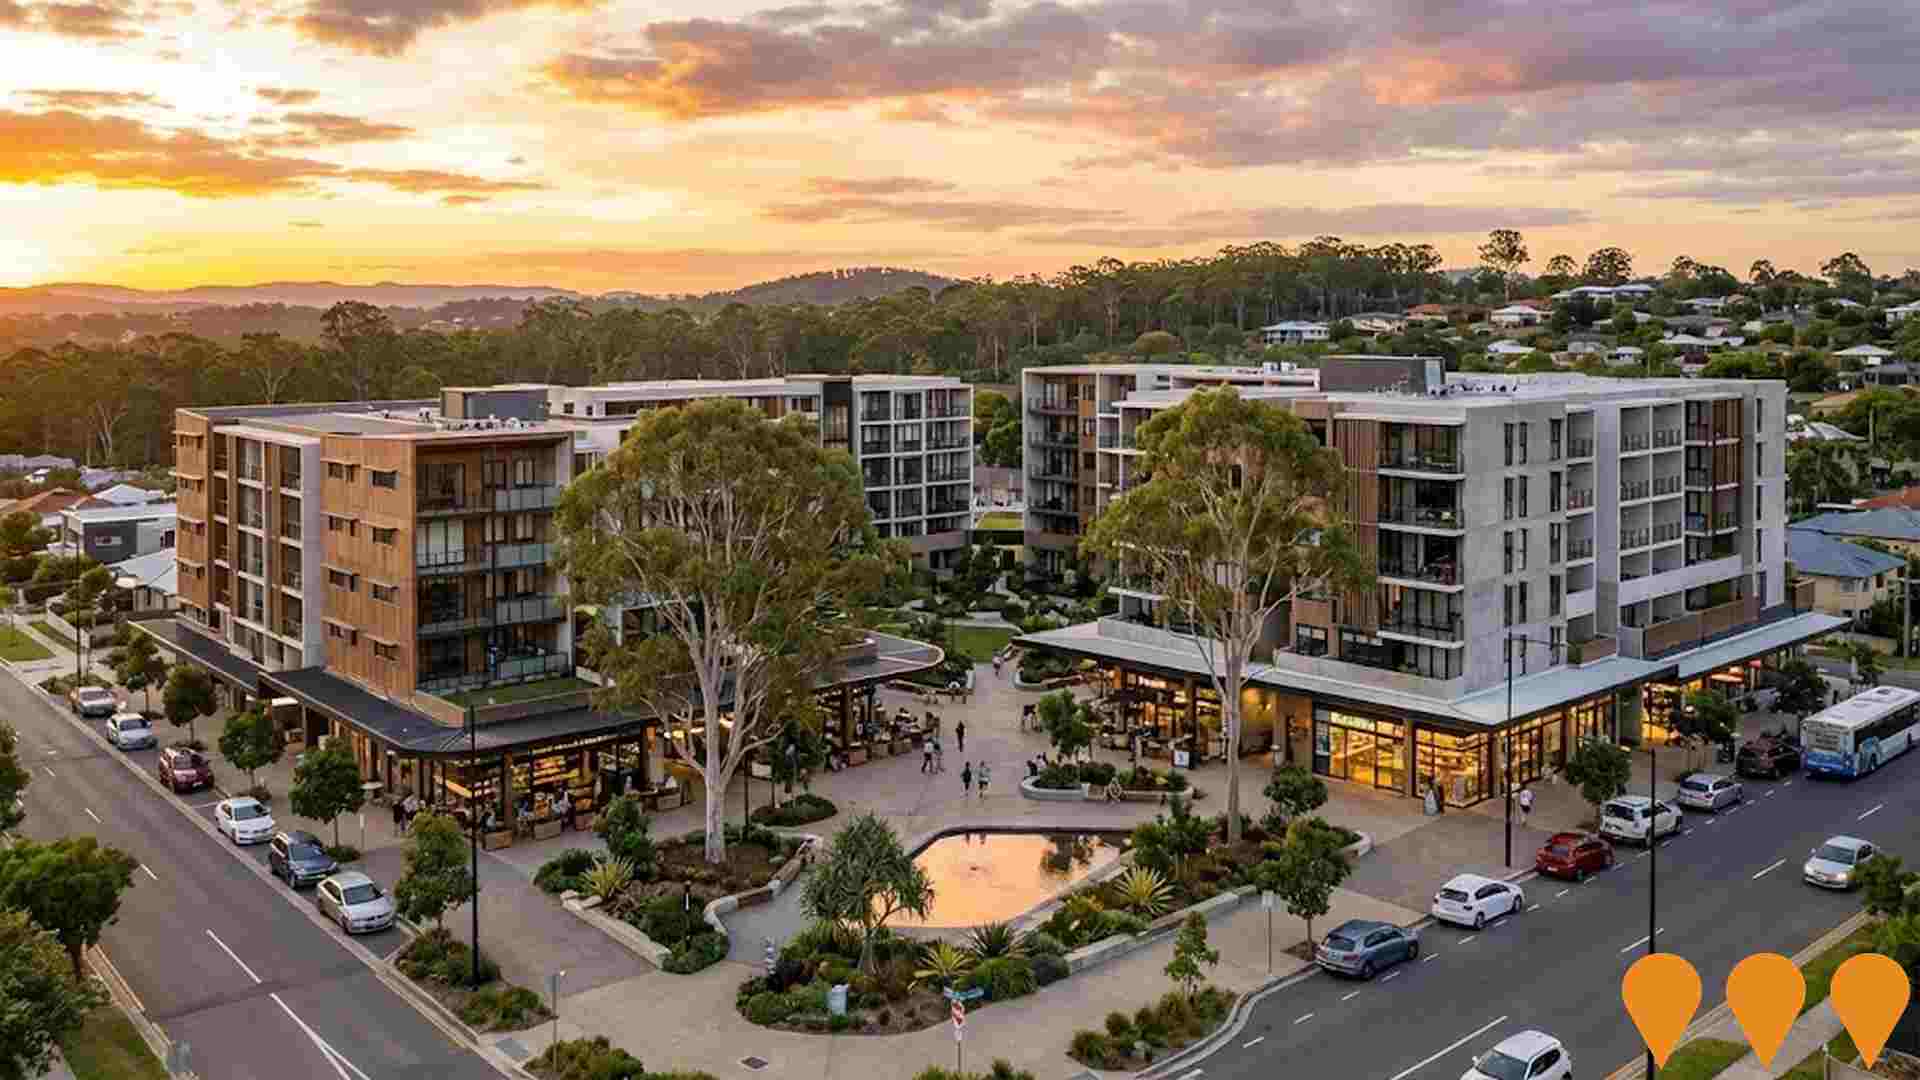
The Quarry - Keperra Quarry Redevelopment
Redevelopment of the former Keperra granite quarry into The Quarry, a 48.7 hectare masterplanned hillside community in Brisbane with around 400 homesites, extensive green space and the residents only ClubQ recreation precinct featuring multiple pools, wellness and gym facilities, community lawns and entertaining spaces. Civil and amenity works are well advanced, ClubQ stage two has opened with additional pools and wellness offerings, and new elevated land releases such as The Promenade Collection and The Summit are selling while individual homes continue to be designed and built across the estate. :contentReference[oaicite:0]{index=0} :contentReference[oaicite:1]{index=1} :contentReference[oaicite:2]{index=2}

University Road Mixed-Use Development
An approved mixed-use development including a 9-storey residential apartment building, a 10-storey retirement building with 50 assisted and 50 independent living units, a 72-place childcare centre, and 358 sqm commercial space. The development application number is A004808980 (Brisbane City Council).

Arana Central
Mixed-use precinct proposed for the former Kmart site delivering up to 300 apartments across multiple buildings, ground-floor retail/commercial space, and a new public plaza. The project is situated within the Arana Hills Precinct Planning Project area currently being investigated by the City of Moreton Bay to guide future growth and development.
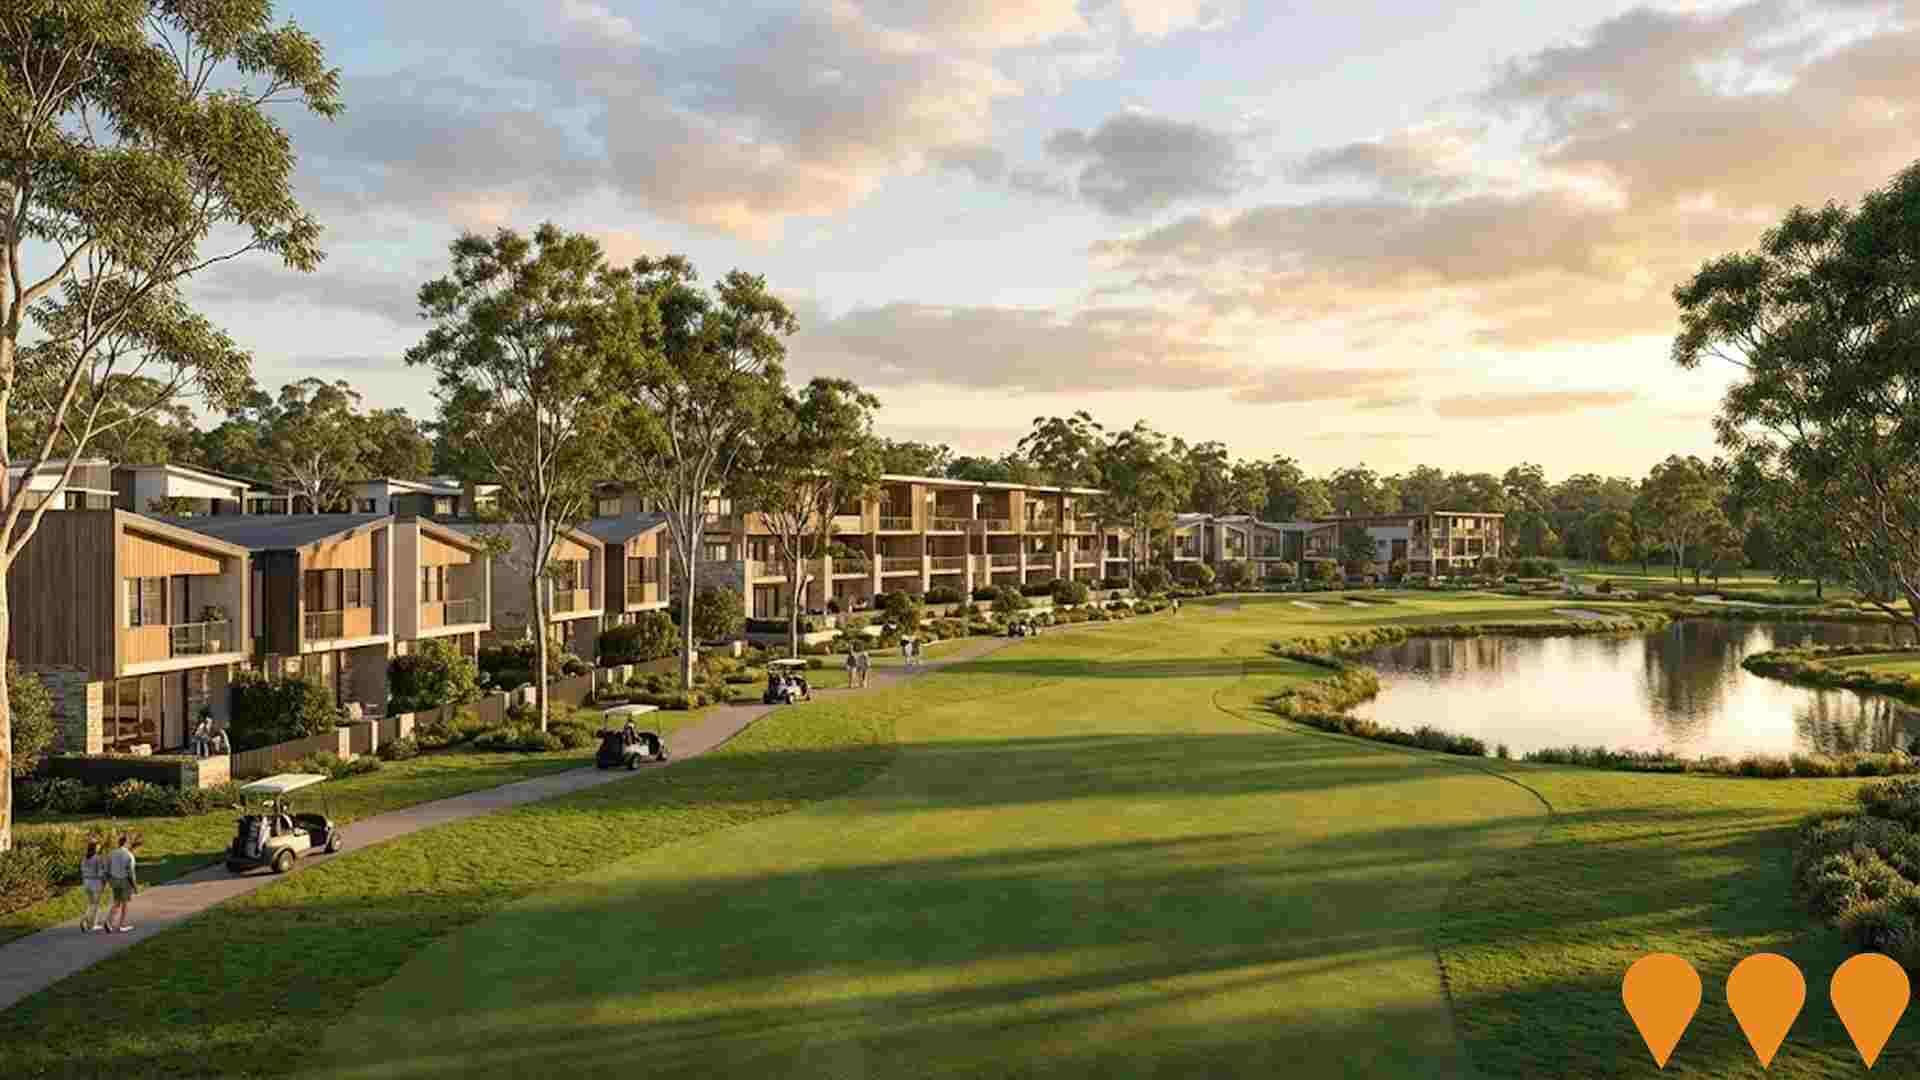
Keperra Country Golf Club Residential Precinct
Approved master-planned residential community within Keperra Country Golf Club incorporating up to 450 new dwellings, including townhouses and low-rise apartments, while retaining the 27-hole golf course. The project is currently progressing with significant golf course and clubhouse redevelopment works.
Employment
Employment conditions in The Hills District demonstrate exceptional strength compared to most Australian markets
The Hills District has an educated workforce with professional services well-represented. The unemployment rate was 3.1% as of a recent period, with estimated employment growth at 4.7%.
As of September 2025, 15,850 residents were employed, and the unemployment rate was 0.9% below Greater Brisbane's rate of 4.0%. Workforce participation was high at 71.1%, compared to Greater Brisbane's 64.5%. Key employment industries included health care & social assistance, education & training, and public administration & safety, with a notable concentration in the latter (1.5 times the regional average). Manufacturing had limited presence, with 3.8% employment compared to the regional average of 6.4%.
Employment opportunities appeared limited locally, as indicated by Census data comparing working population to resident population. Over a 12-month period, employment increased by 4.7%, while labour force grew by 5.1%, leading to a rise in unemployment rate by 0.4 percentage points. This contrasted with Greater Brisbane's trends of employment growth at 3.8% and unemployment reduction of 0.5 percentage points. Statewide, Queensland's employment contracted slightly by 0.01% (losing 1,210 jobs) as of 25-Nov, with an unemployment rate of 4.2%, closely aligned with the national rate of 4.3%. Job and Skills Australia's national employment forecasts from May-25 project overall growth of 6.6% over five years and 13.7% over ten years. Applying these projections to The Hills District's employment mix suggests local employment should increase by approximately 7.0% over five years and 14.2% over ten years, assuming constant population projections for illustrative purposes.
Frequently Asked Questions - Employment
Income
Income metrics indicate excellent economic conditions, with the area achieving higher performance than 75% of national locations assessed by AreaSearch
AreaSearch's latest postcode level ATO data for financial year 2022 shows The Hills District SA2 had a median income among taxpayers of $62,741 and an average of $74,303. This is notably high compared to national figures, with Greater Brisbane having a median income of $55,645 and an average of $70,520. Based on Wage Price Index growth of 13.99% since financial year 2022, current estimates suggest a median income of approximately $71,518 and an average of $84,698 as of September 2025. Census 2021 data reveals that household, family, and personal incomes in The Hills District all rank high nationally, between the 80th and 85th percentiles. Income distribution shows 34.6% of residents (8,990 individuals) earn within the $1,500 - $2,999 range, mirroring broader area patterns where 33.3% fall into this bracket. Economic strength is evident with 35.4% of households earning high weekly incomes exceeding $3,000, supporting increased consumer spending. Housing expenses account for 13.6% of income, while strong earnings place residents in the 86th percentile for disposable income. The area's SEIFA income ranking places it in the 8th decile.
Frequently Asked Questions - Income
Housing
The Hills District is characterized by a predominantly suburban housing profile, with a higher proportion of rental properties than the broader region
The Hills District's dwelling structures, as per the latest Census, consisted of 89.0% houses and 10.9% other dwellings (semi-detached, apartments, 'other' dwellings), compared to Brisbane metro's 99.2% houses and 7.9% other dwellings. Home ownership in The Hills District was at 31.0%, similar to Brisbane metro, with mortgaged dwellings at 49.8% and rented ones at 19.2%. The median monthly mortgage repayment was $2,000, lower than Brisbane metro's average of $2,080. The median weekly rent figure stood at $455, higher than Brisbane metro's $440. Nationally, The Hills District's mortgage repayments were higher than the Australian average of $1,863, while rents were substantially above the national figure of $375.
Frequently Asked Questions - Housing
Household Composition
The Hills District features high concentrations of family households, with a lower-than-average median household size
Family households account for 80.9% of all households, including 39.8% couples with children, 28.8% couples without children, and 11.3% single parent families. Non-family households make up the remaining 19.1%, with lone person households at 16.4% and group households comprising 2.7%. The median household size is 2.8 people, which is smaller than the Greater Brisbane average of 2.9.
Frequently Asked Questions - Households
Local Schools & Education
The Hills District shows strong educational performance, ranking in the upper quartile nationally when assessed across multiple qualification and achievement indicators
The area's university qualification rate is 33.7%, higher than the SA4 region average of 24.9% and Queensland's state average of 25.7%. Bachelor degrees are most common at 22.9%, followed by postgraduate qualifications (6.6%) and graduate diplomas (4.2%). Vocational credentials are also prevalent, with 34.4% of residents aged 15+ holding them.
This includes advanced diplomas (11.9%) and certificates (22.5%). Educational participation is high, with 29.5% of residents currently enrolled in formal education. This includes 10.3% in primary education, 8.4% in secondary education, and 5.5% pursuing tertiary education.
Frequently Asked Questions - Education
Schools Detail
Nearby Services & Amenities
Transport
Transport servicing is low compared to other areas nationally based on assessment of service frequency, route connectivity and accessibility
Transport analysis shows 94 active transport stops in The Hills District, served by buses. Six routes operate here, offering 475 weekly passenger trips. Residents' average distance to the nearest stop is 386 meters.
Daily service frequency averages 67 trips across all routes, equating to about five weekly trips per stop.
Frequently Asked Questions - Transport
Transport Stops Detail
Health
The Hills District's residents are healthier than average in comparison to broader Australia with prevalence of common health conditions quite low among the general population though higher than the nation's average across older, at risk cohorts
Health data shows relatively positive outcomes for Hills District residents. Prevalence of common health conditions is low among the general population but higher among older, at-risk cohorts compared to national averages.
Approximately 56% (~14,680 people) have private health cover, which is lower than Greater Brisbane's 59.0%. Mental health issues and asthma are the most common medical conditions, affecting 9.8 and 7.9% of residents respectively. 68.7% declare themselves completely clear of medical ailments, compared to 69.9% in Greater Brisbane. The area has 14.8% (3,850 people) aged 65 and over, lower than Greater Brisbane's 16.2%.
Frequently Asked Questions - Health
Cultural Diversity
The Hills District ranks below the Australian average when compared to other local markets across a number of language and cultural background related metrics
The Hills District, as per data from the Australian Bureau of Statistics Census 2016, showed lower cultural diversity with 83.1% of its population born in Australia and 92.4% being citizens. English was spoken at home by 93.0% of residents. Christianity was the predominant religion, accounting for 49.9%, compared to 52.9% across Greater Brisbane.
The top three ancestry groups were English (29.6%), Australian (27.0%), and Irish (10.2%). Notably, Scottish ancestry was slightly higher at 9.2% compared to the regional average of 8.9%. New Zealand and German ancestries were similarly represented at 1.0% and 4.8%, respectively, close to their respective regional averages of 1.0% and 4.6%.
Frequently Asked Questions - Diversity
Age
The Hills District's population is slightly younger than the national pattern
The Hills District has a median age of 38 years, slightly higher than Greater Brisbane's figure of 36 but equal to Australia's median age of 38 years. The 45-54 age group is strongly represented at 14.8%, compared to Greater Brisbane, while the 25-34 cohort is less prevalent at 11.8%. Between 2021 and the present day, the population aged 75 to 84 has grown from 4.6% to 6.2%. Conversely, the 65 to 74 age group has declined from 8.7% to 7.1%. By 2041, demographic projections indicate significant shifts in The Hills District's age structure. Notably, the 85+ population is expected to grow by 194%, reaching 1,161 people from a previous figure of 394. This growth reflects an aging population trend, with those aged 65 and above comprising 54% of projected growth. Meanwhile, the 5-14 and 0-4 age cohorts are expected to experience population declines.
