Chart Color Schemes
This analysis uses ABS Statistical Areas Level 2 (SA2) boundaries, which can materially differ from Suburbs and Localities (SAL) even when sharing similar names.
SA2 boundaries are defined by the Australian Bureau of Statistics and are designed to represent communities for statistical reporting (e.g., census and ERP).
Suburbs and Localities (SAL) represent commonly-used suburb/locality names (postal-style areas) and may use different geographic boundaries. For comprehensive analysis, consider reviewing both boundary types if available.
est. as @ -- *
ABS ERP | -- people | --
2021 Census | -- people
Sales Activity
Curious about local property values? Filter the chart to assess the volume and appreciation (including resales) trends and regional comparisons, or scroll to the map below view this information at an individual property level.
Find a Recent Sale
Sales Detail
Population
The Gap is positioned among the lower quartile of areas assessed nationally for population growth based on AreaSearch's assessment of recent, and medium term trends
Based on AreaSearch's analysis, The Gap's population is around 18,161 as of Nov 2025. This reflects an increase of 1,062 people since the 2021 Census, which reported a population of 17,099 people. The change is inferred from the estimated resident population of 18,147 from the ABS as of June 2024 and an additional 82 validated new addresses since the Census date. This level of population equates to a density ratio of 1,481 persons per square kilometer, which is above the average seen across national locations assessed by AreaSearch. The Gap's growth rate of 6.2% since census positions it within 1.8 percentage points of the SA3 area (8.0%), demonstrating competitive growth fundamentals. Population growth for the area was primarily driven by overseas migration that contributed approximately 83.9% of overall population gains during recent periods.
AreaSearch is adopting ABS/Geoscience Australia projections for each SA2 area, as released in 2024 with 2022 as the base year. For areas not covered by this data and years post-2032, Queensland State Government's SA2 area projections are adopted, released in 2023 based on 2021 data. It should be noted that these state projections do not provide age category splits; hence where utilised, AreaSearch is applying proportional growth weightings in line with the ABS Greater Capital Region projections for each age cohort, released in 2023 based on 2022 data. Looking at population projections moving forward, Over this period, projections indicate a decline in overall population, with the area's population expected to decline by 63 persons by 2041 according to this methodology. However, growth across specific age cohorts is anticipated, led by the 85 and over age group, which is projected to grow by 605 people.
Frequently Asked Questions - Population
Development
AreaSearch analysis of residential development drivers sees The Gap recording a relatively average level of approval activity when compared to local markets analysed countrywide
The Gap has recorded approximately 30 residential properties granted approval annually. Over the past five financial years, from FY21 to FY25, around 150 homes have been approved, with an additional 5 approved so far in FY26. On average, about 5.5 new residents arrive per dwelling constructed each year during this period.
This supply lagging demand indicates heightened buyer competition and pricing pressures. The average construction value of new properties is $485,000, suggesting a focus on the premium market with high-end developments. In FY26, $1.4 million in commercial development approvals have been recorded, reflecting the area's residential nature. Compared to Greater Brisbane, The Gap has significantly less development activity, 59.0% below the regional average per person. This limited new supply generally supports stronger demand and values for established dwellings.
Relative to the national average, The Gap's development activity is also under the national average, indicating its established nature and suggesting potential planning limitations. Recent construction comprises 92.0% standalone homes and 8.0% medium and high-density housing, preserving the area's suburban nature with an emphasis on detached housing attracting space-seeking buyers. With around 664 people per dwelling approval, The Gap reflects a highly mature market. Population projections showing stability or decline suggest reduced housing demand pressures in the future, benefiting potential buyers.
Frequently Asked Questions - Development
Infrastructure
The Gap has strong levels of nearby infrastructure activity, ranking in the top 40% nationally
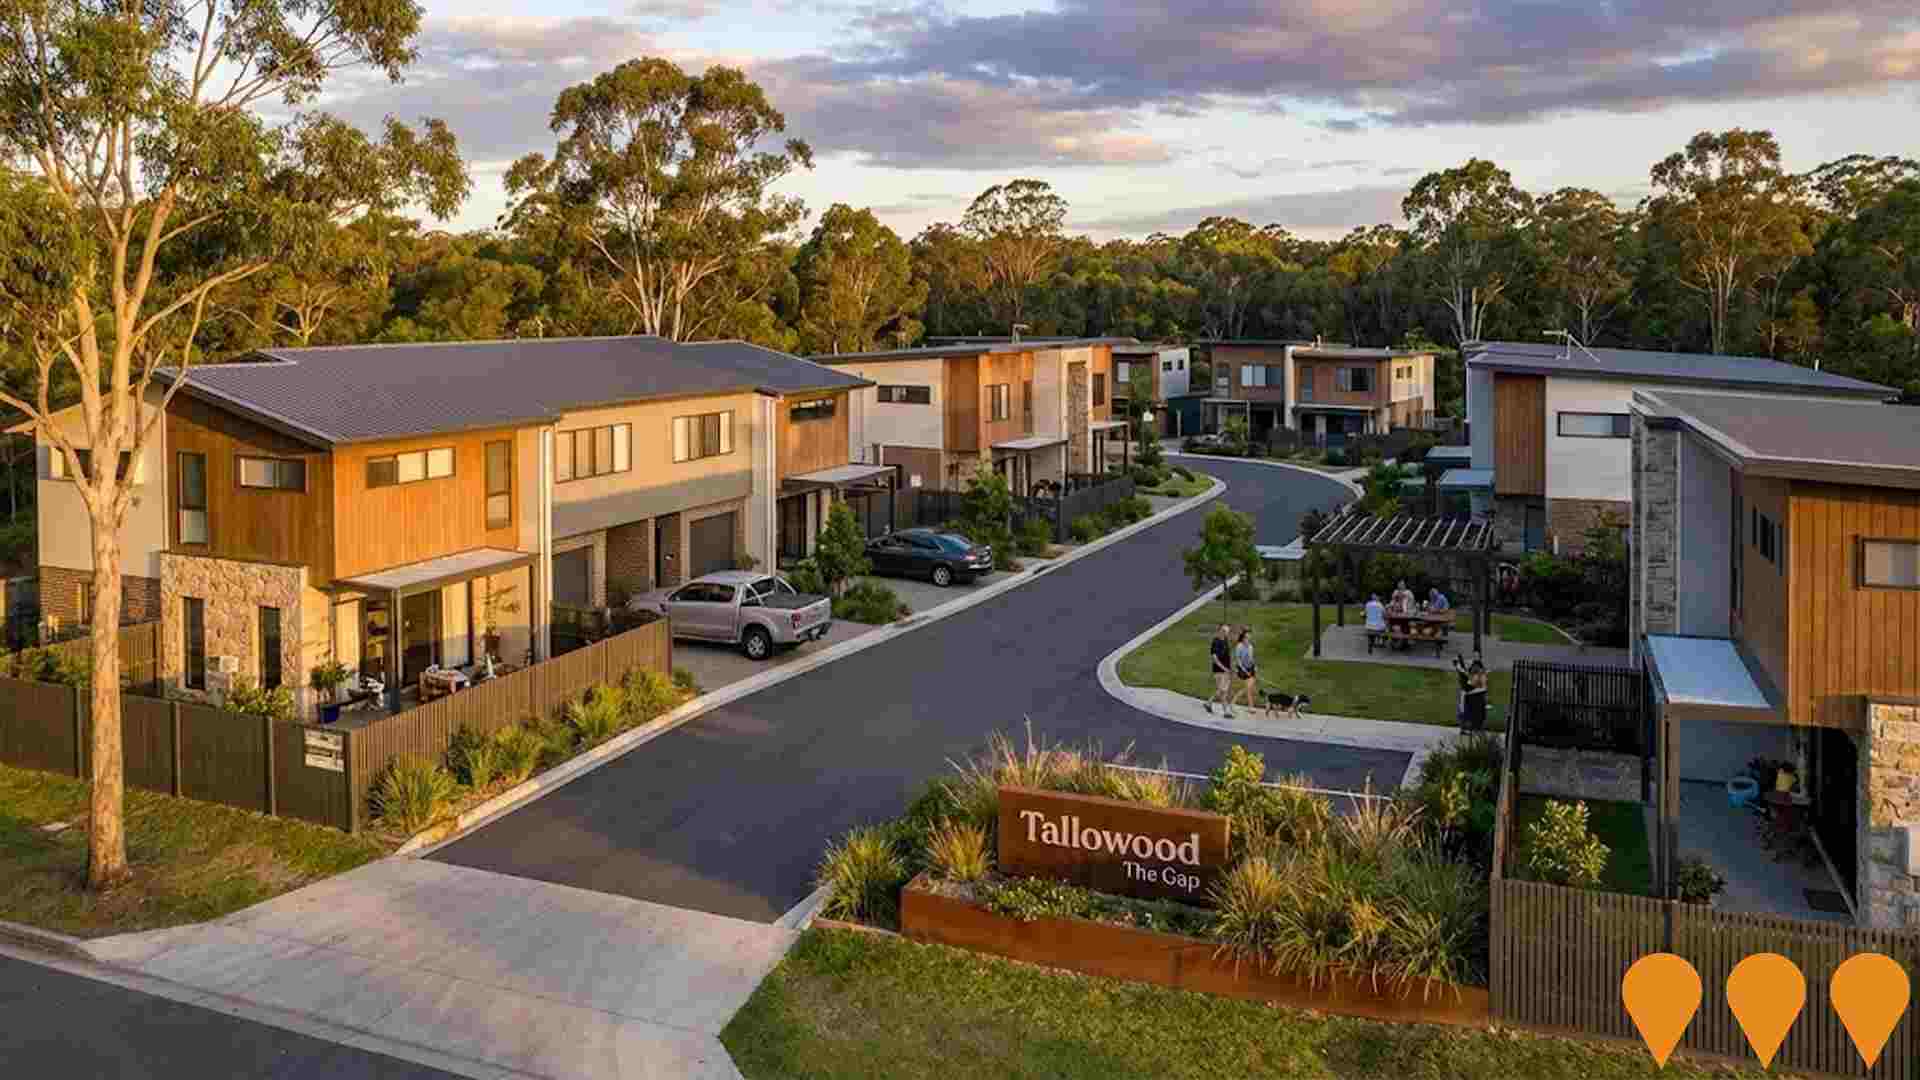
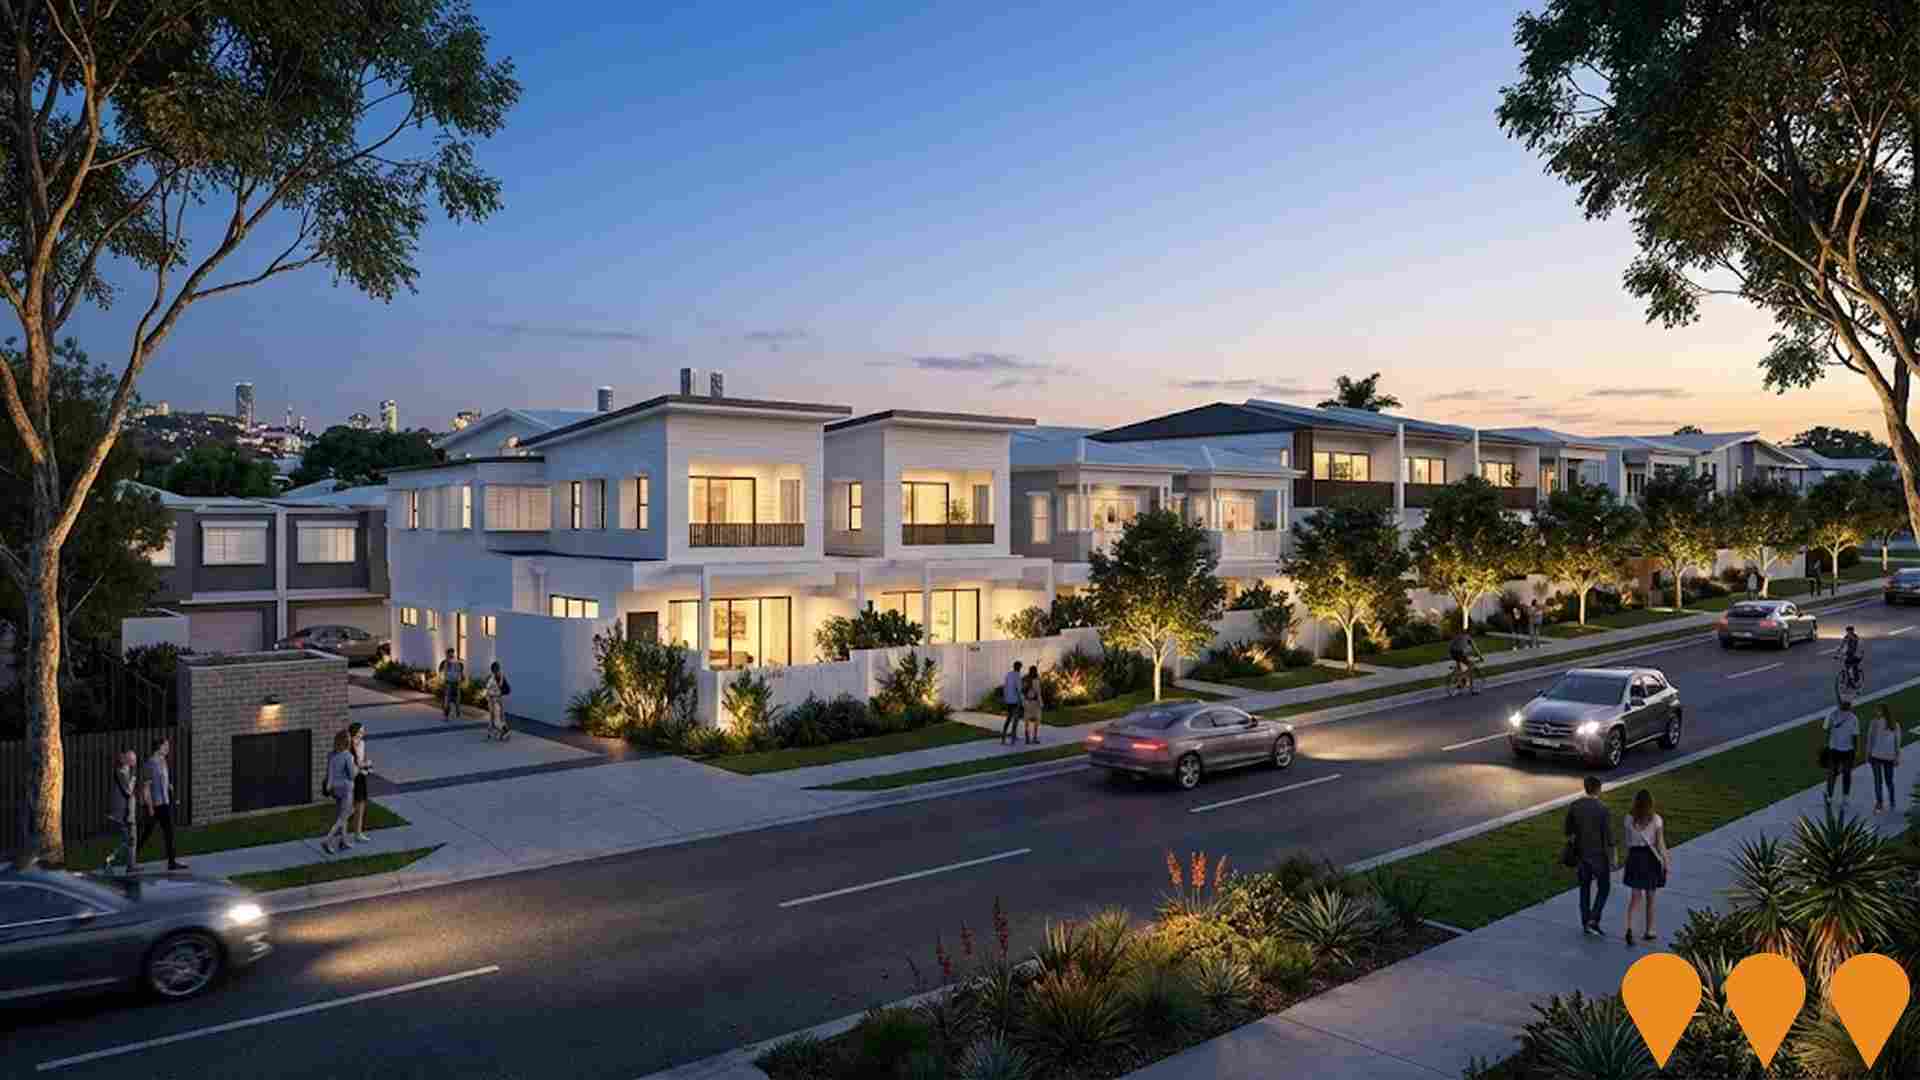
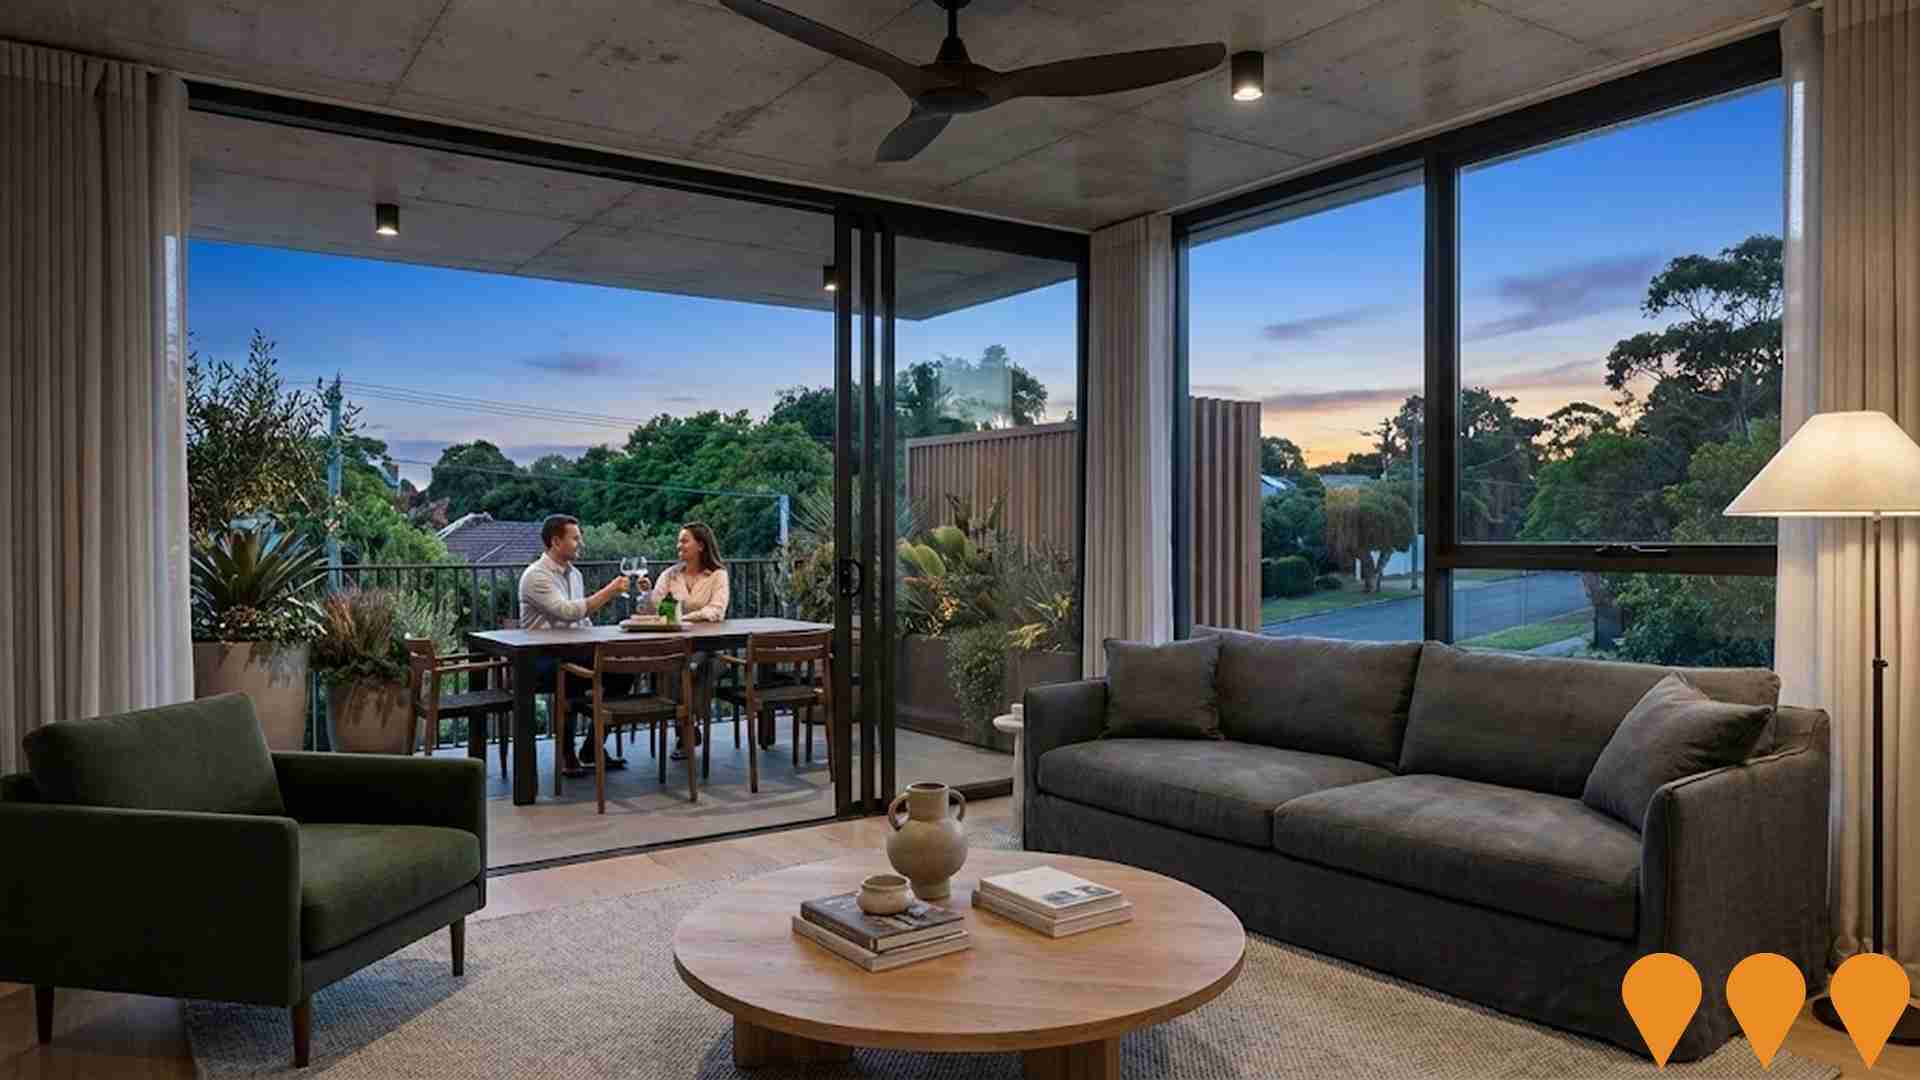
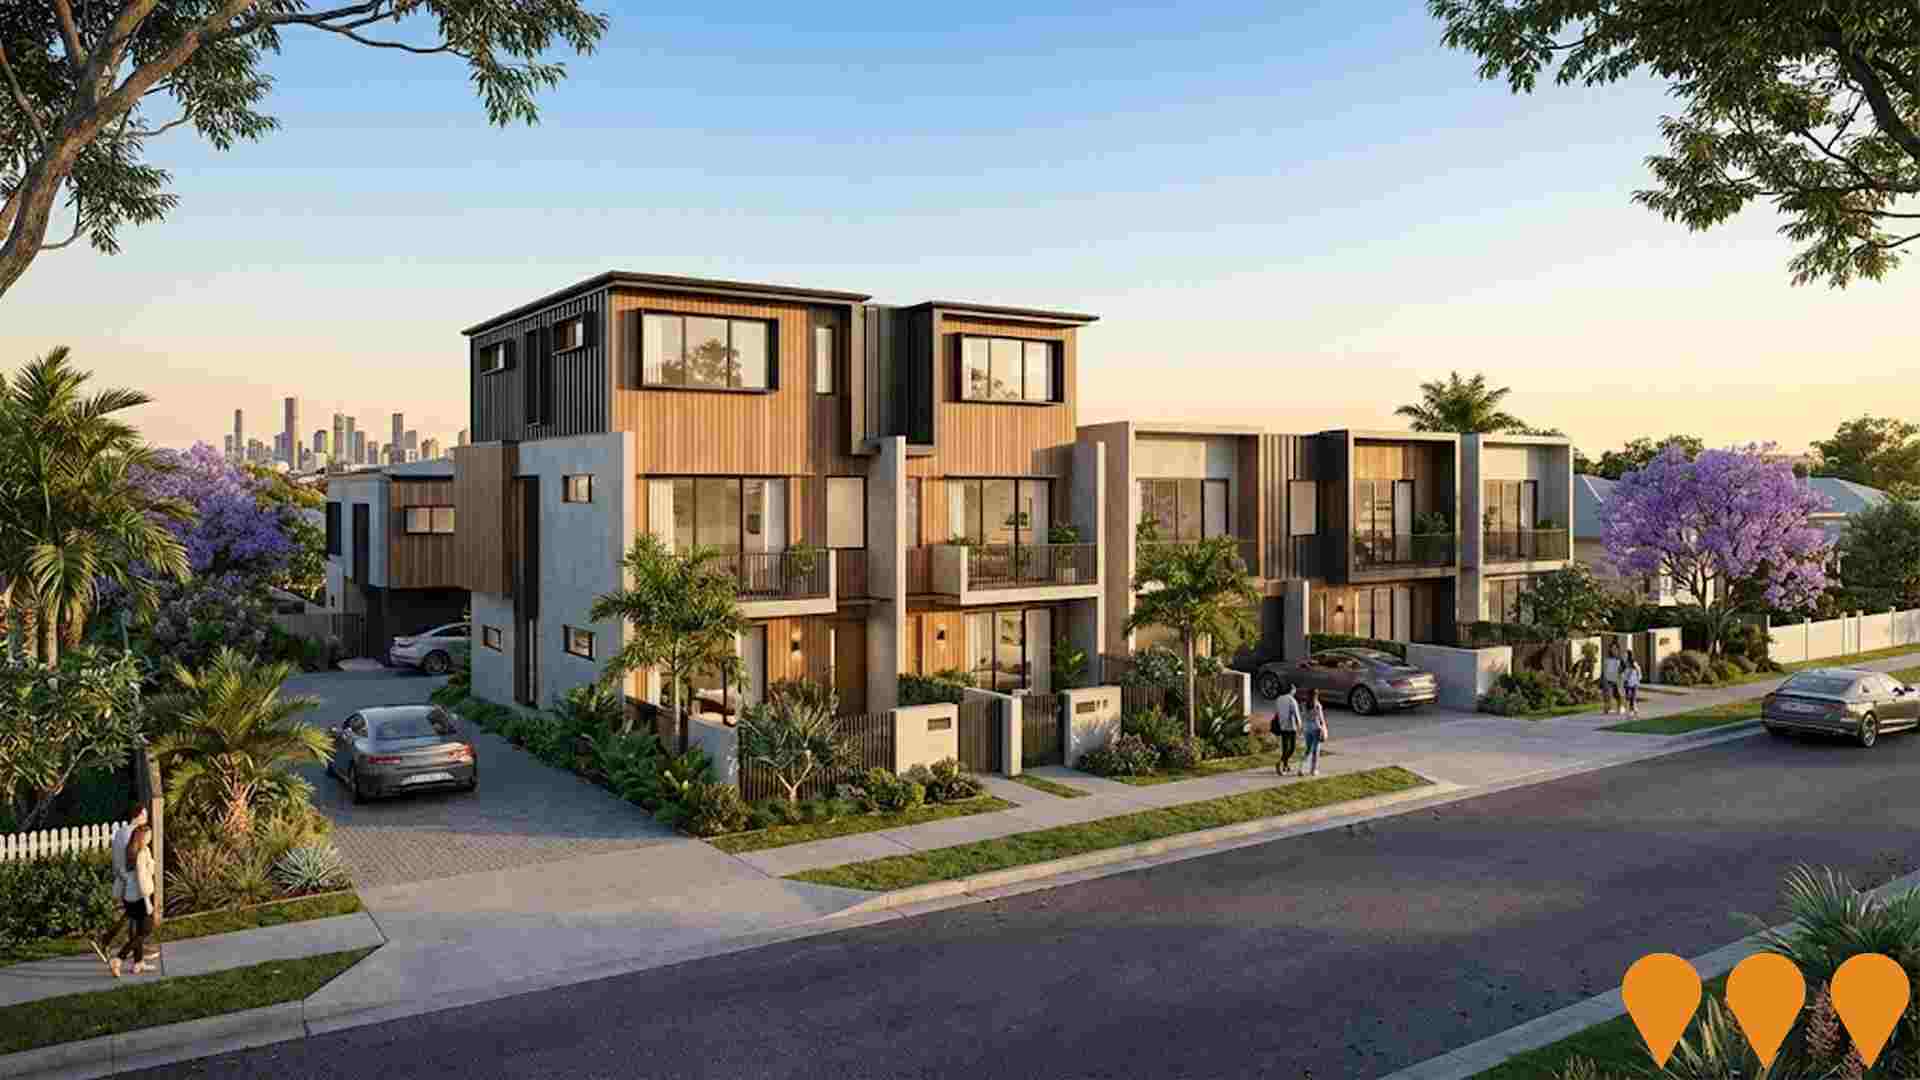
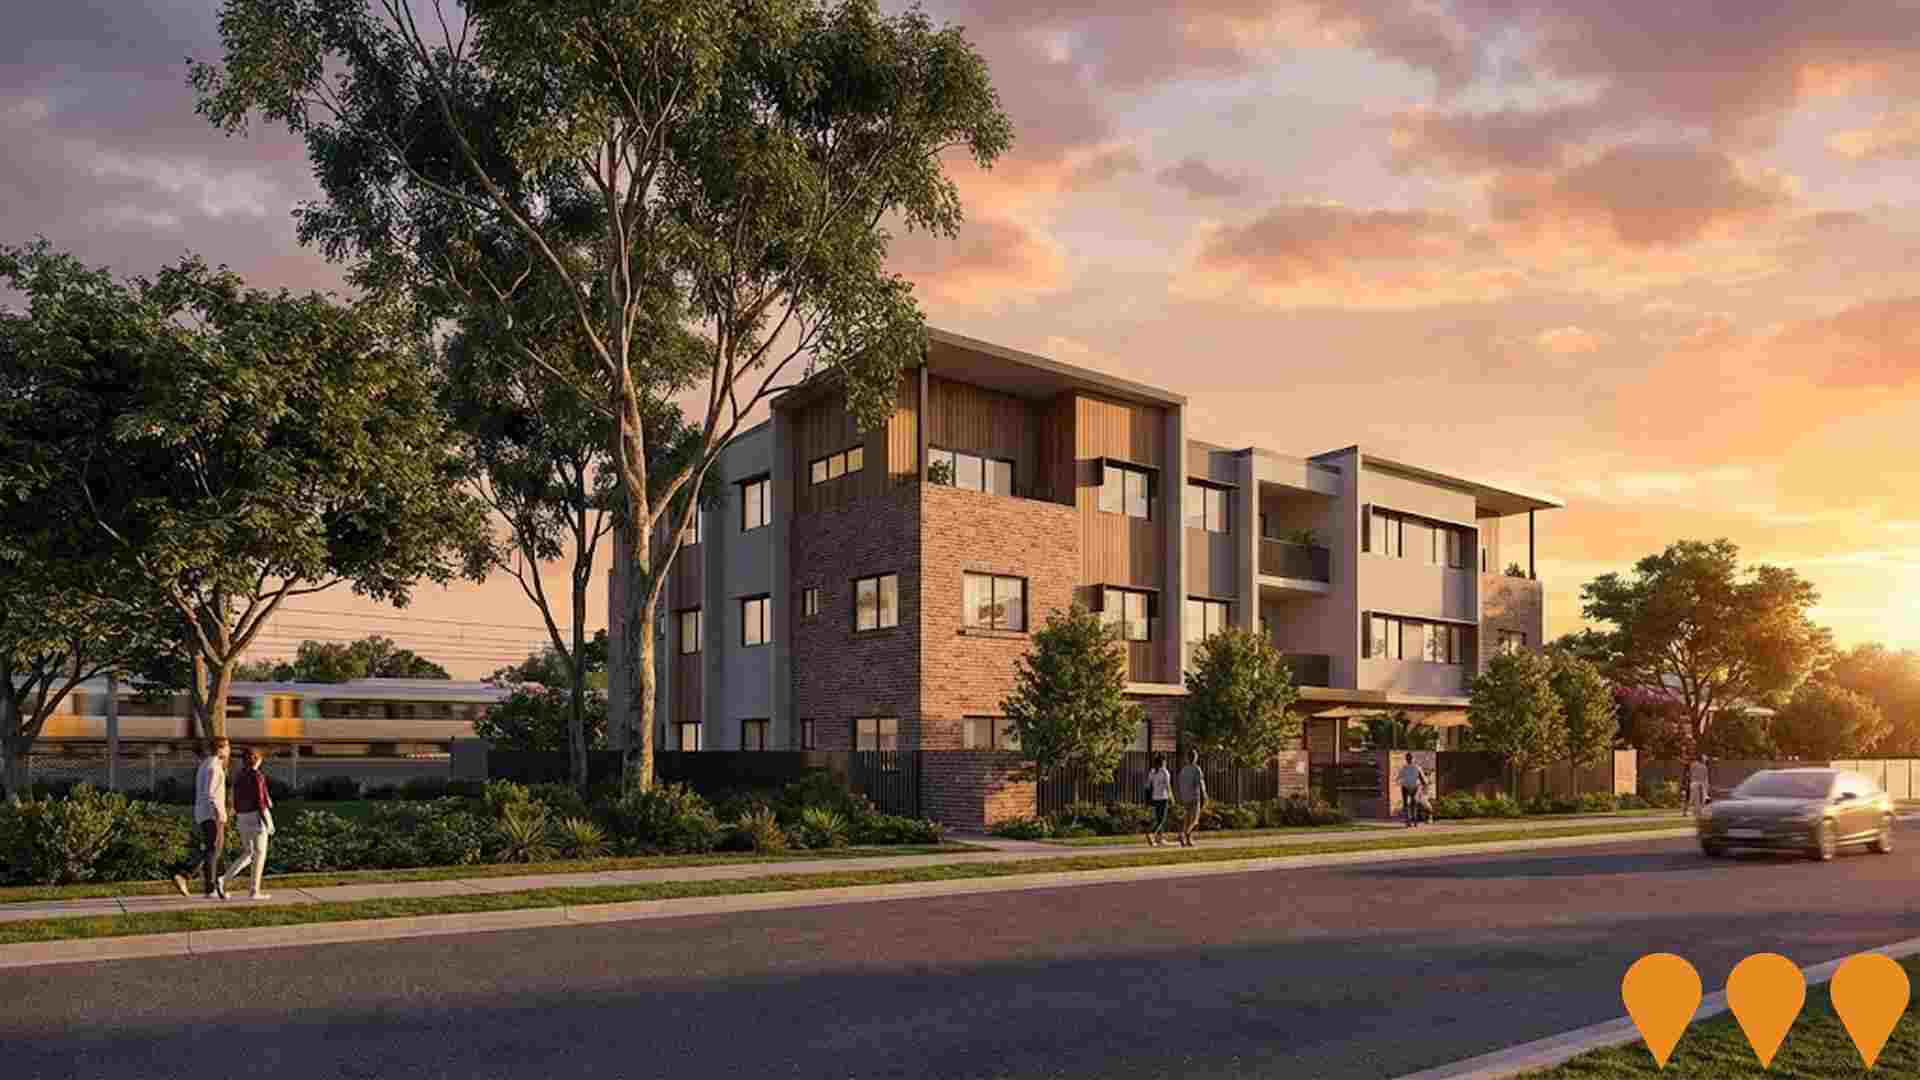
Changes to local infrastructure significantly impact an area's performance. AreaSearch identified ten projects likely influencing the area. Notable projects include Waterworks Road Mixed-Use Development, Tallowood The Gap, Childcare Centre at 1019-1023 Waterworks Road in The Gap, and another Childcare Centre at 689 Waterworks Road & 6 Greenlanes Road in The Gap. Below is a list of projects likely most relevant.
Professional plan users can use the search below to filter and access additional projects.
INFRASTRUCTURE SEARCH
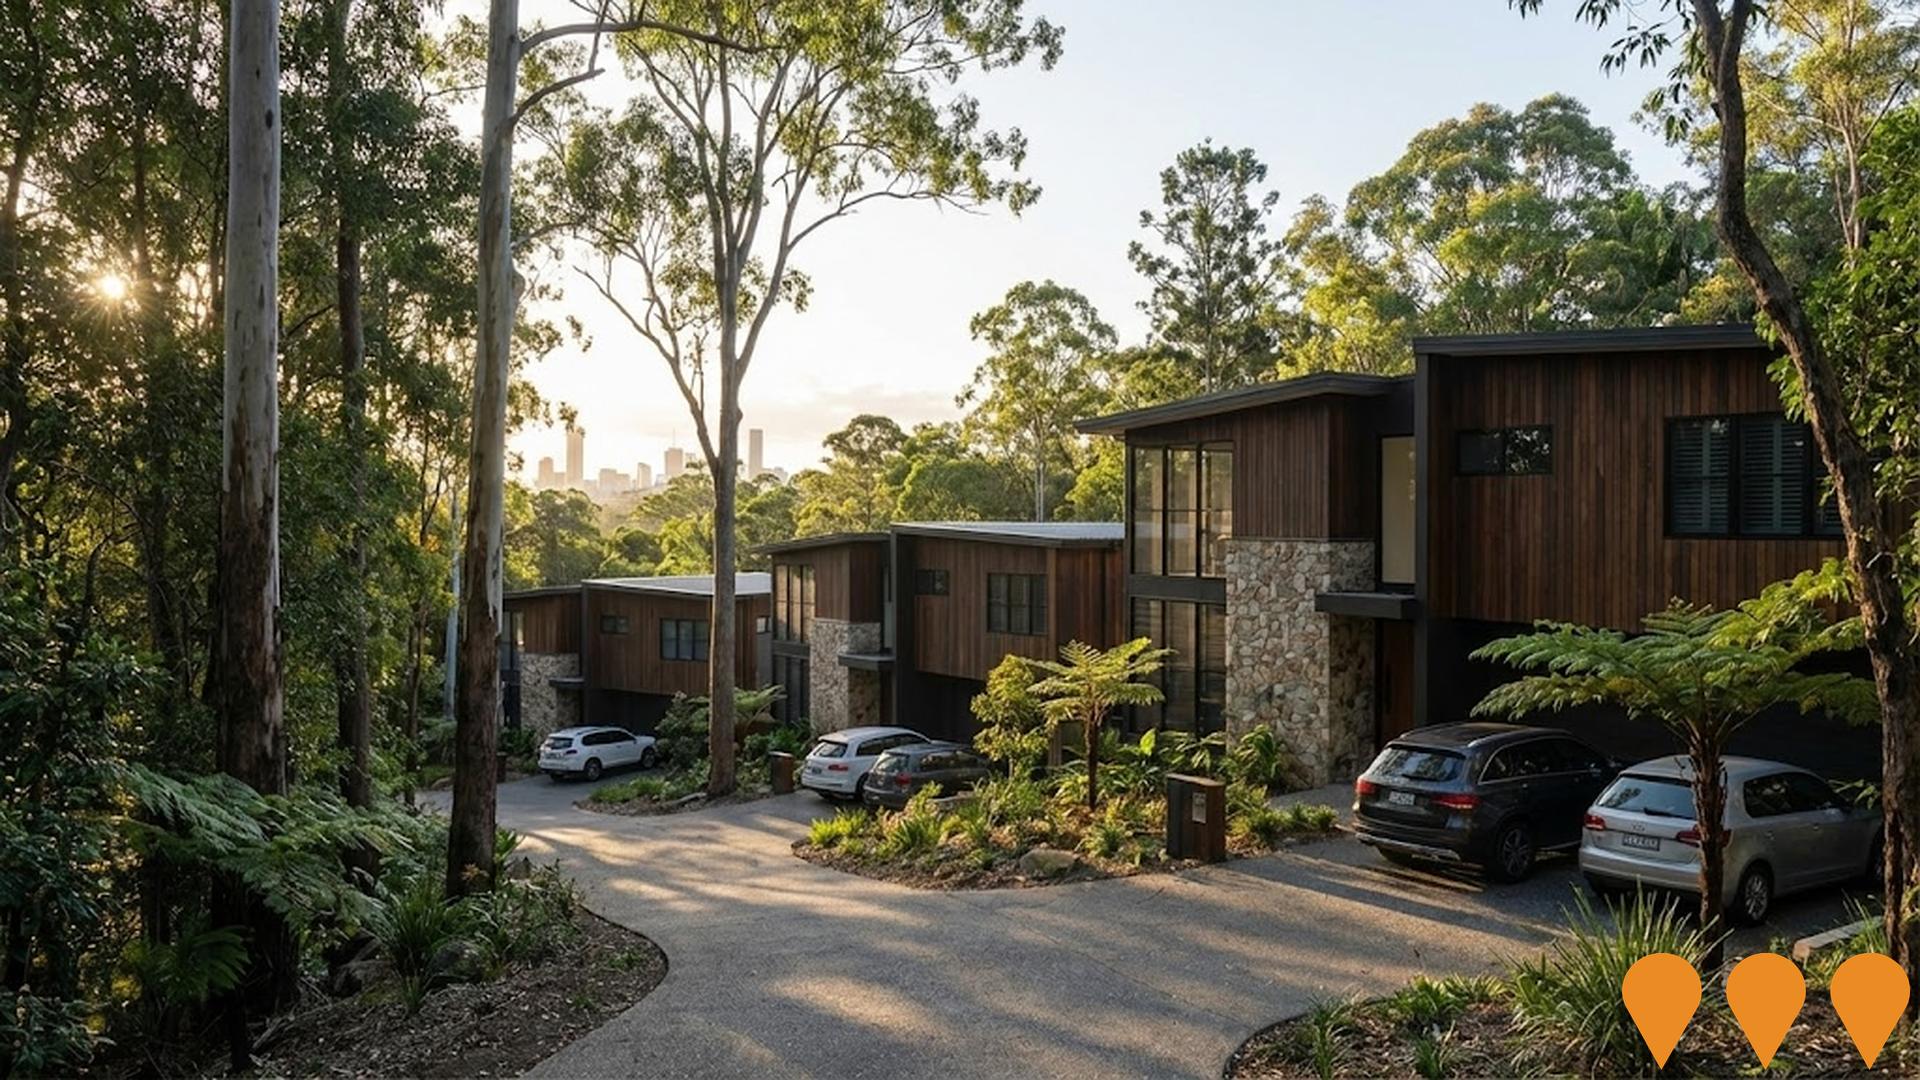
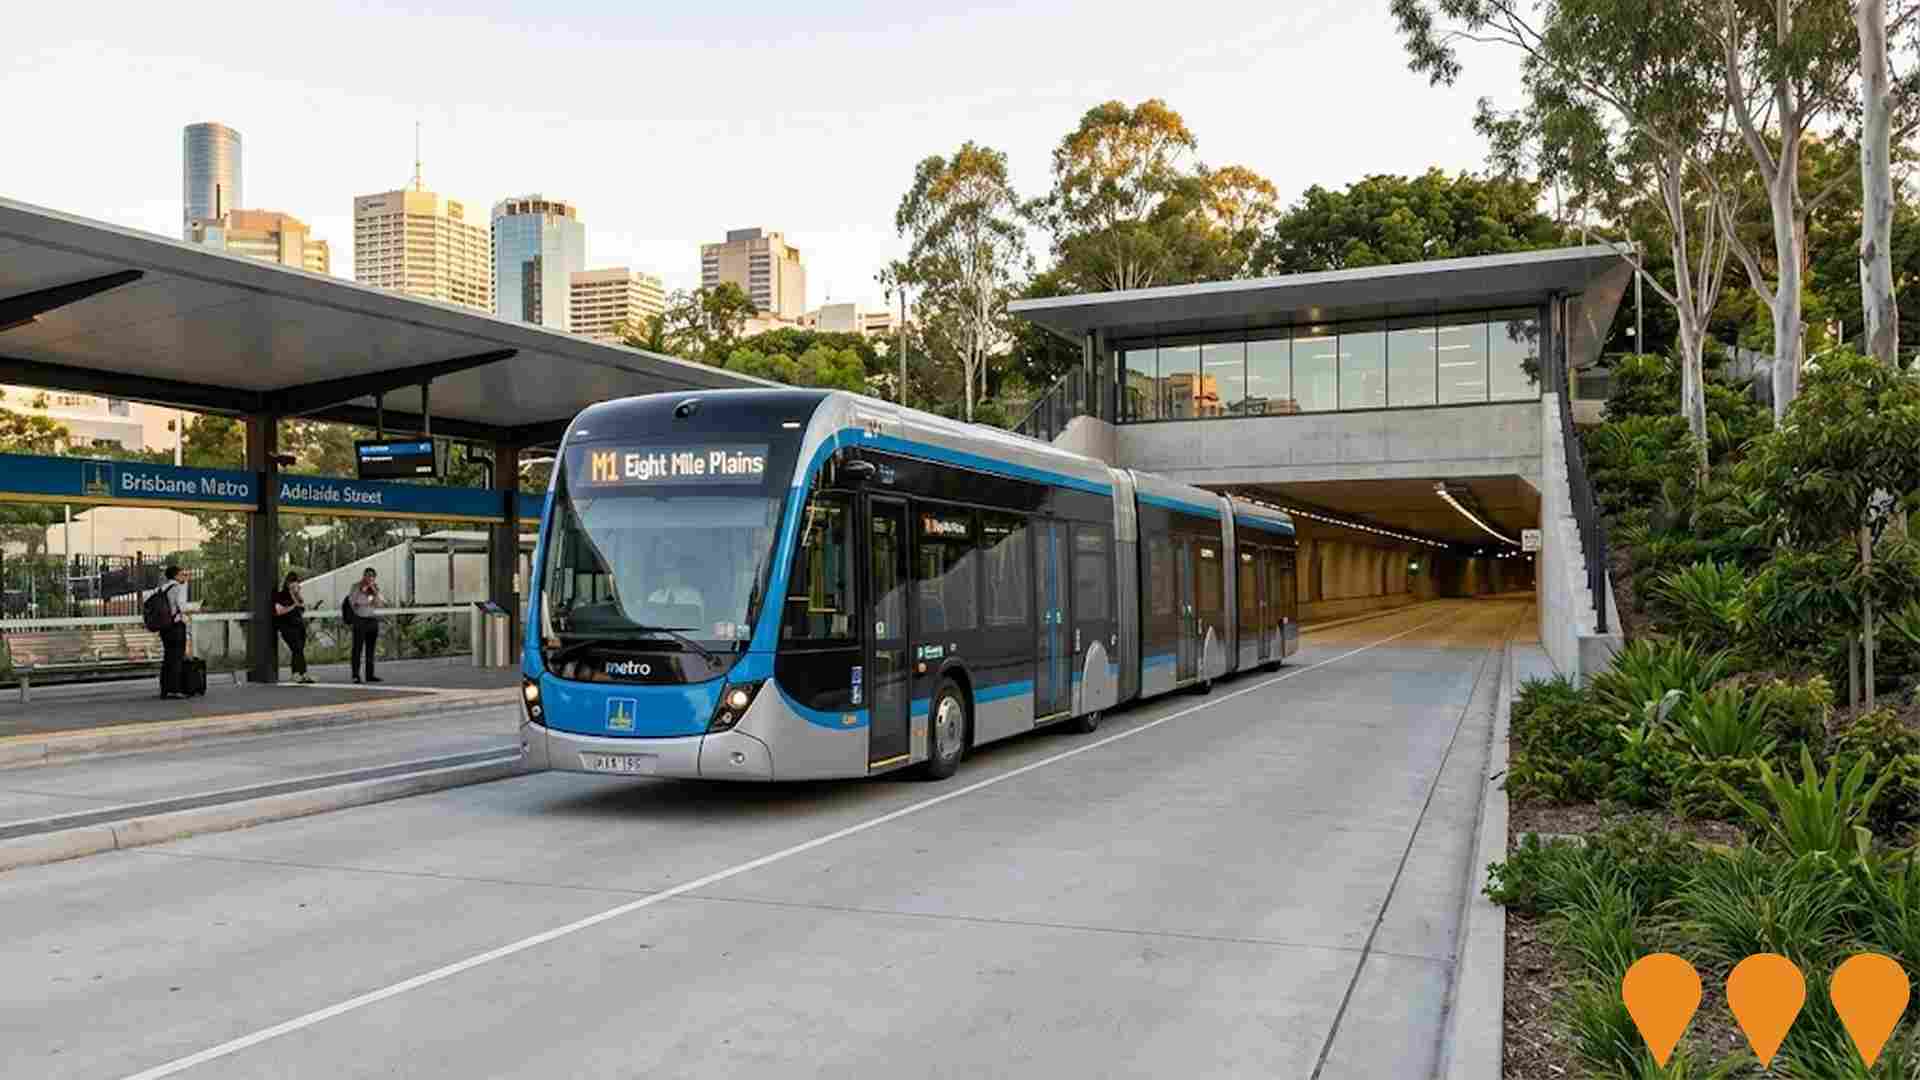
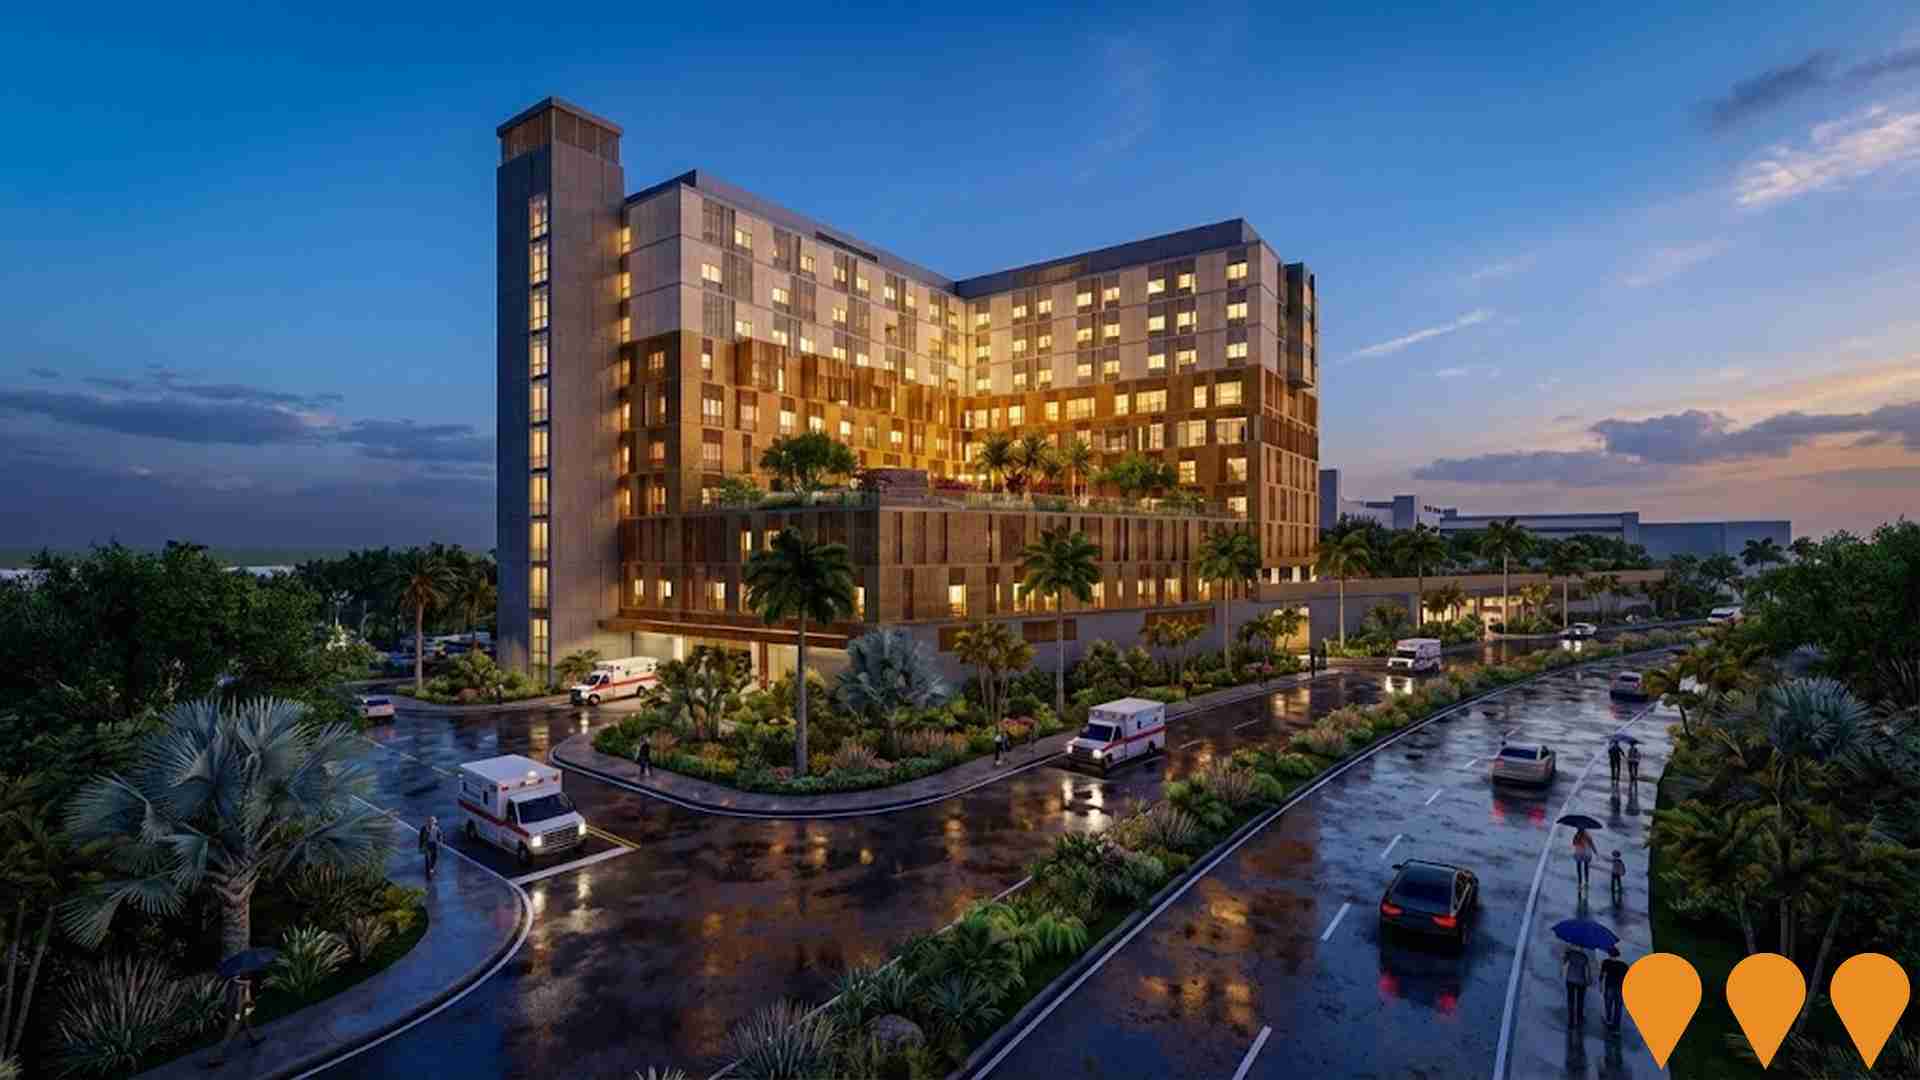
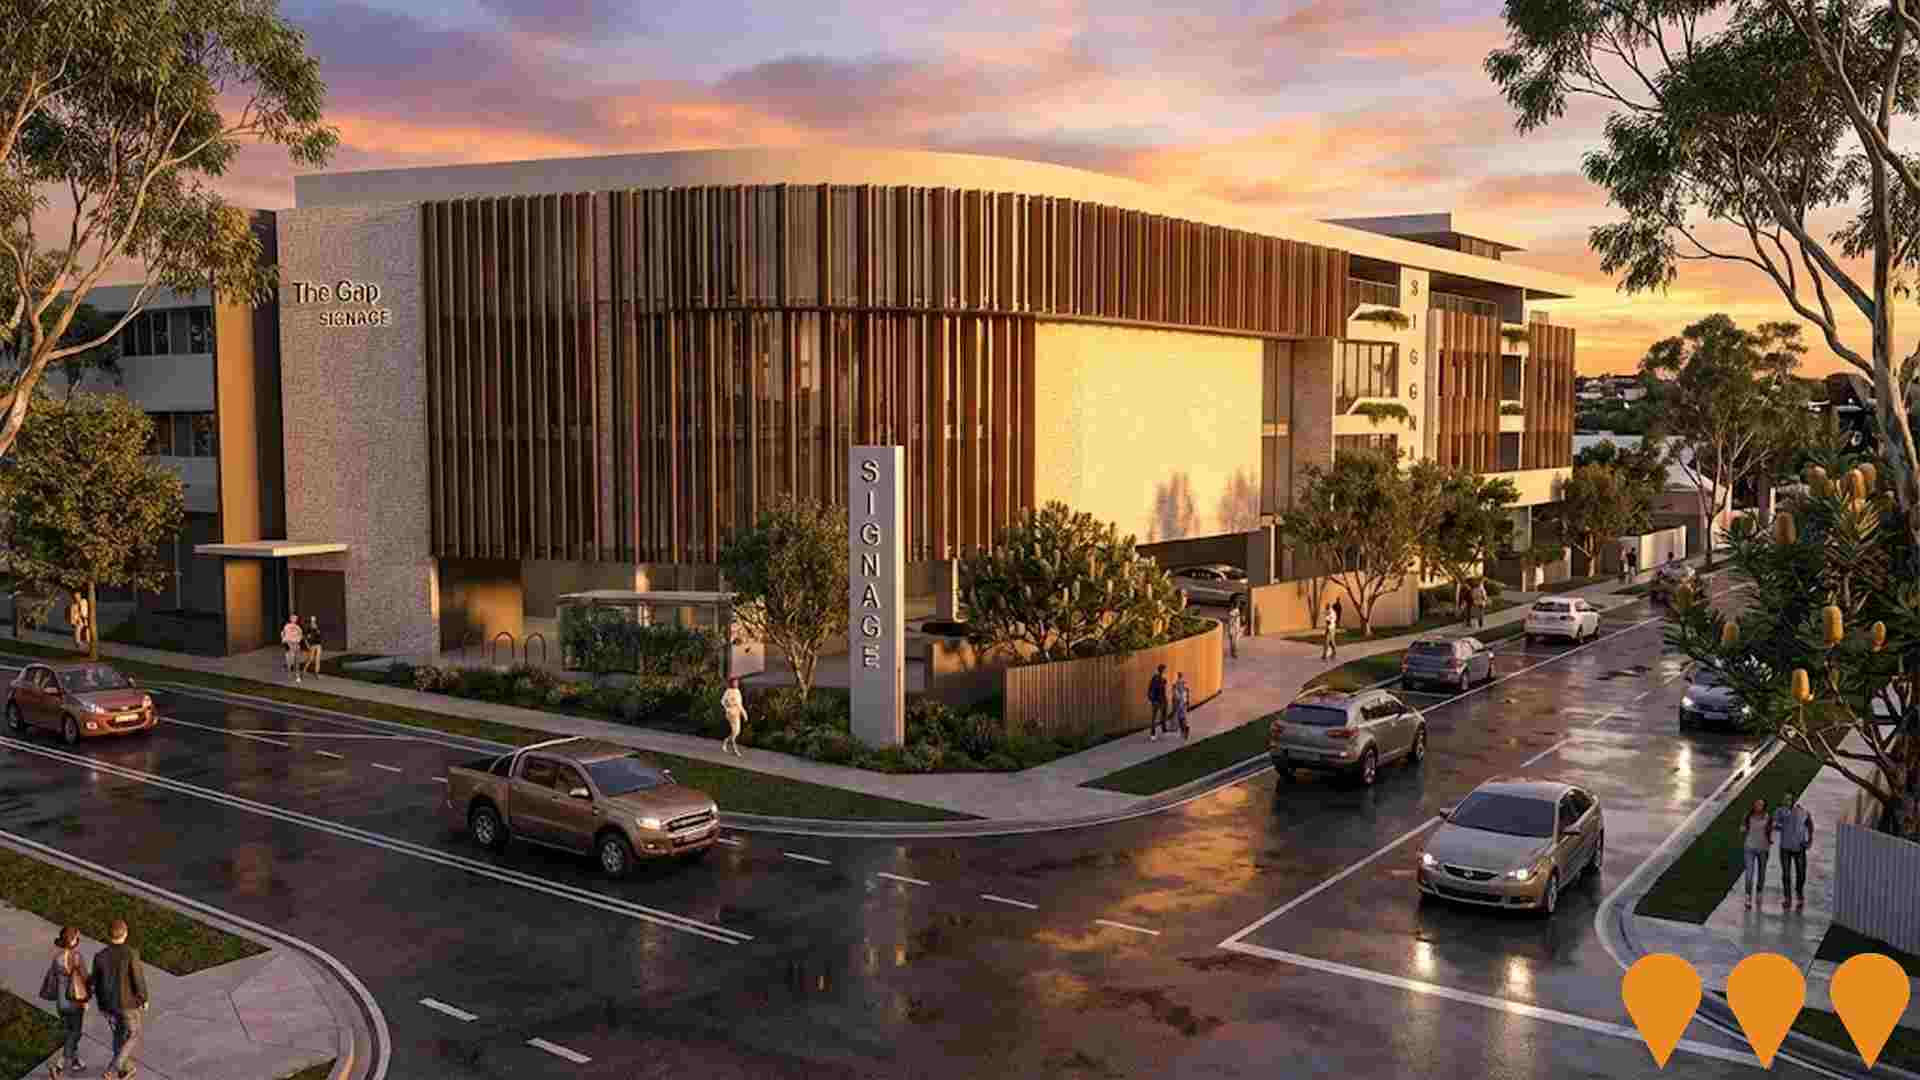
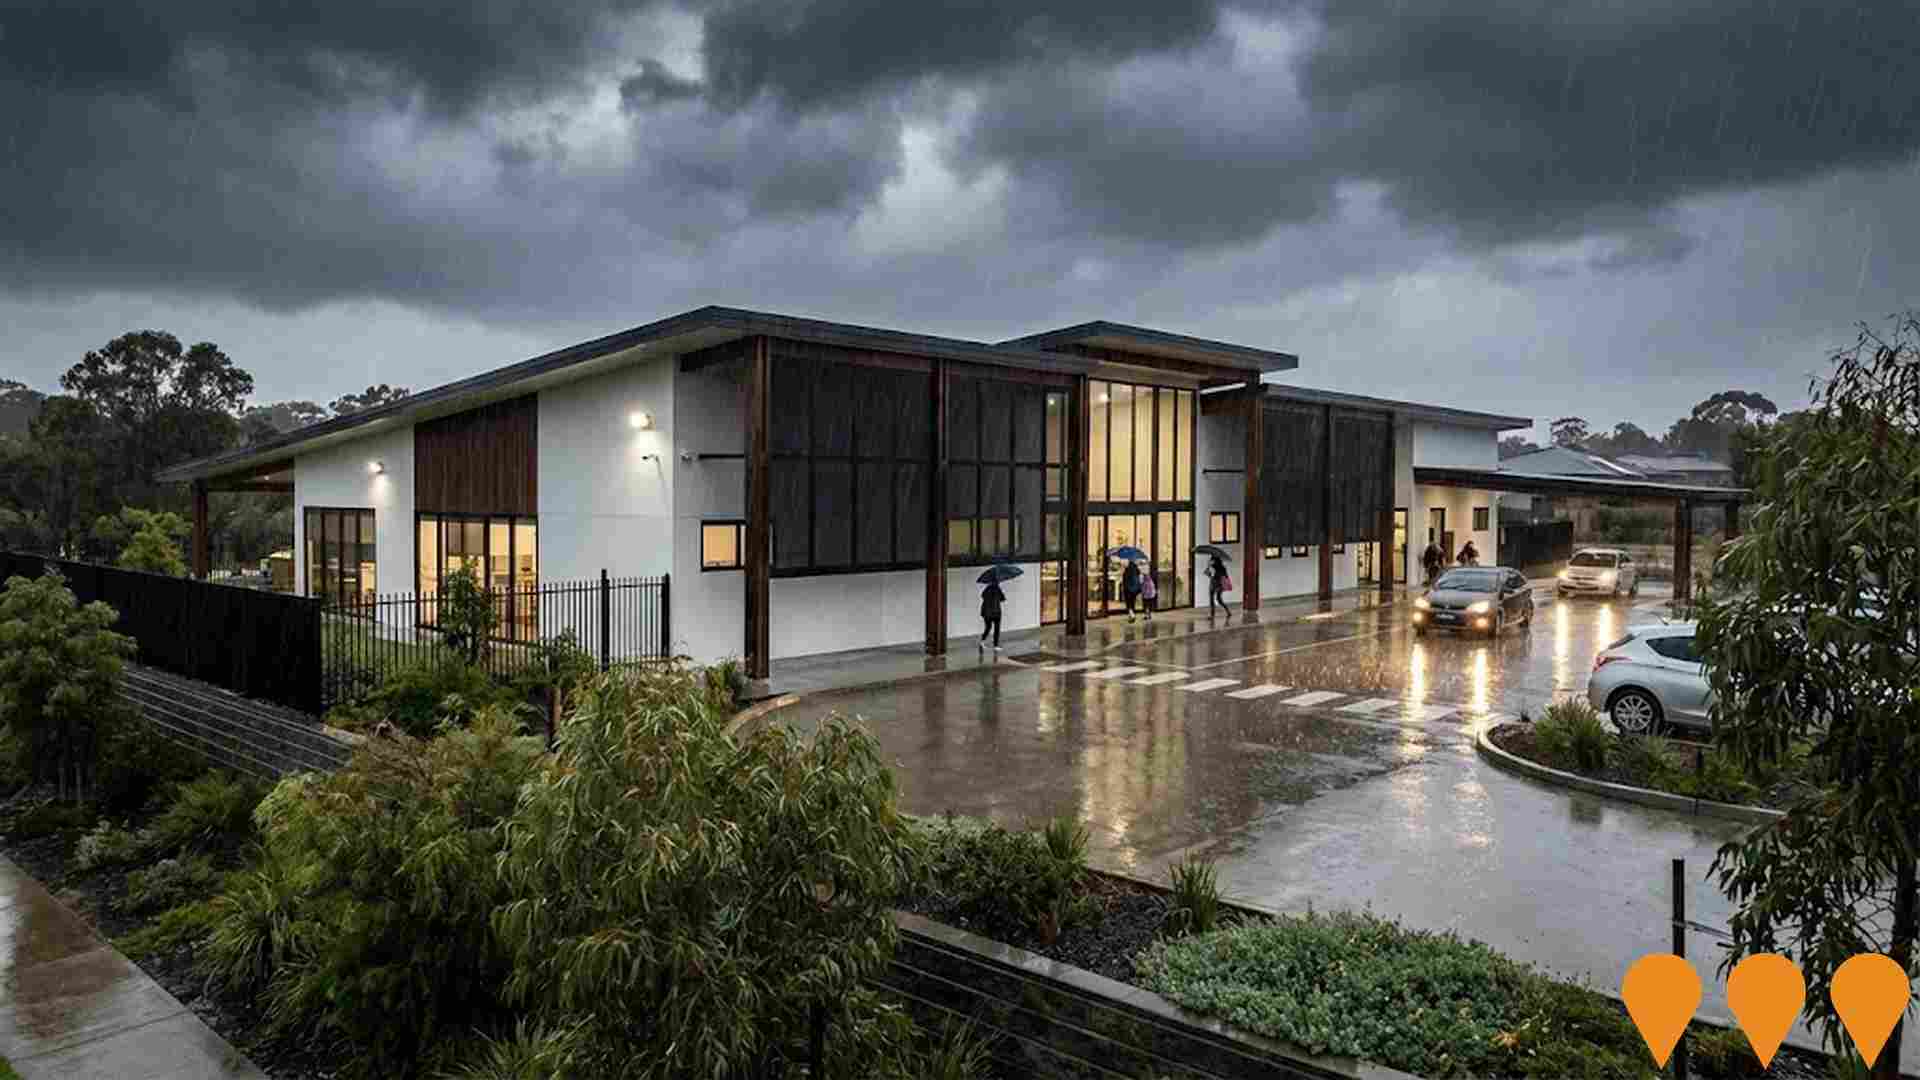
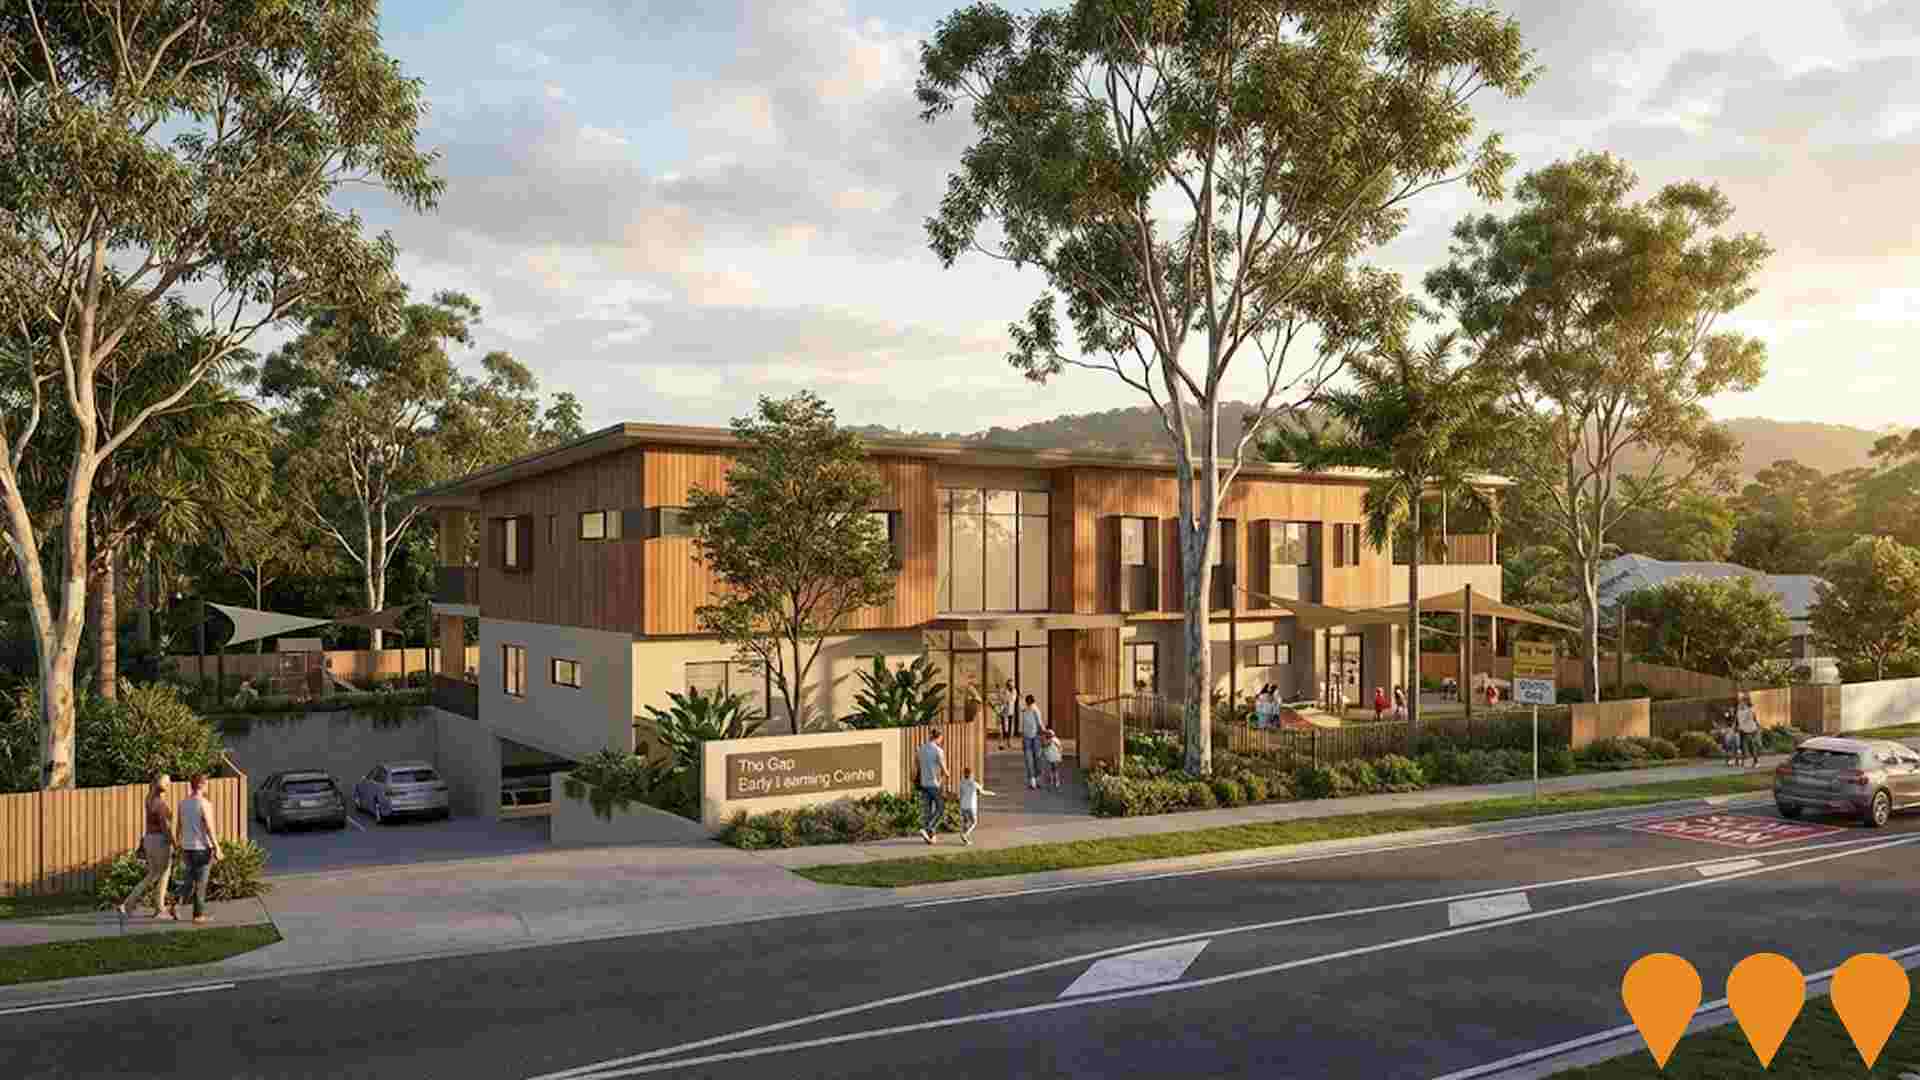
 Denotes AI-based impression for illustrative purposes only, not to be taken as definitive under any circumstances. Please follow links and conduct other investigations from the project's source for actual imagery. Developers and project owners wishing us to use original imagery please Contact Us and we will do so.
Frequently Asked Questions - Infrastructure
Brisbane Metro
High-capacity electric bus rapid transit system serving 21km of dedicated busways using 60 bi-articulated buses with 150-180 passenger capacity. Features two routes: M1 (Eight Mile Plains to Roma Street, operational June 2025) and M2 (RBWH to UQ Lakes, operational January 2025) serving 18 stations including 11 interchange stations. Includes new Adelaide Street tunnel, upgraded Victoria Bridge for pedestrians and active transport, and connections to Cross River Rail. Services every 3-5 minutes during peak periods with zero-emission vehicles and fast charging infrastructure.
Building Future Hospitals Program
Queensland's flagship hospital infrastructure program delivering over 2,600 new and refurbished public hospital beds by 2031-32. Includes major expansions at Ipswich Hospital (Stage 2), Logan Hospital, Princess Alexandra Hospital, Townsville University Hospital, Gold Coast University Hospital and multiple new satellite hospitals and community health centres.
The Quarry by Frasers Property Keperra
Iconic Brisbane hillside transformation rising 170 metres above sea level. Large-scale residential community development featuring quality homes, parklands, and recreational facilities in a elevated bushland setting.

The Quarry - Keperra Quarry Redevelopment
Redevelopment of the former Keperra granite quarry into The Quarry, a 48.7 hectare masterplanned hillside community in Brisbane with around 400 homesites, extensive green space and the residents only ClubQ recreation precinct featuring multiple pools, wellness and gym facilities, community lawns and entertaining spaces. Civil and amenity works are well advanced, ClubQ stage two has opened with additional pools and wellness offerings, and new elevated land releases such as The Promenade Collection and The Summit are selling while individual homes continue to be designed and built across the estate. :contentReference[oaicite:0]{index=0} :contentReference[oaicite:1]{index=1} :contentReference[oaicite:2]{index=2}

Waterworks Road Mixed-Use Development
Council-approved mixed-use scheme on a 5,394sqm site comprising a childcare centre (approx. 86 places), health care services, 26 retirement units and 5 additional dwellings across three buildings. The site was marketed and sold by receivers in July 2025; a new proponent may revise or proceed with the existing approval.
Childcare Centre - 1019-1023 Waterworks Road, The Gap
Development application for a childcare centre at 1019-1023 Waterworks Road, The Gap. The Brisbane City Council application (A005271157) for a material change of use was refused, and the subsequent Planning and Environment Court appeal was dismissed. No current approval is in place.
Childcare Centre - 689 Waterworks Road & 6 Greenlanes Road, The Gap
A two-storey childcare centre previously proposed for up to ~121 places with basement parking and two external play areas. Two separate development applications for this site (A004761547 in 2017-18 and A005091534 in 2018-19) were both withdrawn by the applicants following impact assessment and public notification. There is no current approval in force on Brisbane City Council's Development.i as of 17 August 2025.
Legacy Way Tunnel
4.6km toll tunnel connecting Toowong to Kelvin Grove, significantly improving traffic flow for Chapel Hill residents. Opened 2015, continues to provide major transport benefits reducing travel times to CBD and airport via tunnel connections.

Employment
The Gap ranks among the top 25% of areas assessed nationally for overall employment performance
The Gap's workforce is highly educated with significant representation in professional services. The unemployment rate stands at 2.2%.
As of September 2025, 9,590 residents are employed, with an unemployment rate of 1.8% below Greater Brisbane's rate of 4.0%. Workforce participation is 67.6%, slightly higher than Greater Brisbane's 64.5%. Key industries for employment include health care & social assistance, professional & technical services, and education & training. The Gap has a strong specialization in professional & technical services, with an employment share of 1.7 times the regional level.
Manufacturing employs only 3.3% of local workers, below Greater Brisbane's 6.4%. Over the year to September 2025, labour force levels decreased by 3.6%, alongside a 3.6% decline in employment, with unemployment remaining essentially unchanged. In contrast, Greater Brisbane recorded employment growth of 3.8% and a decrease in unemployment of 0.5 percentage points. State-level data to 25-Nov shows Queensland's employment contracted by 0.01%, with an unemployment rate of 4.2%. National employment forecasts from May-25 project national employment growth of 6.6% over five years and 13.7% over ten years, but industry-specific projections suggest The Gap's employment should increase by 7.2% over five years and 14.7% over ten years.
Frequently Asked Questions - Employment
Income
The economic profile demonstrates exceptional strength, placing the area among the top 10% nationally based on comprehensive AreaSearch income analysis
AreaSearch's aggregation of ATO data released for financial year 2022 shows The Gap SA2 had a median taxpayer income of $64,767 and an average income of $89,293. Nationally, these figures are high compared to Greater Brisbane's median ($55,645) and average ($70,520). Based on Wage Price Index growth from financial year 2022 to September 2025 (13.99%), estimated incomes would be approximately $73,828 (median) and $101,785 (average). Census 2021 data ranks The Gap's household, family, and personal incomes between the 81st and 92nd percentiles nationally. Income distribution shows 29.0% of residents earn $1,500 - $2,999 weekly, reflecting regional patterns (33.3%). A substantial proportion, 42.6%, earns above $3,000 weekly, indicating strong economic capacity. After housing costs, residents retain 87.9% of income, reflecting strong purchasing power and The Gap's SEIFA income ranking in the 9th decile.
Frequently Asked Questions - Income
Housing
The Gap is characterized by a predominantly suburban housing profile, with above-average rates of outright home ownership
The Gap's dwelling structure, as per the latest Census, consisted of 92.4% houses and 7.6% other dwellings (semi-detached, apartments, 'other' dwellings). This compares to Brisbane metro's 81.6% houses and 18.5% other dwellings. Home ownership in The Gap stood at 39.4%, with mortgaged dwellings at 45.4% and rented ones at 15.1%. The median monthly mortgage repayment was $2,266, higher than Brisbane metro's average of $2,167. The median weekly rent figure was $490, compared to Brisbane metro's $400. Nationally, The Gap's mortgage repayments were significantly higher than the Australian average of $1,863, and rents were substantially above the national figure of $375.
Frequently Asked Questions - Housing
Household Composition
The Gap features high concentrations of family households, with a higher-than-average median household size
Family households comprise 83.0% of all households, including 43.8% couples with children, 26.8% couples without children, and 11.6% single parent families. Non-family households make up the remaining 17.0%, with lone person households at 15.3% and group households comprising 1.7% of the total. The median household size is 2.9 people, which is larger than the Greater Brisbane average of 2.7.
Frequently Asked Questions - Households
Local Schools & Education
The Gap demonstrates exceptional educational outcomes, ranking among the top 5% of areas nationally based on AreaSearch's comprehensive analysis of qualification and performance metrics
In The Gap, educational attainment is notably high with 46.9% of residents aged 15+ holding university qualifications, compared to the broader benchmarks of 25.7% in Queensland (QLD) and 30.4% in Australia. This area's educational advantage is significant, positioning it strongly for knowledge-based opportunities. Bachelor degrees are most prevalent at 29.6%, followed by postgraduate qualifications at 12.3% and graduate diplomas at 5.0%. Trade and technical skills are also prominent, with 25.5% of residents aged 15+ holding vocational credentials – advanced diplomas at 11.3% and certificates at 14.2%.
Educational participation is notably high, with 32.6% of residents currently enrolled in formal education. This includes 10.9% in primary education, 10.9% in secondary education, and 6.5% pursuing tertiary education.
Frequently Asked Questions - Education
Schools Detail
Nearby Services & Amenities
Transport
Transport servicing is moderate compared to other areas nationally based on assessment of service frequency, route connectivity and accessibility
Transport analysis shows 73 active stops operating within The Gap. These are mixed bus services. They are covered by 8 routes offering 1,203 weekly passenger trips combined.
Accessibility is rated good with residents usually 255 meters from nearest stop. Service frequency averages 171 trips daily across all routes, equating to about 16 weekly trips per individual stop.
Frequently Asked Questions - Transport
Transport Stops Detail
Health
The level of general health in The Gap is notably higher than the national average with both young and old age cohorts seeing low prevalence of common health conditions
The Gap demonstrates above-average health outcomes with both young and old age cohorts seeing low prevalence of common health conditions. The rate of private health cover is exceptionally high at approximately 64% of the total population (11,623 people), compared to 61.5% across Greater Brisbane and a national average of 55.3%. Mental health issues impact 8.3% and asthma impacts 7.8% of residents in The Gap, while 70.3% declare themselves completely clear of medical ailments, compared to 69.6% across Greater Brisbane.
As of 2016, 18.0% of residents are aged 65 and over (3,274 people), higher than the 15.2% in Greater Brisbane. Health outcomes among seniors in The Gap perform even better than the general population in health metrics.
Frequently Asked Questions - Health
Cultural Diversity
In terms of cultural diversity, The Gap records figures broadly comparable to the national average, as found in AreaSearch's assessment of a number of language and cultural background related metrics
The Gap's population showed above-average cultural diversity, with 10.6% speaking a language other than English at home and 25.0% born overseas. Christianity was the predominant religion, comprising 49.0%. While Judaism remained low at 0.1%, it was slightly higher compared to Greater Brisbane's 0.1%.
The top three ancestry groups were English (29.4%), Australian (23.1%), and Irish (11.7%). Notable divergences existed for French (0.9% vs regional 0.6%), Scottish (9.6% vs 8.9%), and South African (1.1% vs 0.8%) groups.
Frequently Asked Questions - Diversity
Age
The Gap's median age exceeds the national pattern
The Gap's median age is 42 years, which is significantly higher than the Greater Brisbane average of 36 and considerably older than the Australian median of 38. Compared to the Greater Brisbane average, the 45-54 cohort is notably over-represented at 16.3% locally, while the 25-34 year-olds are under-represented at 6.1%. According to the 2021 Census, the 15 to 24 age group has grown from 12.6% to 14.7% of the population, but the 25 to 34 cohort has declined from 7.2% to 6.1%. Demographic modeling suggests that The Gap's age profile will evolve significantly by 2041. The 85+ cohort shows the strongest projected growth at 136%, adding 567 residents to reach 985. Residents aged 65 and older represent 80% of anticipated growth, but population declines are projected for the 15 to 24 and 0 to 4 cohorts.
