Chart Color Schemes
This analysis uses ABS Statistical Areas Level 2 (SA2) boundaries, which can materially differ from Suburbs and Localities (SAL) even when sharing similar names.
SA2 boundaries are defined by the Australian Bureau of Statistics and are designed to represent communities for statistical reporting (e.g., census and ERP).
Suburbs and Localities (SAL) represent commonly-used suburb/locality names (postal-style areas) and may use different geographic boundaries. For comprehensive analysis, consider reviewing both boundary types if available.
est. as @ -- *
ABS ERP | -- people | --
2021 Census | -- people
Sales Activity
Curious about local property values? Filter the chart to assess the volume and appreciation (including resales) trends and regional comparisons, or scroll to the map below view this information at an individual property level.
Find a Recent Sale
Sales Detail
Population
An assessment of population growth drivers in Inverell reveals an overall ranking slightly below national averages considering recent, and medium term trends
Inverell's population is approximately 12,354 as of November 2025. This figure represents an increase of 297 people, a 2.5% rise from the 2021 Census count of 12,057. The growth is inferred from the estimated resident population of 12,279 in June 2024 and an additional 99 validated new addresses since the Census date. This results in a population density of 59 persons per square kilometer. Over the past decade, Inverell has shown resilience with a compound annual growth rate of 0.4%, surpassing its SA3 area's growth. Overseas migration contributed approximately 74.3% to recent population gains, although all factors including natural growth and interstate migration were positive.
AreaSearch uses ABS/Geoscience Australia projections for each SA2 area, released in 2024 with a 2022 base year. For areas not covered by this data, NSW State Government's SA2 level projections from 2022 with a 2021 base year are used. Growth rates by age group are applied to all areas for the years 2032 to 2041. Future trends indicate a population increase just below Australia's regional median, with an expected growth of 648 persons to 2041 based on latest annual ERP population numbers, reflecting a total increase of 4.6% over 17 years.
Frequently Asked Questions - Population
Development
Residential development activity is lower than average in Inverell according to AreaSearch's national comparison of local real estate markets
Inverell has recorded approximately 40 residential properties granted approval annually. Over the past five financial years, from FY-21 to FY-25, around 200 homes were approved, with an additional 10 approved so far in FY-26. On average, about 0.9 new residents have arrived per new home each year over these five years.
This indicates that new supply is keeping pace with or exceeding demand, providing ample buyer choice and creating capacity for population growth beyond current forecasts. The average construction cost value of new homes over this period was $293,000. In FY-26, commercial approvals totalling $27.3 million have been registered, demonstrating moderate levels of commercial development in Inverell. Compared to the rest of NSW, Inverell has slightly more development, with 17.0% above the regional average per person over the five-year period. This preserves reasonable buyer options while sustaining existing property demand.
However, development activity has moderated in recent periods. Nationally, Inverell's development activity is lower, reflecting market maturity and possible development constraints. New development in Inverell consists of 58.0% standalone homes and 42.0% attached dwellings, expanding the range of medium-density options and creating a mix of opportunities across price brackets. This represents a notable shift from the area's existing housing composition, which is currently 88.0% houses. This indicates decreasing availability of developable sites and reflects changing lifestyles and the need for more diverse, affordable housing options. The estimated count of people per dwelling approval in Inverell is 670, reflecting its quiet, low activity development environment. According to the latest AreaSearch quarterly estimate, Inverell is expected to grow by 573 residents through to 2041. Based on current development patterns, new housing supply should readily meet demand, offering good conditions for buyers and potentially facilitating population growth beyond current projections.
Frequently Asked Questions - Development
Infrastructure
Inverell has moderate levels of nearby infrastructure activity, ranking in the 45thth percentile nationally
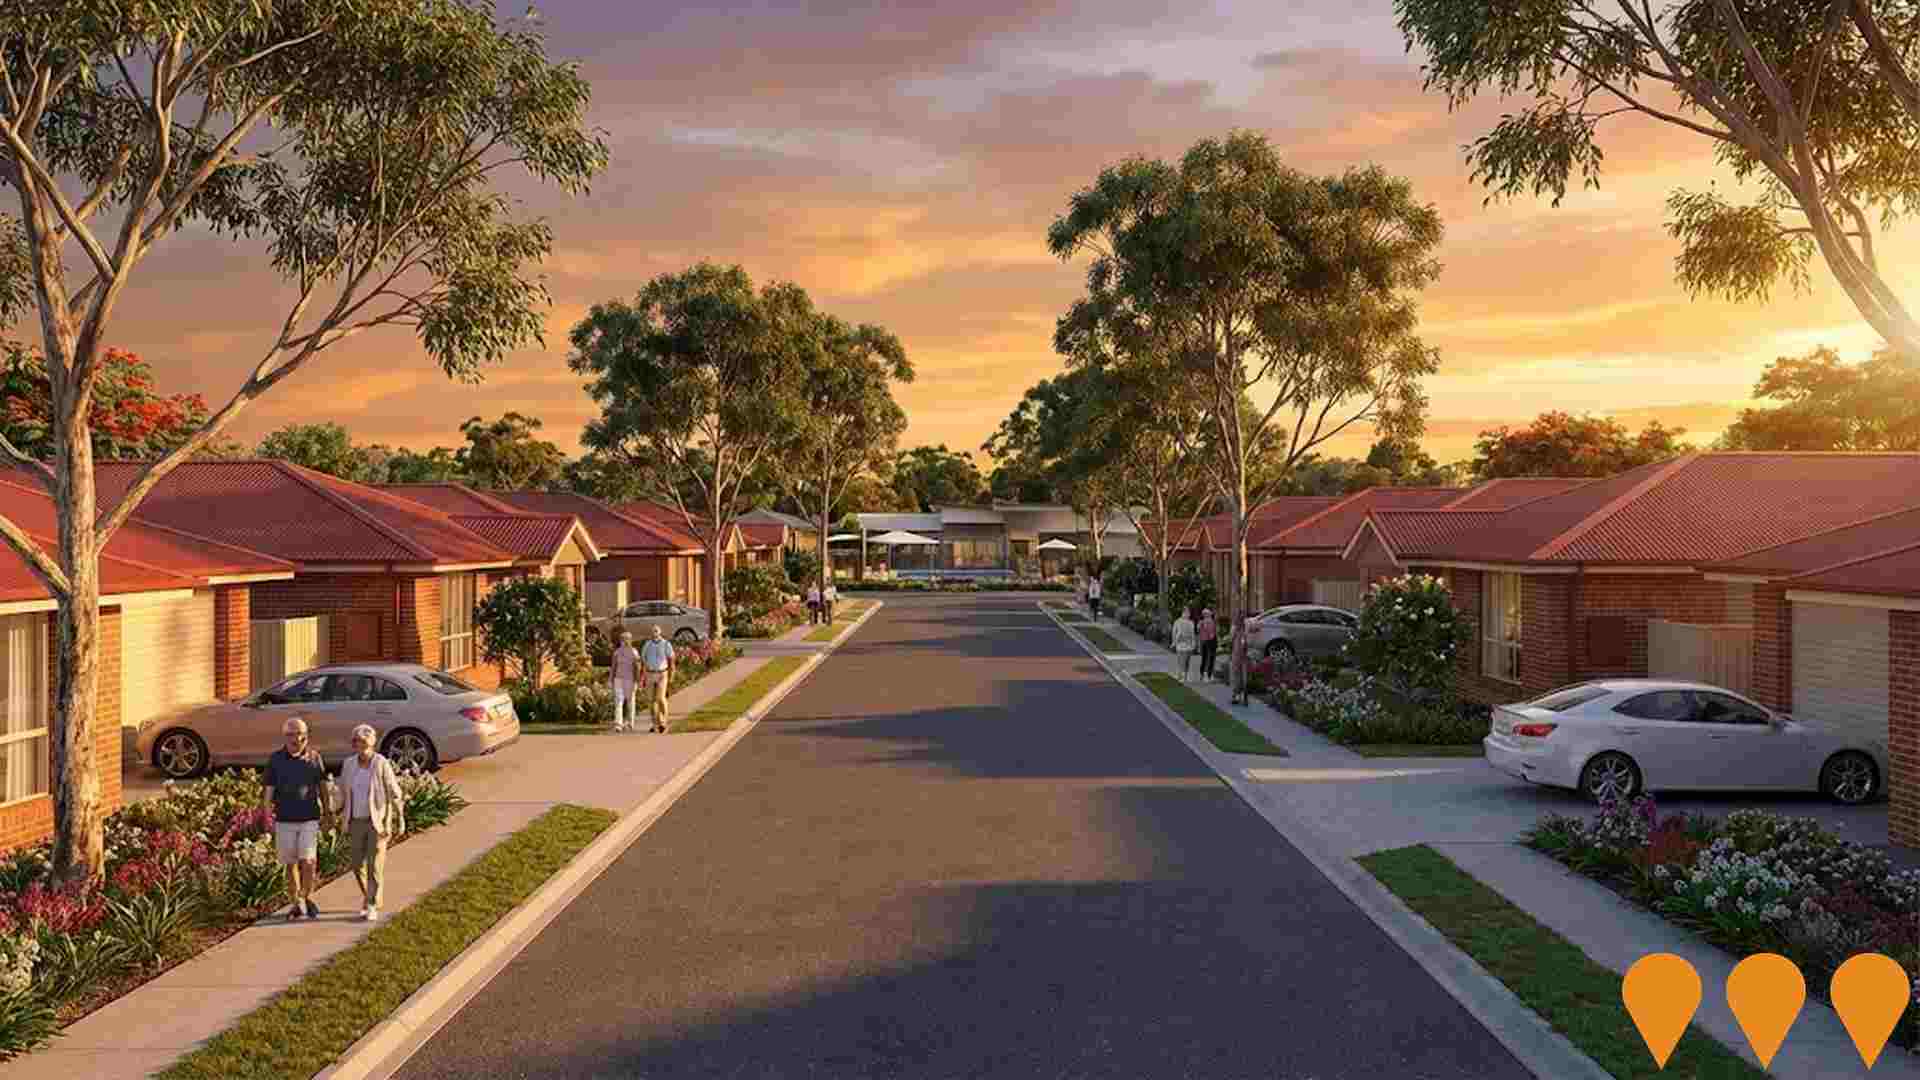
The performance of an area can significantly be influenced by changes in local infrastructure, major projects, and planning initiatives. AreaSearch has identified a total of 13 projects that are expected to impact the area. Notable projects include New Residential Areas Structure Plans, Sapphire City Lifestyle Village, Bunnings Warehouse Inverell, and Gwydir Highway Improvements, Inverell Town Centre. The following list details those projects likely to be most relevant.
Professional plan users can use the search below to filter and access additional projects.
INFRASTRUCTURE SEARCH
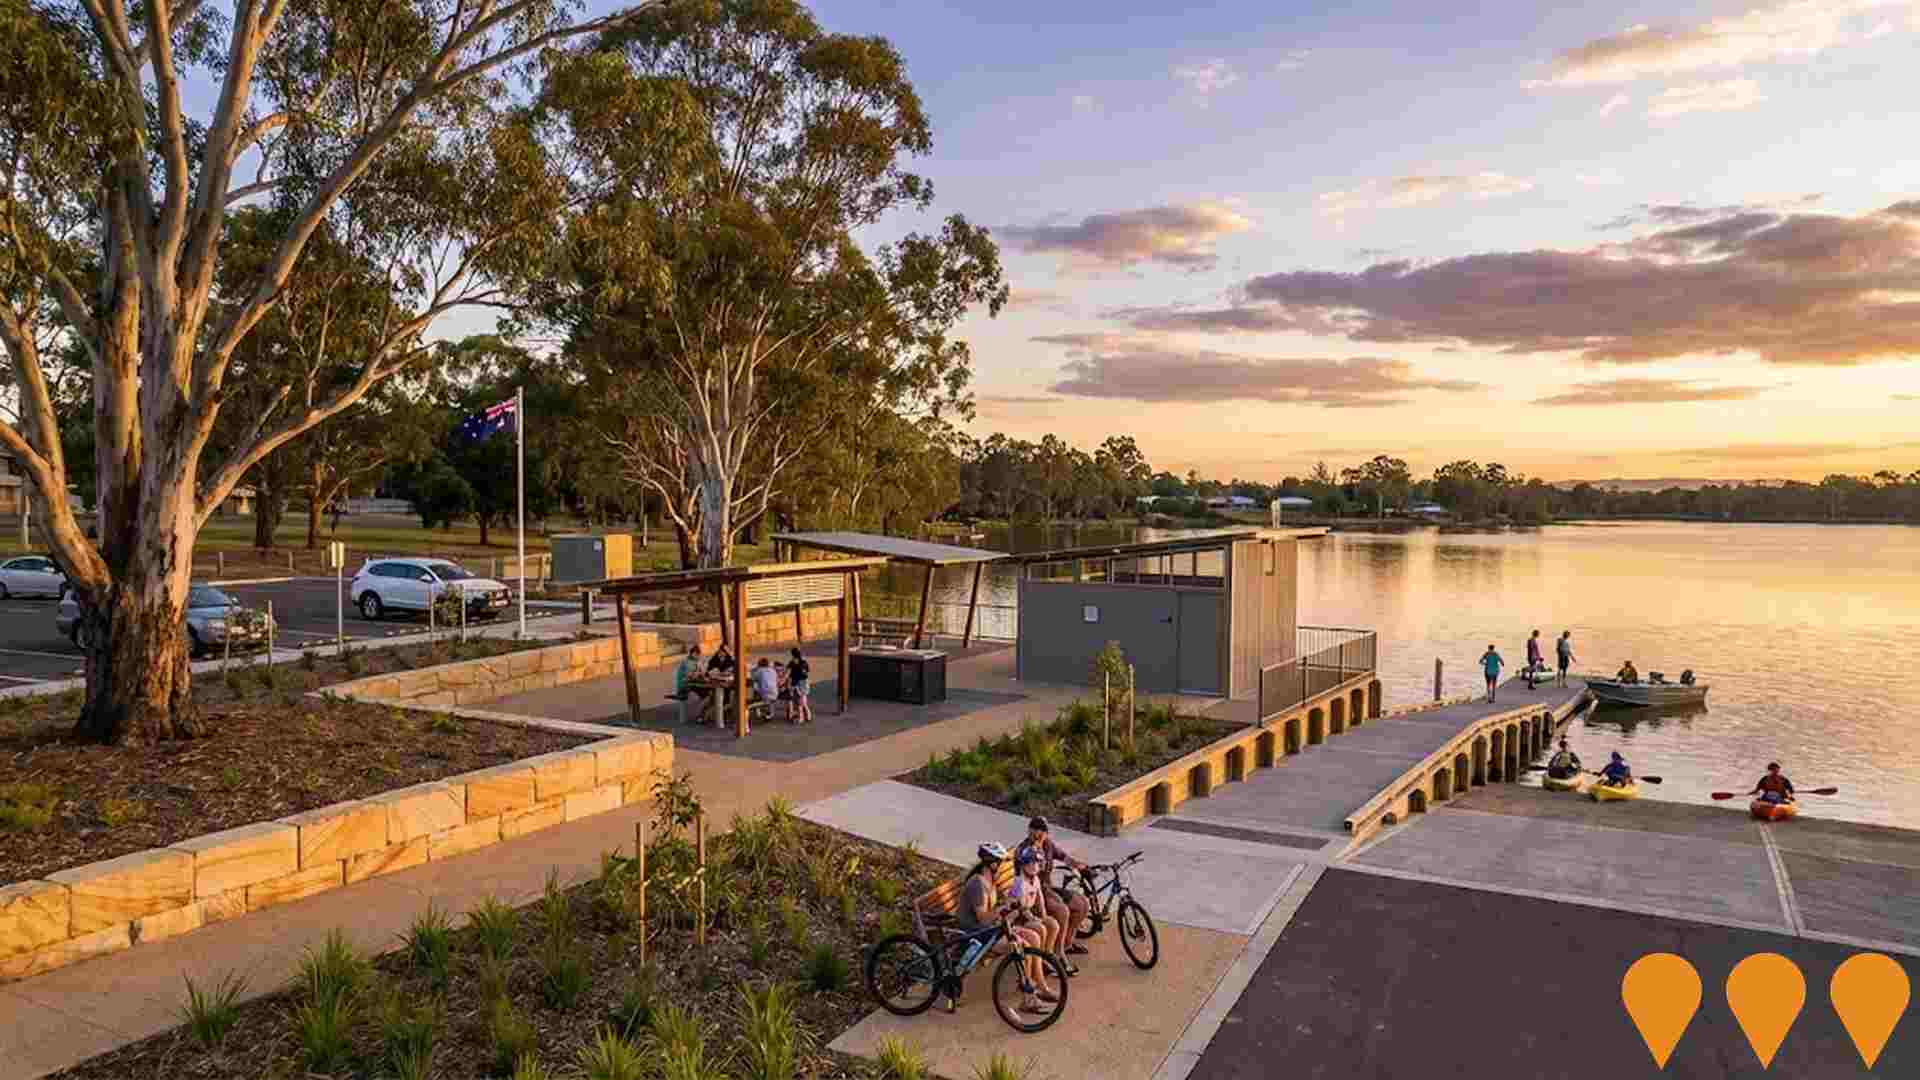
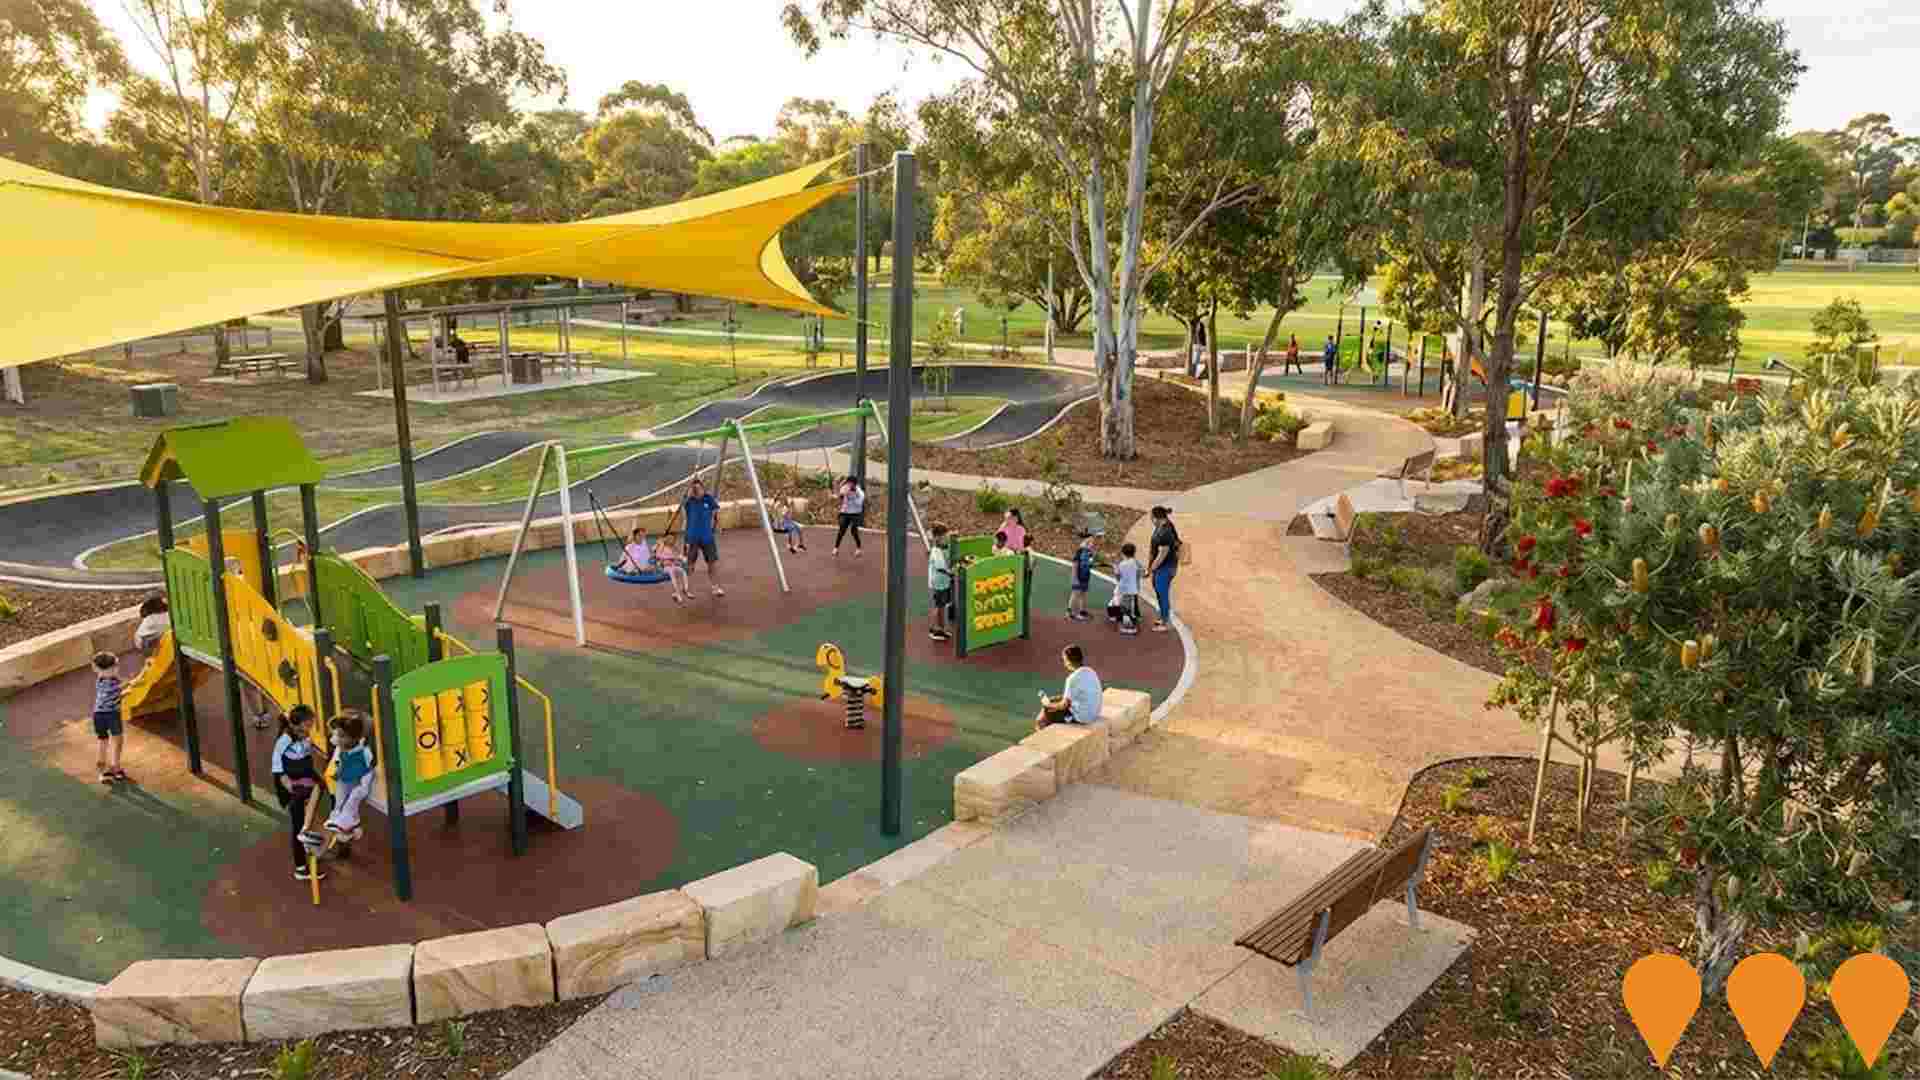
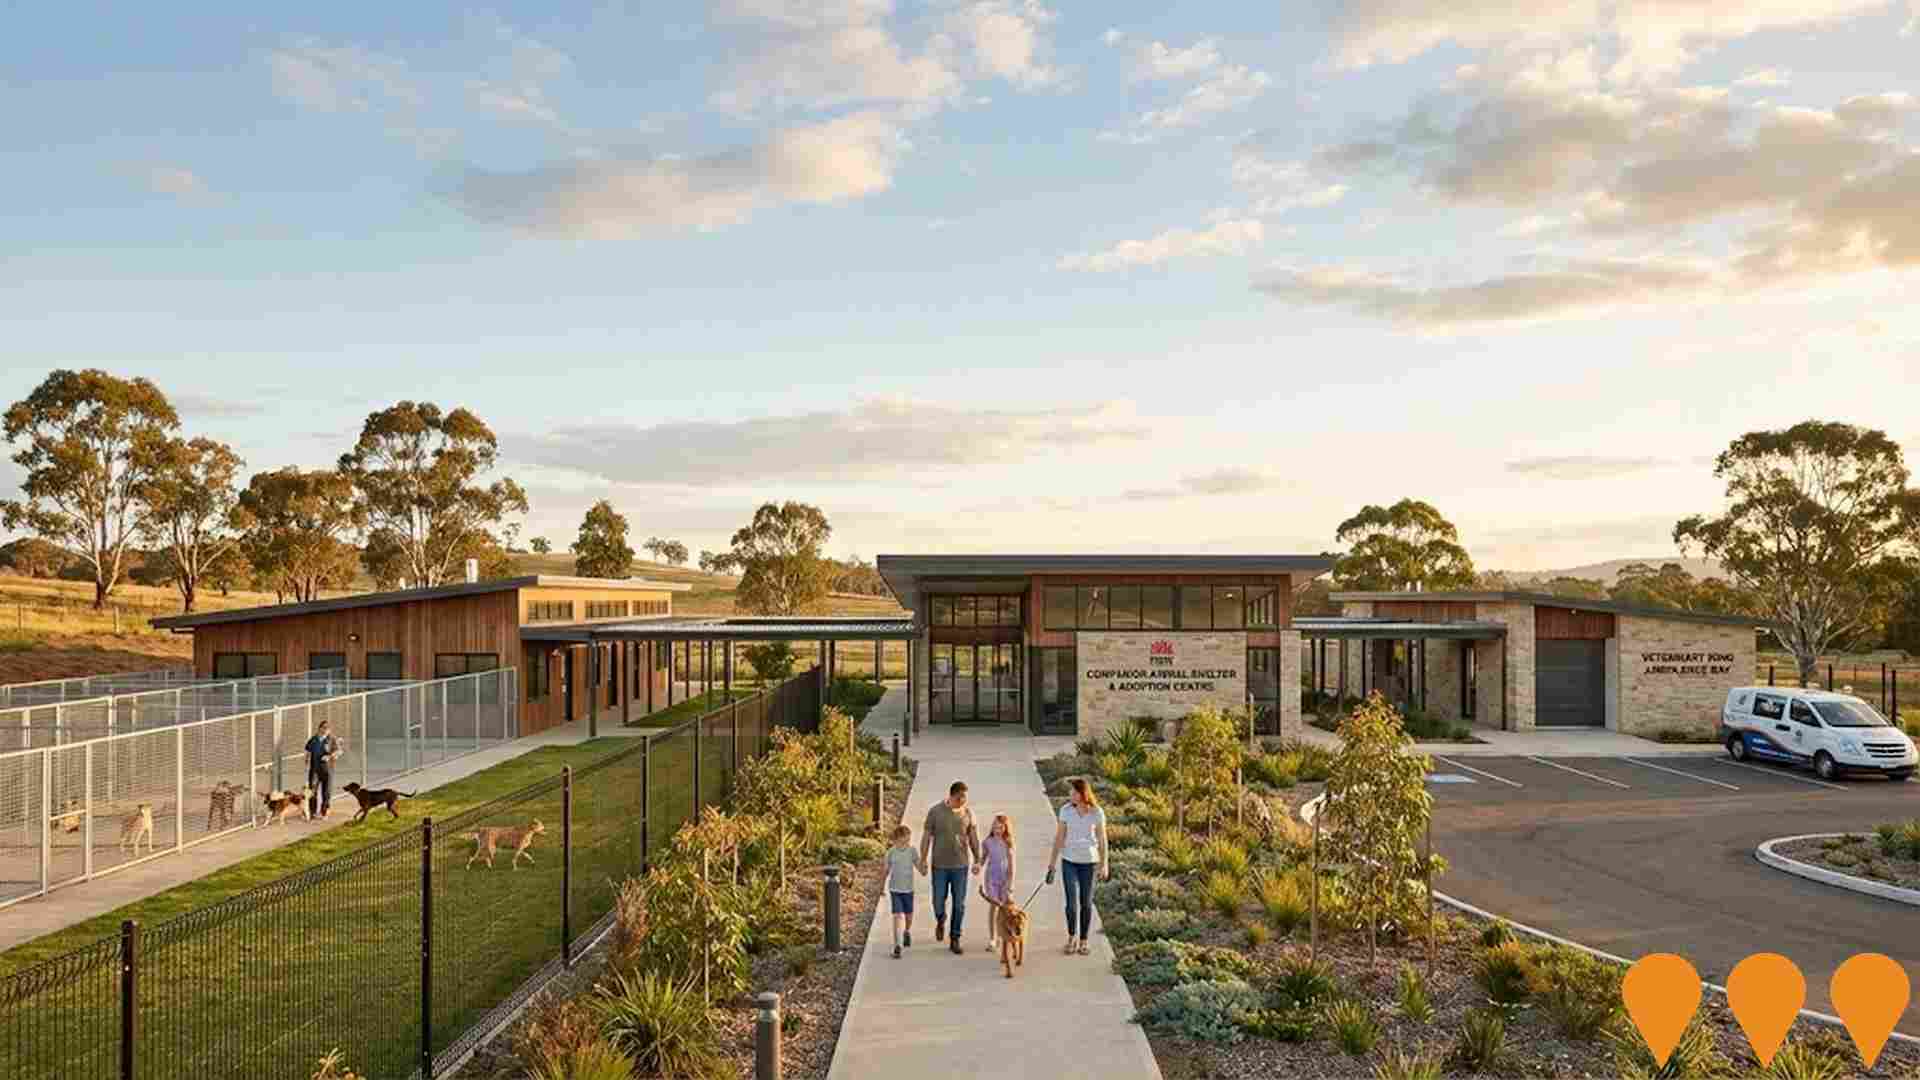
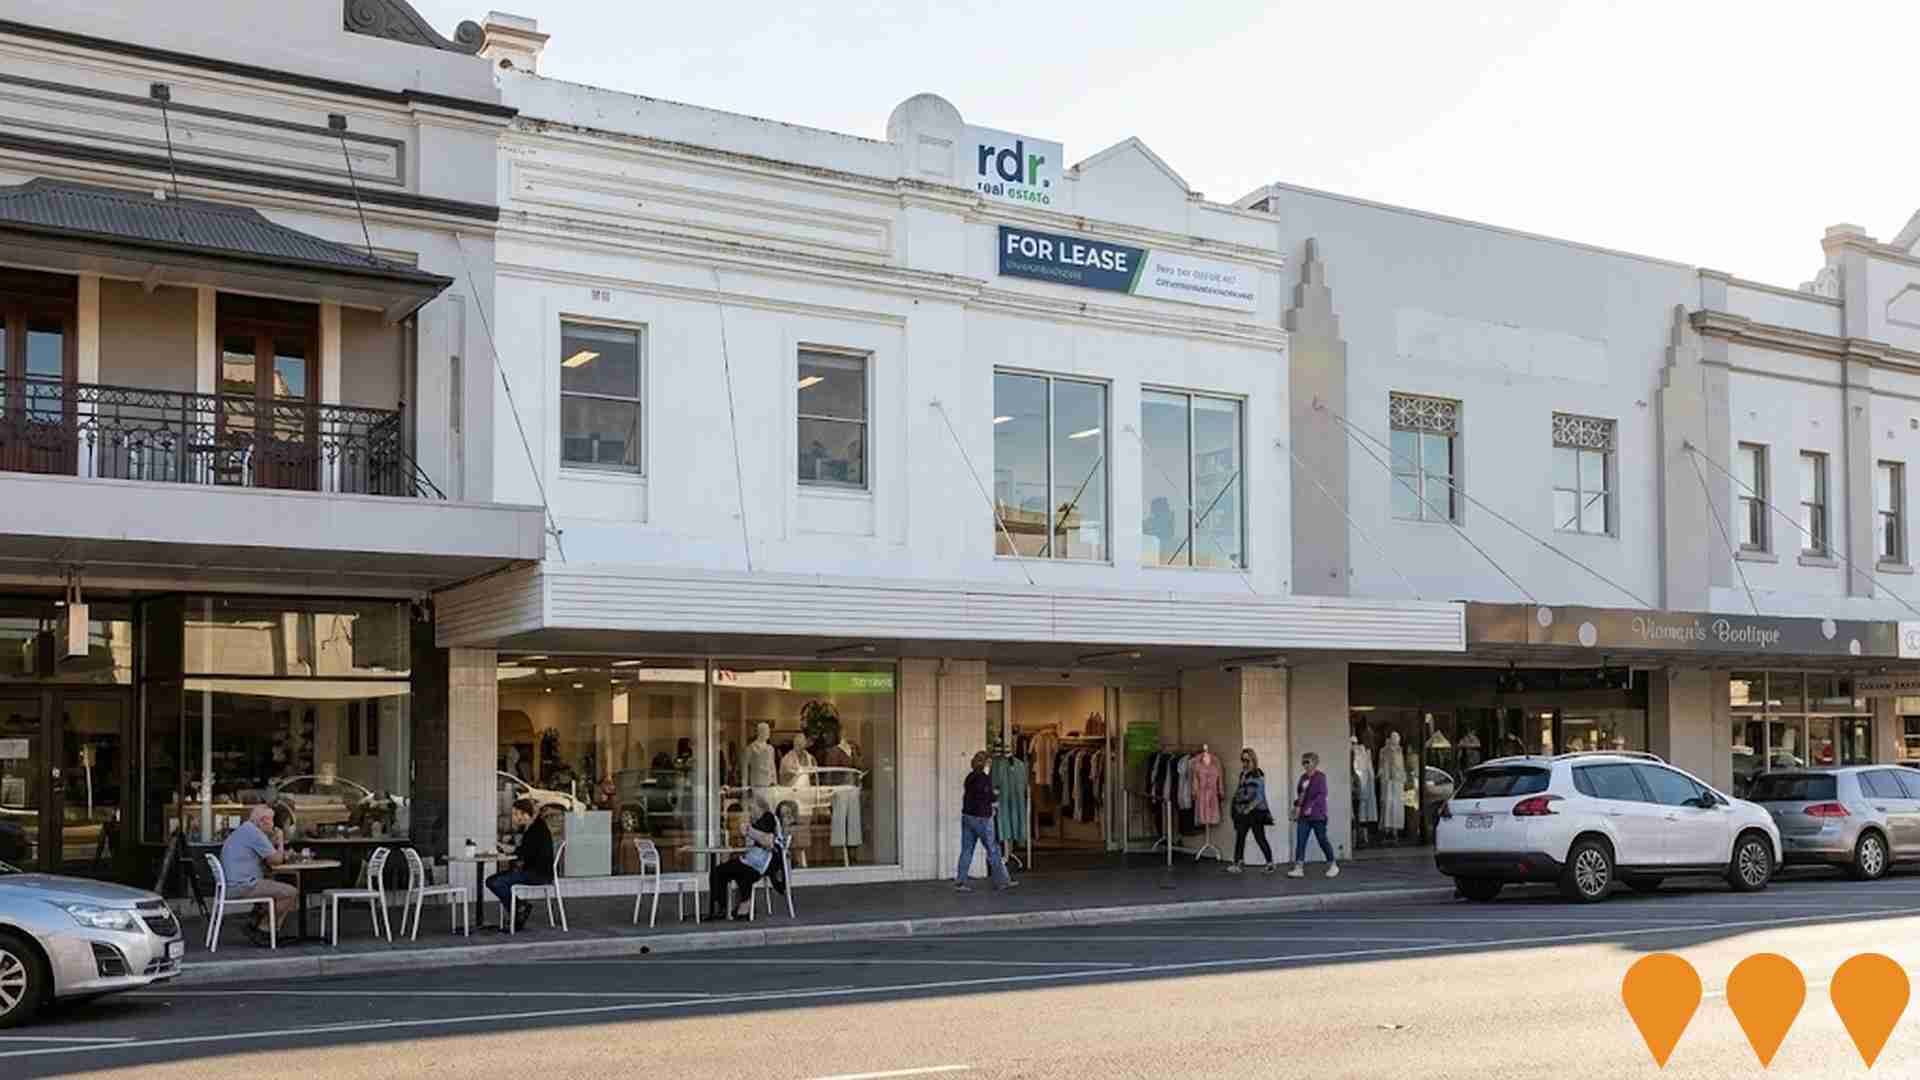
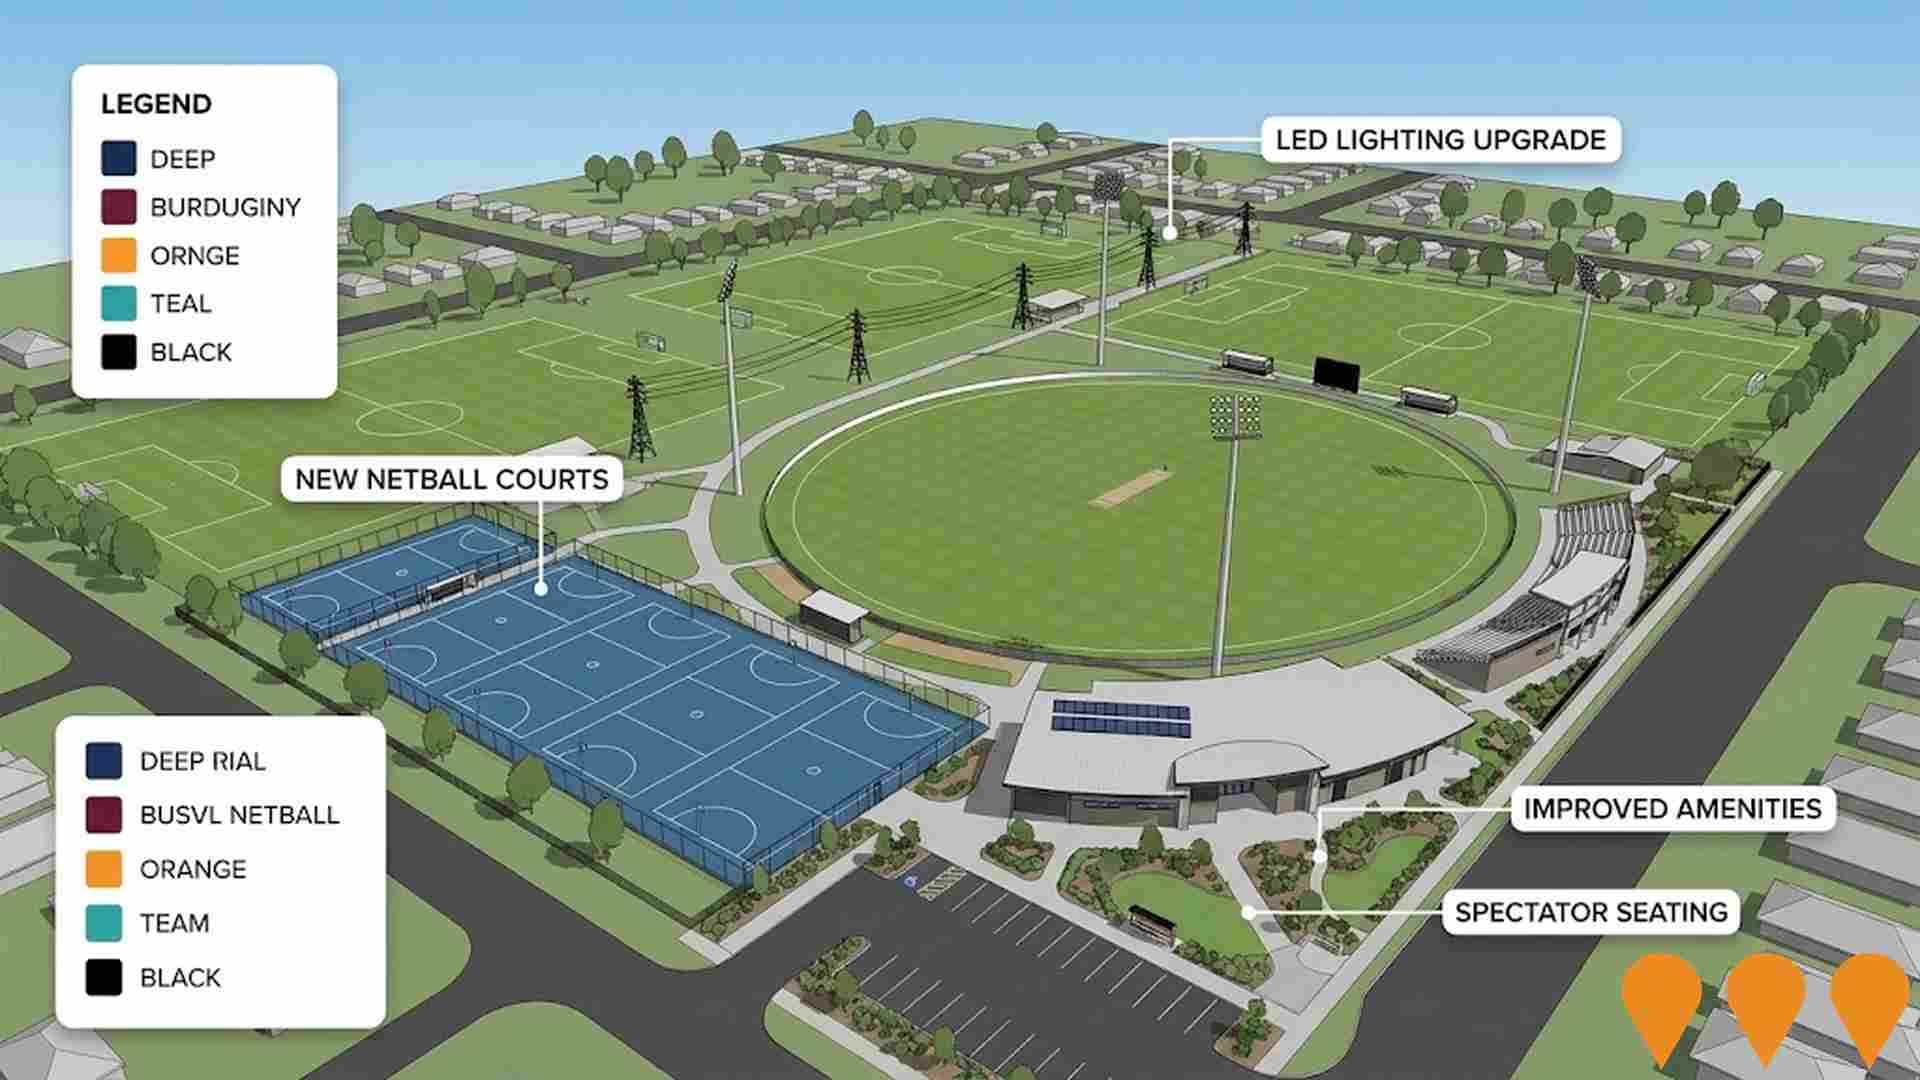
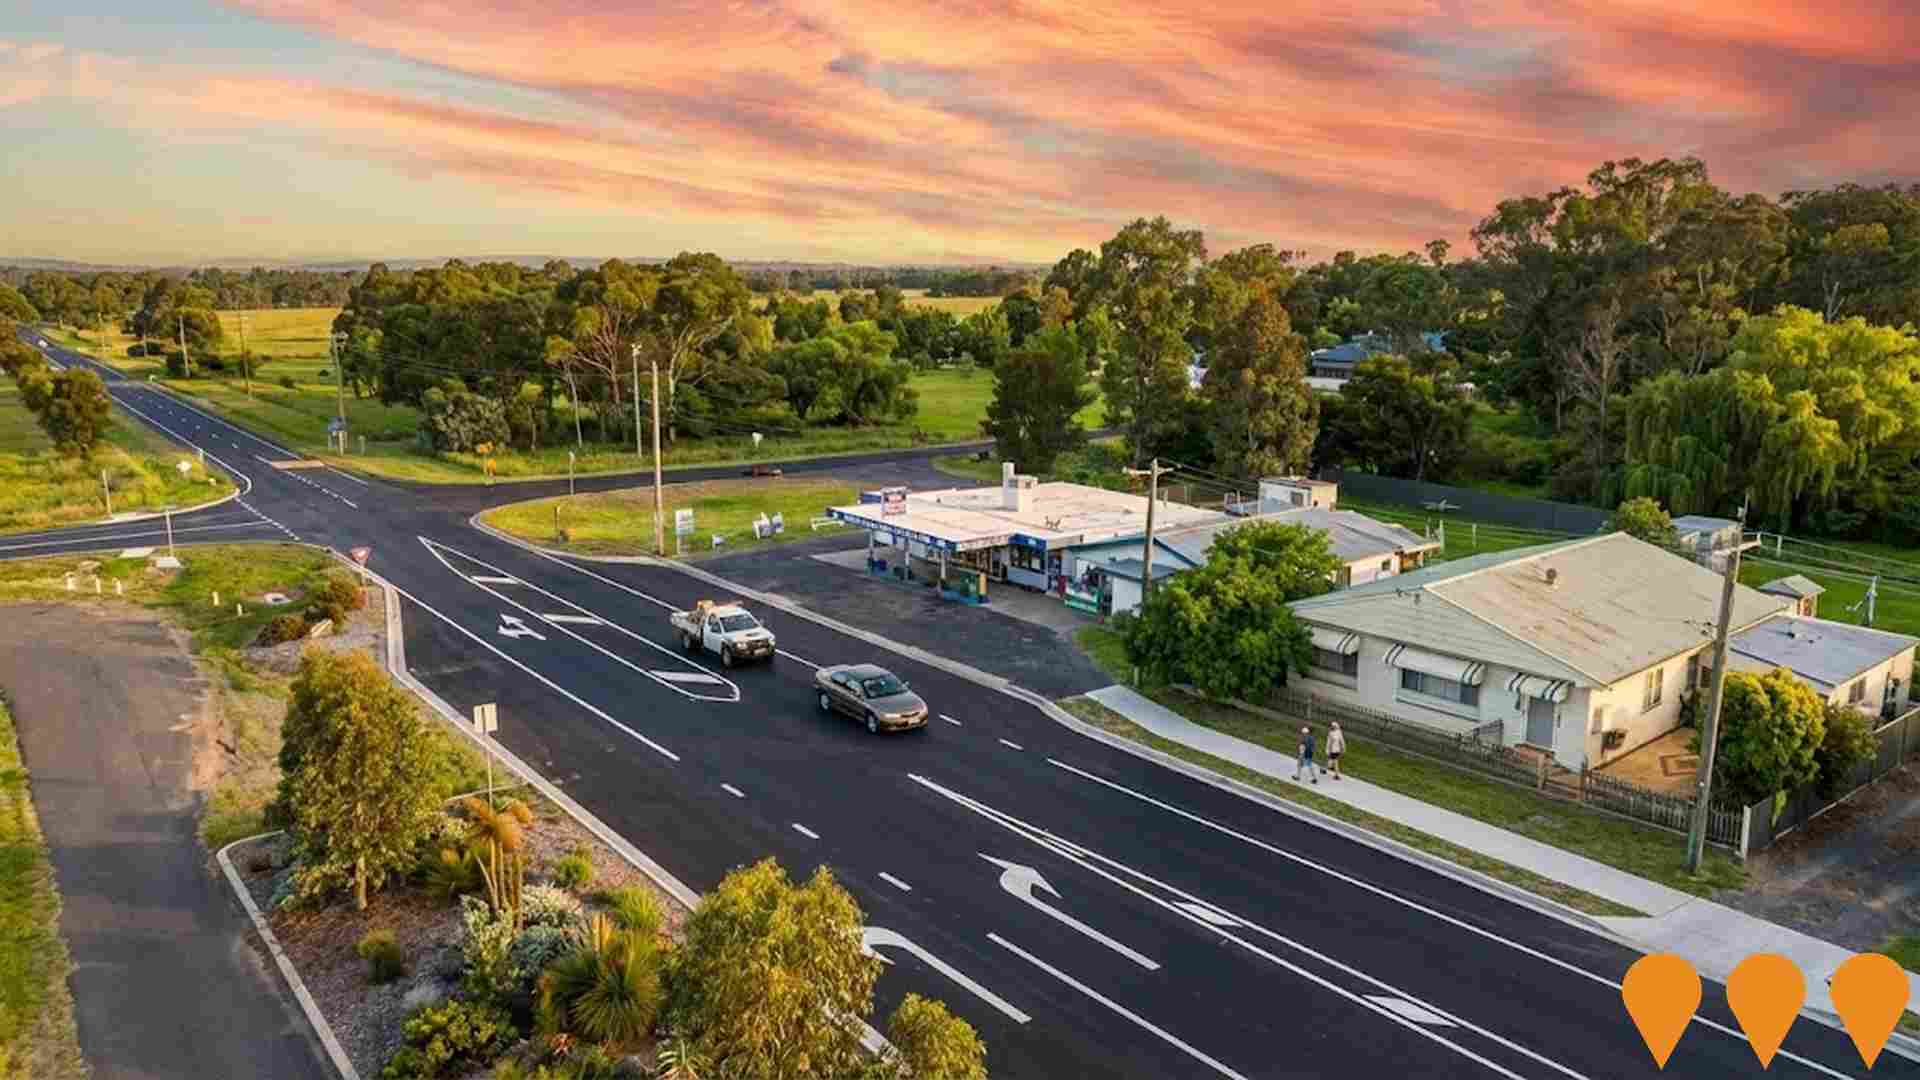
 Denotes AI-based impression for illustrative purposes only, not to be taken as definitive under any circumstances. Please follow links and conduct other investigations from the project's source for actual imagery. Developers and project owners wishing us to use original imagery please Contact Us and we will do so.
Frequently Asked Questions - Infrastructure
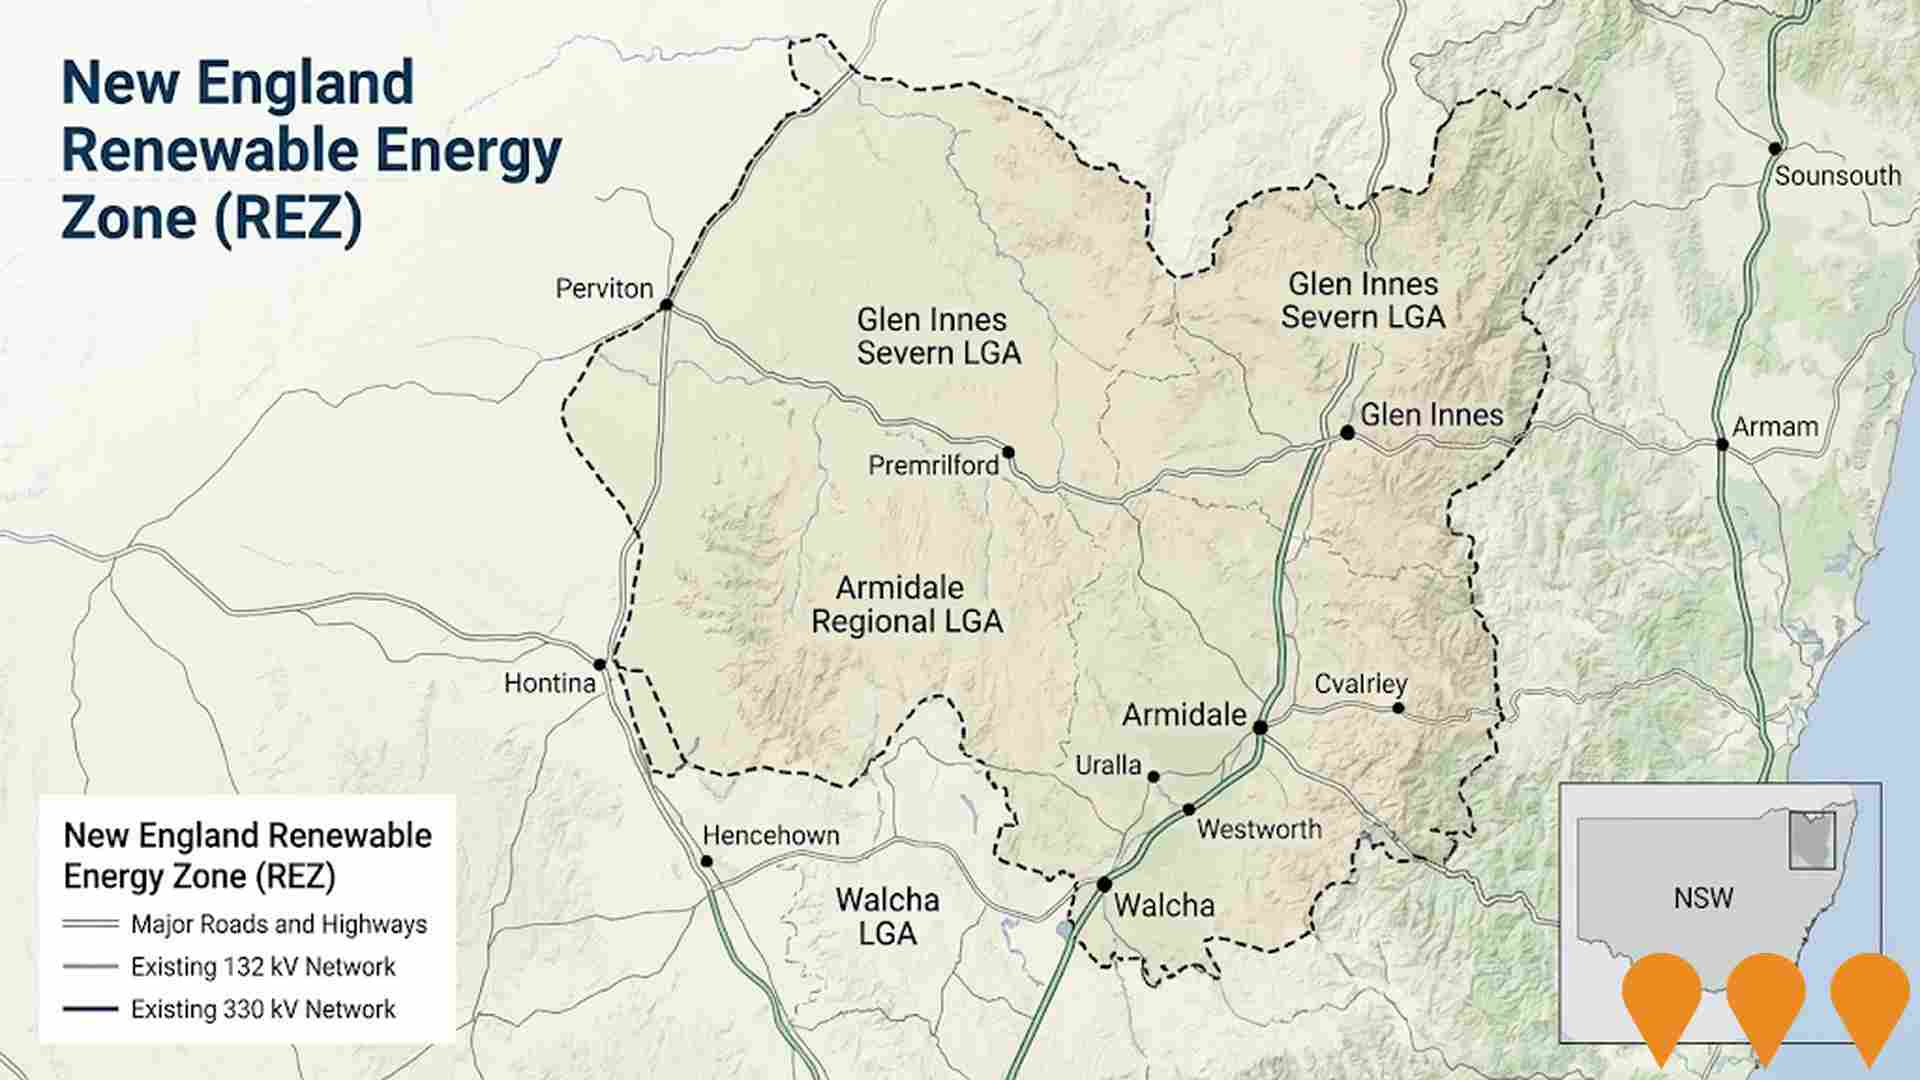
New England Renewable Energy Zone (REZ)
Australia's largest declared Renewable Energy Zone with a network capacity of 8 GW. Supports large-scale wind, solar, storage and emerging energy projects backed by new transmission infrastructure. Expected to attract approximately A$24 billion in private investment and create around 6,000 construction jobs and 2,000 ongoing operational jobs across the New England region.
New Residential Areas Structure Plans
Council has endorsed the Structure Plans to provide an overall framework for three new residential growth areas in Inverell. The plans guide sustainable urban expansion, ensuring orderly and efficient development for road linkages, stormwater drainage, open space, and services provision. The project aims to accommodate population growth while minimising impacts on natural attributes and is supported by NSW Government fast-track funding for detailed drainage assessment and plans.

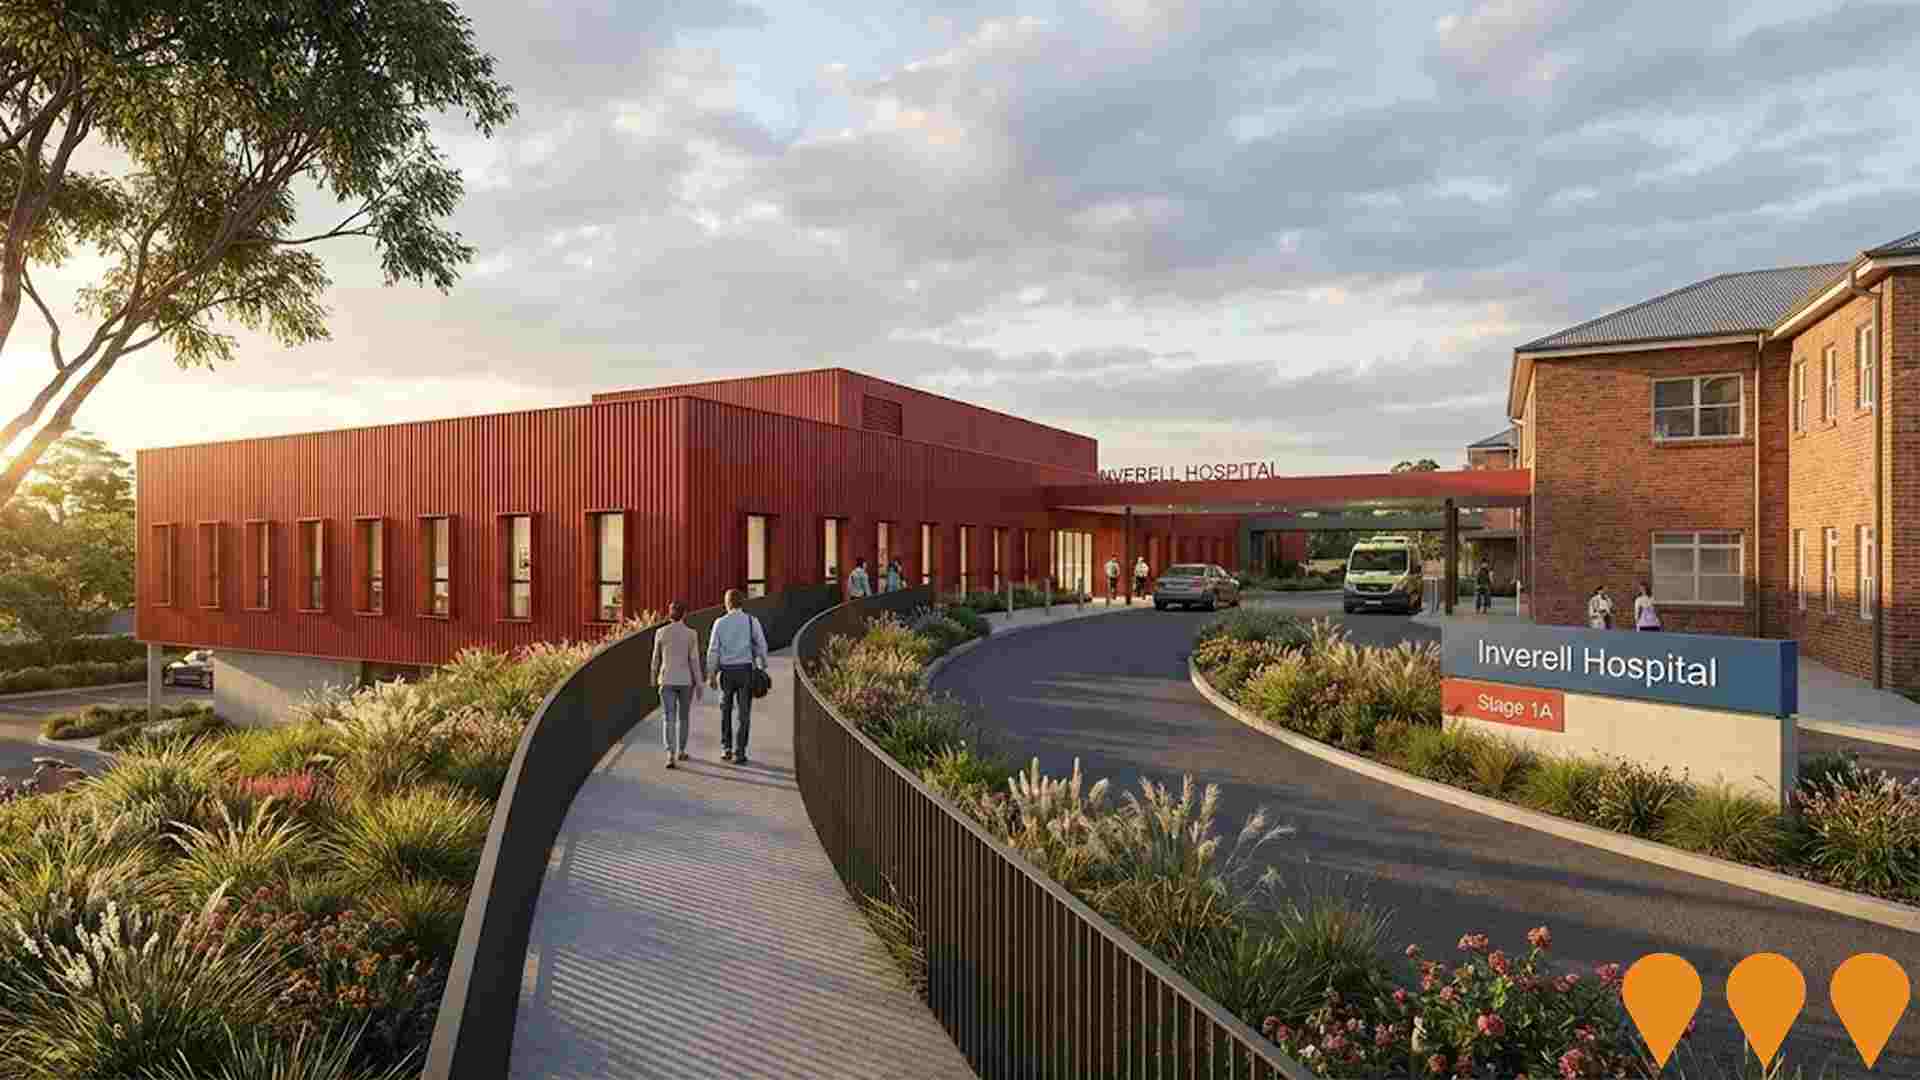
Inverell Hospital Redevelopment
NSW Health Infrastructure delivered a major upgrade of Inverell Health Service, including a new acute services hospital (Stage 1A) and refurbishment of the existing building to relocate community health services (Stage 1B). The project modernised facilities and expanded key services such as renal dialysis, day surgery, emergency, maternity, imaging and inpatient care.
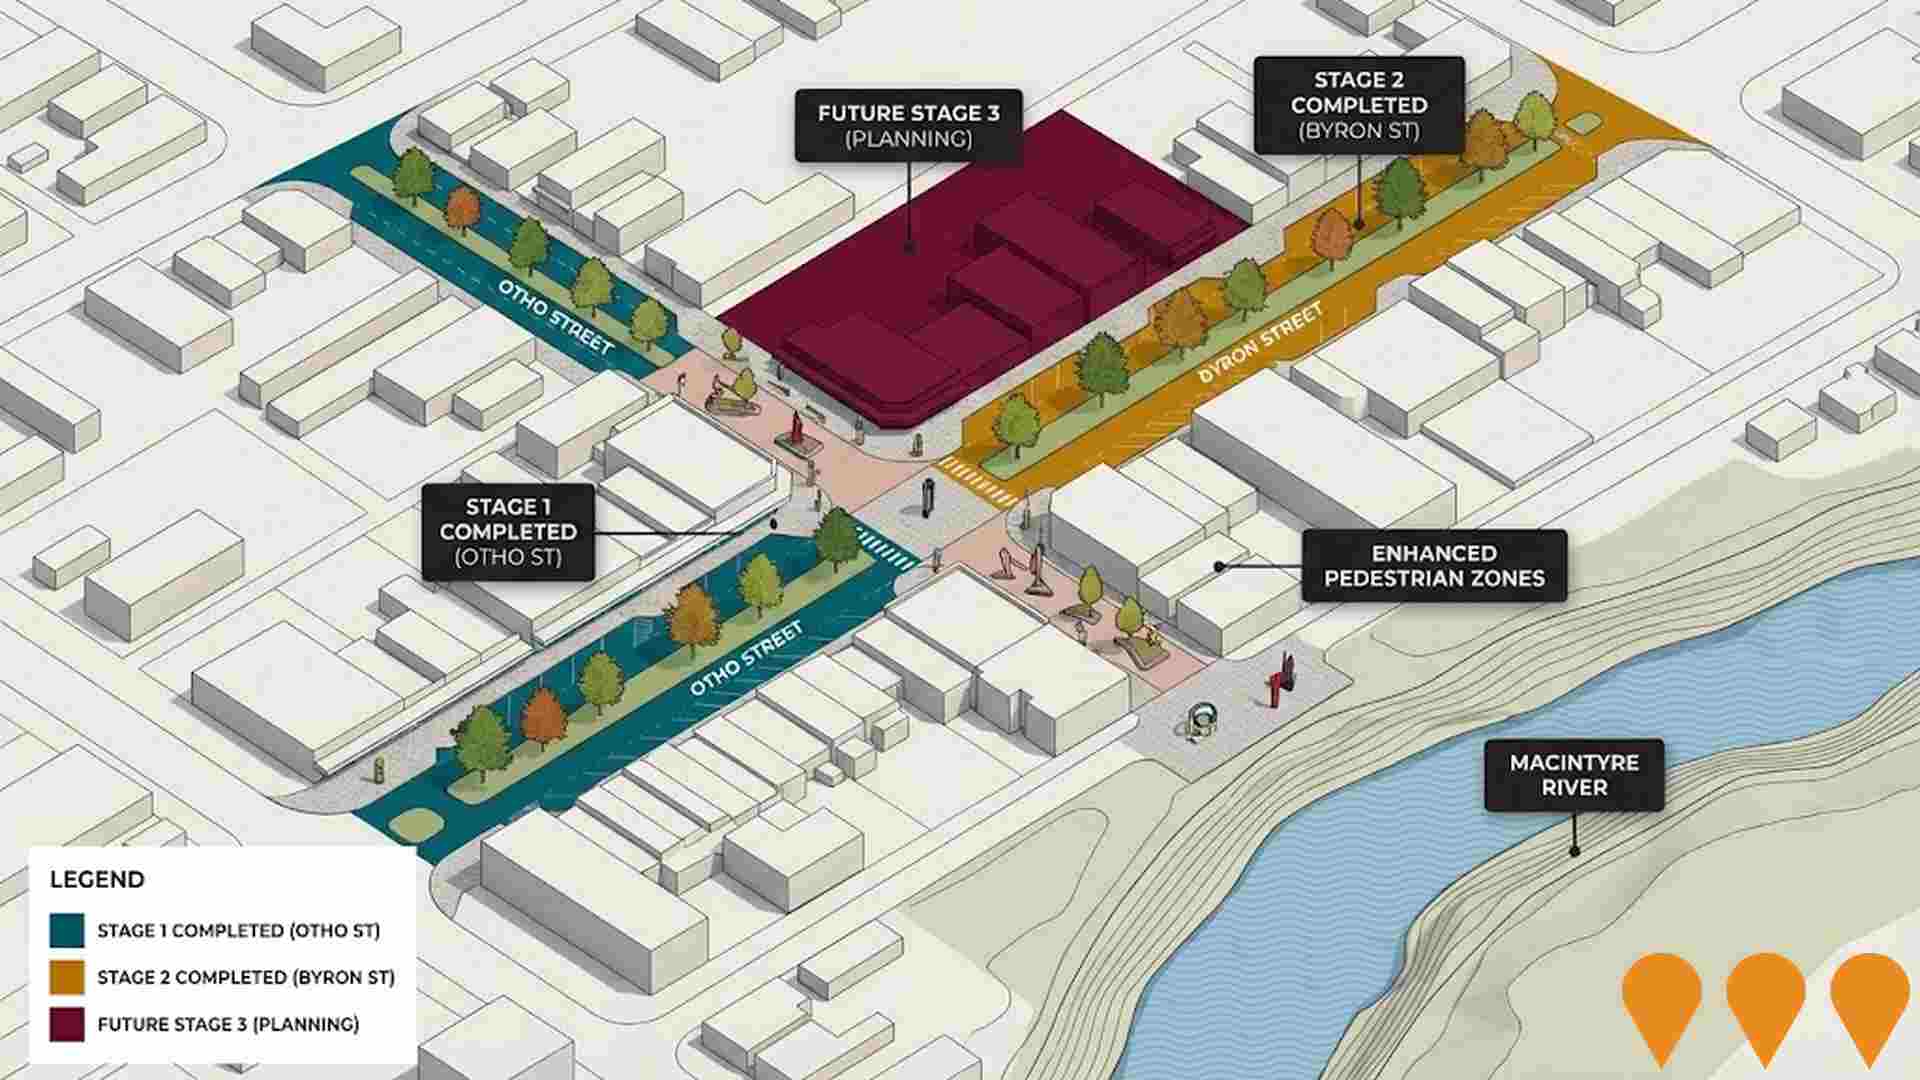
Inverell Town Centre Renewal Plan
Comprehensive, multi-staged renewal of Inverell's town centre, adopted by Council in 2014. Key works include streetscape improvements, enhanced pedestrian areas, public art installations, and replacement of old street trees with new species (Pin Oaks and Chanticleer Pears) to create an innovative at-grade centre median. Stage 1 (Otho Street) was completed in 2018. Stage 2 (Byron Street) was completed in 2020. The project is currently in the planning/funding stage for future works, referred to as TCRP Stage 3, for which over $517,000 in surplus funds from the Aquatic Centre Redevelopment were allocated in late 2025.
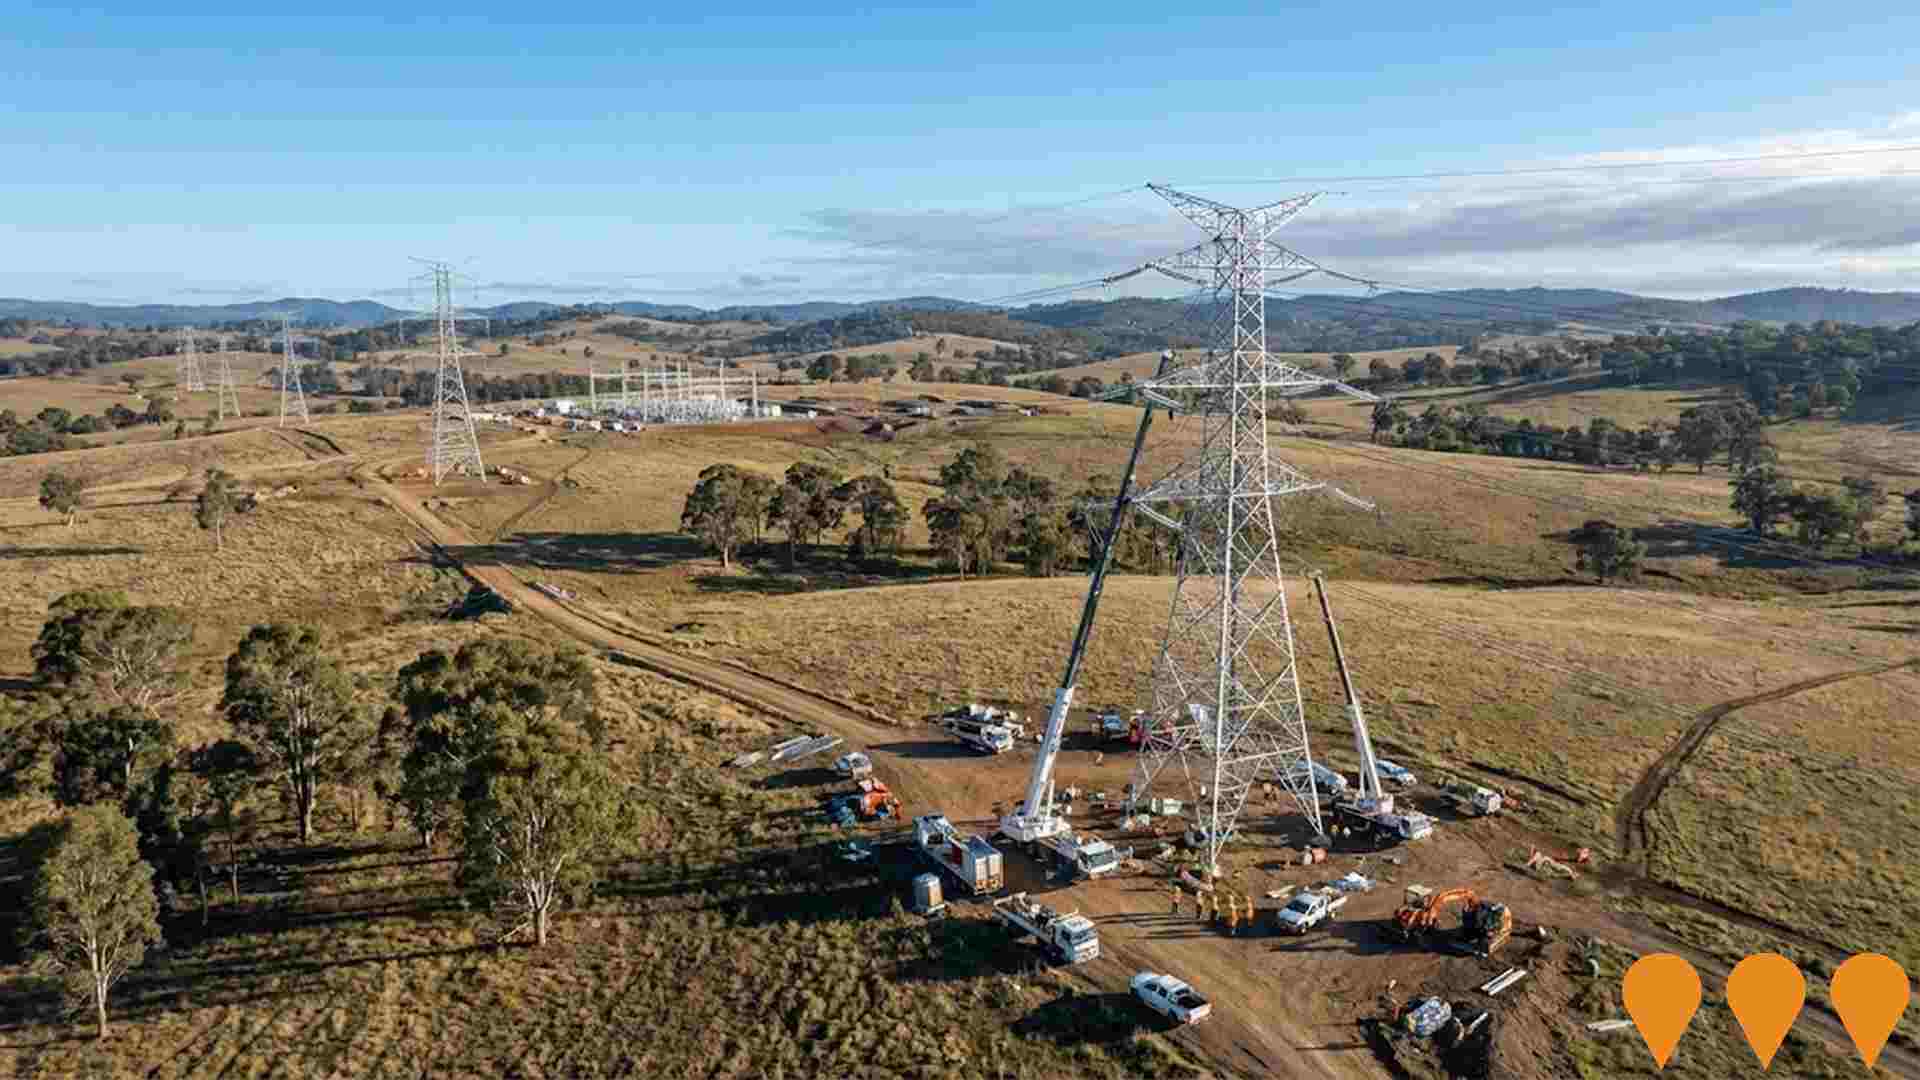
New England REZ Transmission Project
Critical transmission infrastructure for the New England Renewable Energy Zone (REZ) in NSW, including new 500 kV and 330 kV lines, energy hubs and enabling works to connect REZ generation to the state grid in the Upper Hunter/Hunter Valley. The project is progressing environmental studies and route refinement, with a scoping report lodged and field investigations ongoing. EnergyCo has commenced procurement for a network operator; EIS preparation continues with public exhibition targeted during 2025.
Gwydir Highway Improvements, Inverell Town Centre
Planning study for improvements to the Gwydir Highway through Inverell including intersection upgrades, pedestrian crossings, and traffic flow enhancements. The project aims to improve safety and reduce traffic congestion in the town centre. Transport for NSW manages the Gwydir Highway in Inverell, with local input from Inverell Shire Council for project selection and maintenance. The highway through Inverell is a major peak traffic area.

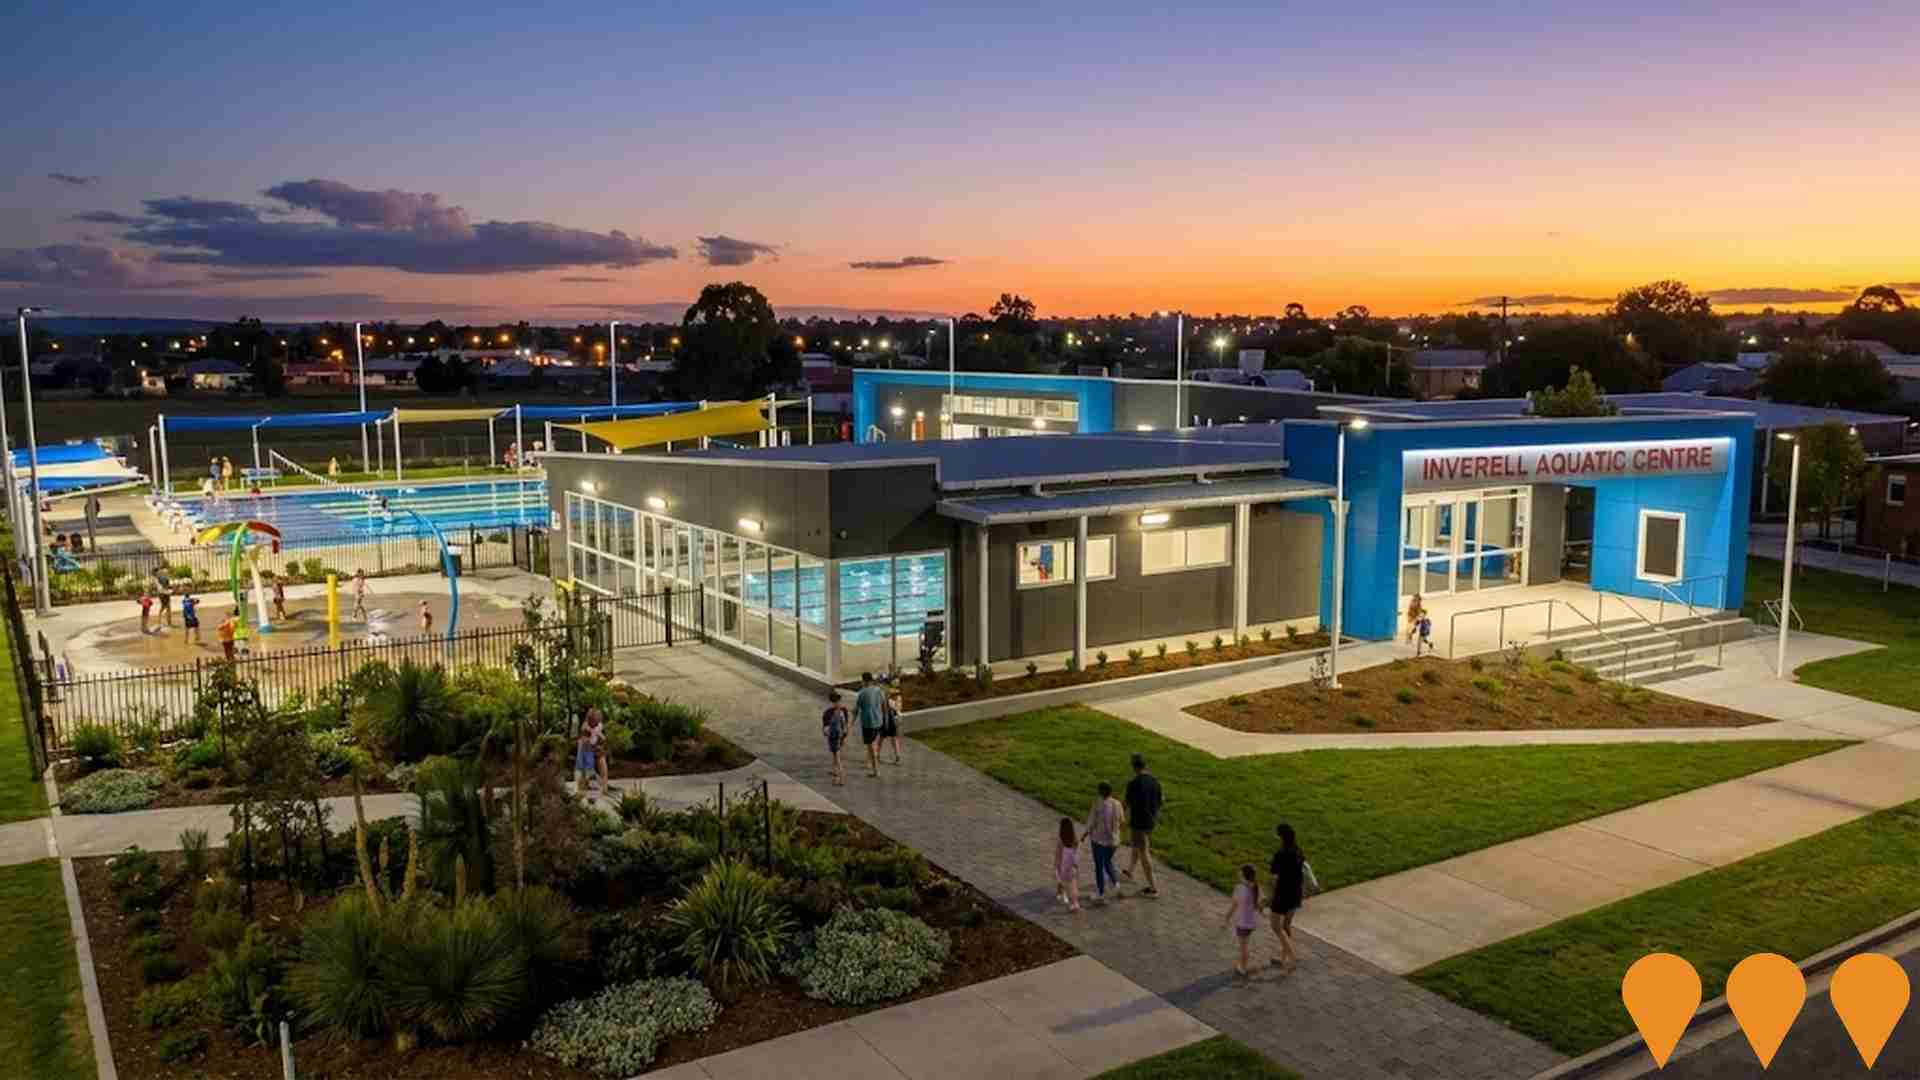
Inverell Aquatic Centre Redevelopment
A complete replacement of the 70-year-old memorial swimming pool with a state-of-the-art $25 million aquatic centre featuring an 8-lane 50m outdoor/indoor pool, 20m warm water program pool with moveable floor, indoor splash park, toddlers pool, cafe, and comprehensive aquatic programs. The facility achieved World Aquatics (FINA) accreditation and opened in February 2025.
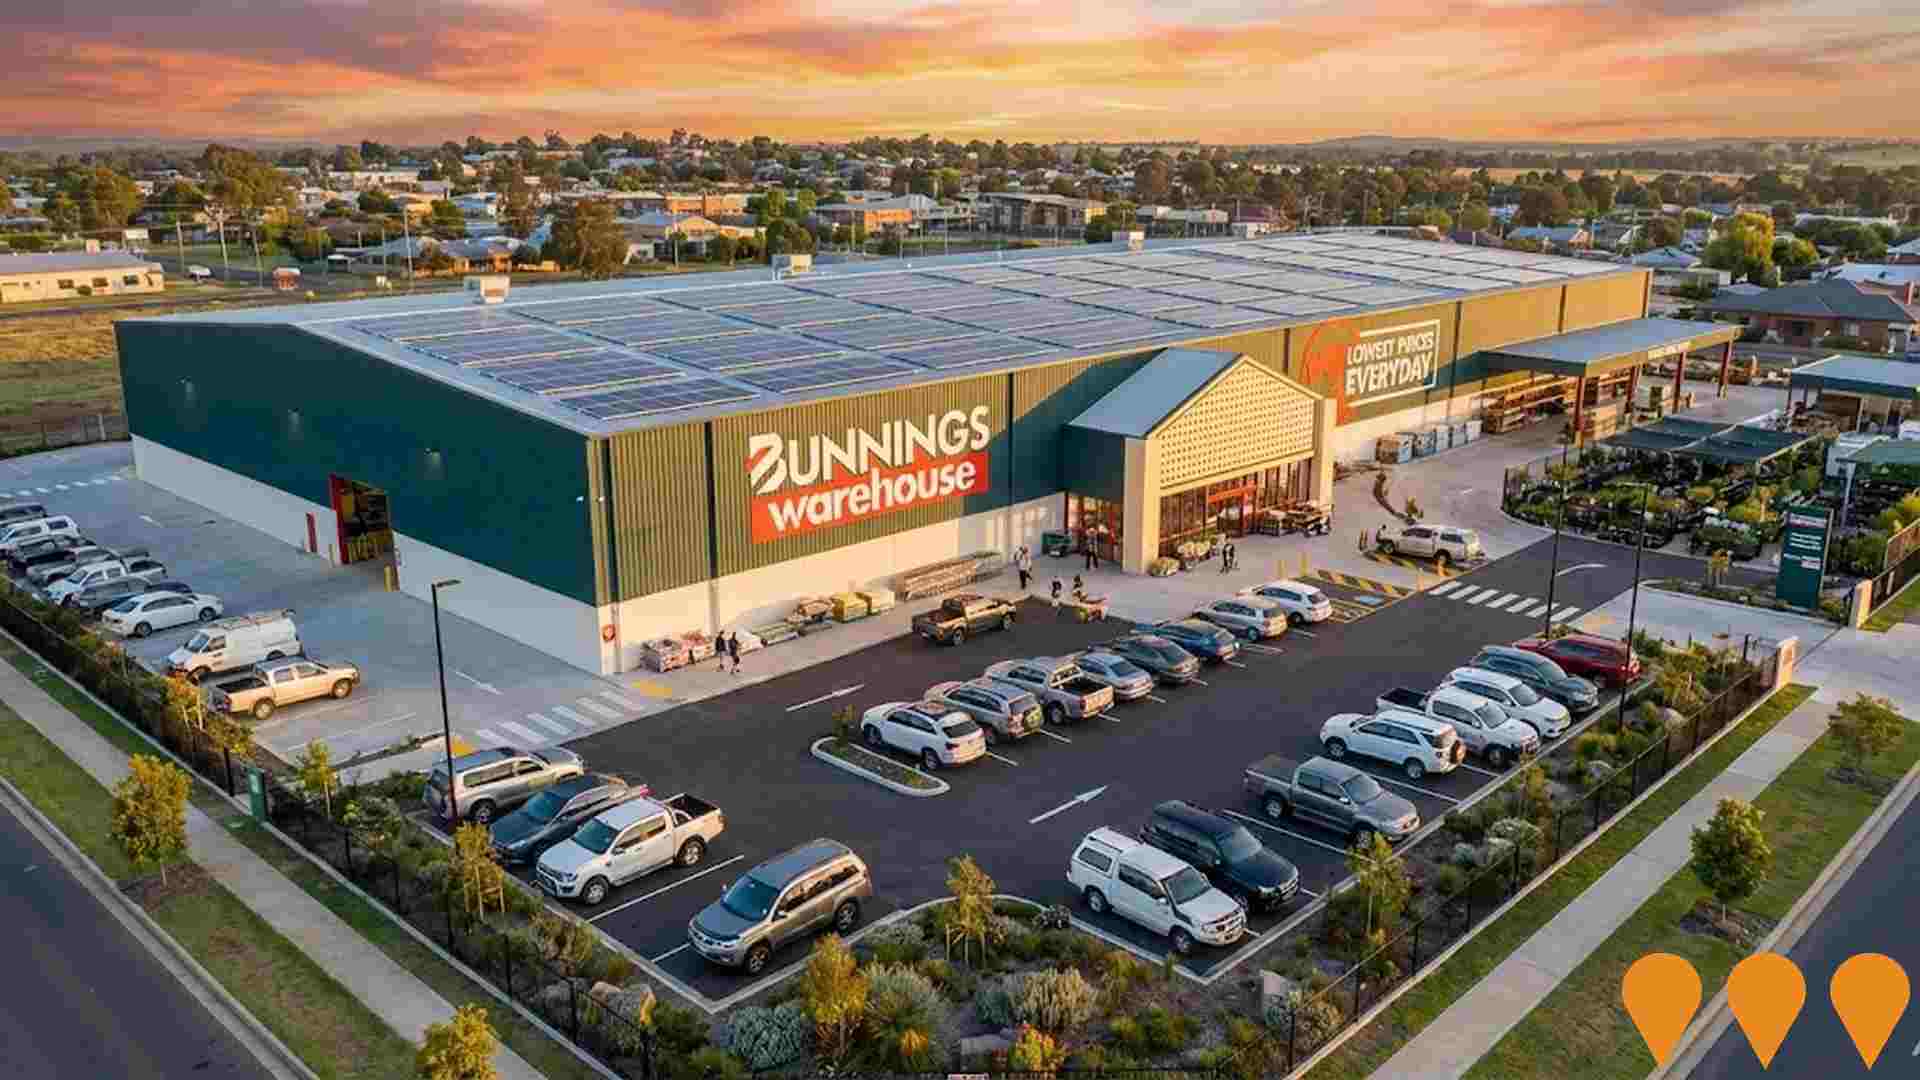
Bunnings Warehouse Inverell
Development of a new Bunnings Warehouse store with a total floor area of 8,497 square metres, featuring a main warehouse retail area (3,770 square metres), outdoor nursery (621 square metres), timber trade sales area (1,697 square metres), and other specialized zones. The project includes sustainability features such as 1,400 square metres of solar panels, rainwater capture tanks for irrigation and toilet reuse, bio-retention areas for site runoff management, and 198 parking spaces. Expected to create 90 jobs, representing an increase of 40 jobs compared to the existing Bunnings location.
Employment
Employment performance in Inverell has been broadly consistent with national averages
Inverell has a balanced workforce with representation across white and blue collar jobs. Essential services sectors are well-represented, and the unemployment rate is 3.1%.
Employment stability in the past year has been relative. As of September 2025, 6,145 residents are employed, with an unemployment rate of 0.8% below Rest of NSW's rate of 3.8%. Workforce participation is lower at 52.7%, compared to Rest of NSW's 56.4%. Key industries include health care & social assistance, manufacturing, and retail trade.
Manufacturing is particularly specialized, with an employment share 2.4 times the regional level. Construction employs 7.6% of local workers, below Rest of NSW's 9.7%. Some residents commute elsewhere for work based on Census data. Over a 12-month period ending September 2025, employment increased by 0.1%, labour force by 0.6%, leading to an unemployment rate rise of 0.5 percentage points. In contrast, Rest of NSW saw employment contraction of 0.5% and unemployment rise by 0.4 percentage points. State-level data as of 25-Nov-25 shows NSW employment contracted by 0.03%, with a state unemployment rate of 3.9%. National forecasts from May-25 project national employment growth of 6.6% over five years and 13.7% over ten years, but industry-specific projections suggest Inverell's employment should increase by 5.7% over five years and 12.6% over ten years.
Frequently Asked Questions - Employment
Income
The area's income levels rank in the lower 15% nationally based on AreaSearch comparative data
The Inverell SA2's median income among taxpayers was $45,263 in financial year 2022. The average income stood at $52,563 during the same period. This compares to figures for Rest of NSW which were $49,459 and $62,998 respectively. By September 2025, current estimates suggest the median income will be approximately $50,971 and the average income will be around $59,191 based on a Wage Price Index growth of 12.61% since financial year 2022. According to the 2021 Census, incomes in Inverell fall between the 12th and 22nd percentiles nationally for households, families, and individuals. Income analysis shows that the $1,500 - 2,999 bracket dominates with 28.3% of residents, which translates to 3,496 people. This aligns with the region where this cohort also represents 29.9%. After accounting for housing costs, 85.2% of income remains, ranking at the 14th percentile nationally.
Frequently Asked Questions - Income
Housing
Inverell is characterized by a predominantly suburban housing profile, with a higher proportion of rental properties than the broader region
Inverell's dwelling structure, as per the latest Census, consisted of 87.8% houses and 12.1% other dwellings (semi-detached, apartments, 'other' dwellings). This compares to Non-Metro NSW's 93.0% houses and 6.9% other dwellings. Home ownership in Inverell stood at 37.0%, with mortgaged dwellings at 29.5% and rented dwellings at 33.5%. The median monthly mortgage repayment was $1,250, higher than Non-Metro NSW's average of $1,100. Median weekly rent in Inverell was $270, compared to Non-Metro NSW's $240. Nationally, Inverell's mortgage repayments were significantly lower at $1,250 versus the Australian average of $1,863, and rents were substantially below the national figure of $375.
Frequently Asked Questions - Housing
Household Composition
Inverell features high concentrations of lone person households, with a fairly typical median household size
Family households account for 66.5% of all households, including 22.4% couples with children, 29.0% couples without children, and 13.9% single parent families. Non-family households make up the remaining 33.5%, with lone person households at 30.7% and group households comprising 2.9%. The median household size is 2.3 people, matching the Rest of NSW average.
Frequently Asked Questions - Households
Local Schools & Education
Inverell faces educational challenges, with performance metrics placing it in the bottom quartile of areas assessed nationally
The area's university qualification rate is 13.5%, significantly lower than the NSW average of 32.2%. Bachelor degrees are most common at 10.3%, followed by postgraduate qualifications (1.6%) and graduate diplomas (1.6%). Vocational credentials are prevalent, with 40.8% of residents aged 15+ holding them, including advanced diplomas (8.4%) and certificates (32.4%). Educational participation is high at 29.8%, with 12.2% in primary education, 8.9% in secondary education, and 1.9% pursuing tertiary education.
Educational participation is notably high, with 29.8% of residents currently enrolled in formal education. This includes 12.2% in primary education, 8.9% in secondary education, and 1.9% pursuing tertiary education.
Frequently Asked Questions - Education
Schools Detail
Nearby Services & Amenities
Transport
Transport servicing is very low compared to other areas nationally based on assessment of service frequency, route connectivity and accessibility
The analysis of public transport in Inverell shows that there are 35 active transport stops currently operating. These stops serve a mix of bus routes, with a total of 12 individual routes providing service to the area. Together, these routes facilitate 112 weekly passenger trips.
The accessibility of transport in Inverell is considered good, with residents typically living within 336 meters of their nearest transport stop. On average, across all routes, there are 16 trips per day, which equates to approximately 3 weekly trips per individual stop.
Frequently Asked Questions - Transport
Transport Stops Detail
Health
Health performance in Inverell is well below average with prevalence of common health conditions notable across both younger and older age cohorts
Inverell faces significant health challenges, with common conditions prevalent across both younger and older age groups. Private health cover is low, at approximately 47% (around 5,769 people), compared to the national average of 55.3%.
The most common conditions are arthritis (10.4%) and asthma (9%). About 63.6% of residents report no medical ailments, slightly higher than Rest of NSW's 61.0%. Inverell has 22.6% (2,794 people) aged 65 and over, lower than Rest of NSW's 27.4%. Despite this, health outcomes among seniors present challenges, performing better than the general population in certain metrics.
Frequently Asked Questions - Health
Cultural Diversity
Inverell is considerably less culturally diverse than average when assessed alongside AreaSearch's national rankings for language and cultural background related metrics
Inverell has a lower level of cultural diversity compared to the average, with 88.1% of its population being Australian citizens, 91.9% born in Australia, and 94.5% speaking English only at home. Christianity is the predominant religion in Inverell, accounting for 63.9% of the population, which is slightly lower than the 64.8% recorded across the Rest of NSW. The top three ancestral groups in Inverell are Australian (33.8%), English (31.0%), and Australian Aboriginal (7.9%).
Some ethnic groups have notable differences in representation: Filipino residents make up 0.9% of Inverell's population, higher than the regional average of 0.4%, while German residents comprise 3.1%, lower than the regional average of 3.9%. Samoan residents account for 0.1% in both Inverell and the broader region.
Frequently Asked Questions - Diversity
Age
Inverell's population is slightly older than the national pattern
Inverell's median age is 41 years, which is lower than the Rest of NSW average of 43 but higher than the national average of 38. The 15-24 age group constitutes 12.6% of Inverell's population, compared to a higher percentage in the Rest of NSW. The 55-64 cohort makes up 11.4%. According to data from the 2021 Census, the 15-24 age group has increased from 11.7% to 12.6%, while the 5-14 cohort has decreased from 13.7% to 12.7%. Future demographic projections suggest significant changes in Inverell's age profile by 2041. The 25-34 age group is expected to grow significantly, with a projected increase of 17%, adding 250 residents to reach a total of 1,761. Conversely, population declines are anticipated for the 5-14 and 15-24 cohorts.
