Chart Color Schemes
This analysis uses ABS Statistical Areas Level 2 (SA2) boundaries, which can materially differ from Suburbs and Localities (SAL) even when sharing similar names.
SA2 boundaries are defined by the Australian Bureau of Statistics and are designed to represent communities for statistical reporting (e.g., census and ERP).
Suburbs and Localities (SAL) represent commonly-used suburb/locality names (postal-style areas) and may use different geographic boundaries. For comprehensive analysis, consider reviewing both boundary types if available.
est. as @ -- *
ABS ERP | -- people | --
2021 Census | -- people
Sales Activity
Curious about local property values? Filter the chart to assess the volume and appreciation (including resales) trends and regional comparisons, or scroll to the map below view this information at an individual property level.
Find a Recent Sale
Sales Detail
Population
Moree Surrounds is positioned among the lower quartile of areas assessed nationally for population growth based on AreaSearch's assessment of recent, and medium term trends
Moree Surrounds' population, as per AreaSearch's analysis, is approximately 5,330 as of November 2025. This figure represents a decrease of 26 individuals (0.5%) since the 2021 Census, which reported a population of 5,356 people. The change is inferred from the estimated resident population of 5,263 from the ABS as of June 2024 and an additional 20 validated new addresses since the Census date. This results in a population density ratio of 0.30 persons per square kilometer. While Moree Surrounds experienced a 0.5% decline since the census, the SA3 area achieved 0.3% growth, indicating divergent population trends. Natural growth contributed approximately 90.8% of overall population gains during recent periods.
AreaSearch is adopting ABS/Geoscience Australia projections for each SA2 area, released in 2024 with a base year of 2022. For areas not covered by this data, AreaSearch uses the NSW State Government's SA2 level projections, released in 2022 with a base year of 2021. Growth rates by age group from these aggregations are applied to all areas for years 2032 to 2041. Future population trends indicate an increase just below Australia's non-metropolitan median, with the area expected to increase by 519 persons to 2041 based on the latest annual ERP population numbers, reflecting an overall increase of 8.5% over the 17 years.
Frequently Asked Questions - Population
Development
The level of residential development activity in Moree Surrounds is very low in comparison to the average area assessed nationally by AreaSearch
Moree Surrounds had minimal residential development activity with 2 dwelling approvals annually over the five-year period from 2016 to 2020, totalling 13 dwellings. This low level of development reflects the rural nature of the area, where housing needs typically drive development rather than broad market demand. Note that due to the small number of approvals, individual projects can significantly impact annual growth statistics.
Compared to Rest of NSW and national patterns, Moree Surrounds has much lower development activity. Of the new building activity, 50% were standalone homes and 50% townhouses or apartments, indicating a shift from the current housing mix of 93% houses. This change reflects reduced availability of development sites and addresses shifting lifestyle demands and affordability requirements. As of 2021, the area has an estimated population of 3301 people per dwelling approval, reflecting its quiet, low activity development environment. Population forecasts indicate Moree Surrounds will gain 452 residents by 2041, according to the latest AreaSearch quarterly estimate (Q2 2021). If current construction levels persist, housing supply may lag population growth, potentially intensifying buyer competition and underpinning price growth.
Population forecasts indicate Moree Surrounds will gain 452 residents through to 2041 (from the latest AreaSearch quarterly estimate). Should current construction levels persist, housing supply could lag population growth, likely intensifying buyer competition and underpinning price growth.
Frequently Asked Questions - Development
Infrastructure
Moree Surrounds has emerging levels of nearby infrastructure activity, ranking in the 39thth percentile nationally
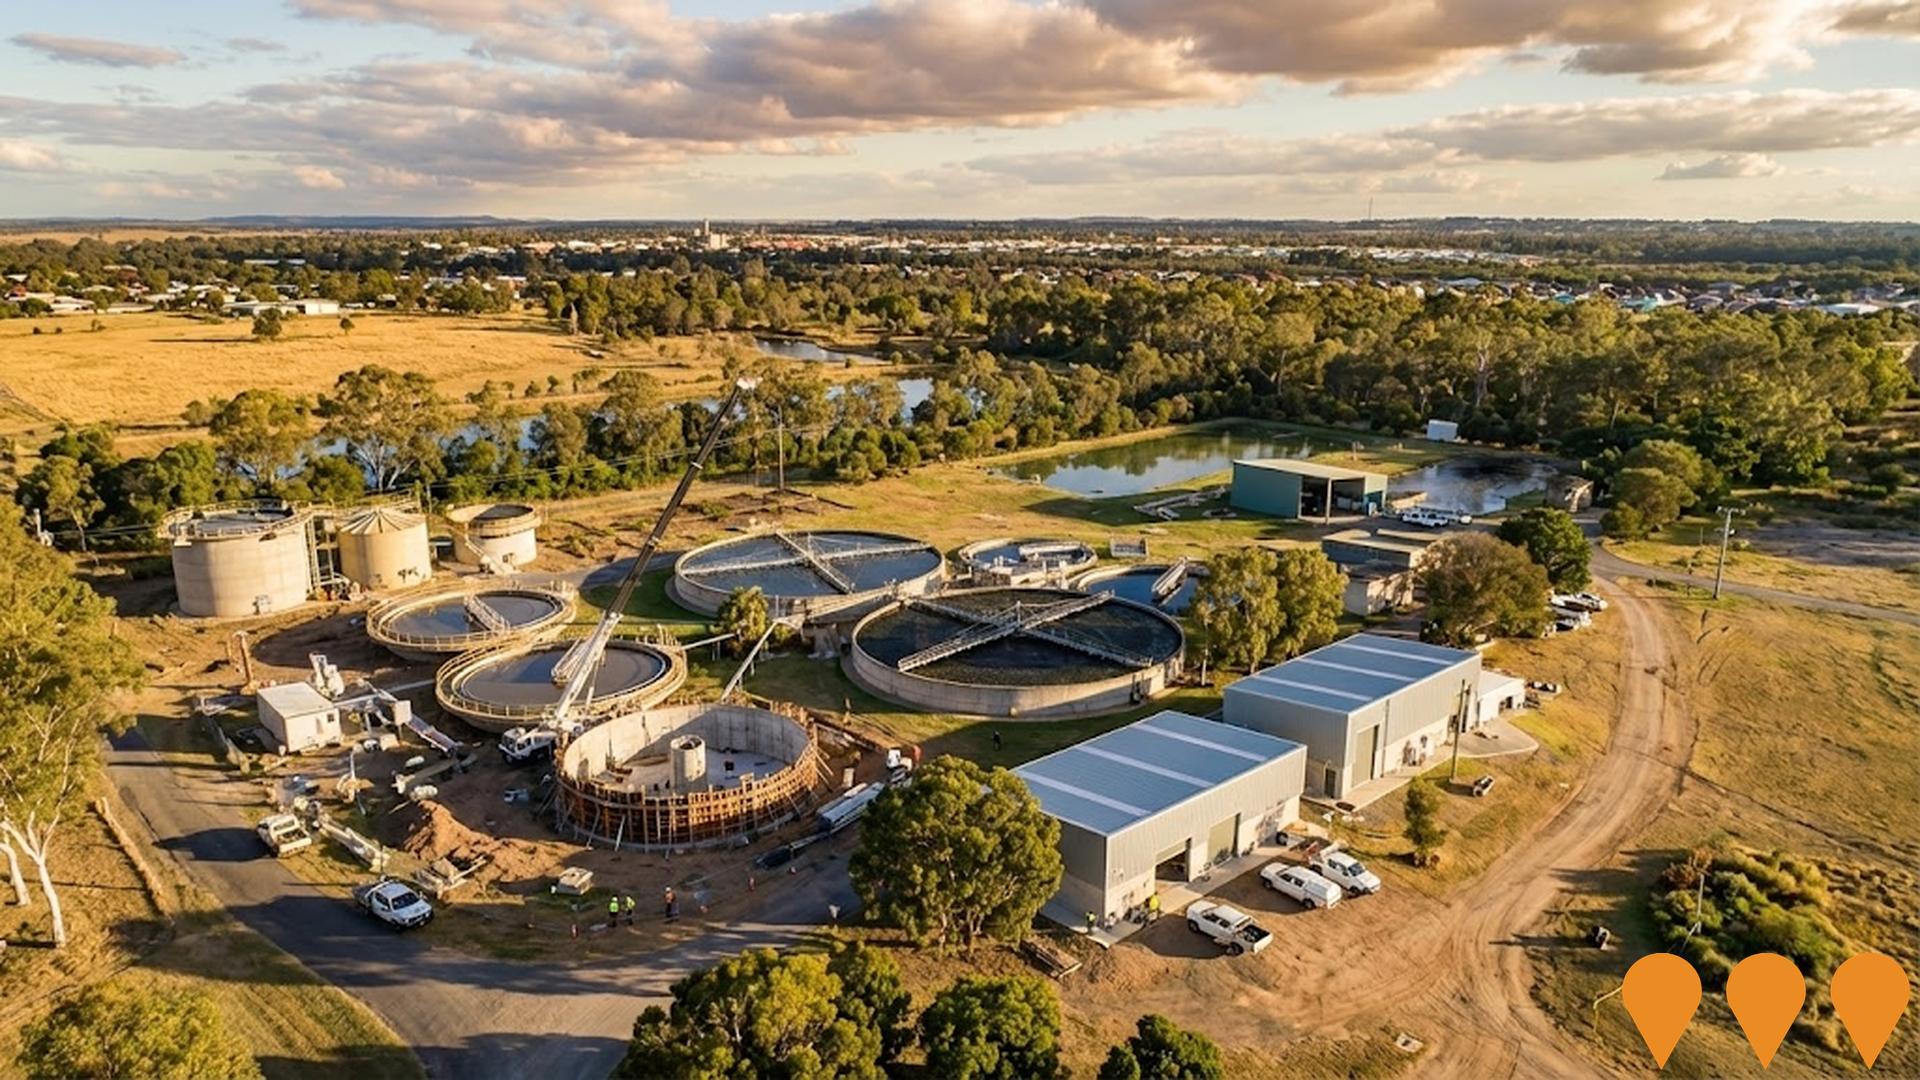
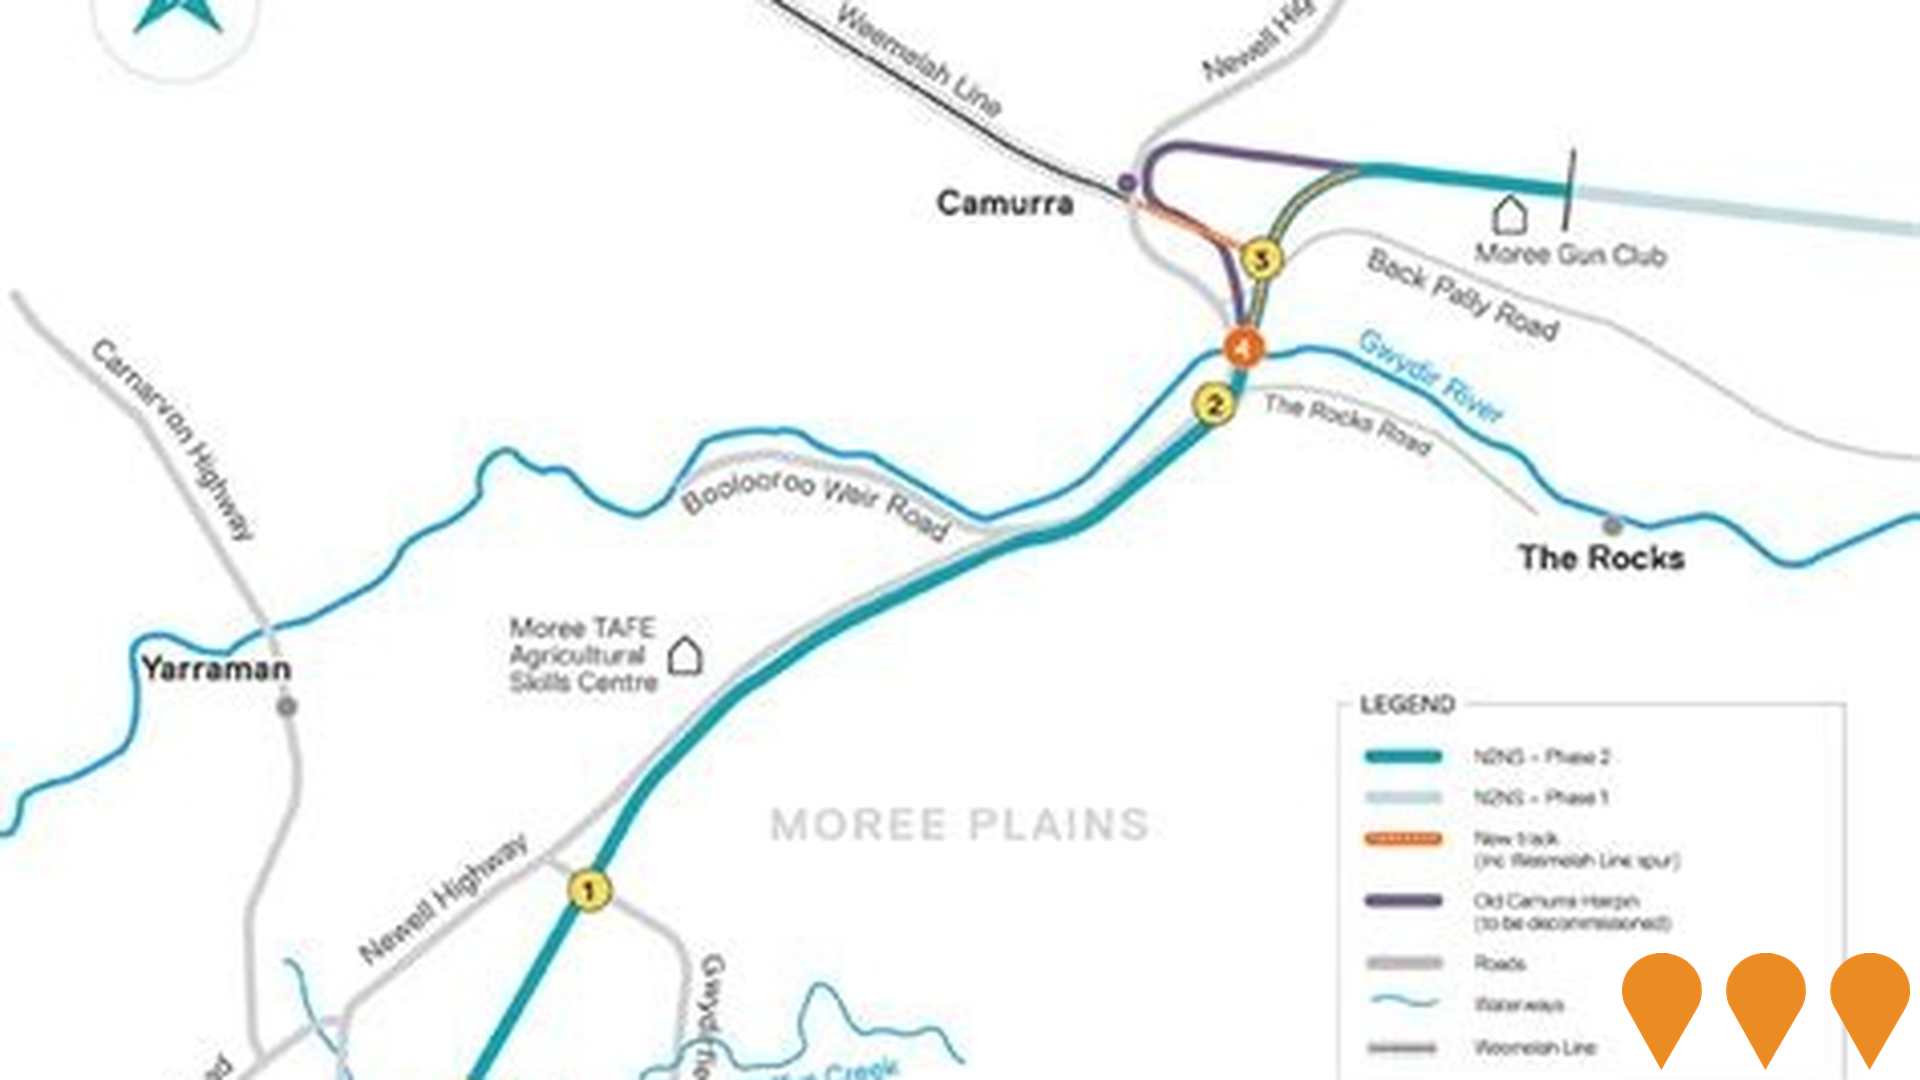
AreaSearch has identified 15 infrastructure projects that are expected to impact a certain area. Key projects include Moree Secondary College Campus Consolidation, Moree Hospital Redevelopment, Inland Rail - Narrabri to North Star - Phase Two, and Moree Water Treatment Plant Upgrades. The following list details those projects likely to be most relevant.
Professional plan users can use the search below to filter and access additional projects.
INFRASTRUCTURE SEARCH
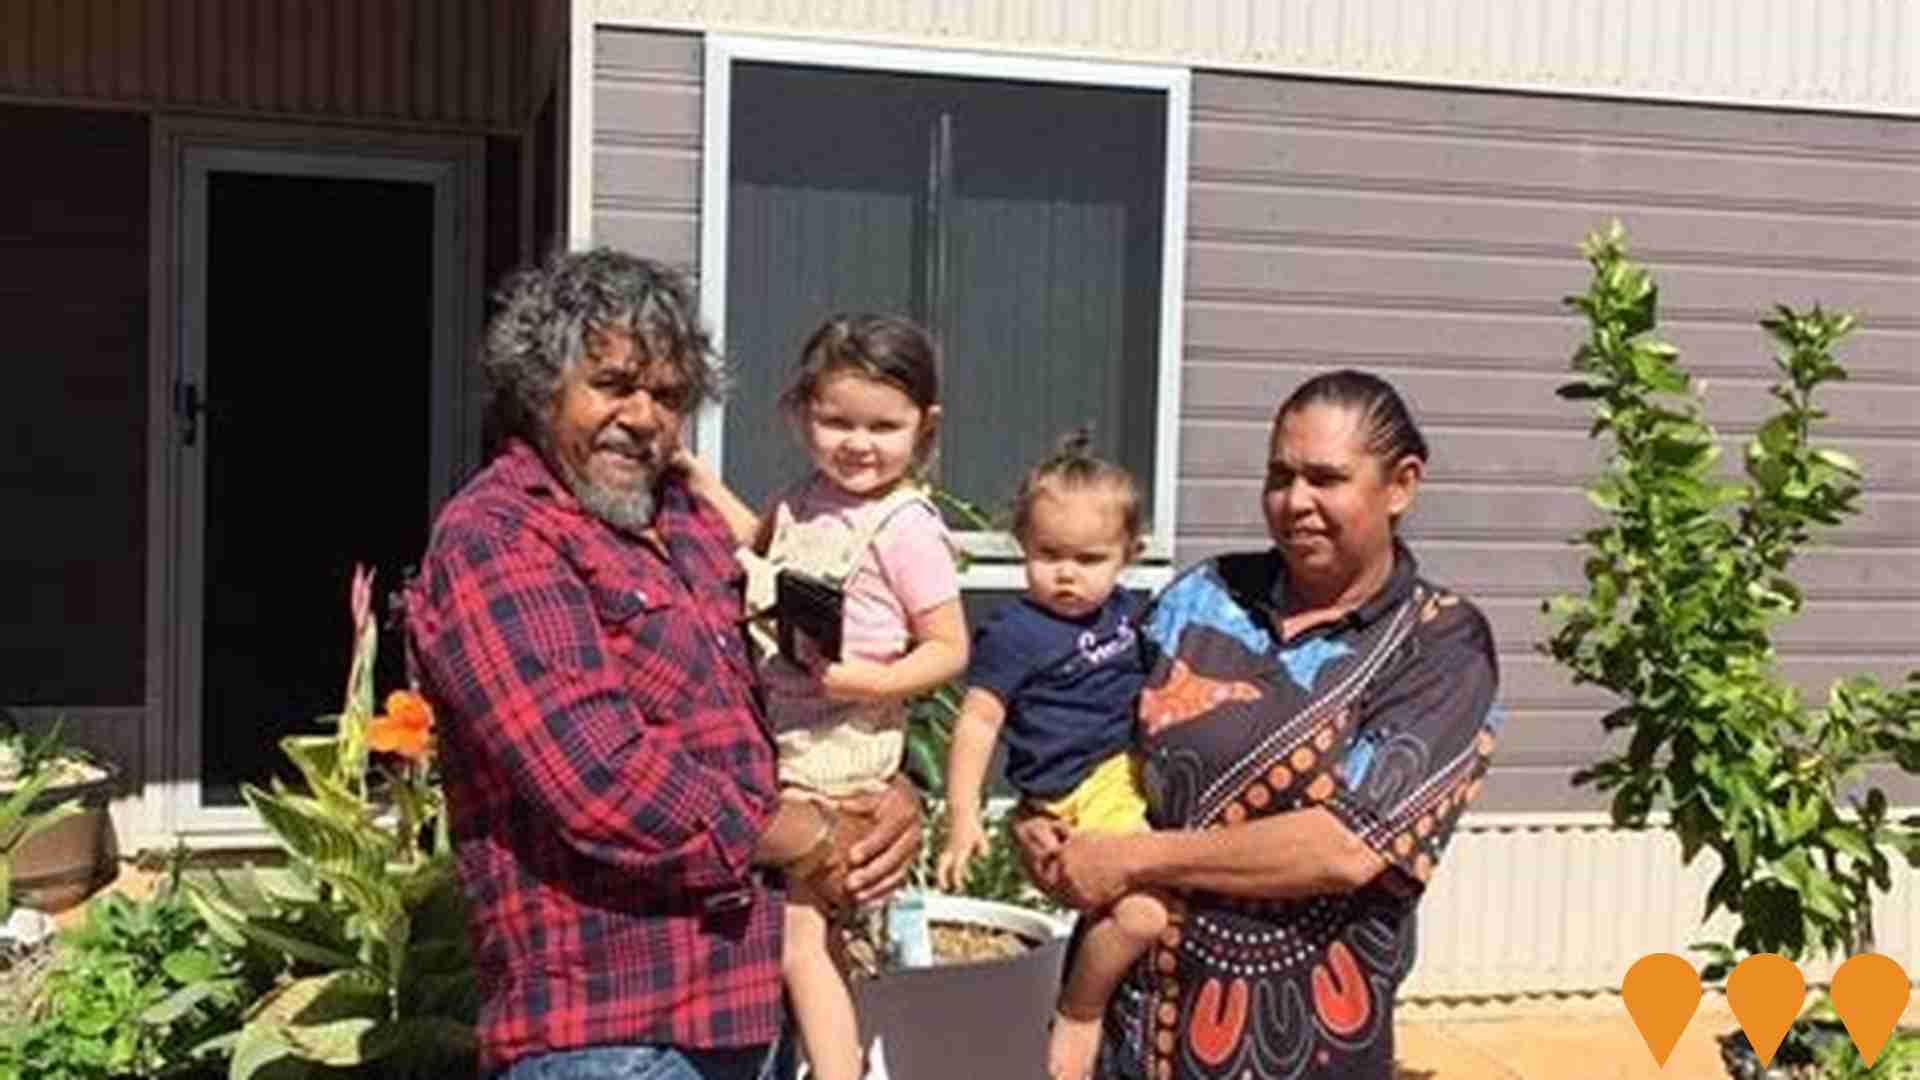
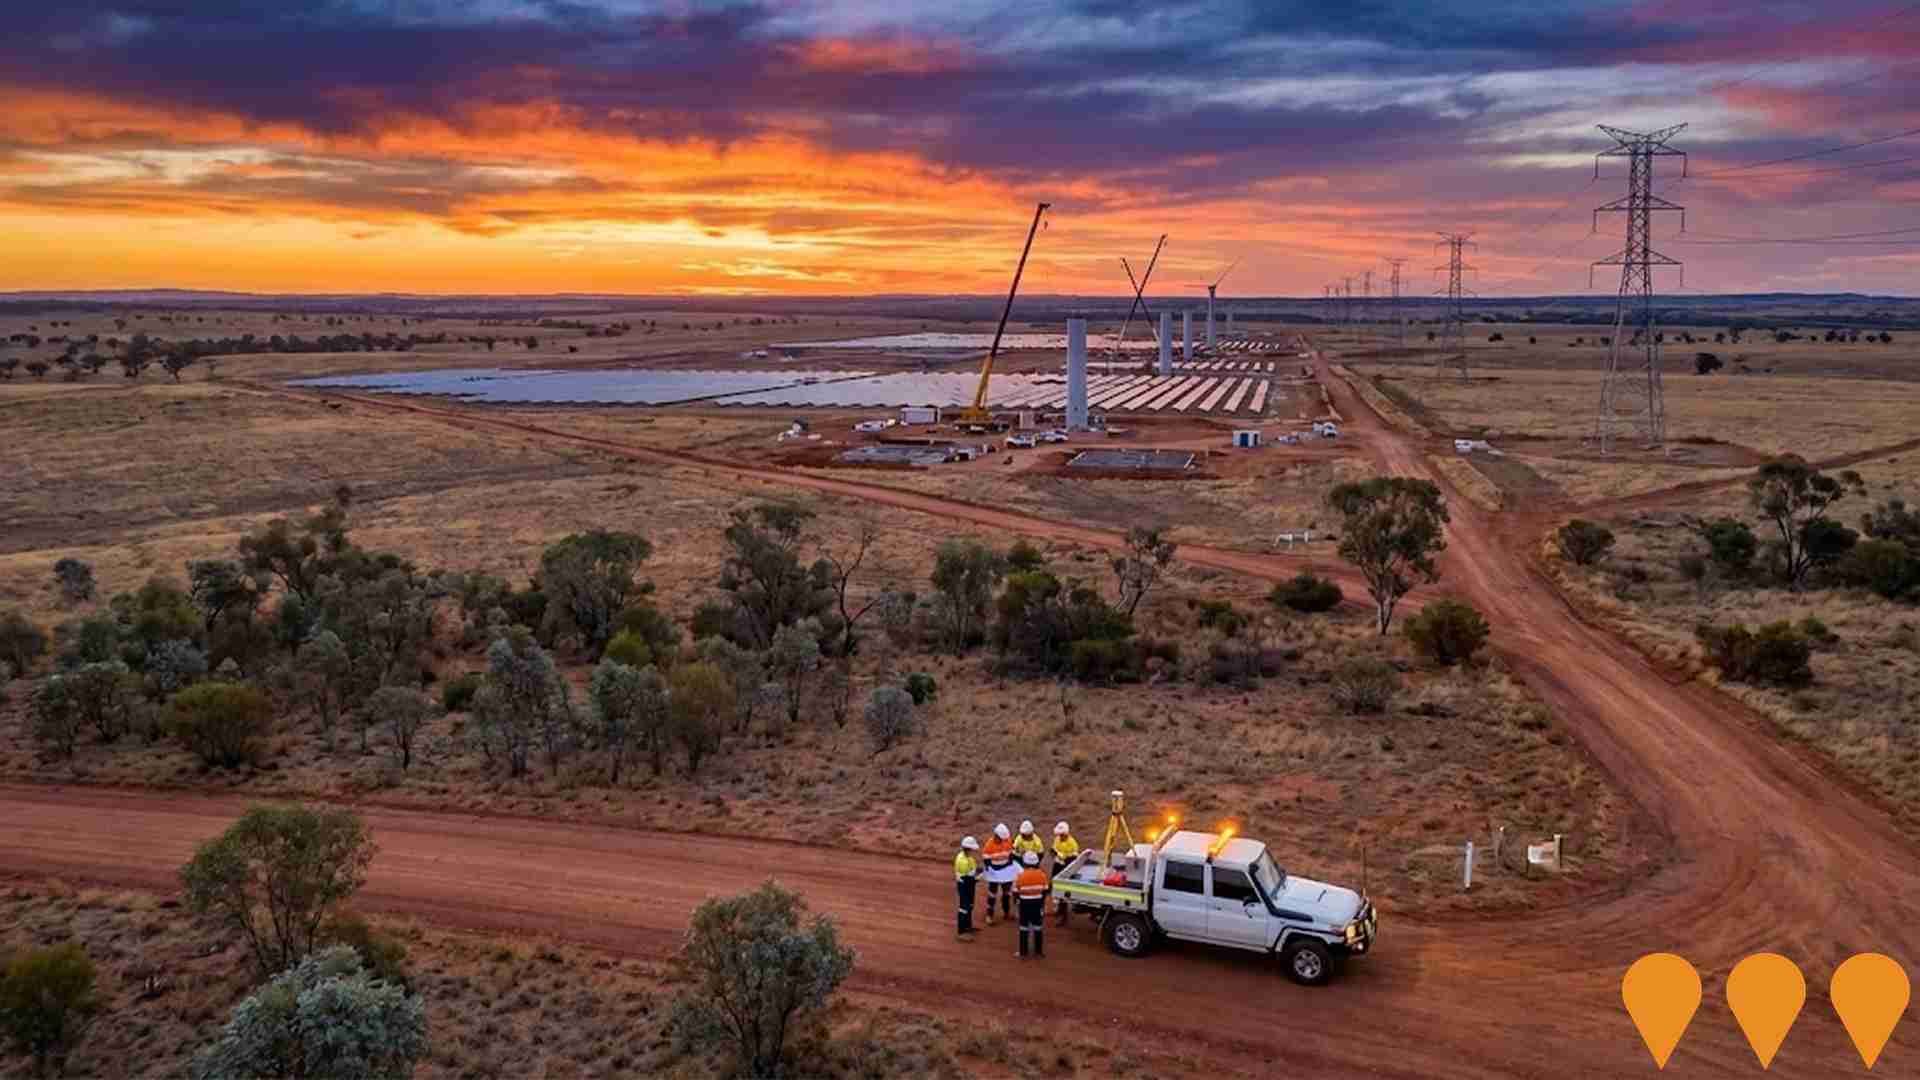
 Denotes AI-based impression for illustrative purposes only, not to be taken as definitive under any circumstances. Please follow links and conduct other investigations from the project's source for actual imagery. Developers and project owners wishing us to use original imagery please Contact Us and we will do so.
Frequently Asked Questions - Infrastructure
Moree Hospital Redevelopment
AUD170 million Stage 2 redevelopment of Moree Hospital delivering a new four-storey Acute Services Building with expanded emergency department, two operating theatres, medical imaging, birthing suite, inpatient units, pathology, and a new main entry. Works also include refurbishment of existing facilities. Hutchinson Builders appointed as managing contractor under a GMP construct-only contract. Construction commenced June 2025; practical completion expected late 2027. All clinical services remain fully operational throughout construction.

Moree Special Activation Precinct (SAP)
A 4,716-hectare Special Activation Precinct designated for high-value agribusiness, logistics, and food processing industries. Enabling works (sewer and water) are nearing completion as of late 2025. Stage 1 major infrastructure works, including road upgrades and utility connections to support the intermodal freight hub, are scheduled to commence construction in 2026.
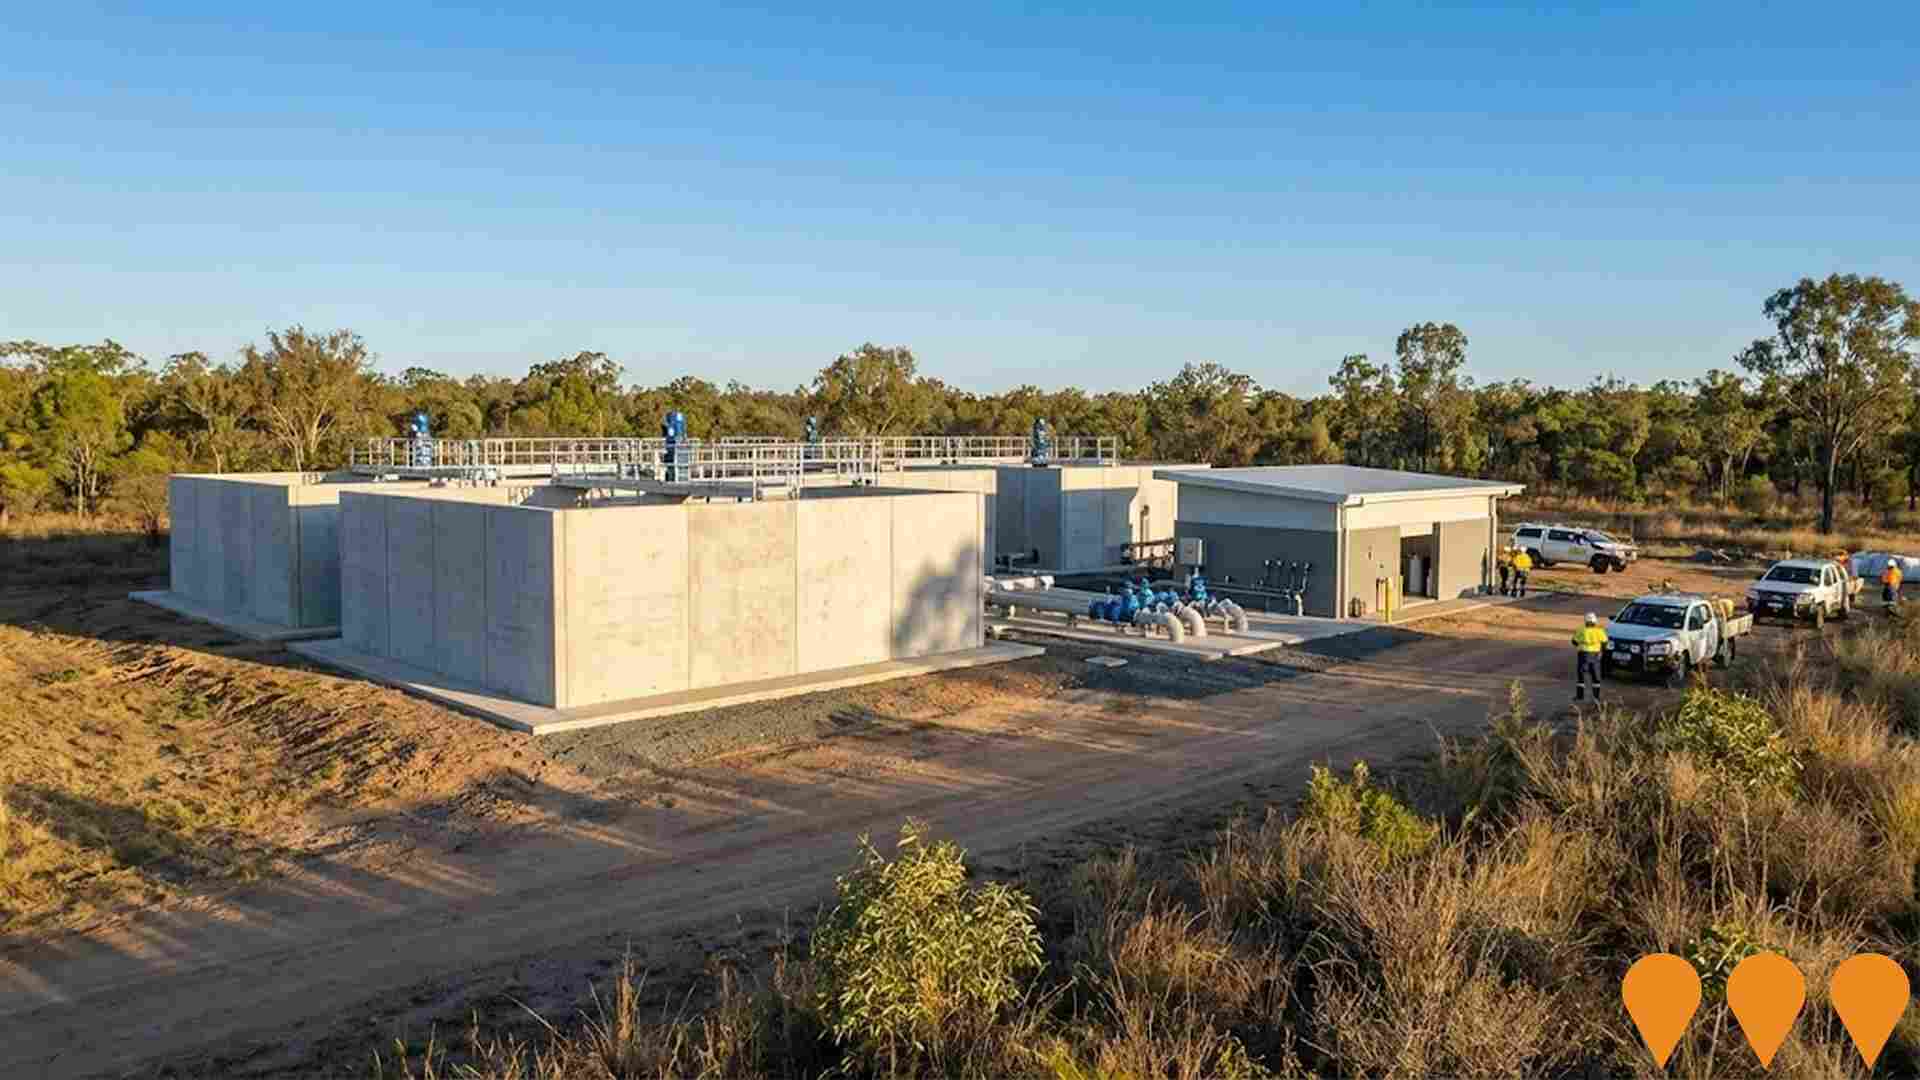
Yelarbon and Talwood water quality project
Upgrade of the Yelarbon and Talwood water treatment systems to improve potable water quality. Works included installing new reservoir mixers at both sites, a new chlorine system at Yelarbon and modifications to the existing chlorination system at Talwood. Council reported the project was on track for completion by June 2024, supporting safer, more consistent disinfection and water quality for both towns.
Narrabri Solar Farm and BESS
A 140 MW DC solar farm with a 100 MW / 800 MWh battery energy storage system on approximately 312 hectares of private rural land. The project will generate enough renewable energy to power approximately 35,000 homes and offset around 182,000 tonnes of CO2 annually. It will connect to the existing 132 kV transmission line and contribute to the National Electricity Market.

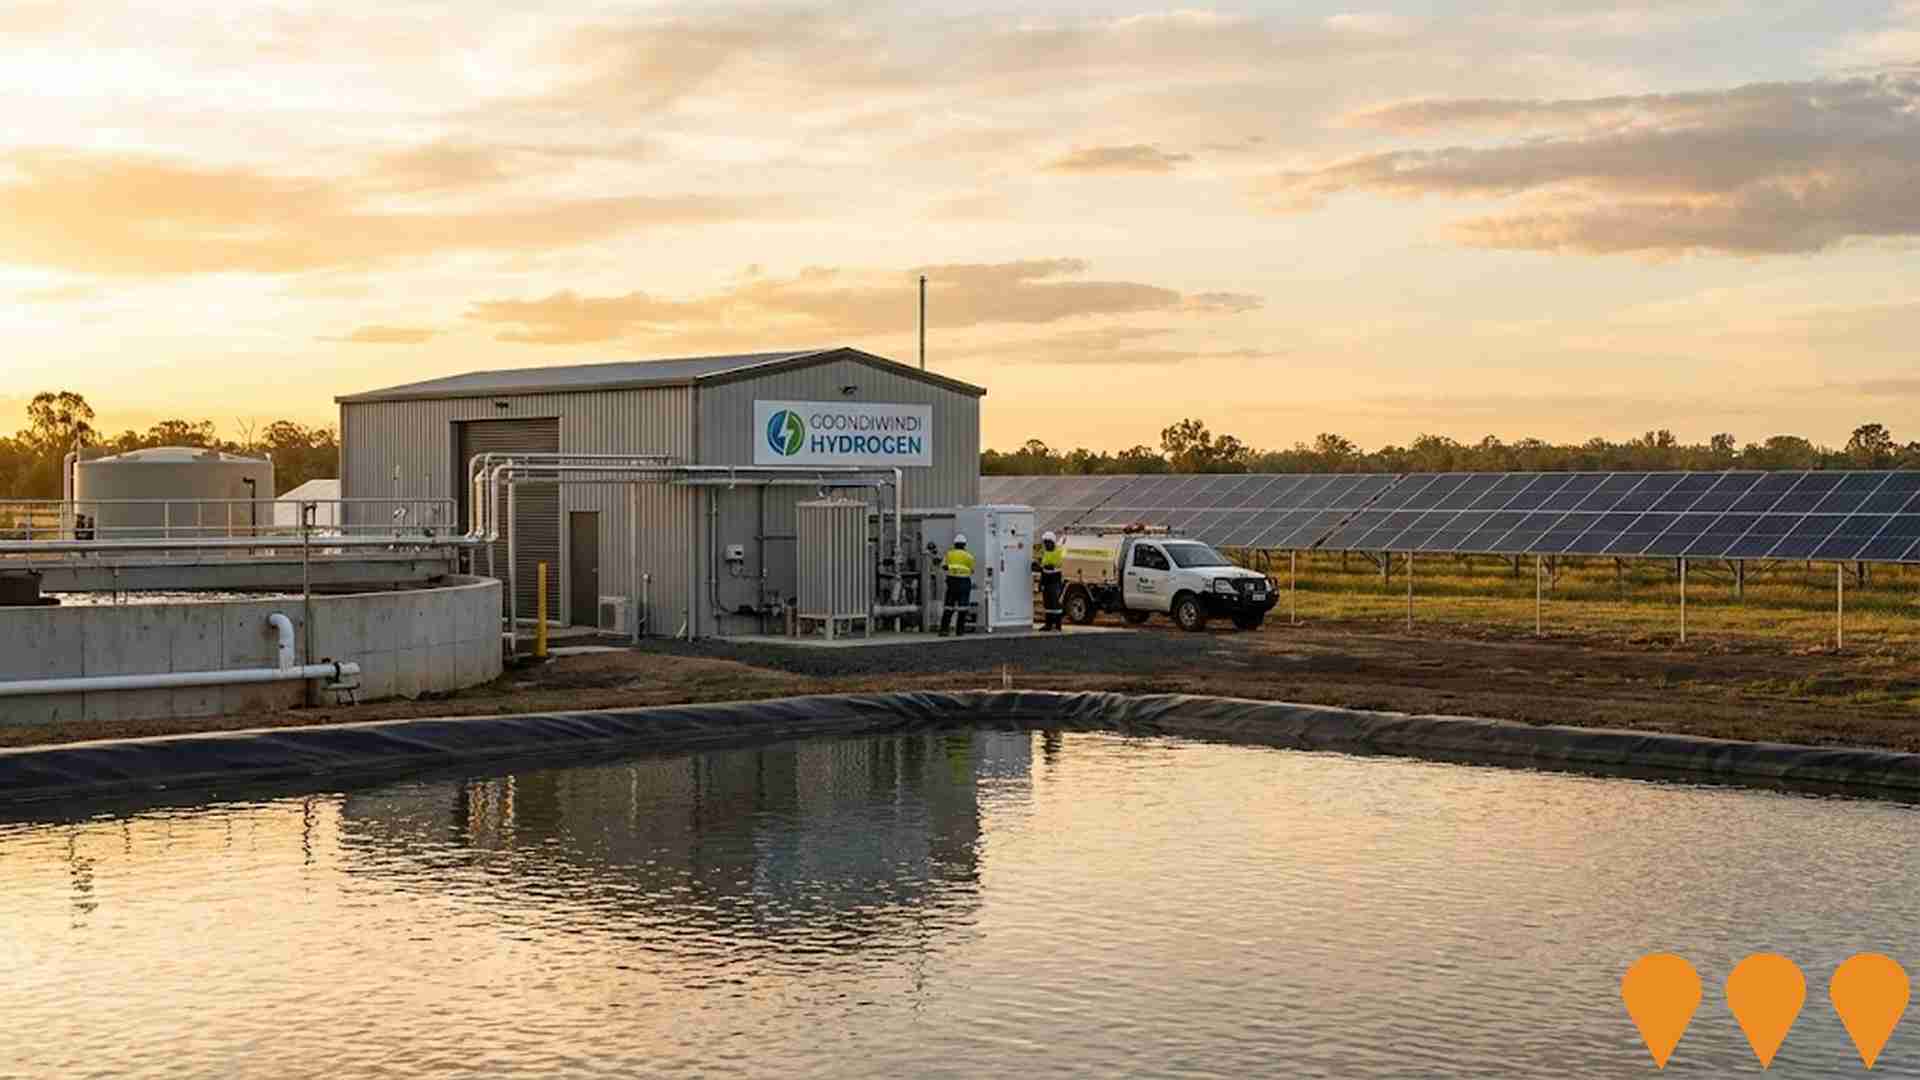
Goondiwindi Hydrogen
The Goondiwindi Regional Council, in partnership with The Hydrogen Collective (H2C), is developing a renewable hydrogen production facility at the Goondiwindi wastewater treatment plant. It utilizes a 2.5 MW solar array and wastewater to produce green hydrogen for local agricultural and industrial use, with oxygen byproduct enhancing wastewater treatment efficiency. Stage 1 includes a 2 MW electrolyser producing approximately 300 tonnes of hydrogen per annum.
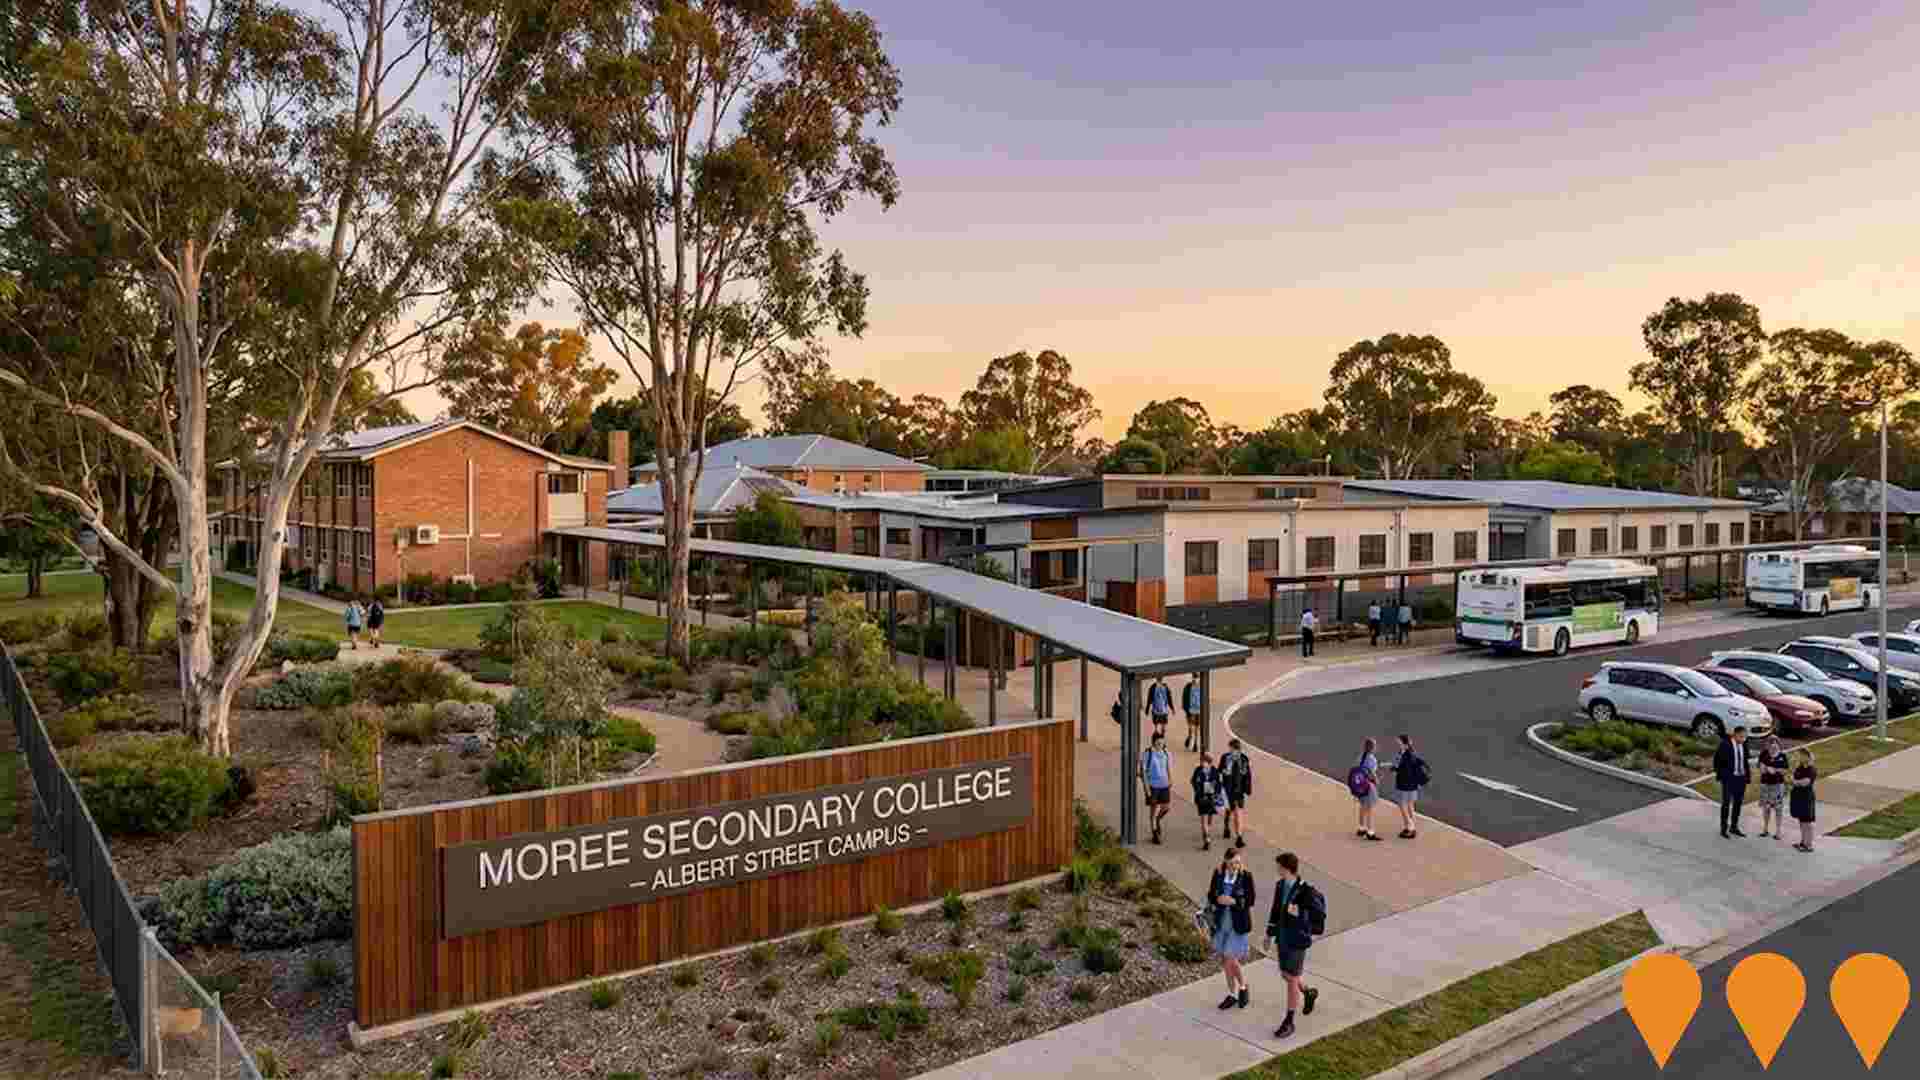
Moree Secondary College Campus Consolidation
The project consolidated Moree Secondary College's two campuses into a single operational campus at Albert Street, with associated minor upgrades and works to enable one-site delivery from Term 1 2024.
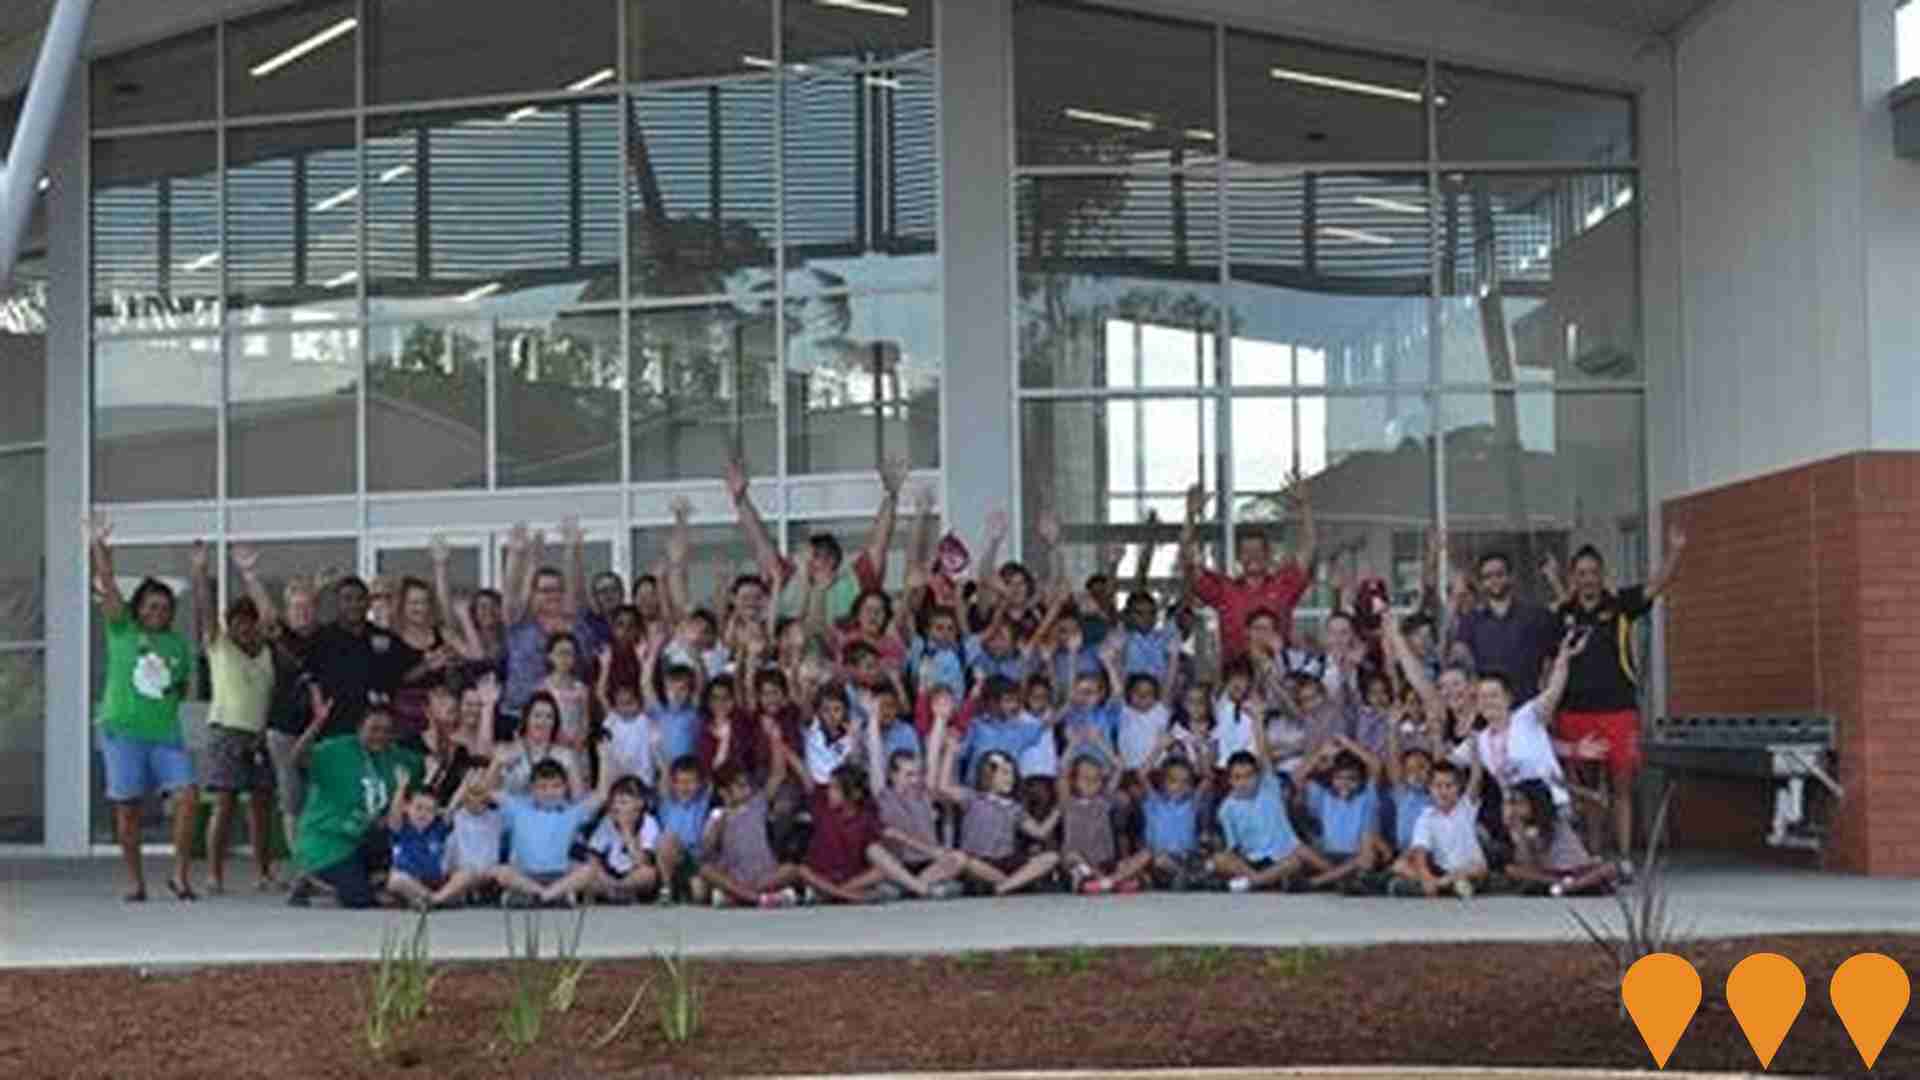
Moree East Public School Redevelopment
Substantial rebuild and refurbishment of Moree East Public School delivering around 15 new and refurbished classrooms, two shared learning spaces, a new hall and library, and upgrades to community hub facilities to support modern teaching and learning.
Moree Regional Airport Upgrades
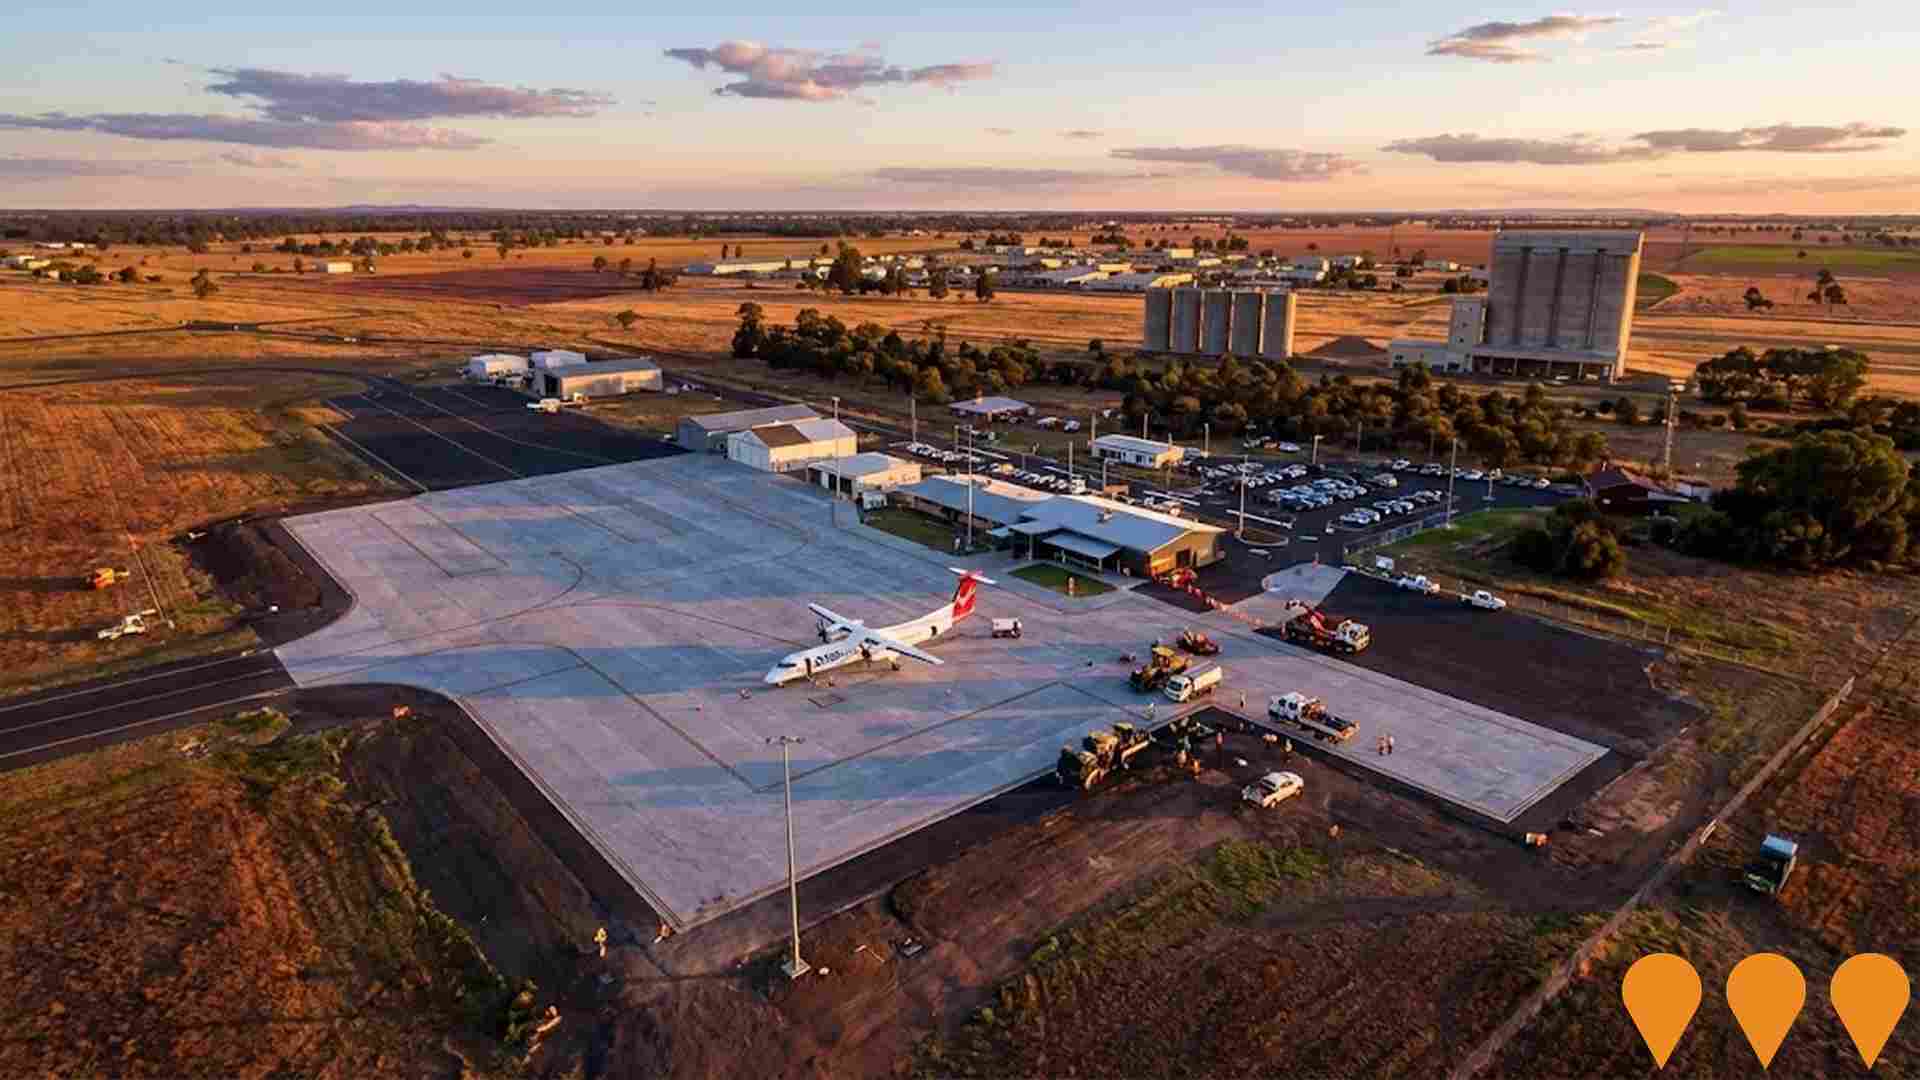
Staged upgrades to Moree Regional Airport led by Moree Plains Shire Council to increase capacity and resilience for passenger, freight and aeromedical operations supporting the Moree Special Activation Precinct. Works completed/underway include multi-stage apron expansion enabling Q400 operations, with additional funding secured in Feb 2025 to upgrade the aeromedical apron, taxiway and parking bays to create a 24-hour aeromedical facility. Future stages flagged in planning documents include terminal improvements and potential runway enhancements aligned to SAP growth.
Employment
The labour market in Moree Surrounds shows considerable strength compared to most other Australian regions
Moree Surrounds has a skilled workforce with diverse sector representation. As of September 2025, its unemployment rate is 2.1%.
Over the past year, it has seen an estimated employment growth of 0.6%. The area's unemployment rate is 1.7% lower than Rest of NSW's rate of 3.8%, but workforce participation is somewhat below standard at 53.7% compared to Rest of NSW's 56.4%. Key industries of employment among residents are agriculture, forestry & fishing, education & training, and health care & social assistance. Moree Surrounds shows strong specialization in agriculture, forestry & fishing with an employment share 9.5 times the regional level.
However, health care & social assistance is under-represented at 6.8% compared to Rest of NSW's 16.9%. The area appears to offer limited local employment opportunities based on Census data analysis. Over a 12-month period ending in September 2025, employment increased by 0.6%, labour force increased by 0.7%, and unemployment rose by 0.1 percentage points. In comparison, Rest of NSW saw employment fall by 0.5%, labour force contract by 0.1%, and unemployment rise by 0.4 percentage points. State-level data to 25-Nov-25 shows NSW employment contracted by 0.03% (losing 2,260 jobs), with the state unemployment rate at 3.9%. National employment forecasts from May-25 suggest national employment will expand by 6.6% over five years and 13.7% over ten years. Applying these projections to Moree Surrounds' employment mix suggests local employment should increase by 4.4% over five years and 10.2% over ten years, assuming constant population projections.
Frequently Asked Questions - Employment
Income
Income levels sit below national averages according to AreaSearch assessment
AreaSearch's latest postcode level ATO data for financial year 2022 shows Moree Surrounds SA2 had a median income among taxpayers of $49,134 and an average of $59,163. This is below the national average. The median income in Rest of NSW was $49,459 with an average of $62,998. Based on Wage Price Index growth of 12.61% since financial year 2022, current estimates would be approximately $55,330 (median) and $66,623 (average) as of September 2025. Census data indicates household, family and personal incomes rank modestly in Moree Surrounds, between the 43rd and 52nd percentiles. The earnings profile shows 32.2% of the population, or 1,716 individuals, fall within the $1,500 - $2,999 income range, similar to metropolitan regions where 29.9% occupy this range. After housing costs, residents retain 93.5% of their income, reflecting strong purchasing power and the area's SEIFA income ranking places it in the 5th decile.
Frequently Asked Questions - Income
Housing
Moree Surrounds is characterized by a predominantly suburban housing profile, with above-average rates of outright home ownership
Moree Surrounds' dwellings, as per the latest Census, consisted of 93.0% houses and 7.0% other dwellings (such as semi-detached homes, apartments, and 'other' types). This compares to Non-Metro NSW's 87.8% houses and 12.1% other dwellings. Home ownership in Moree Surrounds stood at 42.9%, with mortgaged dwellings at 25.9% and rented ones at 31.2%. The median monthly mortgage repayment was $867, lower than Non-Metro NSW's average of $1,300. Weekly rent in Moree Surrounds was $175, compared to Non-Metro NSW's $220. Nationally, mortgage repayments were significantly lower at $867 versus Australia's average of $1,863, and rents were substantially below the national figure of $375.
Frequently Asked Questions - Housing
Household Composition
Moree Surrounds has a typical household mix, with a higher-than-average median household size
Family households account for 71.7% of all households, including 31.1% couples with children, 28.4% couples without children, and 10.8% single parent families. Non-family households constitute the remaining 28.3%, with lone person households at 26.0% and group households comprising 2.1%. The median household size is 2.6 people, which is larger than the Rest of NSW average of 2.5.
Frequently Asked Questions - Households
Local Schools & Education
Educational outcomes in Moree Surrounds fall within the lower quartile nationally, indicating opportunities for improvement in qualification attainment
The area's university qualification rate is 19.6%, significantly lower than NSW's average of 32.2%. Bachelor degrees are the most common at 15.7%, followed by graduate diplomas (2.5%) and postgraduate qualifications (1.4%). Vocational credentials are prominent, with 41.9% of residents aged 15+ holding them, including advanced diplomas (12.5%) and certificates (29.4%). Educational participation is high at 42.6%, with 18.8% in primary education, 11.1% in secondary education, and 4.7% pursuing tertiary education.
Educational participation is notably high, with 42.6% of residents currently enrolled in formal education. This includes 18.8% in primary education, 11.1% in secondary education, and 4.7% pursuing tertiary education.
Frequently Asked Questions - Education
Schools Detail
Nearby Services & Amenities
Transport
Transport servicing is low compared to other areas nationally based on assessment of service frequency, route connectivity and accessibility
Transport analysis in Moree Surrounds shows 254 active public transport stops operating. These include a mix of train and bus services. There are 27 individual routes servicing these stops, providing a total of 281 weekly passenger trips.
Transport accessibility is limited, with residents typically located 2841 meters from the nearest stop. Service frequency averages 40 trips per day across all routes, equating to approximately one weekly trip per stop.
Frequently Asked Questions - Transport
Transport Stops Detail
Health
The level of general health in Moree Surrounds is notably higher than the national average with both young and old age cohorts seeing low prevalence of common health conditions
Moree Surrounds shows superior health outcomes for both young and elderly populations, with low prevalence rates for common health conditions. Approximately 49% (~2,617 people) have private health cover, lower than the national average of 55.3%.
The most prevalent medical conditions are asthma (8.5%) and arthritis (6.8%). About 72.9% report no medical ailments, higher than Rest of NSW's 66.7%. Around 15.7% (~836 people) are aged 65 or over, lower than Rest of NSW's 18.8%. Seniors' health outcomes excel even beyond the general population in key metrics.
Frequently Asked Questions - Health
Cultural Diversity
The latest Census data sees Moree Surrounds placing among the least culturally diverse areas in the country when compared across a range of language and cultural background related metrics
Moree Surrounds was found to have a lower level of cultural diversity, with 72.9% of its population being Australian citizens, 94.6% born in Australia, and 96.9% speaking English only at home. The predominant religion in Moree Surrounds is Christianity, which accounts for 68.2% of the population, similar to the regional figure of 68.1%. The top three ancestry groups are Australian (29.9%), English (29.4%), and Australian Aboriginal (12.3%).
There are notable differences in the representation of certain ethnic groups: Irish is overrepresented at 9.9% compared to the regional average of 8.1%, Scottish at 8.5% versus 6.8%, and German at 3.9% against a regional figure of 2.8%.
Frequently Asked Questions - Diversity
Age
Moree Surrounds's population aligns closely with national norms in age terms
The median age in Moree Surrounds is 39 years, which is significantly lower than Rest of NSW's average of 43 but essentially aligned with Australia's median age of 38 years. Compared to Rest of NSW, Moree Surrounds has a higher proportion of residents aged 25-34 (15.1%) but fewer residents aged 75-84 (4.8%). According to the 2021 Census, the population aged 25 to 34 grew from 12.5% to 15.1%, while the population aged 45 to 54 declined from 14.1% to 11.6% and the population aged 35 to 44 dropped from 11.6% to 10.6%. By 2041, demographic projections indicate significant shifts in Moree Surrounds' age structure, with the 25 to 34 group expected to grow by 32%, reaching 1,064 people from 805. Conversely, the populations aged 5 to 14 and 15 to 24 are projected to decline.
