Chart Color Schemes
This analysis uses ABS Statistical Areas Level 2 (SA2) boundaries, which can materially differ from Suburbs and Localities (SAL) even when sharing similar names.
SA2 boundaries are defined by the Australian Bureau of Statistics and are designed to represent communities for statistical reporting (e.g., census and ERP).
Suburbs and Localities (SAL) represent commonly-used suburb/locality names (postal-style areas) and may use different geographic boundaries. For comprehensive analysis, consider reviewing both boundary types if available.
est. as @ -- *
ABS ERP | -- people | --
2021 Census | -- people
Sales Activity
Curious about local property values? Filter the chart to assess the volume and appreciation (including resales) trends and regional comparisons, or scroll to the map below view this information at an individual property level.
Find a Recent Sale
Sales Detail
Population
Glen Innes is positioned among the lower quartile of areas assessed nationally for population growth based on AreaSearch's assessment of recent, and medium term trends
Glen Innes's population is approximately 9,184 as of November 2025. This figure represents an increase of 253 people, a growth rate of 2.8%, since the 2021 Census which reported a population of 8,931. The change is inferred from ABS's estimated resident population of 8,985 in June 2024 and an additional 55 validated new addresses since the Census date. This results in a population density ratio of 1.7 persons per square kilometer. Glen Innes's growth rate of 2.8% is comparable to its SA3 area's growth rate of 2.9%. Interstate migration contributed approximately 66.0% of overall population gains during recent periods.
AreaSearch uses ABS/Geoscience Australia projections for each SA2 area, released in 2024 with a base year of 2022. For areas not covered by this data, AreaSearch utilises NSW State Government's SA2 level projections, released in 2022 with a base year of 2021. Growth rates by age group from these aggregations are applied to all areas for years 2032 to 2041. Future population dynamics anticipate lower quartile growth for regional areas nationwide. Glen Innes is expected to increase by 61 persons to 2041, reflecting a decrease of 1.6% in total over the 17-year period based on the latest annual ERP population numbers.
Frequently Asked Questions - Population
Development
AreaSearch assessment of residential development drivers sees a low level of activity in Glen Innes, placing the area among the bottom 25% of areas assessed nationally
Glen Innes has recorded approximately 15 residential properties granted approval annually. Over the past five financial years, from FY-21 to FY-25, a total of 78 homes were approved, with an additional three approved so far in FY-26. On average, over these five years, 0.4 new residents arrived per new home built.
This pace suggests that new supply is keeping up with or exceeding demand, offering ample buyer choice and creating capacity for population growth beyond current forecasts. The average construction value of new dwellings was $297,000 during this period. In FY-26, $7.9 million in commercial approvals have been registered, indicating the area's primarily residential nature. When compared to the Rest of NSW, Glen Innes records approximately 62% of the building activity per person.
Nationally, it ranks at around the 27th percentile of areas assessed for building activity, suggesting more limited choices for buyers and supporting demand for existing homes. This level is also below average nationally, reflecting the area's maturity and potentially indicating planning constraints. Recent construction in Glen Innes comprises 83.0% standalone homes and 17.0% medium and high-density housing, maintaining the area's traditional low density character with a focus on family homes appealing to those seeking space. The estimated population per dwelling approval is 645 people, reflecting its quiet, low activity development environment. Given stable or declining population forecasts, Glen Innes may experience less housing pressure in the future, creating favourable conditions for buyers.
Frequently Asked Questions - Development
Infrastructure
Glen Innes has moderate levels of nearby infrastructure activity, ranking in the top 50% nationally
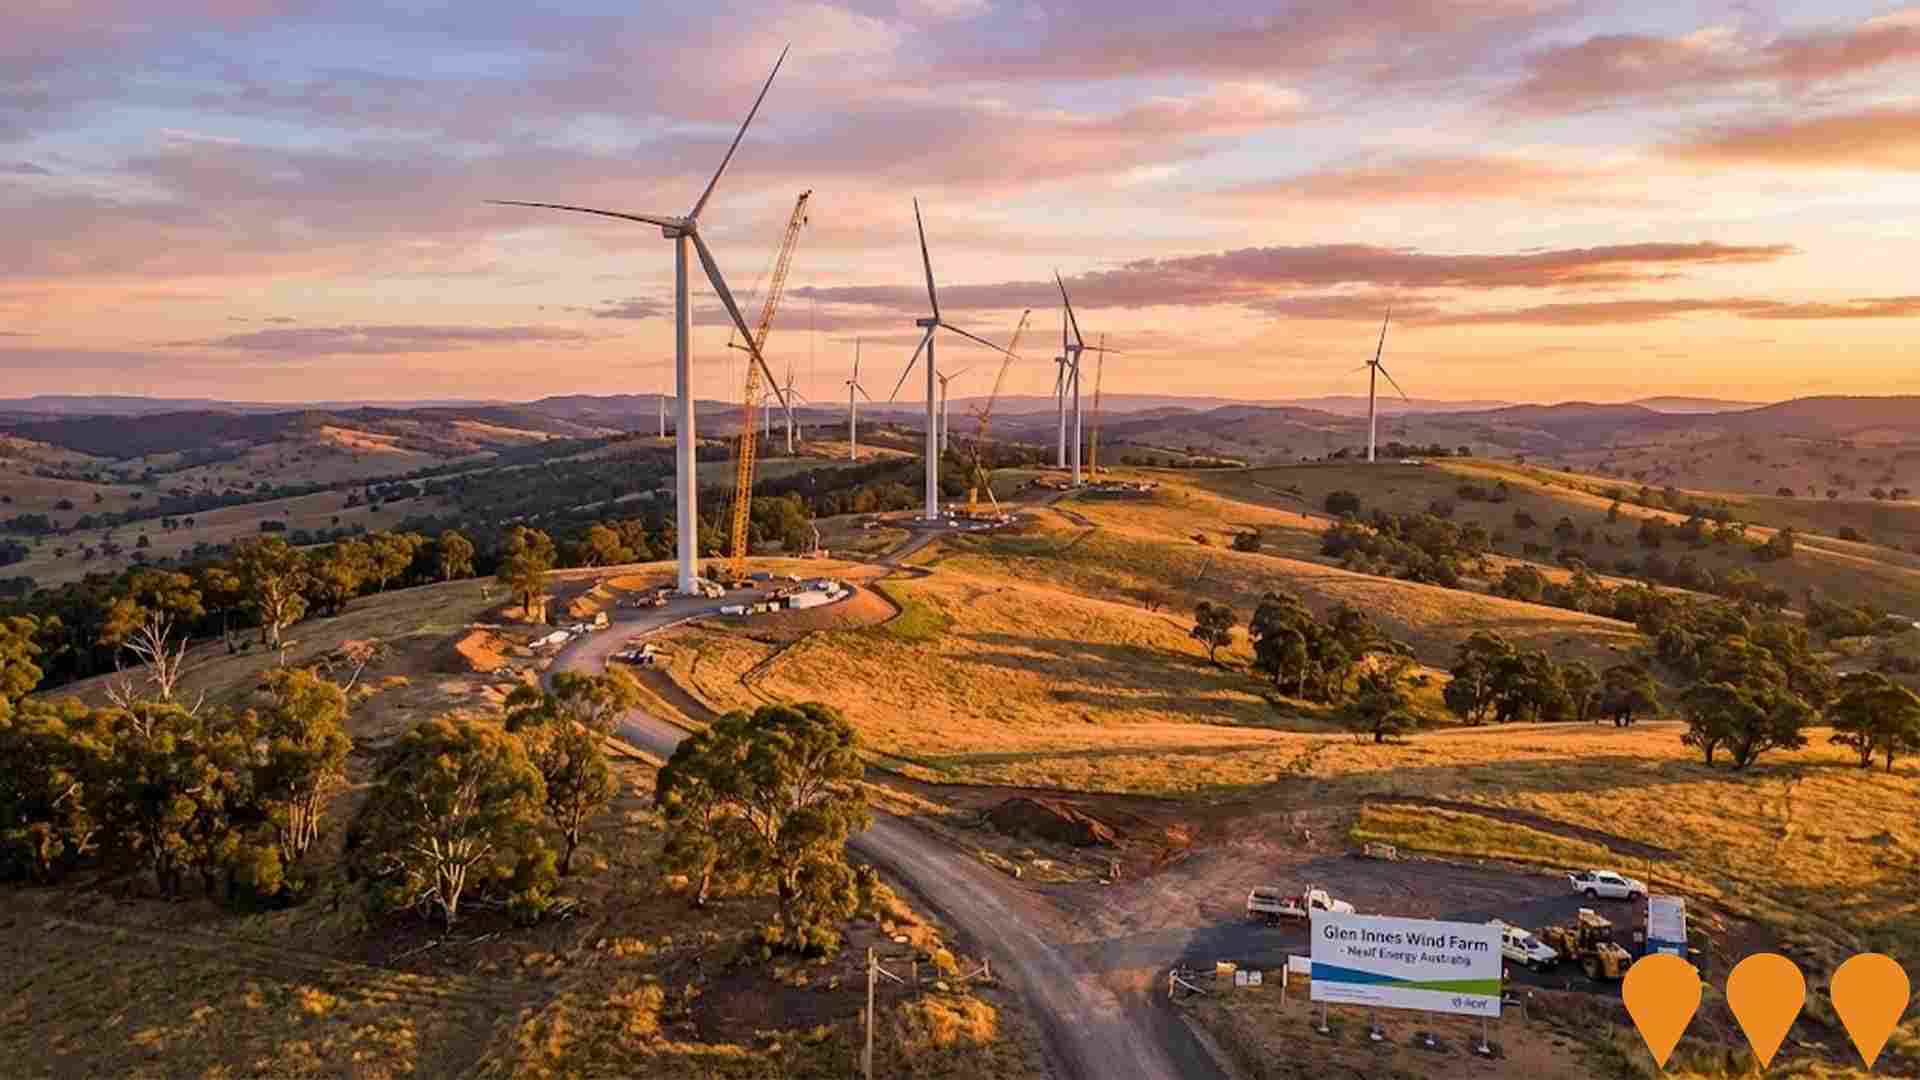
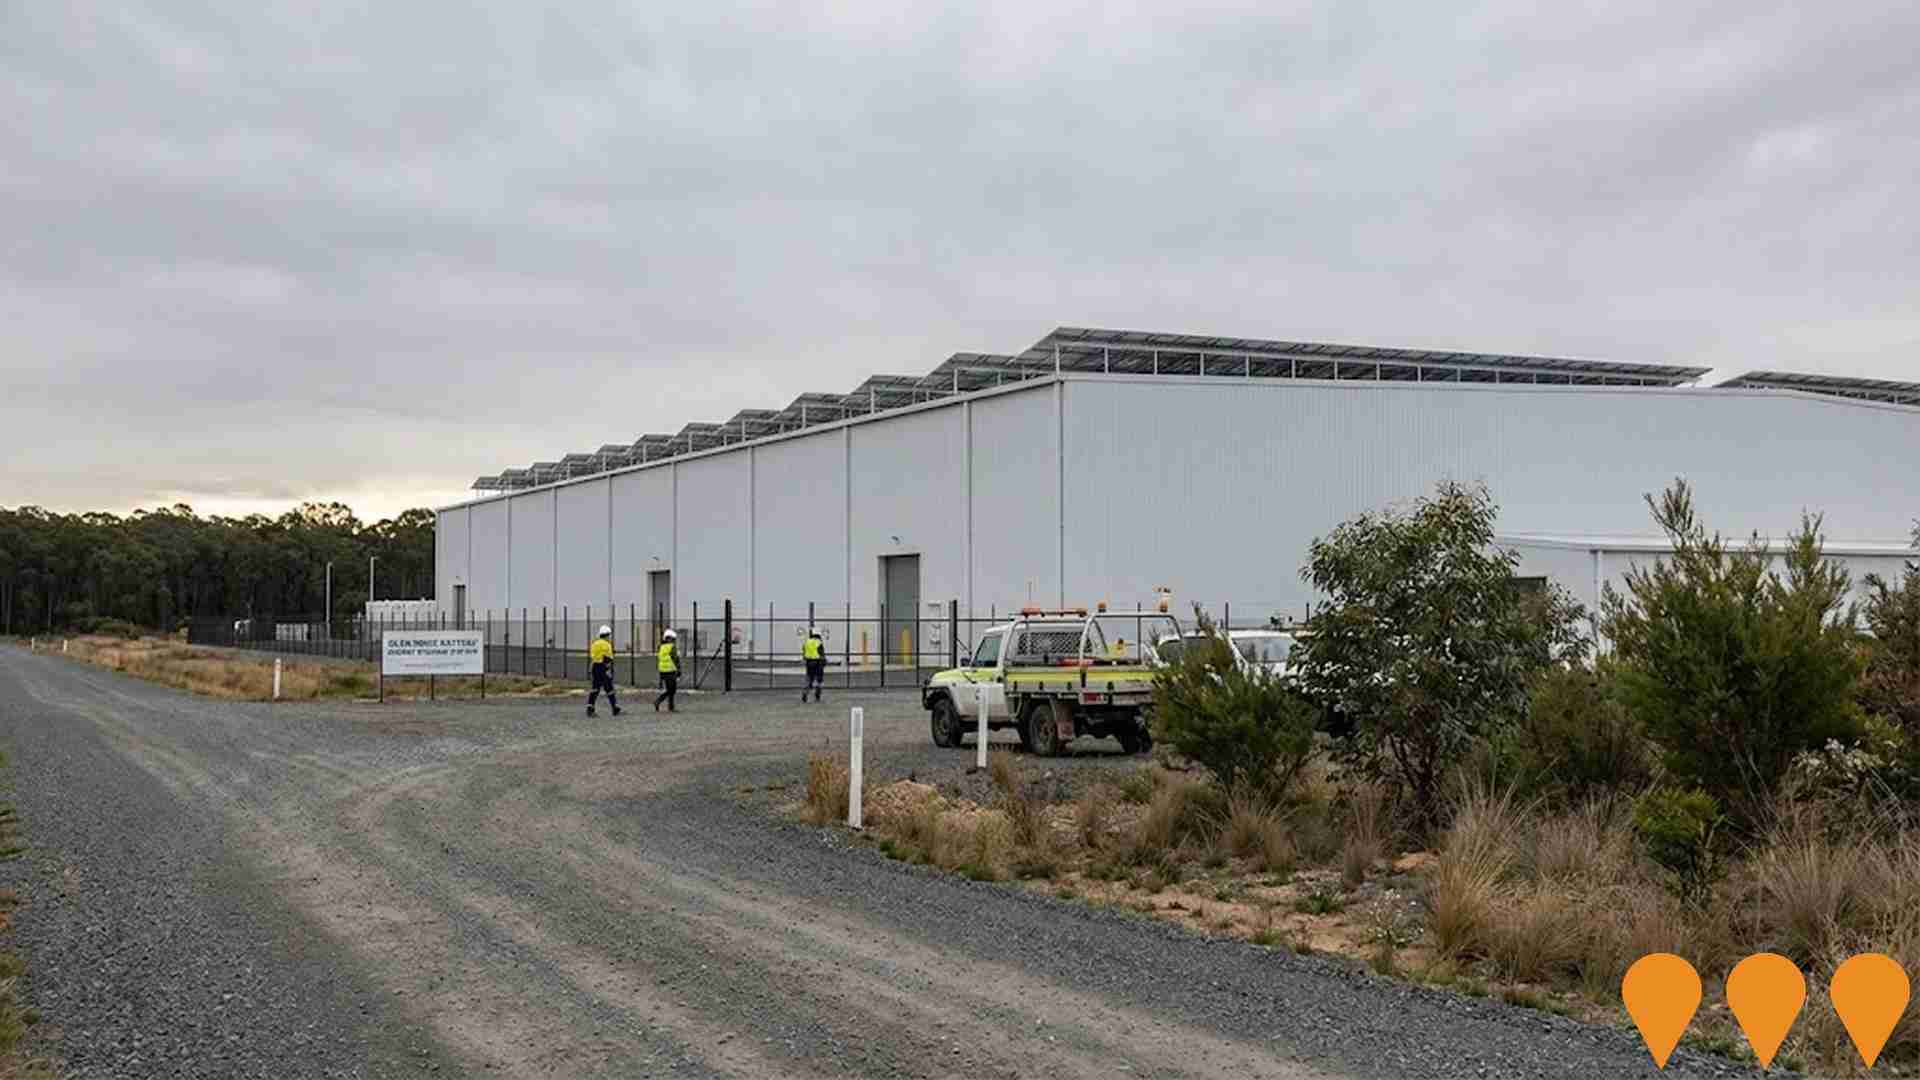
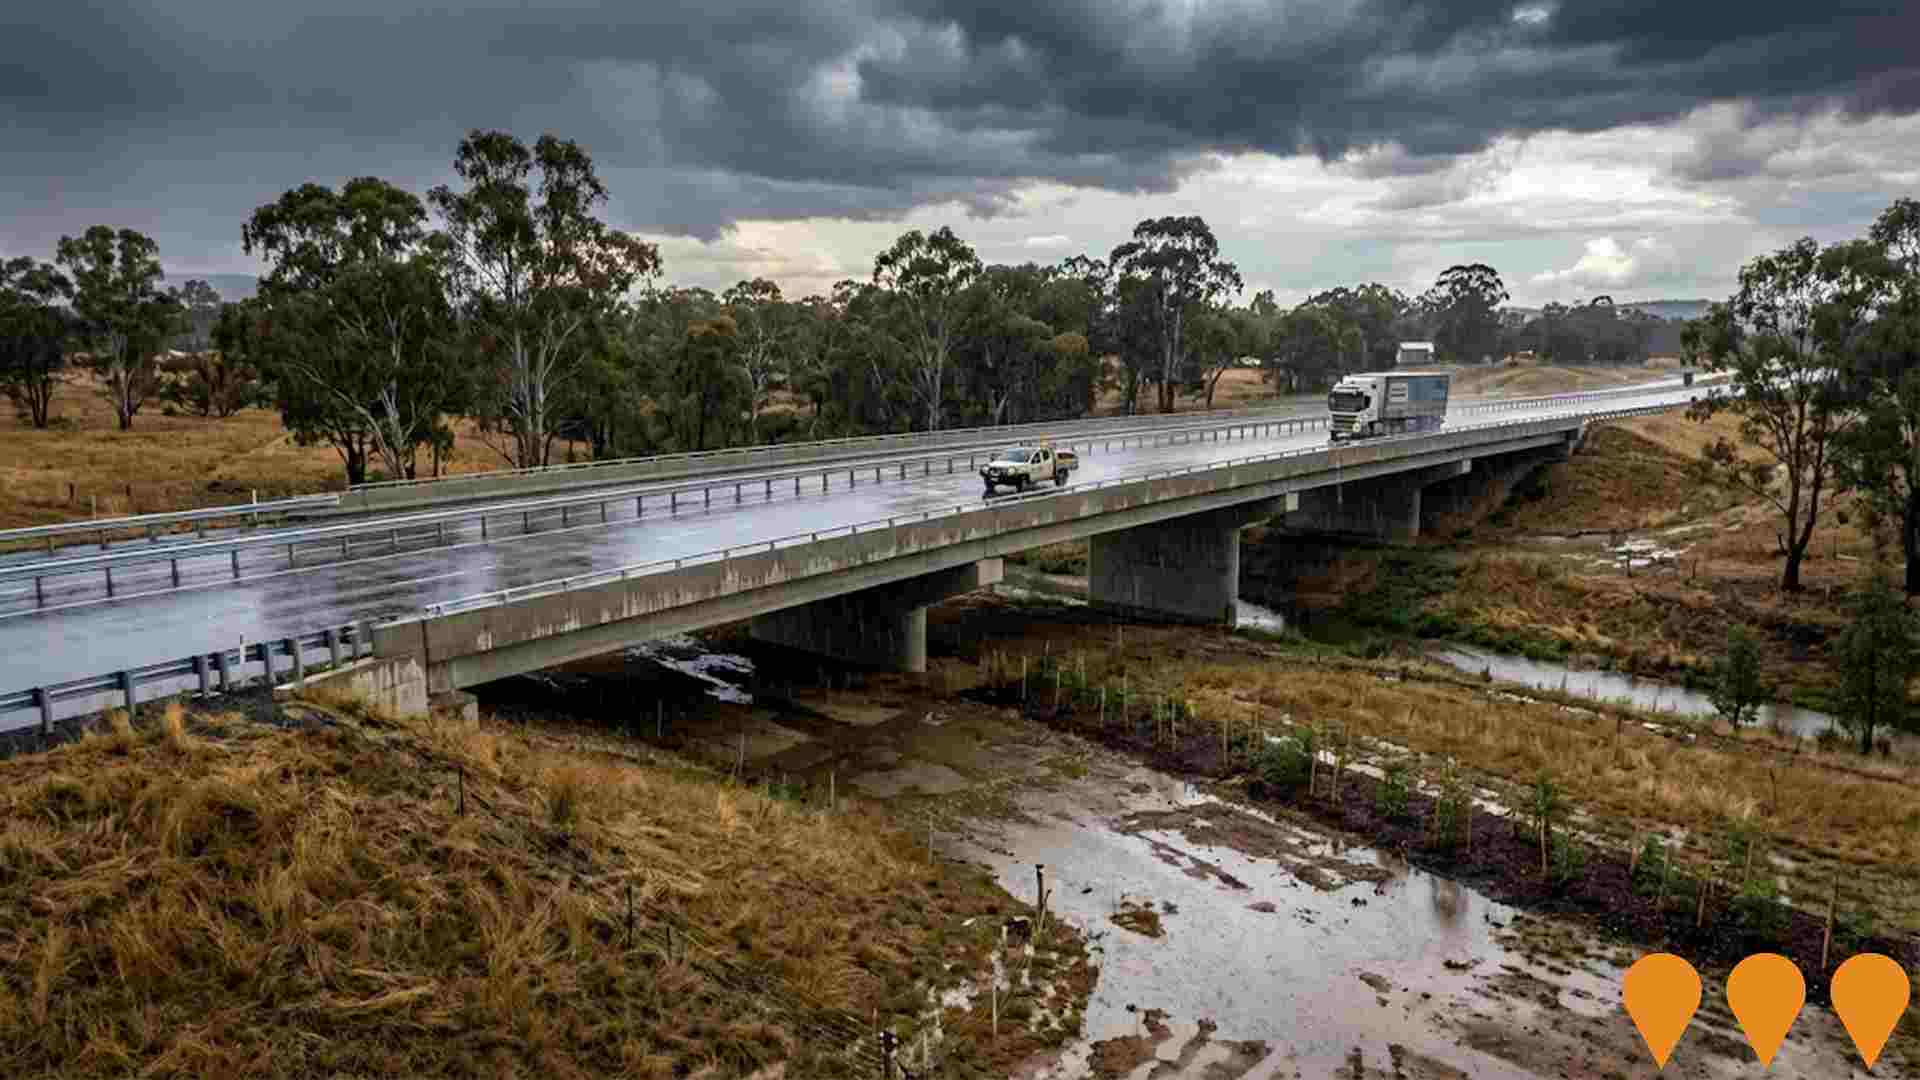
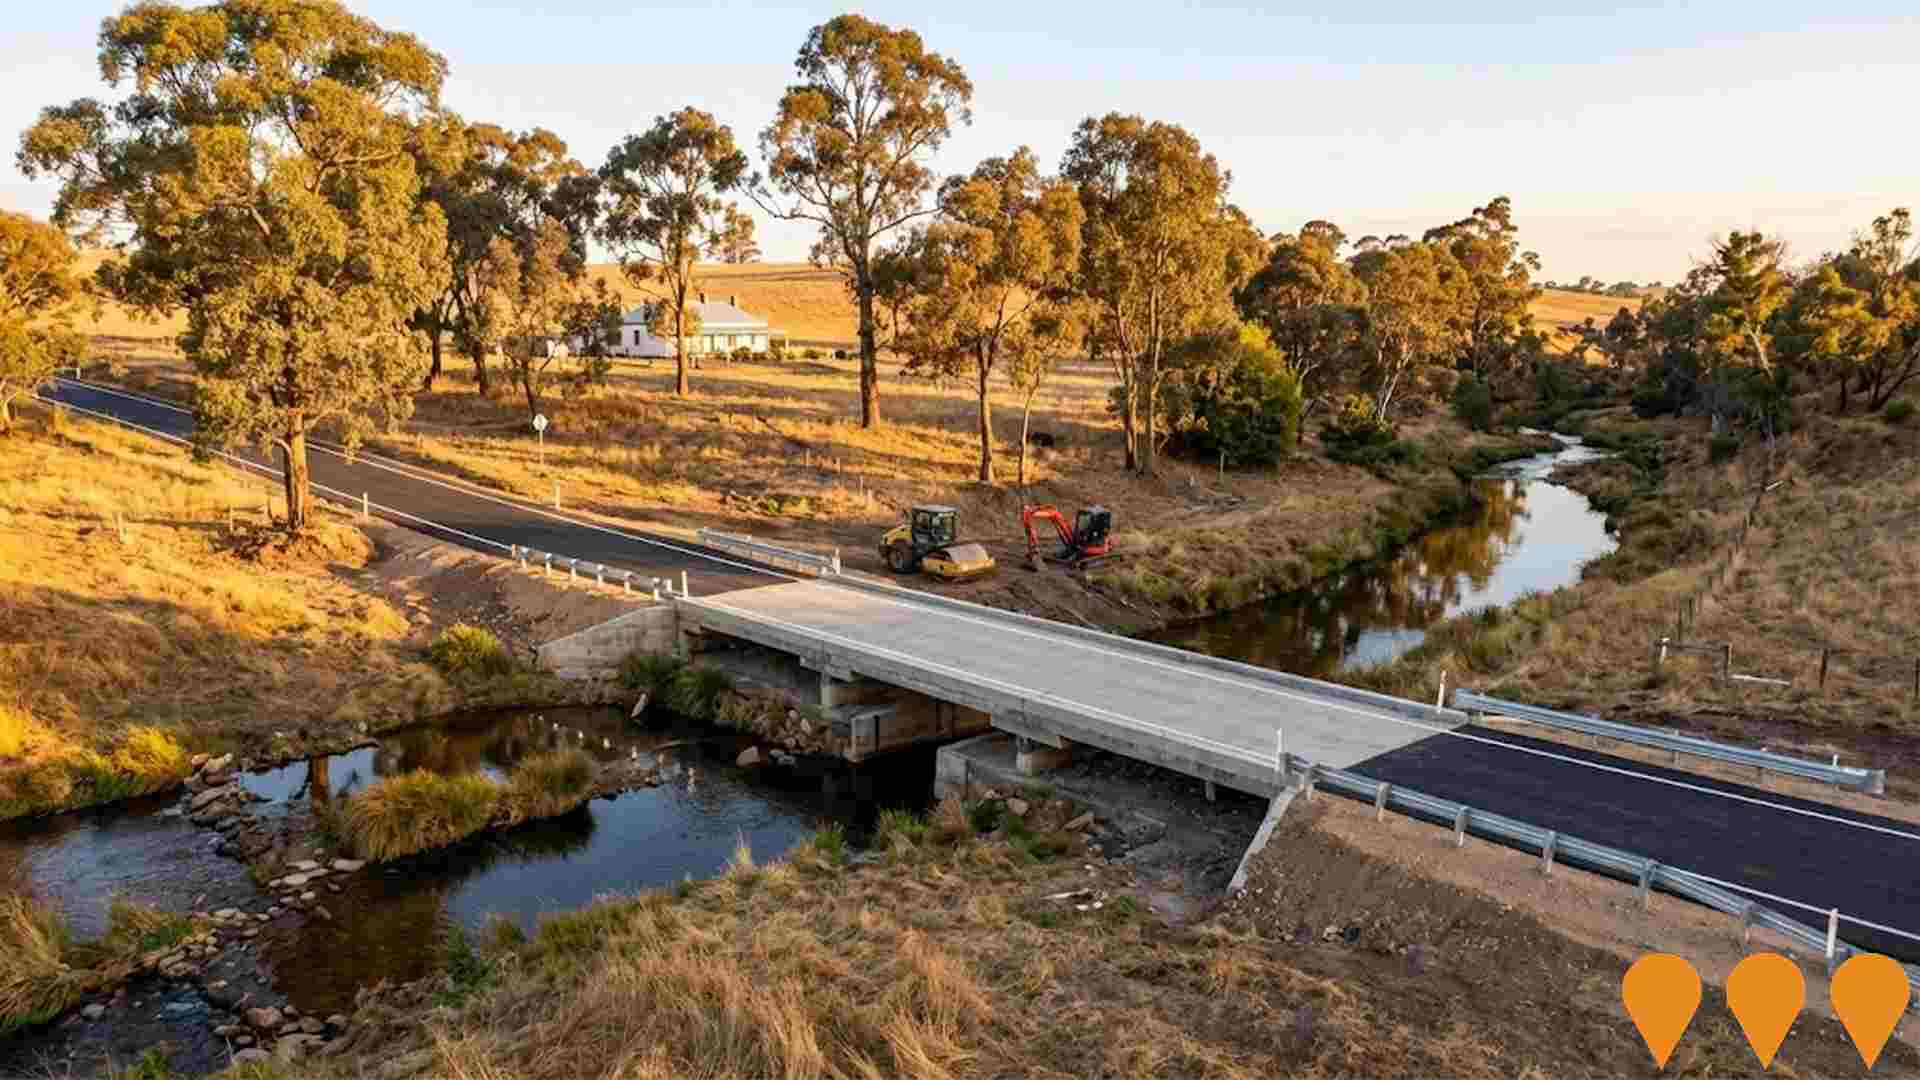
AreaSearch has identified 21 projects that could impact the area significantly due to their influence on local infrastructure. Notable projects include Glen Innes Hospital Redevelopment, Glen Innes Battery Energy Storage System, New England Highway Safety Upgrades, and St Joseph's Convent Function Centre (Glen Innes). The following list details those considered most relevant.
Professional plan users can use the search below to filter and access additional projects.
INFRASTRUCTURE SEARCH
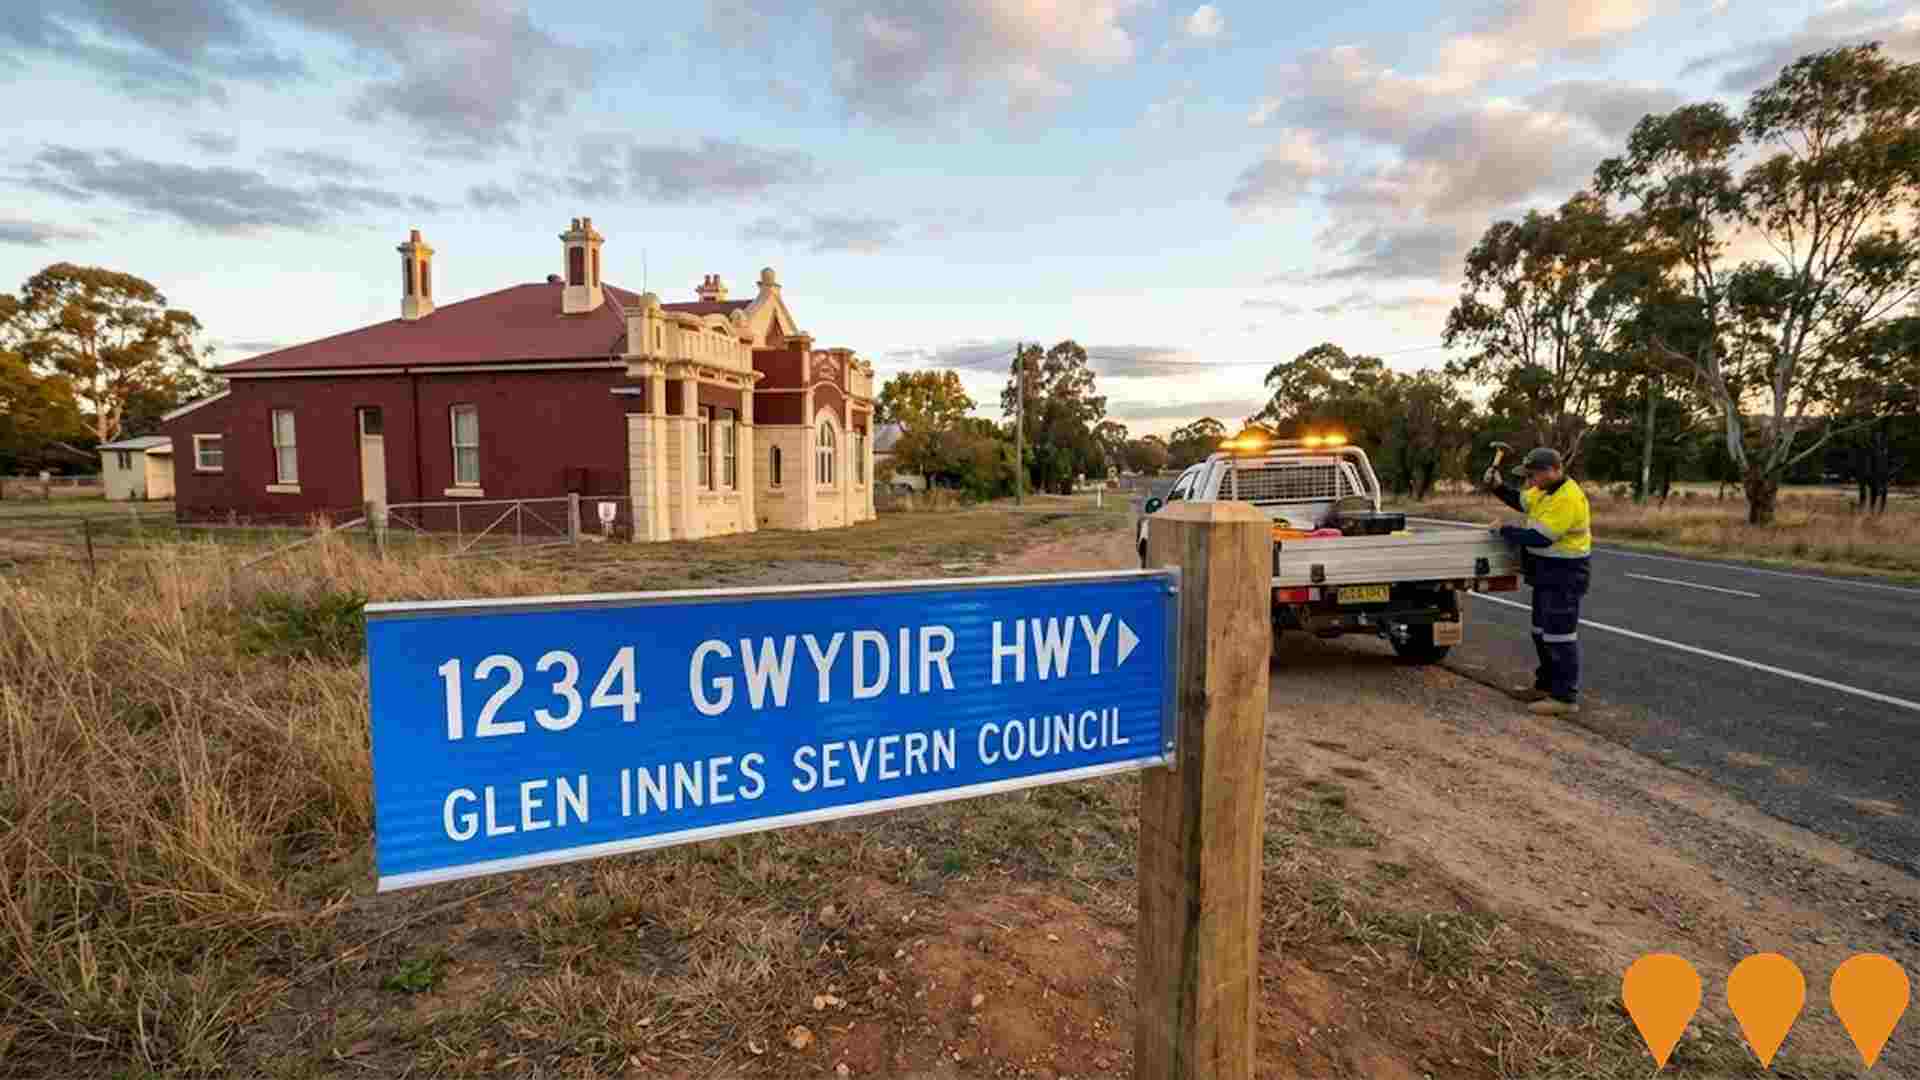
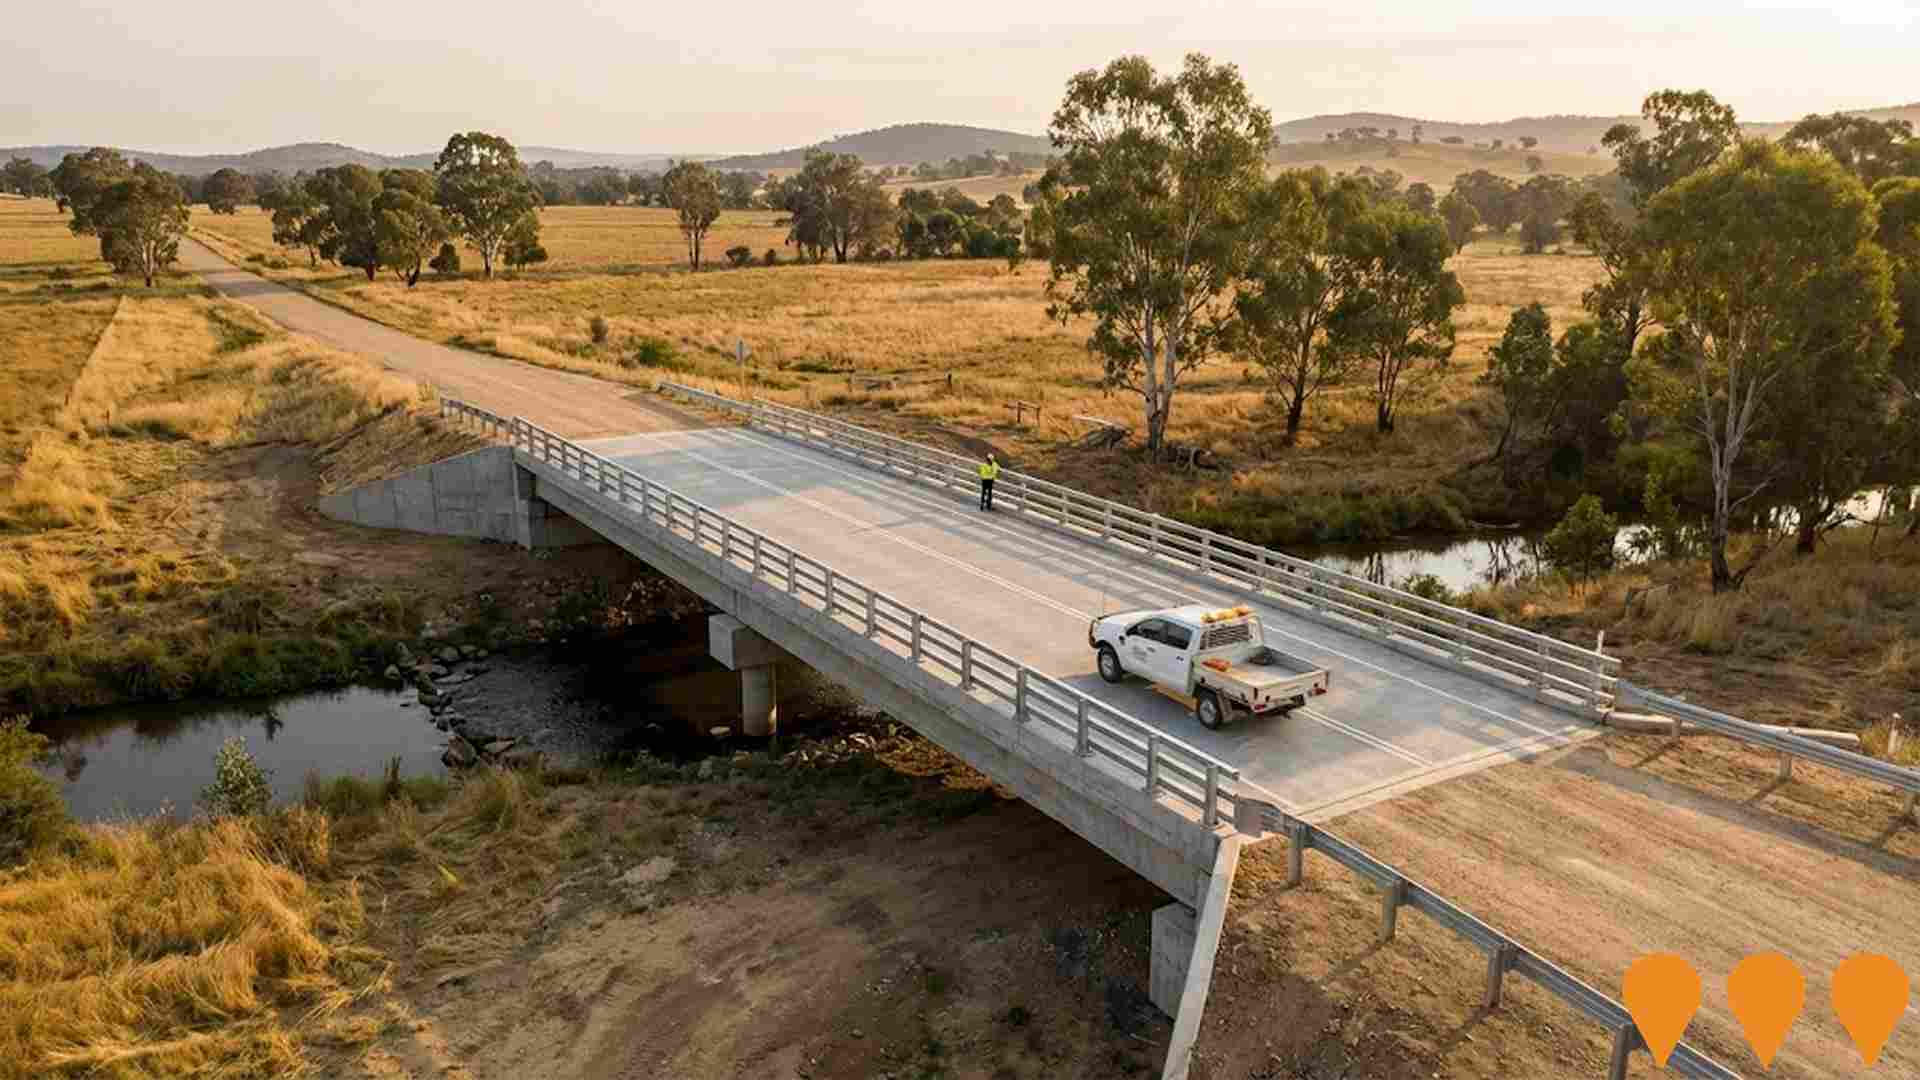
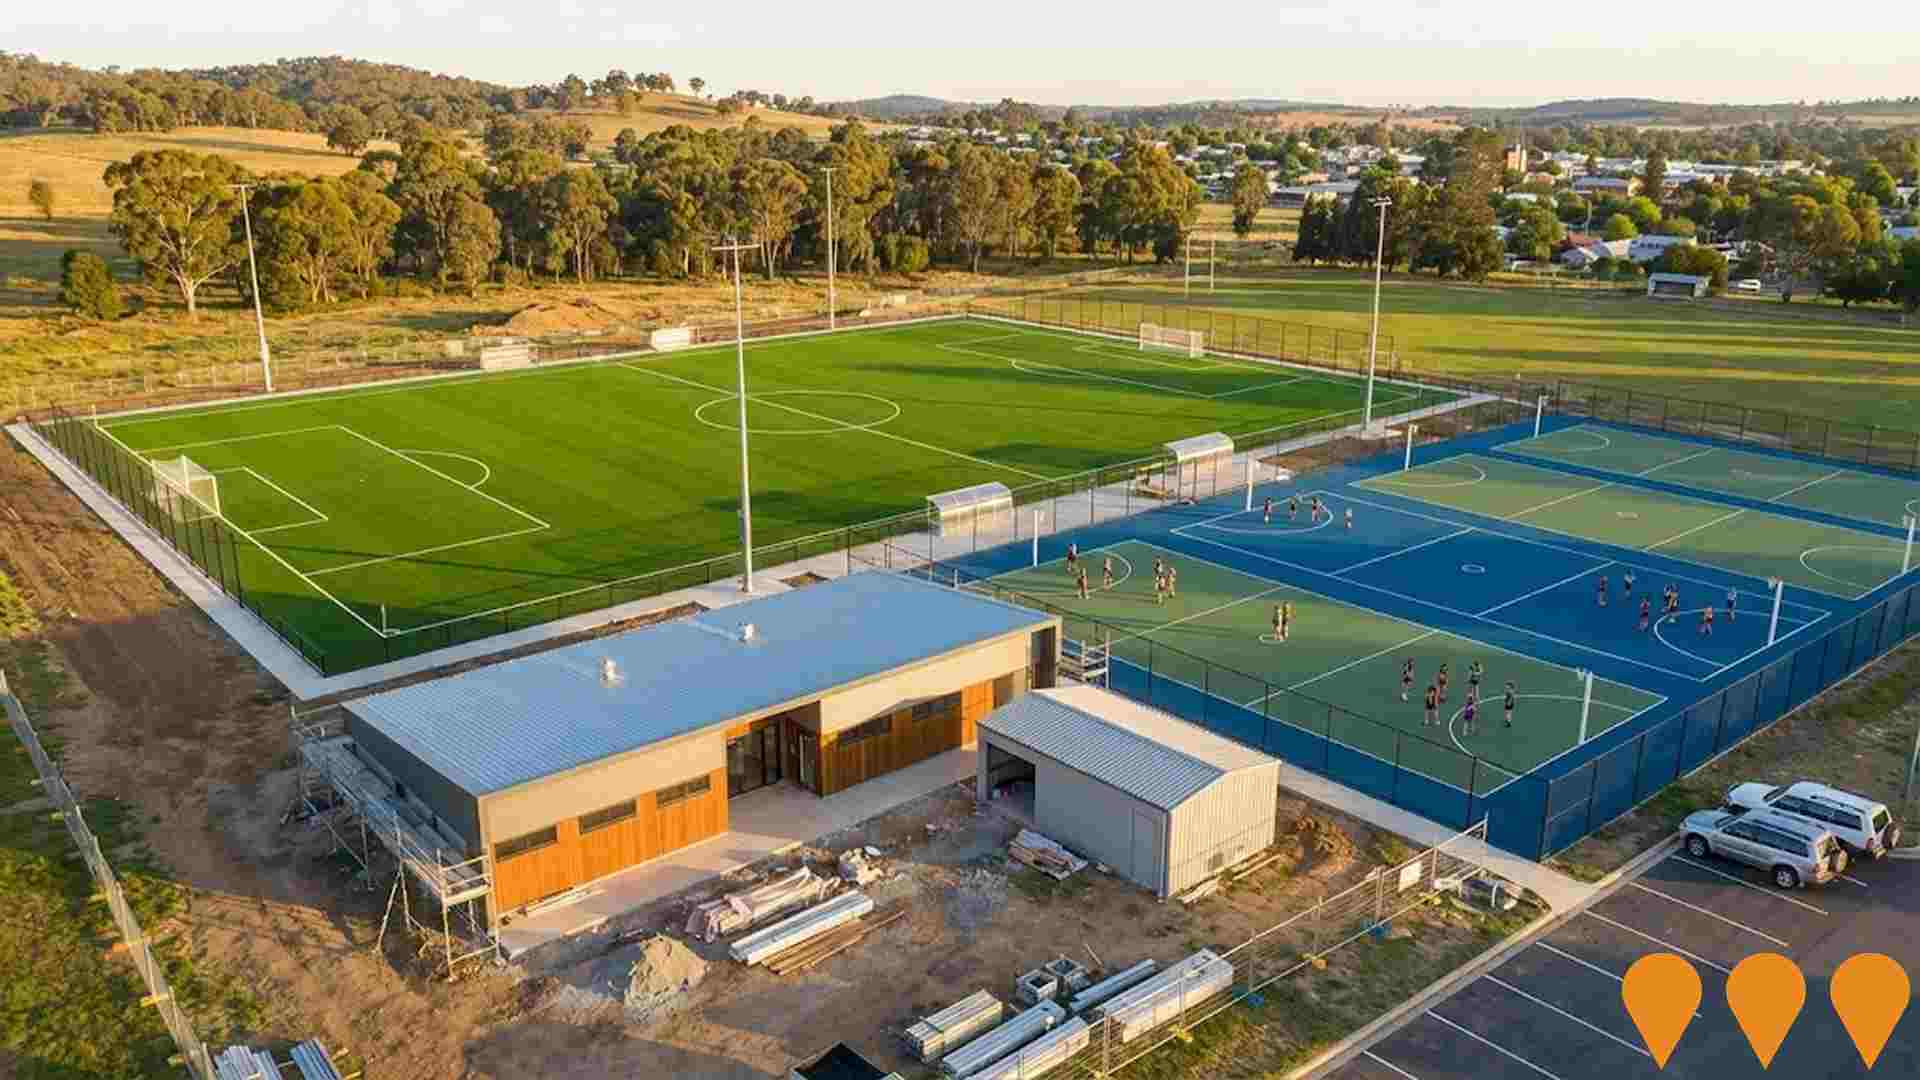
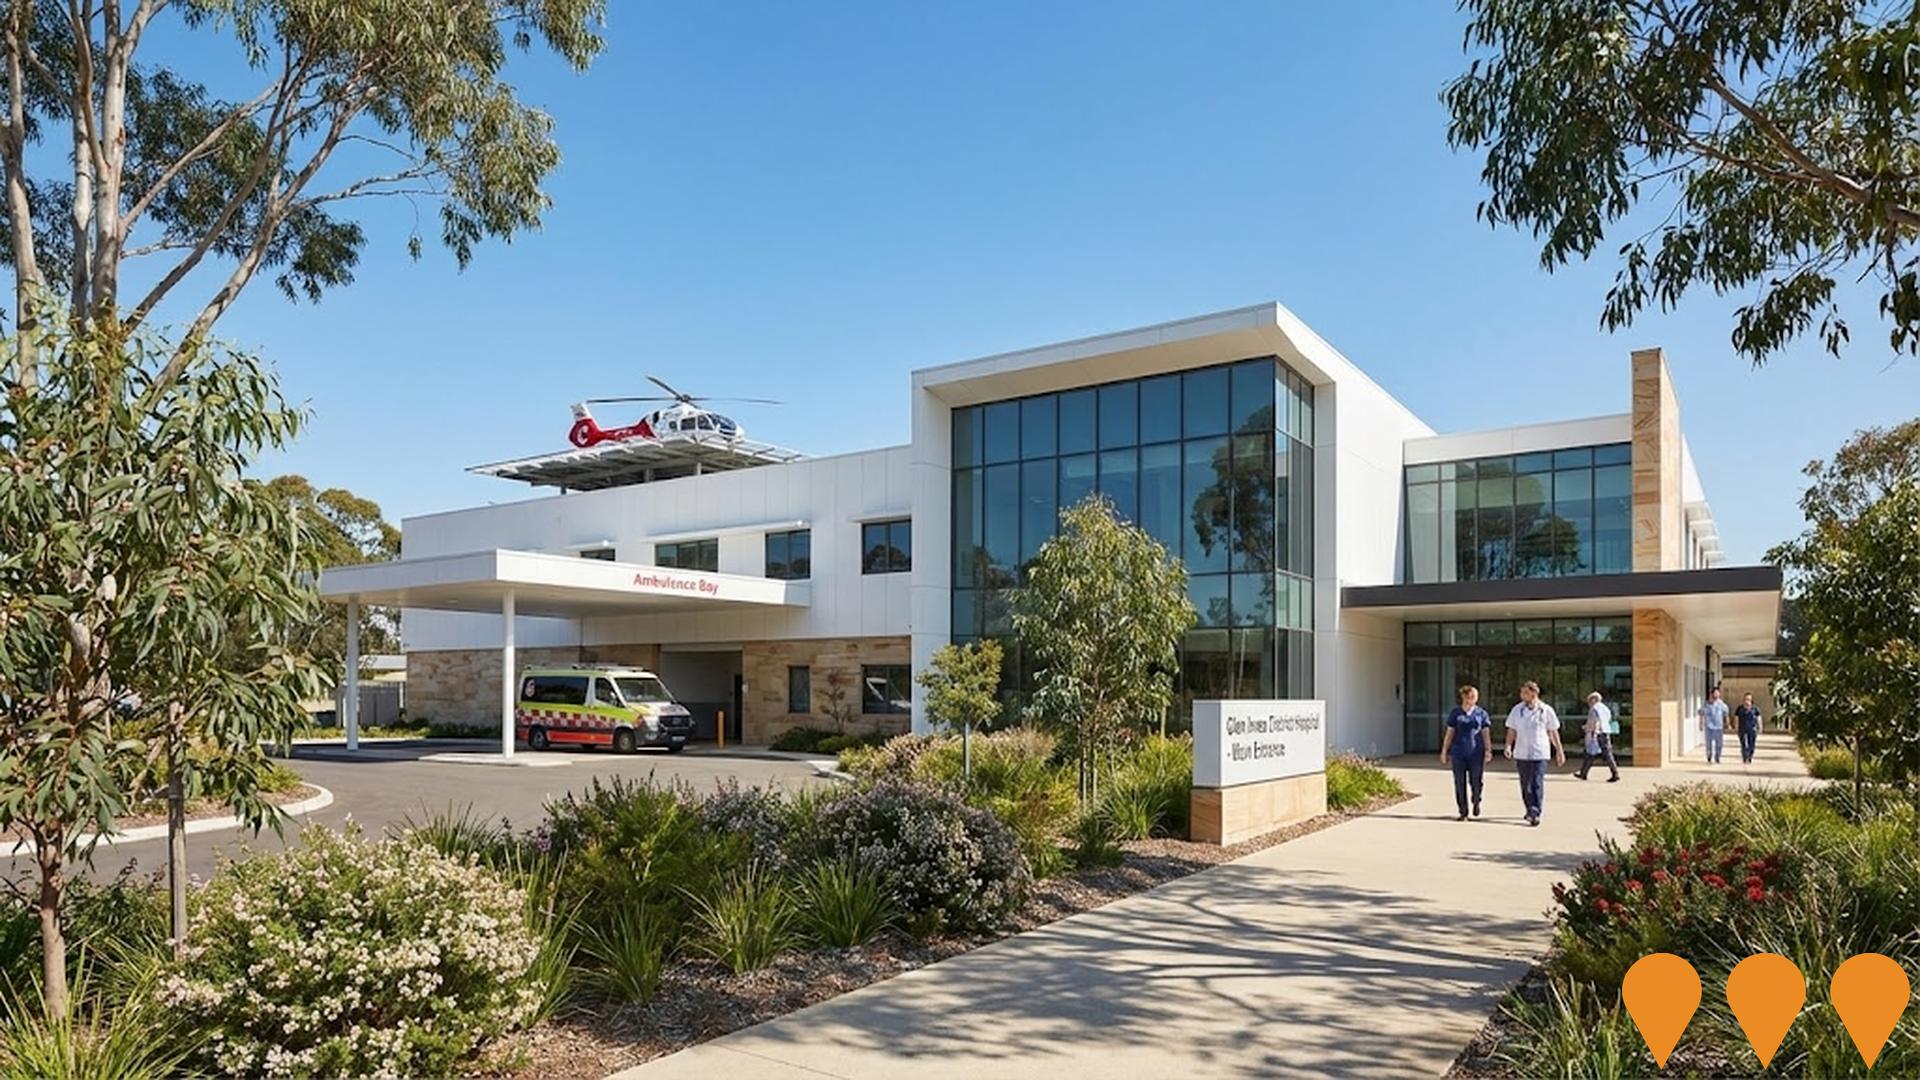
 Denotes AI-based impression for illustrative purposes only, not to be taken as definitive under any circumstances. Please follow links and conduct other investigations from the project's source for actual imagery. Developers and project owners wishing us to use original imagery please Contact Us and we will do so.
Frequently Asked Questions - Infrastructure
Glen Innes Hospital Redevelopment
A $200 million Stage 1 redevelopment of Glen Innes District Hospital delivering a new clinical services building with expanded emergency department, medical imaging, operating theatres, birthing suite, inpatient unit, ambulatory care, mortuary, ambulance bay and helipad. The project integrates with existing facilities and includes significant upgrades to clinical capacity for the New England region.
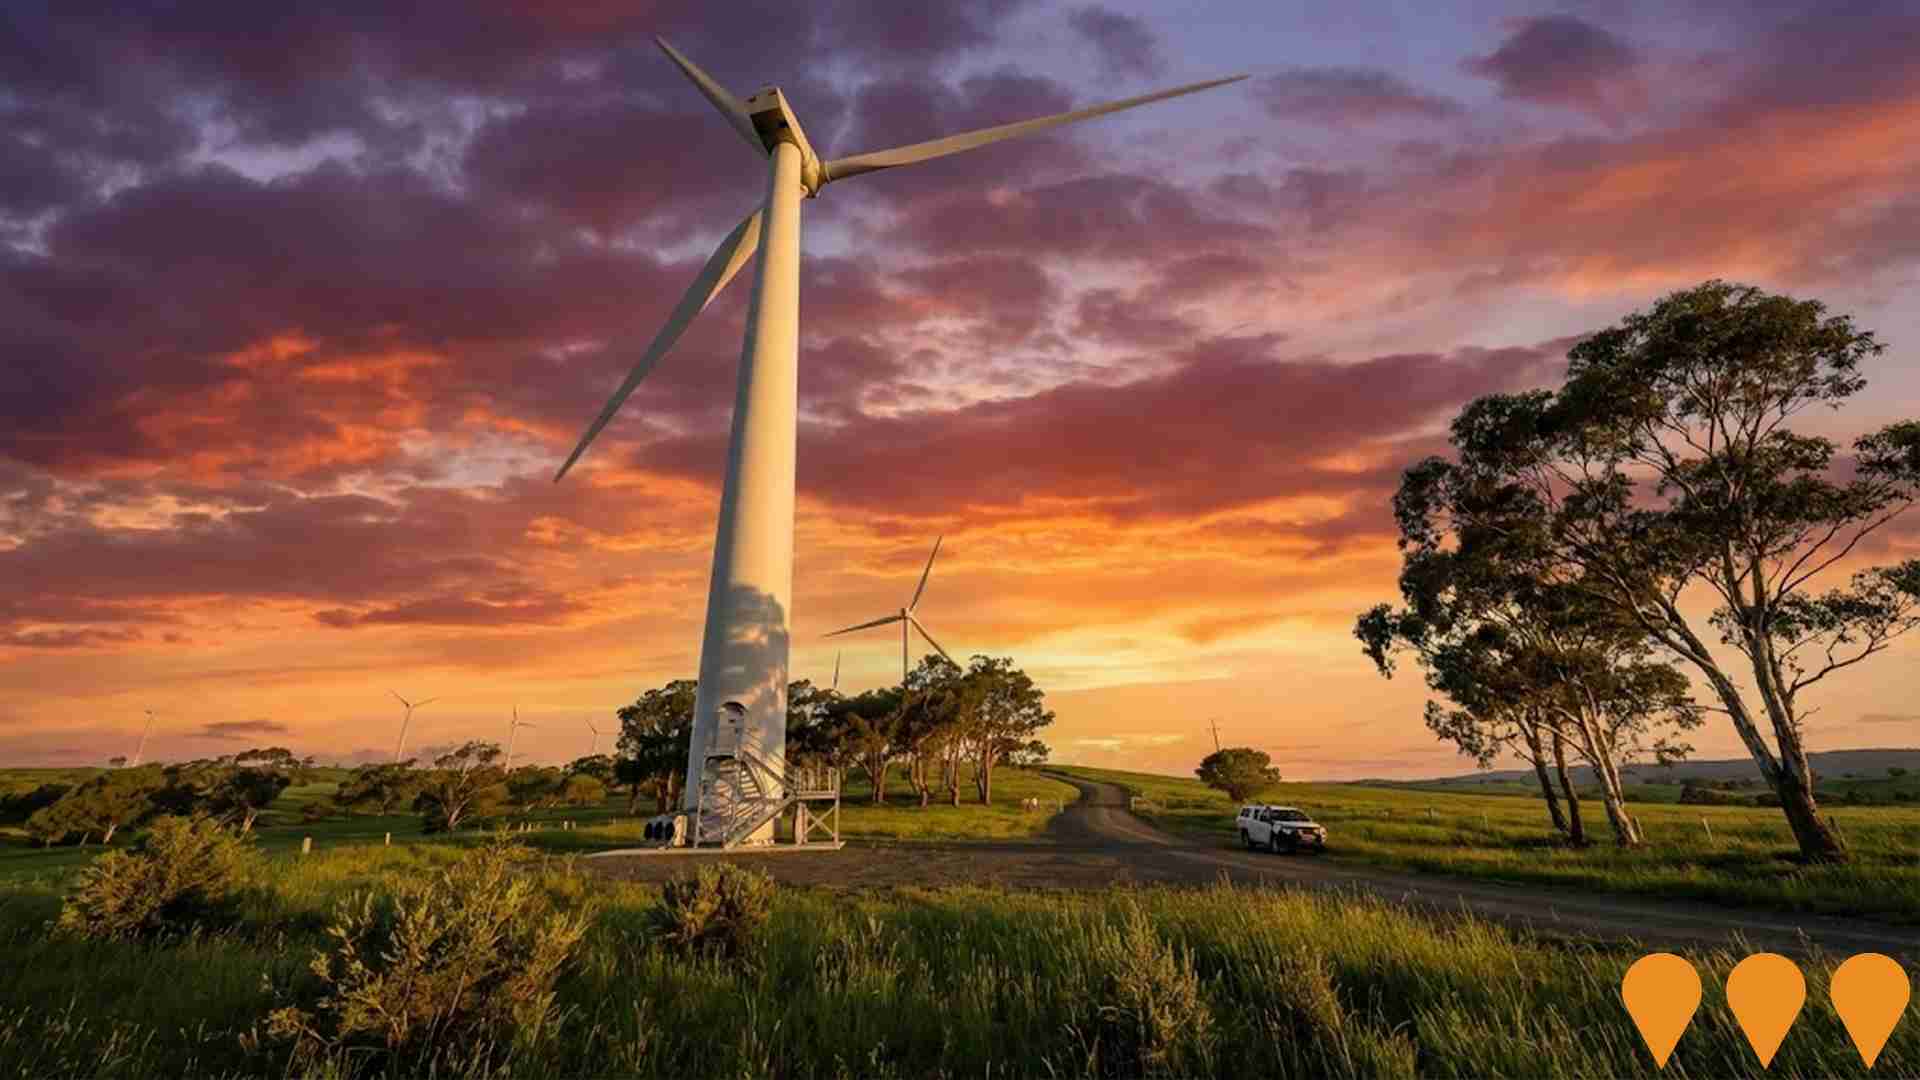
White Rock Wind Farm
Multi-stage wind farm development with Stage 1 (70 turbines, 175MW) operational and Stage 2 (up to 48 additional turbines, 216MW) in planning. Total capacity up to 391MW serving approximately 235,000 homes annually.
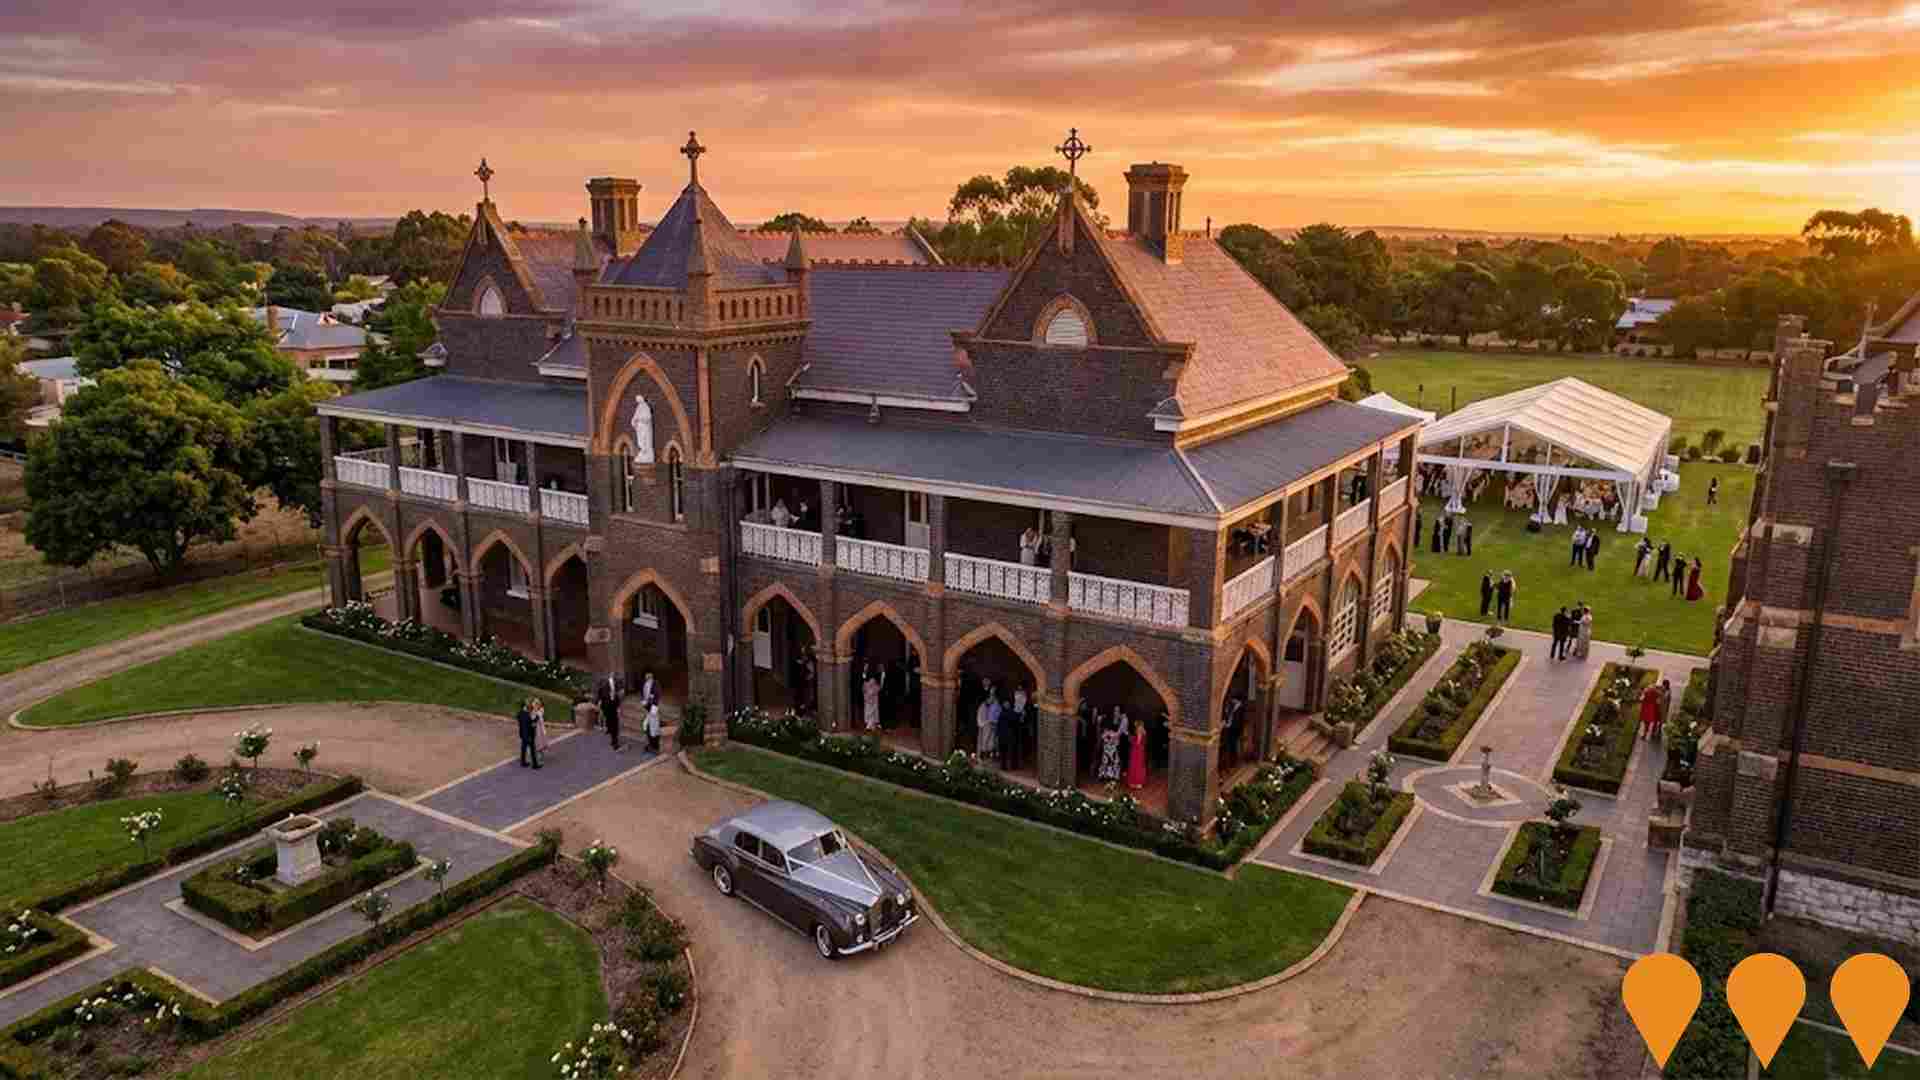
St Joseph's Convent Function Centre (Glen Innes)
Heritage-listed former St Joseph's Convent with a current Development Approval from Glen Innes Severn Council to convert to a function and wedding venue with around 23 guest suites plus reception, dining and offices. The property is presently being marketed for sale, with past partial use as guest accommodation. Redevelopment timing will depend on new ownership and delivery of the approved works.
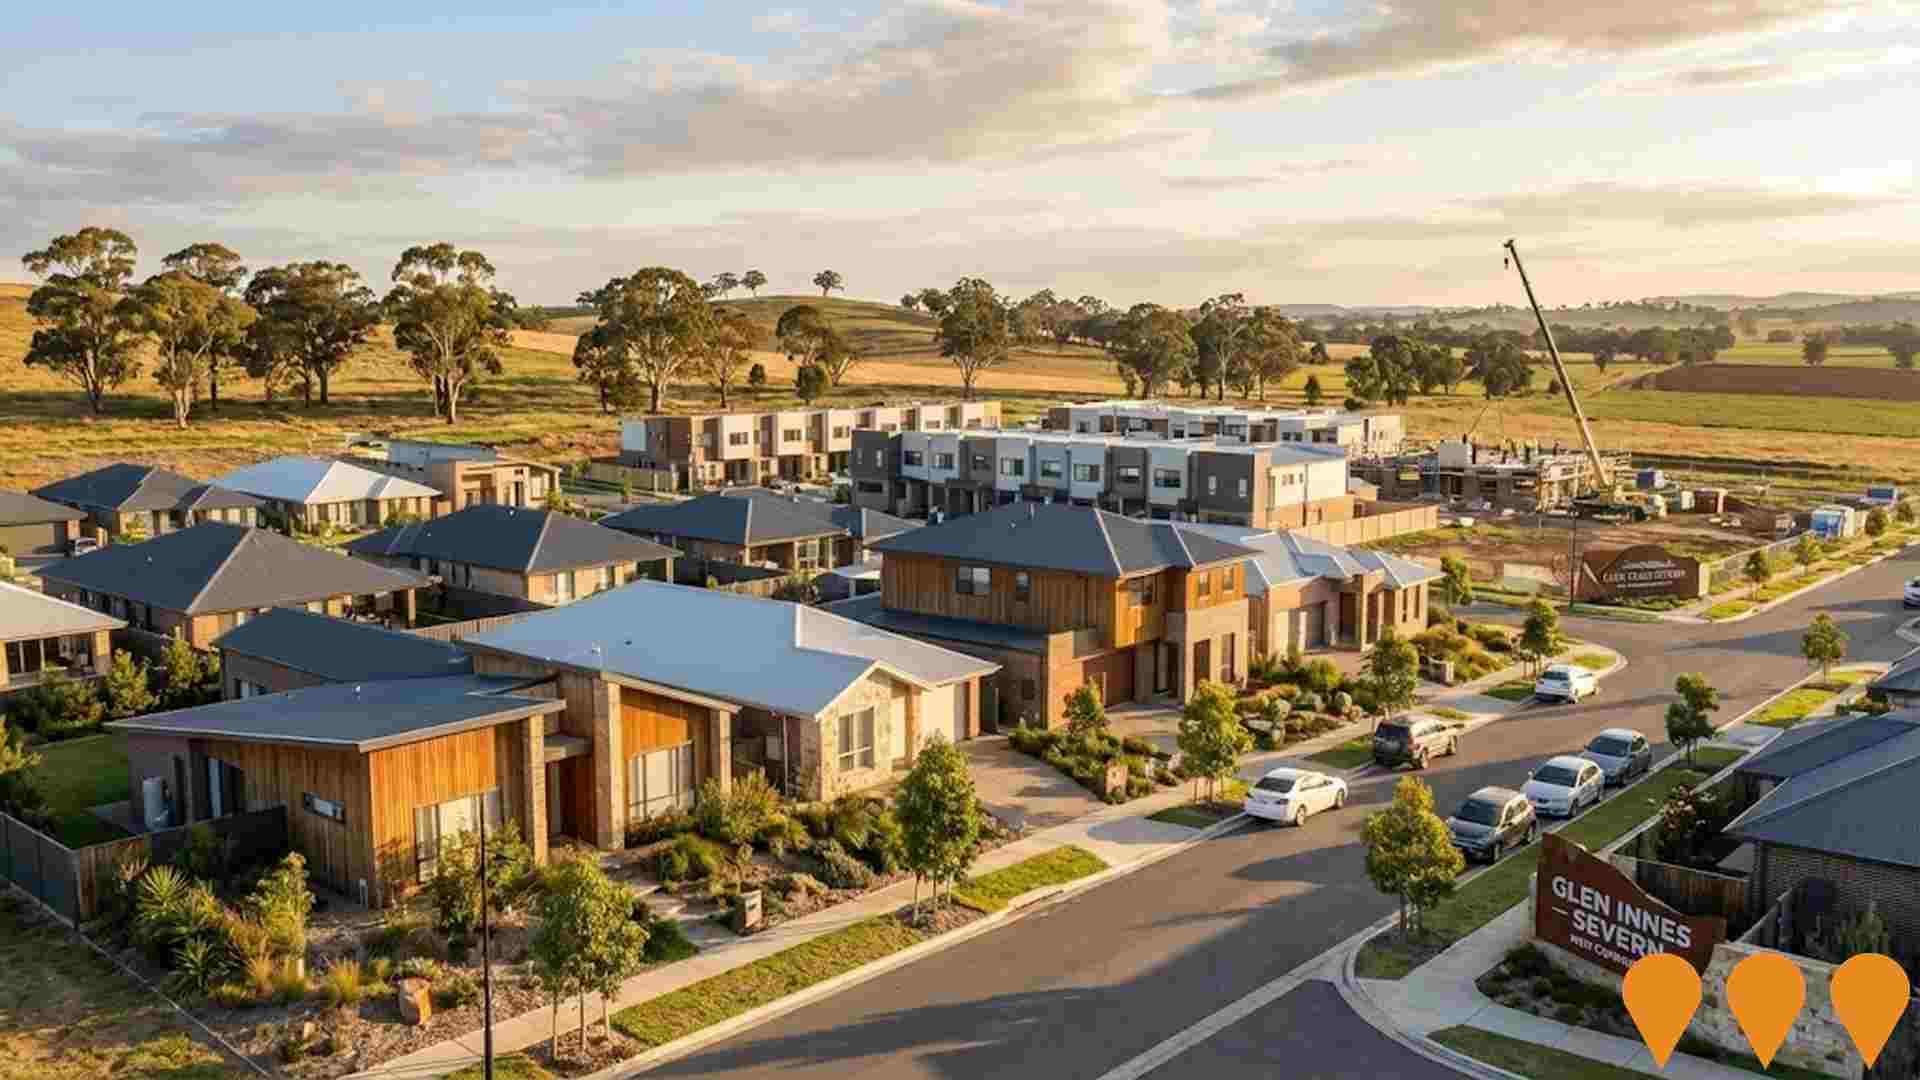
Glen Innes Severn Housing Strategy 2022-2041
Council-adopted strategy to increase housing supply, diversity and affordability across the Glen Innes Severn LGA through 2041. It guides rezonings, infrastructure sequencing and partnerships with NSW agencies, community housing providers and developers.
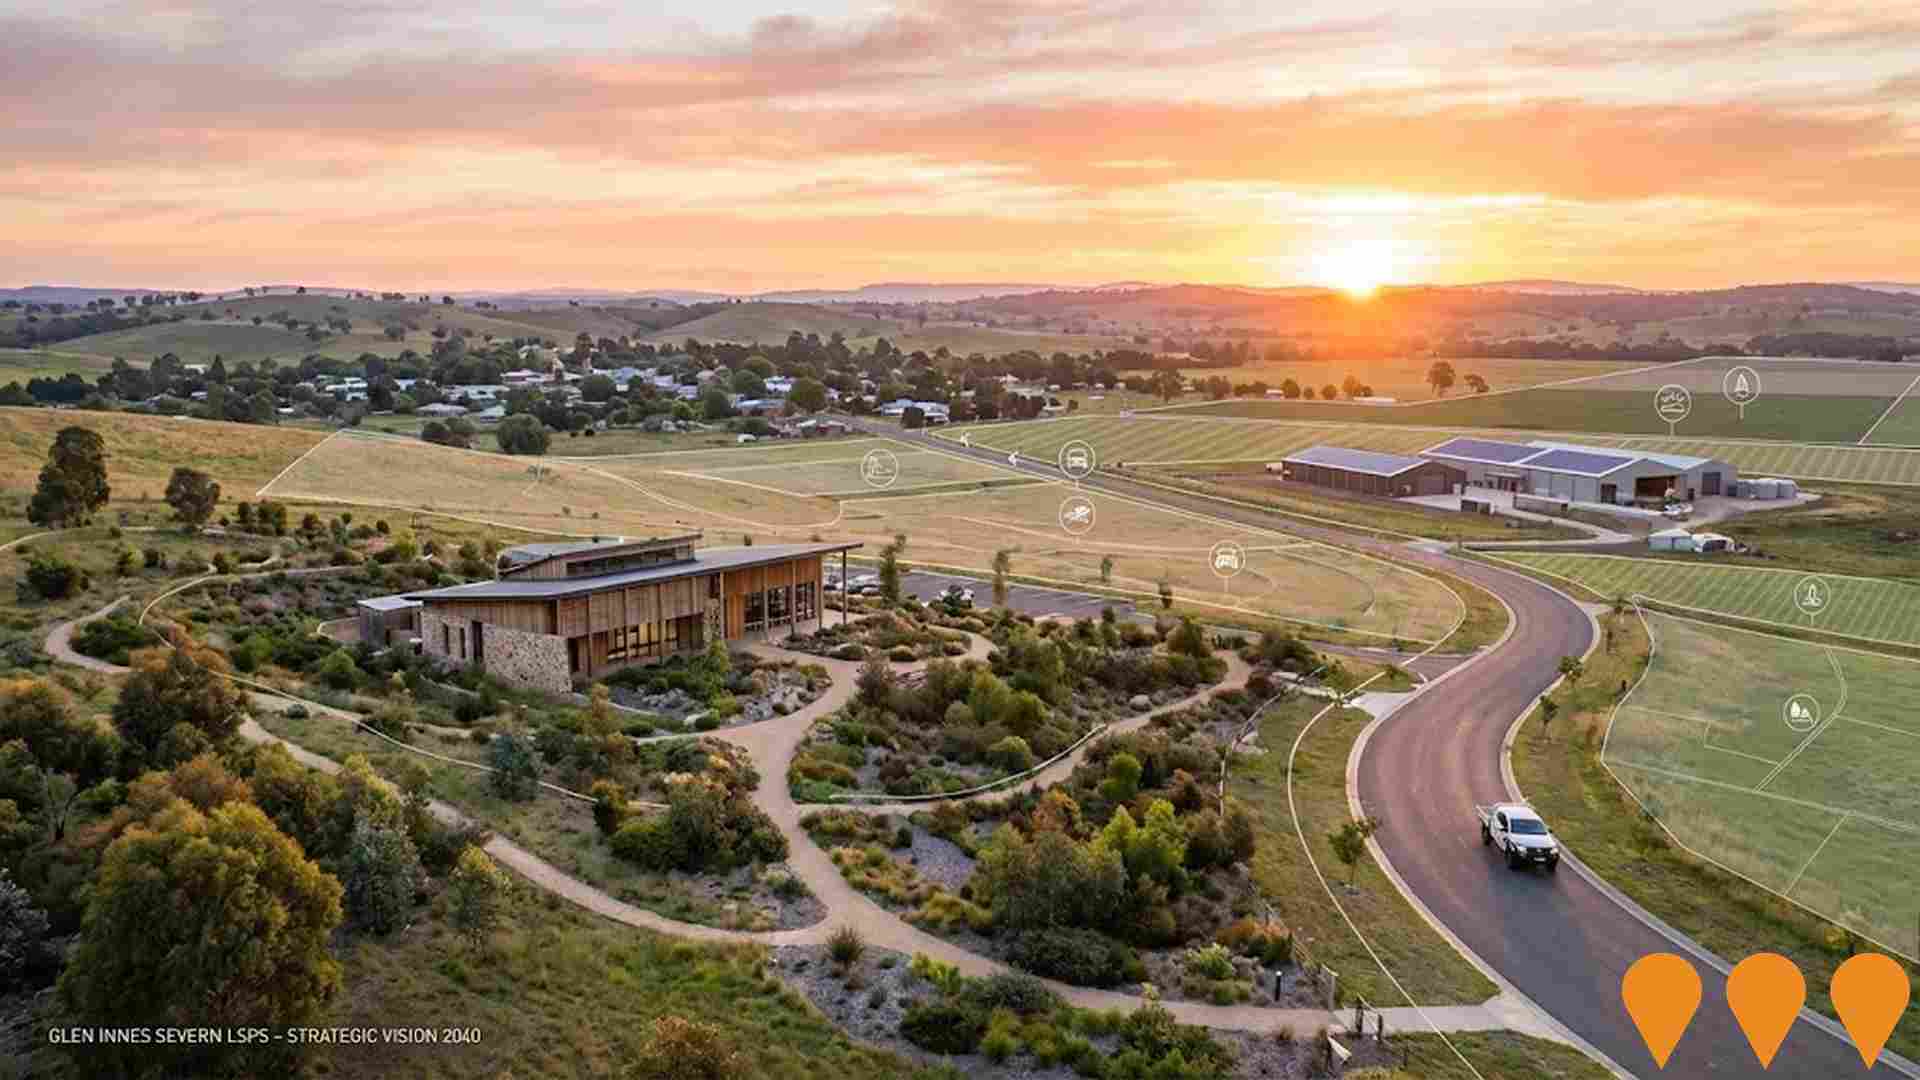
Glen Innes Severn Local Strategic Planning Statement
The Local Strategic Planning Statement (LSPS) plans for the Glen Innes Severn community's economic, social and environmental land use needs over the next 20 years.
Glen Innes Highlands Skywalk
An 80-metre elevated boardwalk with three viewing platforms offering spectacular views over Glen Innes township and Northern Tablelands. Features Celtic and Ngarabul cultural connections with 22 audio stories and 360-degree drone footage accessible via QR code technology.

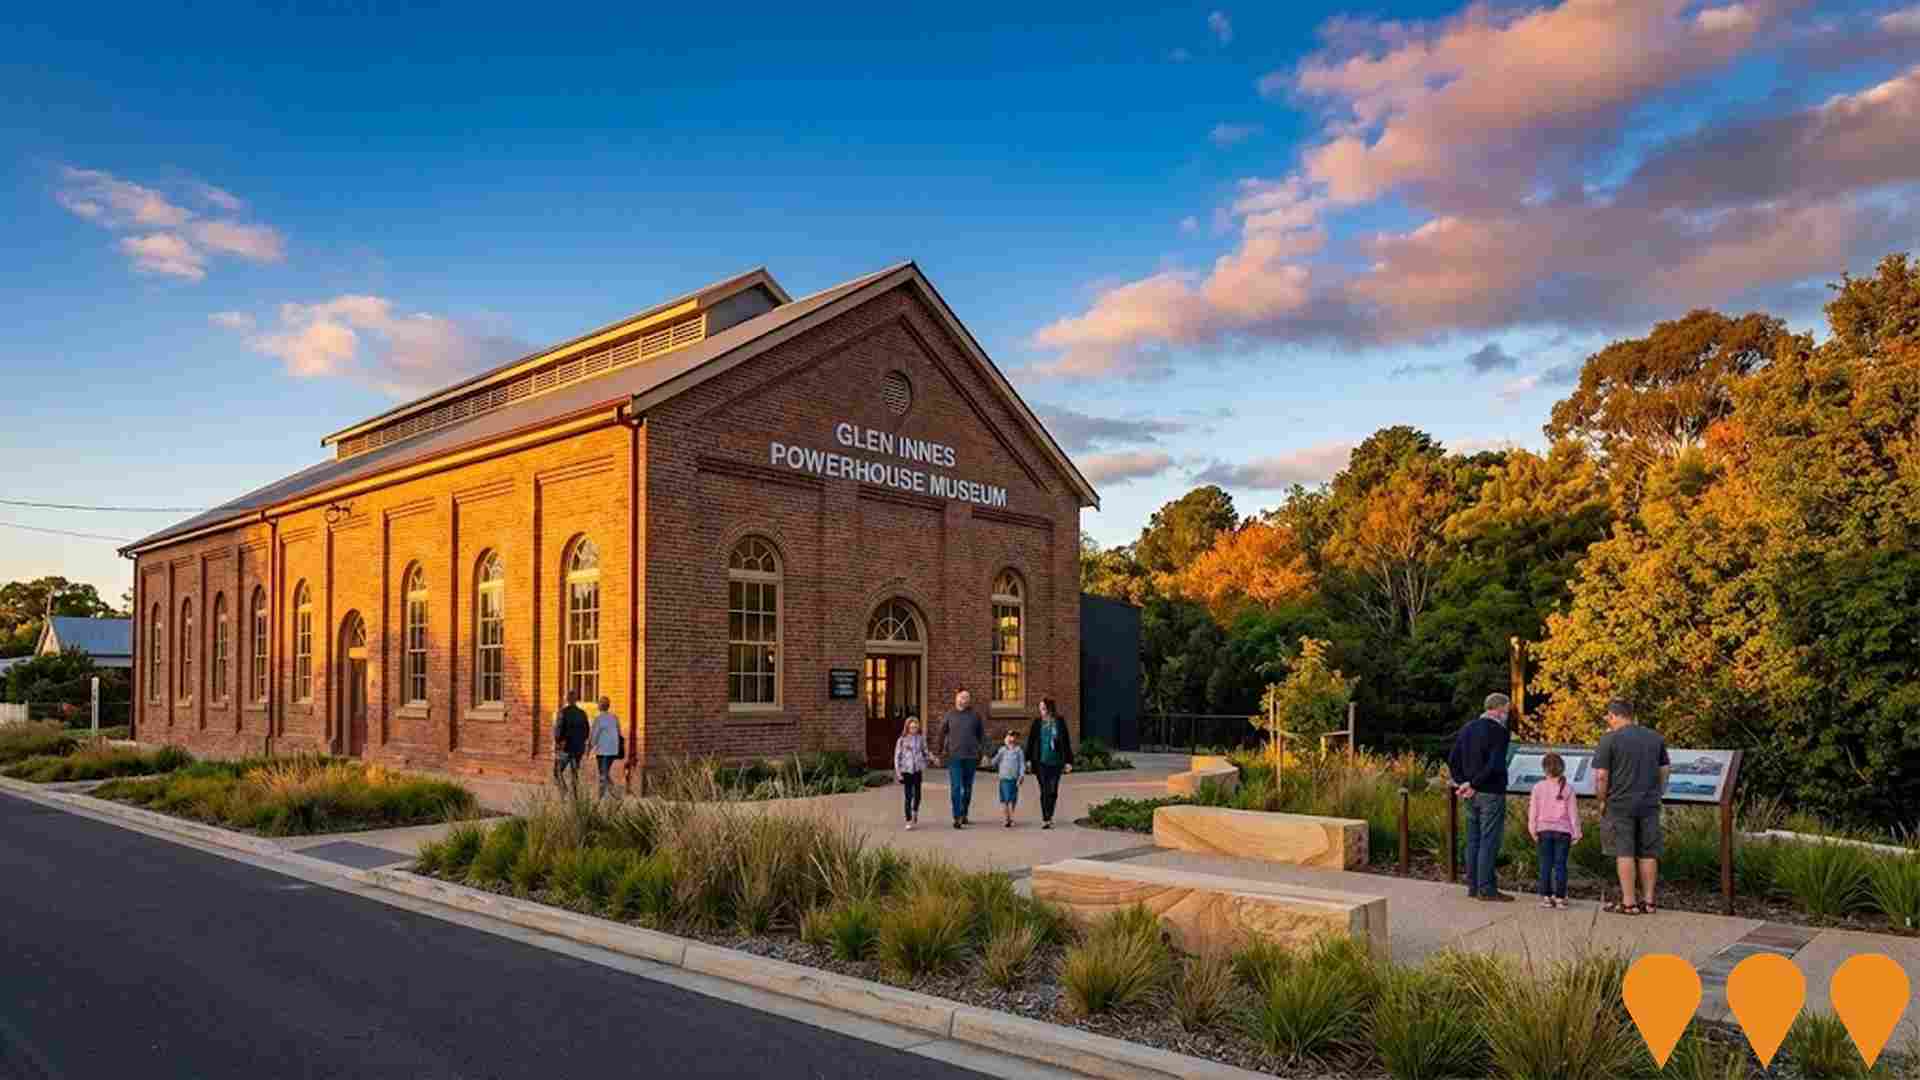
Glen Innes Powerhouse Museum Redevelopment
Proposed redevelopment of the former Glen Innes Power Station into a state-of-the-art museum in partnership with Sydney Powerhouse Museum. Concept proposal and business case in development to create a nationally significant cultural heritage attraction.
Youth and Sporting Precinct Upgrades and Connectivity
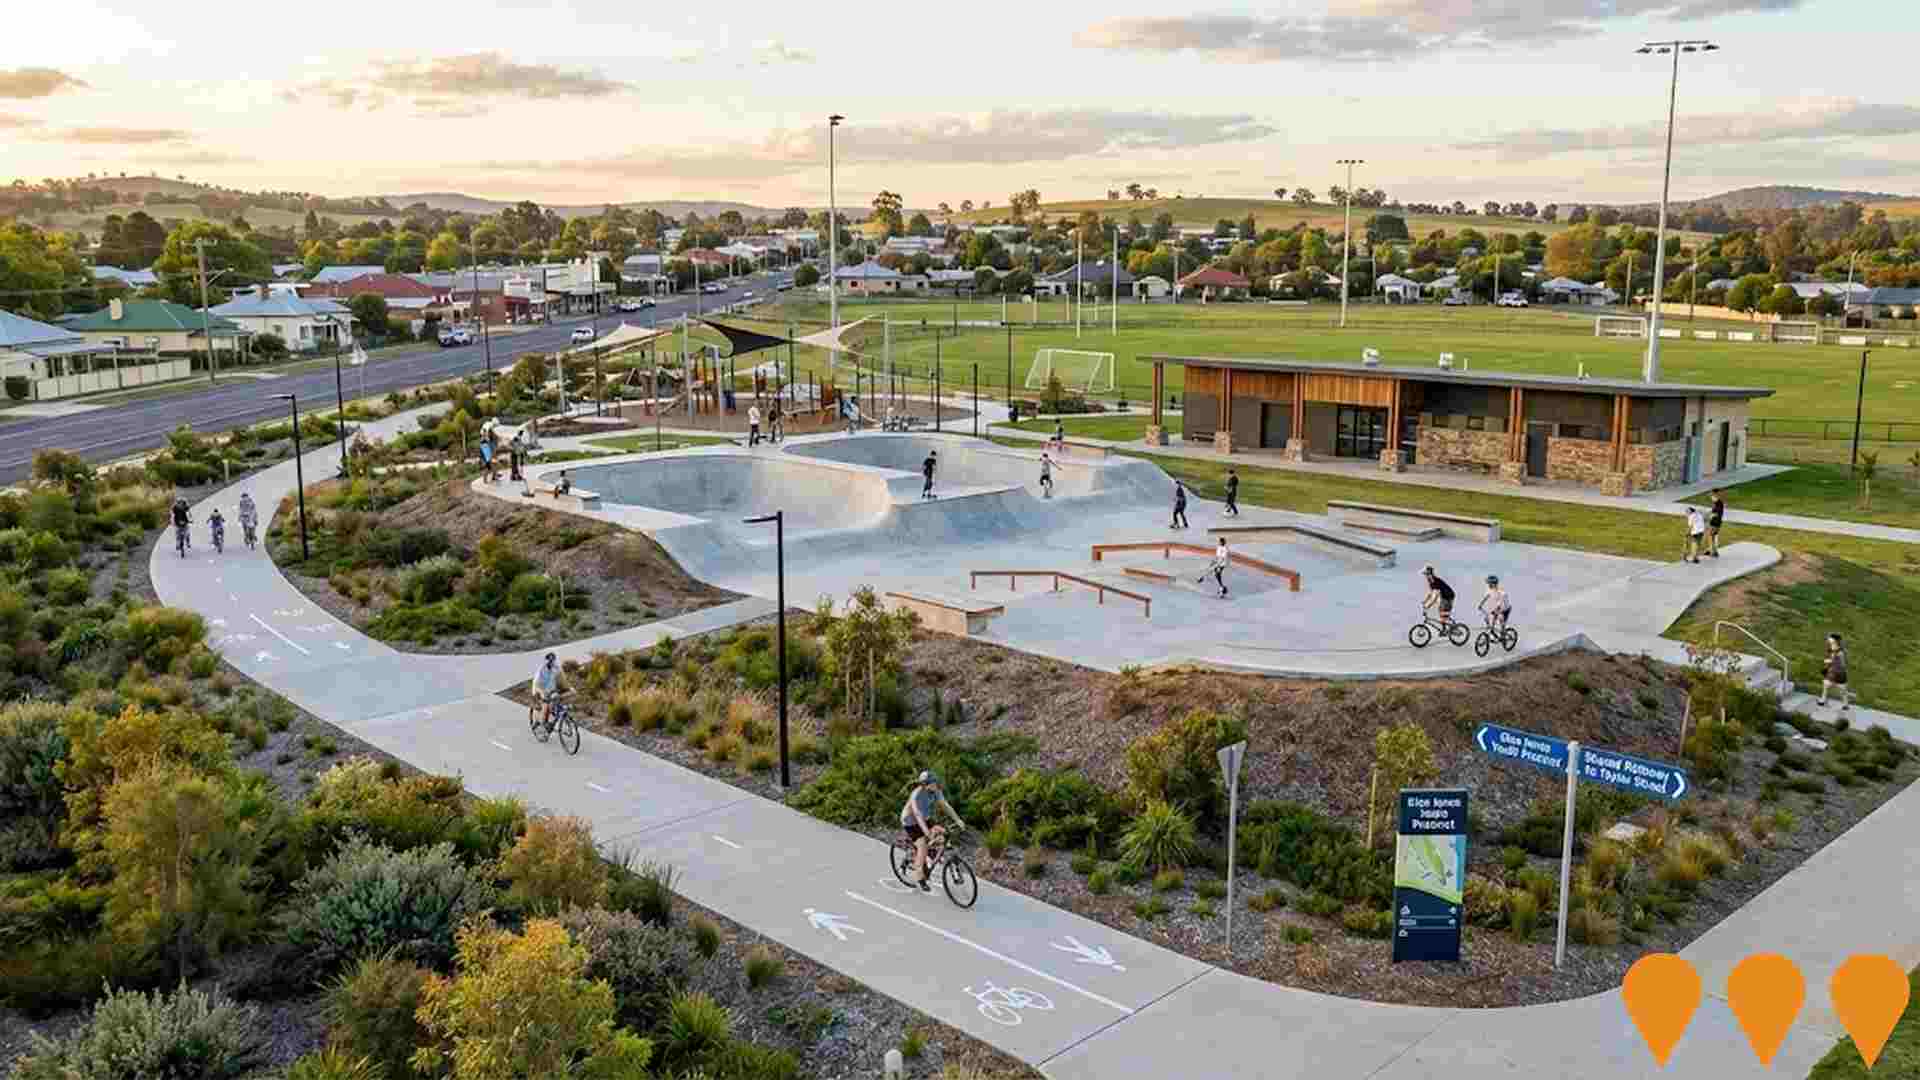
The project involves the redevelopment of the existing skate park, combining old and new elements for skaters of all skill levels, and the construction of shared pathways connecting the Sports Precinct to Taylor Street and local schools in Glen Innes.
Employment
Employment conditions in Glen Innes remain below the national average according to AreaSearch analysis
Glen Innes has a balanced workforce with both white and blue collar jobs. Essential services sectors are well represented, and the unemployment rate is 3.6%.
Over the past year, employment has remained relatively stable. As of September 2025, 4,289 residents are employed, with an unemployment rate of 3.4%, which is 0.2% lower than Rest of NSW's rate of 3.6%. Workforce participation in Glen Innes is 47.1%, compared to Rest of NSW's 56.4%. Key industries include agriculture, forestry & fishing, health care & social assistance, and retail trade.
The area specialises in agriculture, forestry & fishing, with an employment share three times the regional level. However, construction has a limited presence at 6.2%, compared to the regional average of 9.7%. Employment opportunities locally may be limited, as indicated by the census working population count versus resident population. In the 12 months prior, employment increased by 0.0% while labour force grew by 0.6%, leading to a rise in unemployment rate by 0.6 percentage points. This contrasts with Rest of NSW where employment fell by 0.5%, labour force contracted by 0.1%, and unemployment rose by 0.4 percentage points. State-level data from November 25, 2025 shows NSW employment contracted by 0.03% (losing 2,260 jobs), with the state unemployment rate at 3.9%. Nationally, the unemployment rate is 4.3%. Jobs and Skills Australia's national employment forecasts for May-25 project a 6.6% increase over five years and 13.7% over ten years. Applying these projections to Glen Innes' employment mix suggests local employment should increase by 5.6% over five years and 12.1% over ten years, though this is a simple extrapolation for illustrative purposes and does not account for localised population projections.
Frequently Asked Questions - Employment
Income
Income metrics place the area in the bottom 10% of locations nationally according to AreaSearch analysis
AreaSearch's latest postcode level ATO data for financial year 2022 shows Glen Innes SA2 had a median income of $37,391 and an average income of $45,254. These figures are below the national averages. Rest of NSW had a median income of $49,459 and an average income of $62,998 in the same period. Based on Wage Price Index growth of 12.61% since financial year 2022, estimated incomes for Glen Innes as of September 2025 would be approximately $42,106 (median) and $50,961 (average). Census data indicates that household, family, and personal incomes in Glen Innes fall between the 1st and 5th percentiles nationally. Income brackets show 32.3% of Glen Innes' population earns between $400 and $799 weekly, unlike metropolitan regions where the $1,500 to $2,999 bracket is predominant at 29.9%. The concentration of 43.7% in sub-$800 weekly brackets suggests economic challenges for a significant portion of Glen Innes' community. Despite modest housing costs with 87.0% of income retained, total disposable income ranks at just the 4th percentile nationally.
Frequently Asked Questions - Income
Housing
Glen Innes is characterized by a predominantly suburban housing profile, with above-average rates of outright home ownership
Glen Innes' dwelling structure, as per the latest Census, comprised 92.6% houses and 7.4% other dwellings. This compares to Non-Metro NSW's 93.0% houses and 6.9% other dwellings. Home ownership in Glen Innes was 48.5%, with mortgaged dwellings at 25.7% and rented ones at 25.8%. The median monthly mortgage repayment was $1,083, below Non-Metro NSW's average of $1,100. Median weekly rent in Glen Innes was $220, compared to Non-Metro NSW's $240. Nationally, Glen Innes' mortgage repayments were significantly lower than the Australian average of $1,863, and rents substantially below the national figure of $375.
Frequently Asked Questions - Housing
Household Composition
Glen Innes features high concentrations of lone person households, with a lower-than-average median household size
Family households account for 61.8% of all households, including 18.2% that are couples with children, 31.8% that are couples without children, and 10.8% that are single parent families. Non-family households make up the remaining 38.2%, with lone person households at 35.6% and group households comprising 2.7%. The median household size is 2.1 people, which is smaller than the Rest of NSW average of 2.3.
Frequently Asked Questions - Households
Local Schools & Education
Glen Innes faces educational challenges, with performance metrics placing it in the bottom quartile of areas assessed nationally
The area's university qualification rate is 15.2%, significantly lower than NSW's average of 32.2%. Bachelor degrees are the most common at 11.3%, followed by graduate diplomas (2.0%) and postgraduate qualifications (1.9%). Vocational credentials are prominent, with 41.4% of residents aged 15+ holding them - advanced diplomas at 9.7% and certificates at 31.7%. Educational participation is high, with 28.9% currently enrolled in formal education.
This includes primary education (11.5%), secondary education (8.8%), and tertiary education (2.3%).
Frequently Asked Questions - Education
Schools Detail
Nearby Services & Amenities
Transport
Transport servicing is low compared to other areas nationally based on assessment of service frequency, route connectivity and accessibility
Glen Innes has 431 active public transport stops, operating a mix of train and bus services. These stops are served by 27 individual routes, offering a total of 261 weekly passenger trips. Transport accessibility is rated as good, with residents typically located 276 meters from the nearest stop.
Service frequency averages 37 trips per day across all routes, equating to approximately zero weekly trips per individual stop.
Frequently Asked Questions - Transport
Transport Stops Detail
Health
Health performance in Glen Innes is a key challenge with a range of health conditions having marked impacts on both younger and older age cohorts
Glen Innes faces significant health challenges with various conditions affecting both younger and older age groups. Approximately 47% (~4,279 people) have private health cover, significantly lower than the national average of 55.3%.
The most prevalent medical conditions are arthritis (12.1%) and mental health issues (9.7%). Conversely, 58.6% reported no medical ailments compared to 61.0% in Rest of NSW. The area has a higher proportion of residents aged 65 and over at 30.1% (2,764 people), compared to the Rest of NSW's 27.4%.
Frequently Asked Questions - Health
Cultural Diversity
The latest Census data sees Glen Innes placing among the least culturally diverse areas in the country when compared across a range of language and cultural background related metrics
Glen Innes, as per the 2016 Census, had a cultural diversity index below average with 86.7% of its population being Australian citizens, 91.6% born in Australia, and 97.4% speaking English only at home. Christianity was the dominant religion, practiced by 64.4% of Glen Innes residents, compared to 64.8% across Rest of NSW. The top three ancestry groups were English (32.9%), Australian (31.9%), and Scottish (9.3%).
Notable differences existed in the representation of certain ethnic groups: Australian Aboriginal was overrepresented at 5.2%, Irish at 9.1%, and German at 3.9%.
Frequently Asked Questions - Diversity
Age
Glen Innes ranks among the oldest 10% of areas nationwide
Glen Innes has a median age of 50, which is higher than Rest of NSW's figure of 43 and also above the national average of 38. The percentage of residents aged 65-74 is notably high at 15.8%, compared to Rest of NSW's figure, whereas the 35-44 age group is less prevalent at 8.6%. This concentration of residents aged 65-74 is significantly higher than the national average of 9.4%. According to the 2021 Census, the percentage of residents aged 75-84 has increased from 9.6% to 10.6%, while the 45-54 age group has declined from 12.0% to 10.8%, and the 55-64 age group has dropped from 15.9% to 14.9%. Demographic modeling suggests that Glen Innes's age profile will change significantly by 2041. The number of residents aged 85 and above is projected to increase markedly, from 337 to 596, a growth of 258 people (76%). Notably, the combined population of all age groups aged 65 and above is expected to account for 88% of total population growth, reflecting the area's aging demographic profile. Conversely, population declines are projected for residents aged 5-14 and those aged 45-54.
