Chart Color Schemes
This analysis uses ABS Statistical Areas Level 2 (SA2) boundaries, which can materially differ from Suburbs and Localities (SAL) even when sharing similar names.
SA2 boundaries are defined by the Australian Bureau of Statistics and are designed to represent communities for statistical reporting (e.g., census and ERP).
Suburbs and Localities (SAL) represent commonly-used suburb/locality names (postal-style areas) and may use different geographic boundaries. For comprehensive analysis, consider reviewing both boundary types if available.
est. as @ -- *
ABS ERP | -- people | --
2021 Census | -- people
Sales Activity
Curious about local property values? Filter the chart to assess the volume and appreciation (including resales) trends and regional comparisons, or scroll to the map below view this information at an individual property level.
Find a Recent Sale
Sales Detail
Population
Stanthorpe has shown very soft population growth performance across periods assessed by AreaSearch
Stanthorpe's population was 5,286 according to the 2021 Census. By Nov 2025, it is estimated around 5,478, an increase of 192 people (3.6%). This growth is inferred from ABS data: Stanthorpe had an estimated resident population of 5,455 in June 2024 and 24 new addresses were validated since the Census date. The population density is 162 persons per square kilometer. Stanthorpe's 3.6% growth since census compares to the SA4 region's 5.5%, showing competitive growth fundamentals. Interstate migration contributed approximately 54.9% of overall population gains recently.
For projections, AreaSearch uses ABS/Geoscience Australia data for each SA2 area released in 2024 with a base year of 2022. For areas not covered and years post-2032, Queensland State Government's SA2 area projections from 2023 based on 2021 data are adopted. These state projections lack age category splits, so AreaSearch applies proportional growth weightings aligned with ABS Greater Capital Region projections released in 2023 using 2022 data for each age cohort. Future demographic trends suggest lower quartile growth for Australia's regional areas. Stanthorpe is expected to increase by 17 persons to 2041, reflecting a decline of 0.1% over the 17 years based on the latest annual ERP population numbers.
Frequently Asked Questions - Population
Development
AreaSearch assessment of residential development drivers sees a low level of activity in Stanthorpe, placing the area among the bottom 25% of areas assessed nationally
Stanthorpe averaged approximately 13 new dwelling approvals per year over the past five financial years, totalling 66 homes. As of FY26, 8 approvals have been recorded. The average number of people moving to the area per dwelling built over these five years was 0.6. This suggests that supply is meeting or exceeding demand, offering greater buyer choice and supporting potential population growth above projections.
The average value of new homes being built is $312,000, which is under regional levels, indicating more accessible housing choices for buyers. There have been $8.5 million in commercial approvals this financial year, suggesting limited commercial development focus. Compared to the rest of Queensland, Stanthorpe has around two-thirds the rate of new dwelling approvals per person and ranks among the 39th percentile nationally, resulting in relatively constrained buyer choice and supporting interest in existing properties. This is under the national average, indicating the area's established nature and suggesting potential planning limitations.
New building activity shows 80% detached houses and 20% townhouses or apartments, preserving the area's low density nature with an emphasis on detached housing attracting space-seeking buyers. The estimated count of 428 people in the area per dwelling approval reflects its quiet, low activity development environment. Given stable or declining population forecasts, Stanthorpe may experience less housing pressure, creating favourable conditions for buyers.
Frequently Asked Questions - Development
Infrastructure
Stanthorpe has moderate levels of nearby infrastructure activity, ranking in the top 50% nationally
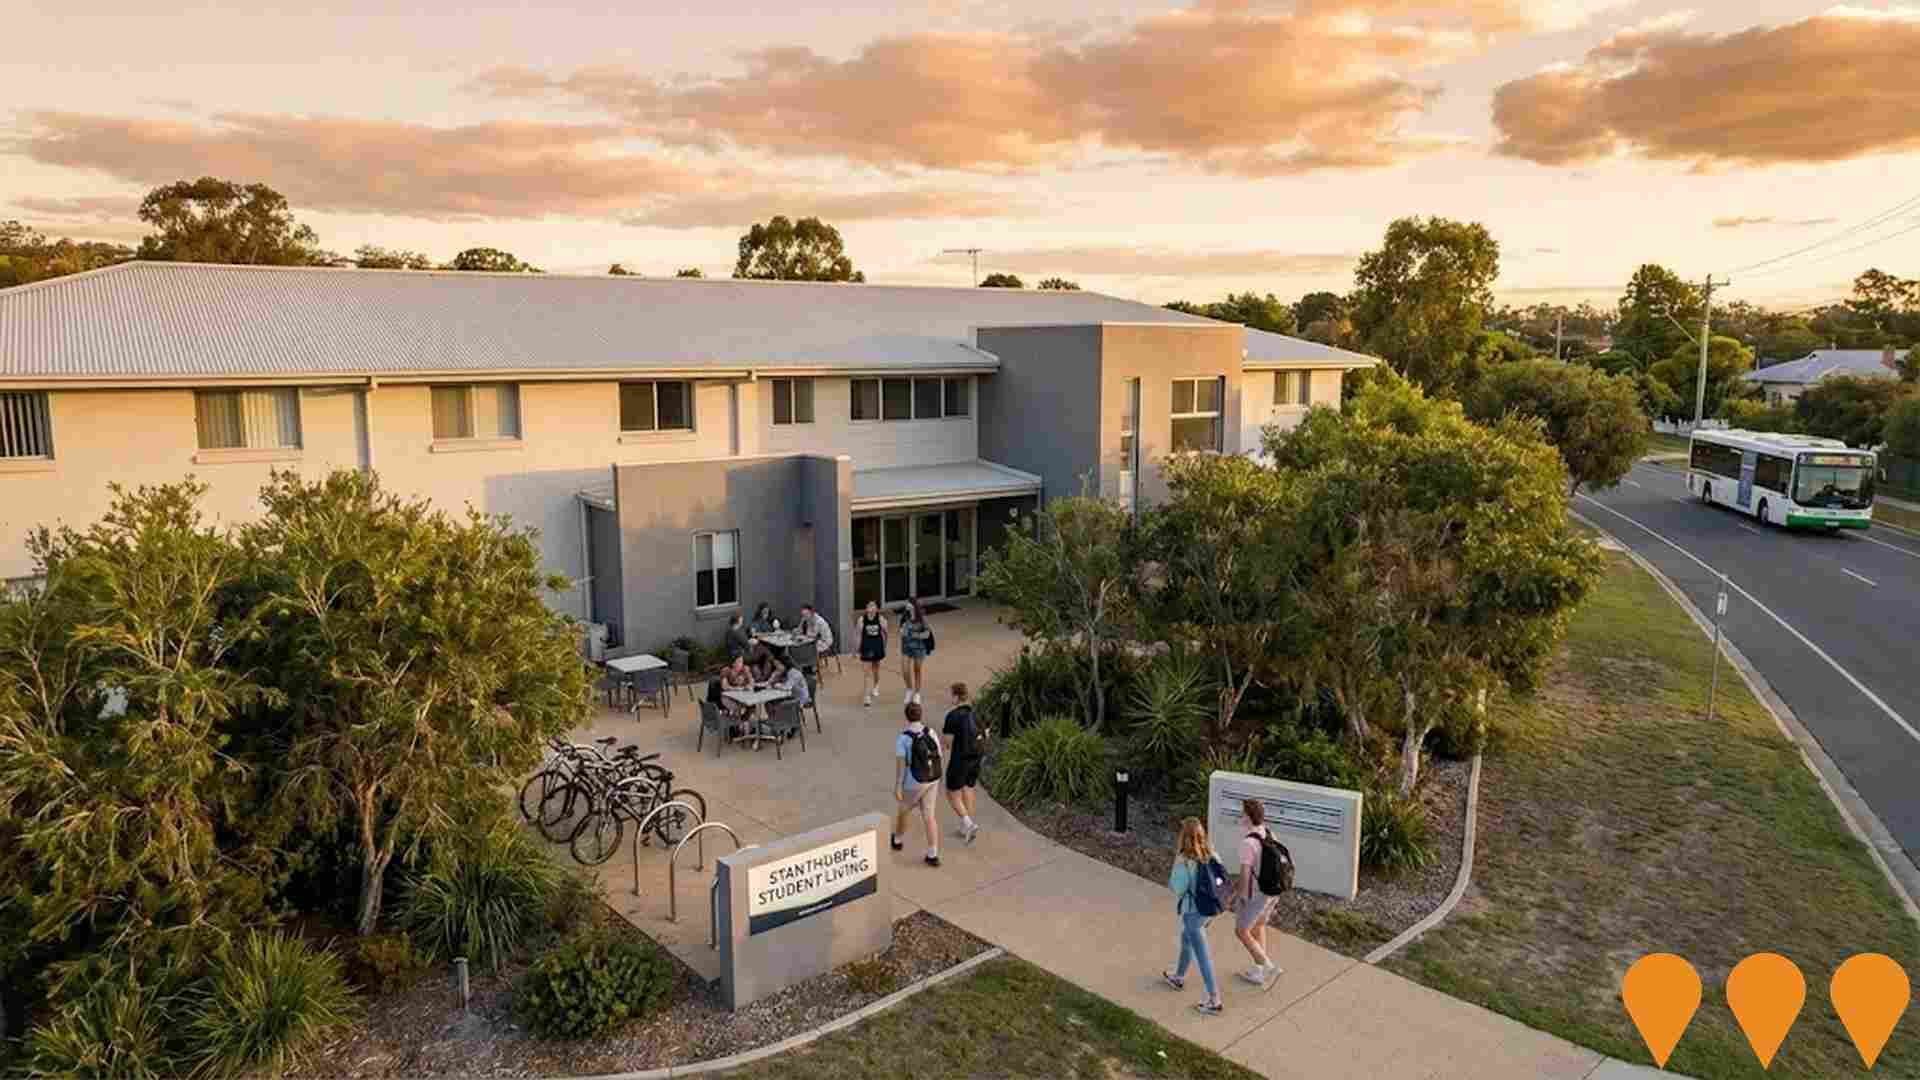
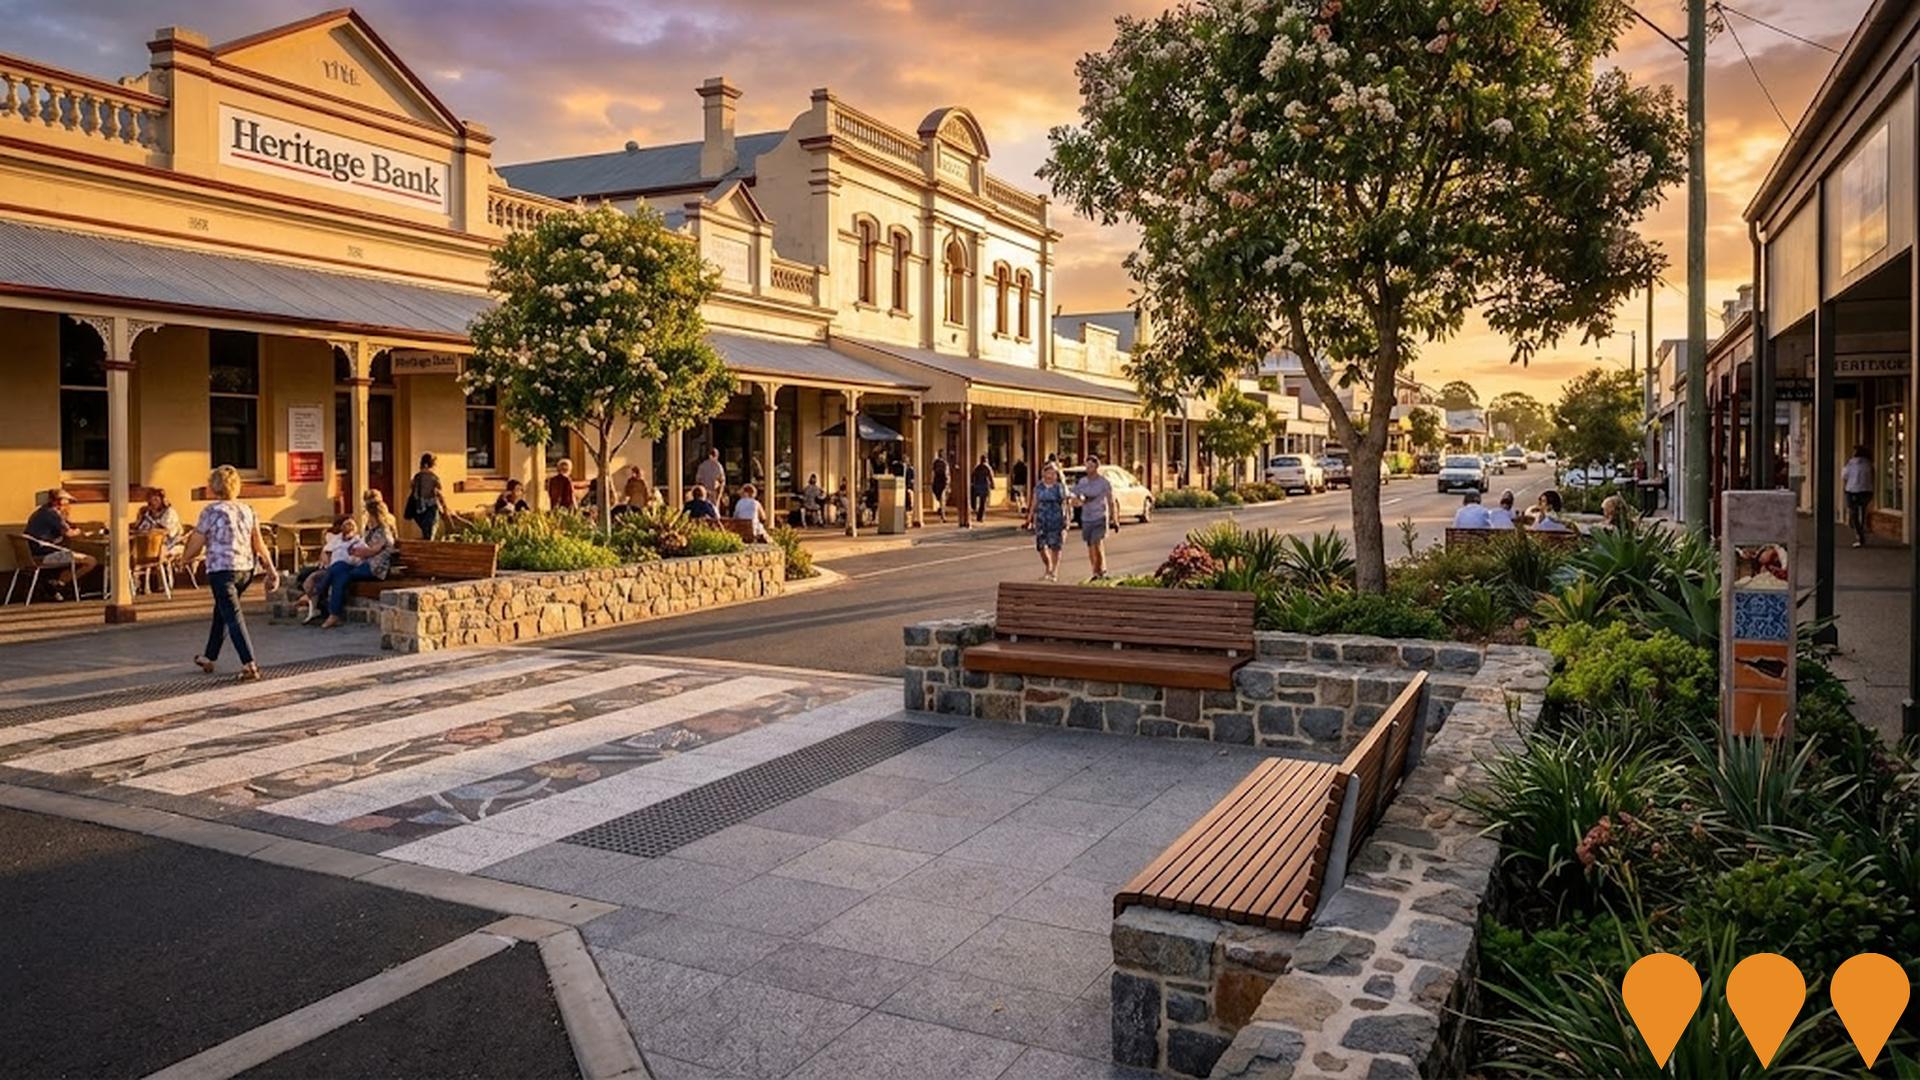
Changes to local infrastructure significantly impact an area's performance. AreaSearch identified five projects likely affecting the region. Notable initiatives include 14 Wallangarra Road Student Accommodation, The Avenues Stanthorpe, Stanthorpe Wastewater Treatment Plant Upgrade, and Stanthorpe Streetscape Project.
Professional plan users can use the search below to filter and access additional projects.
INFRASTRUCTURE SEARCH
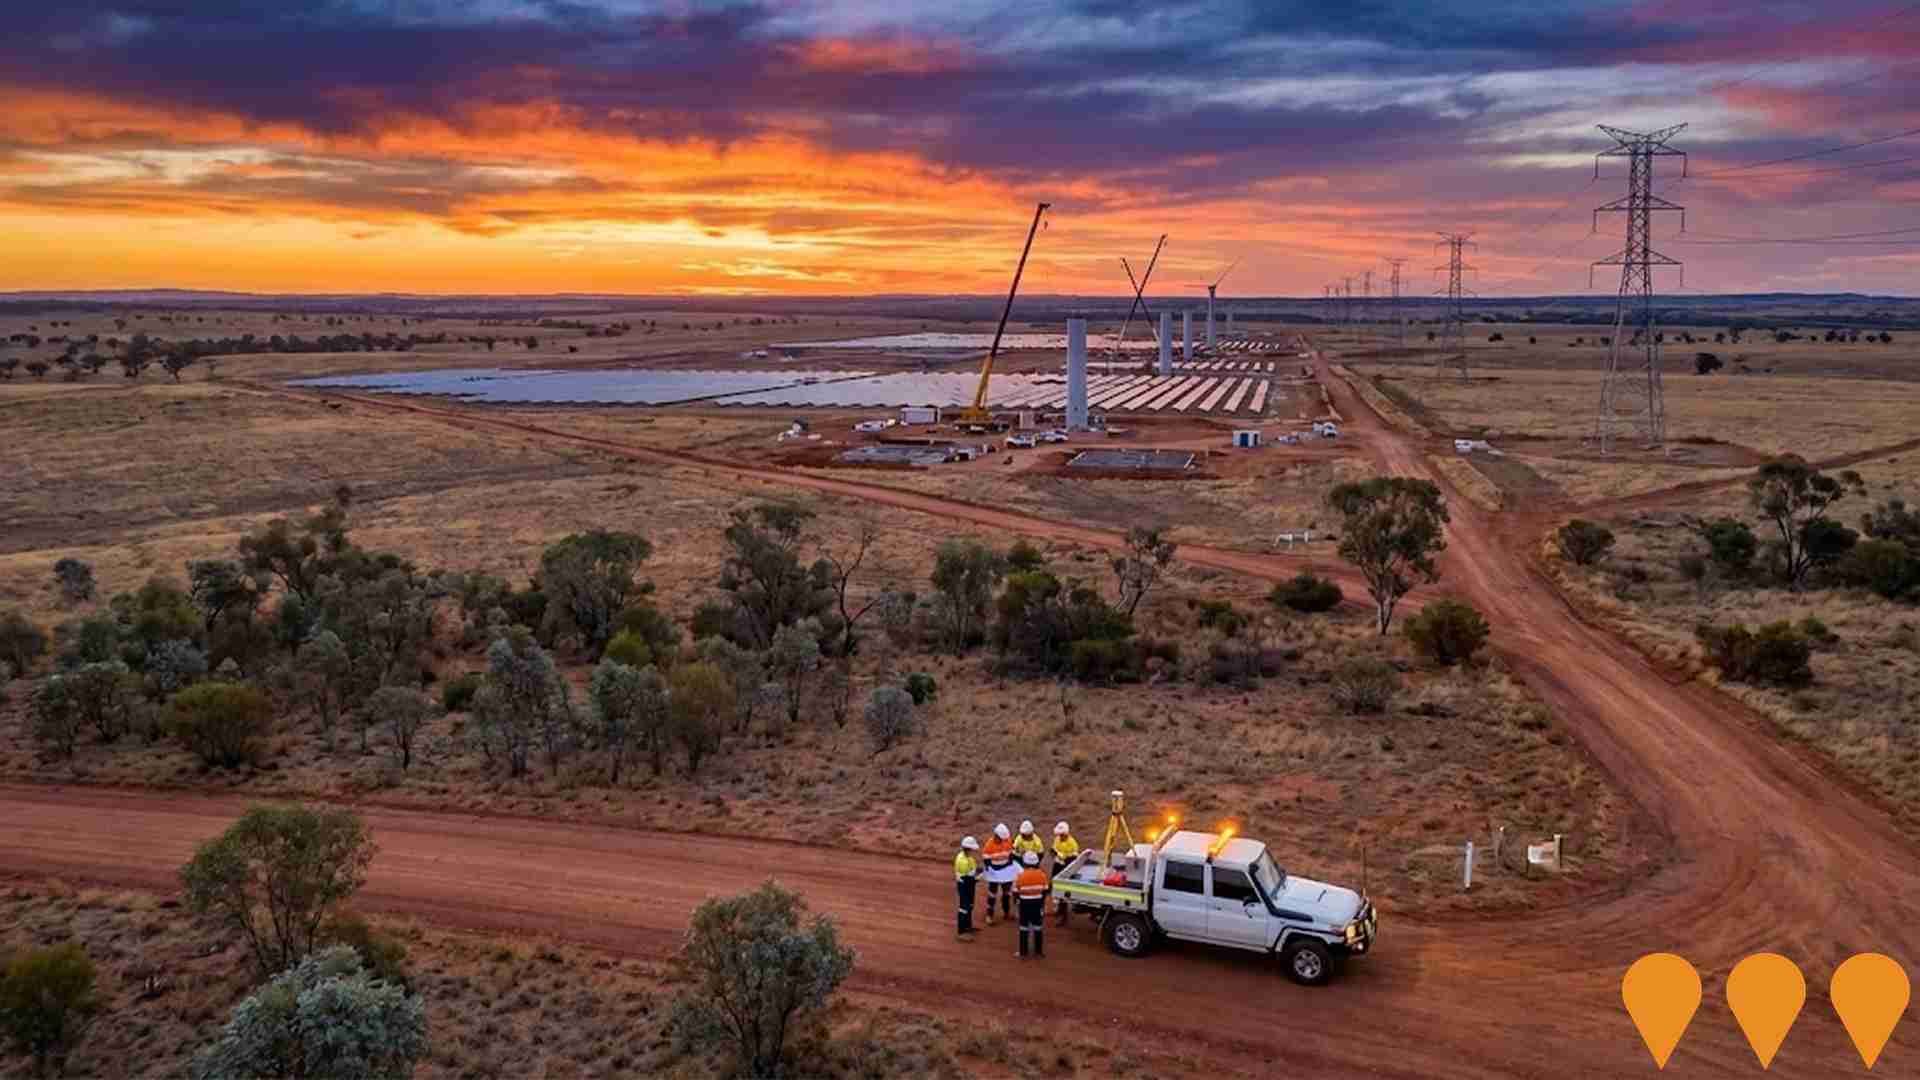
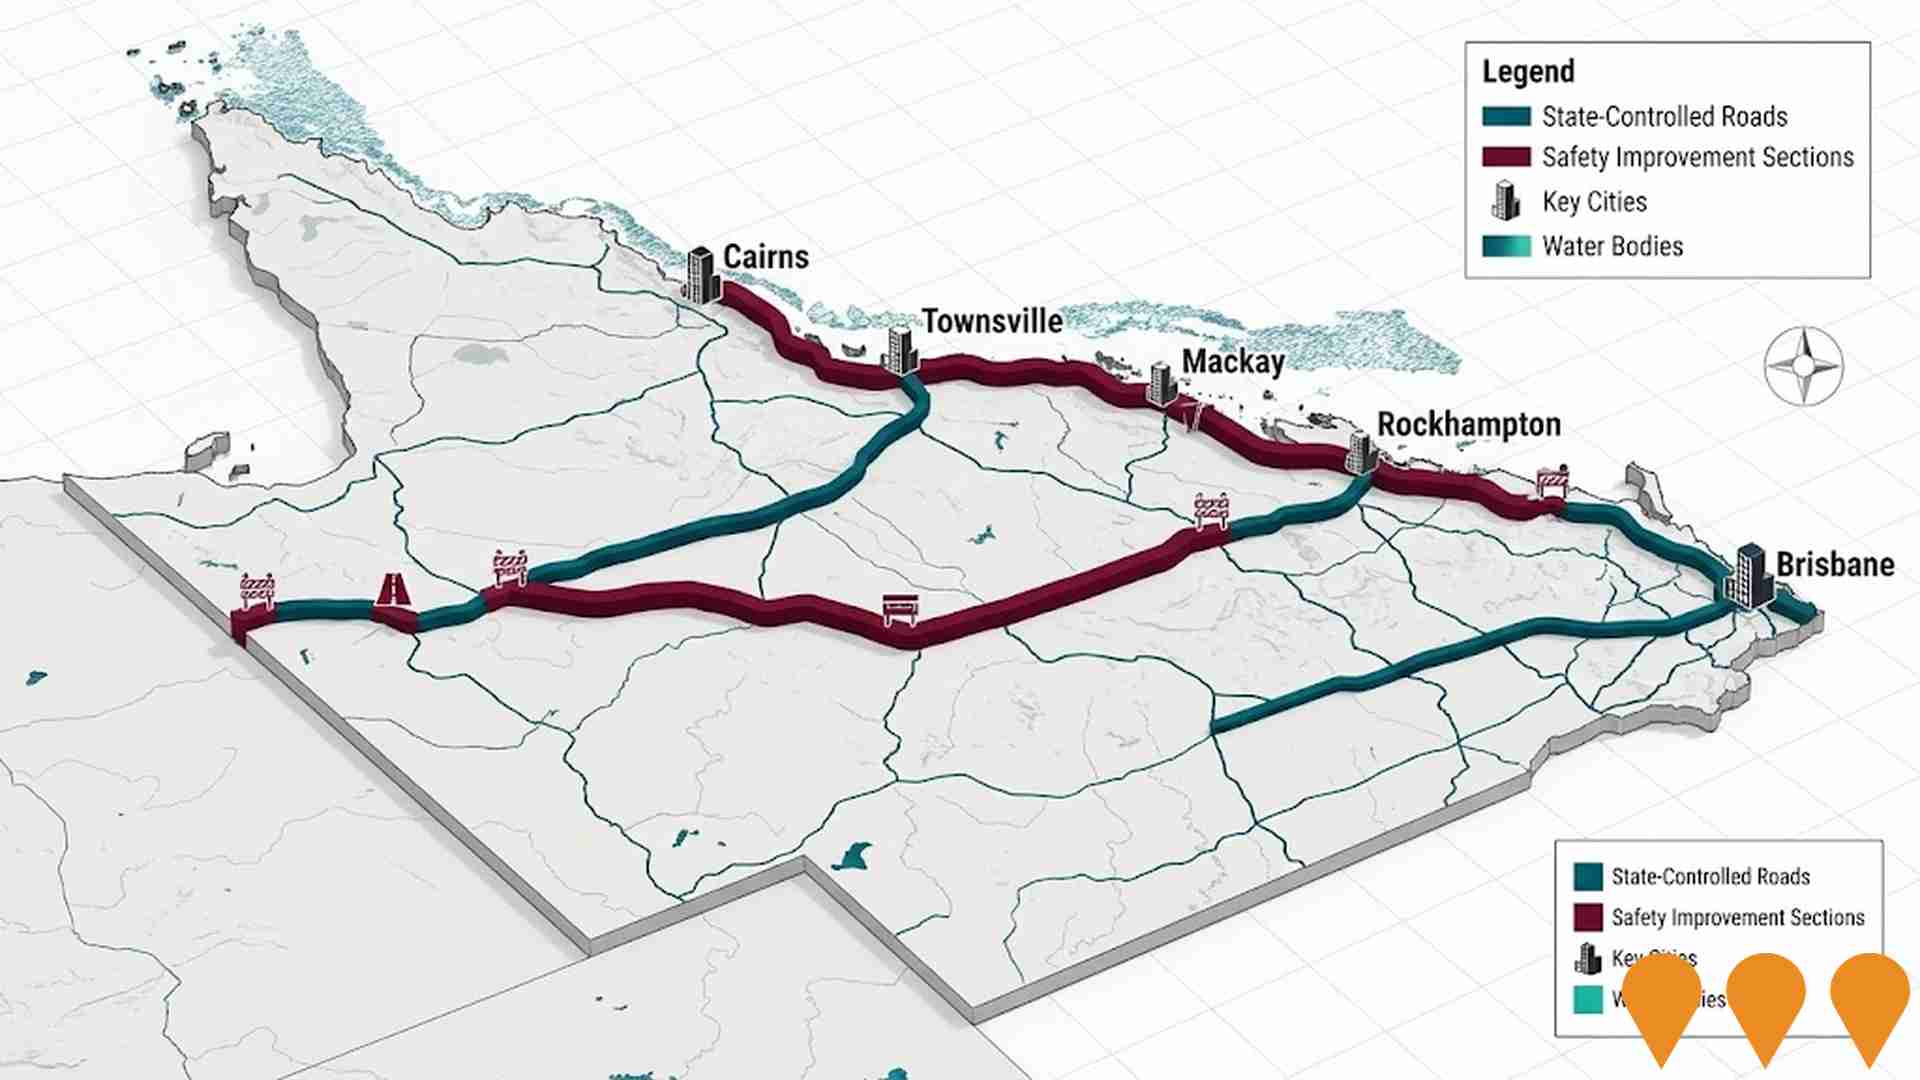
 Denotes AI-based impression for illustrative purposes only, not to be taken as definitive under any circumstances. Please follow links and conduct other investigations from the project's source for actual imagery. Developers and project owners wishing us to use original imagery please Contact Us and we will do so.
Frequently Asked Questions - Infrastructure
Queensland Energy Roadmap Infrastructure
The Queensland Energy Roadmap 2025 is the State Government's strategic plan to deliver affordable, reliable, and sustainable energy. Replaces the former Energy and Jobs Plan, focusing on extending the life of state-owned coal assets, a $1.6 billion Electricity Maintenance Guarantee, and the $400 million Queensland Energy Investment Fund. Key infrastructure includes the CopperString transmission line and new gas-fired generation, while the Pioneer-Burdekin Pumped Hydro project has been cancelled in favor of smaller storage options.
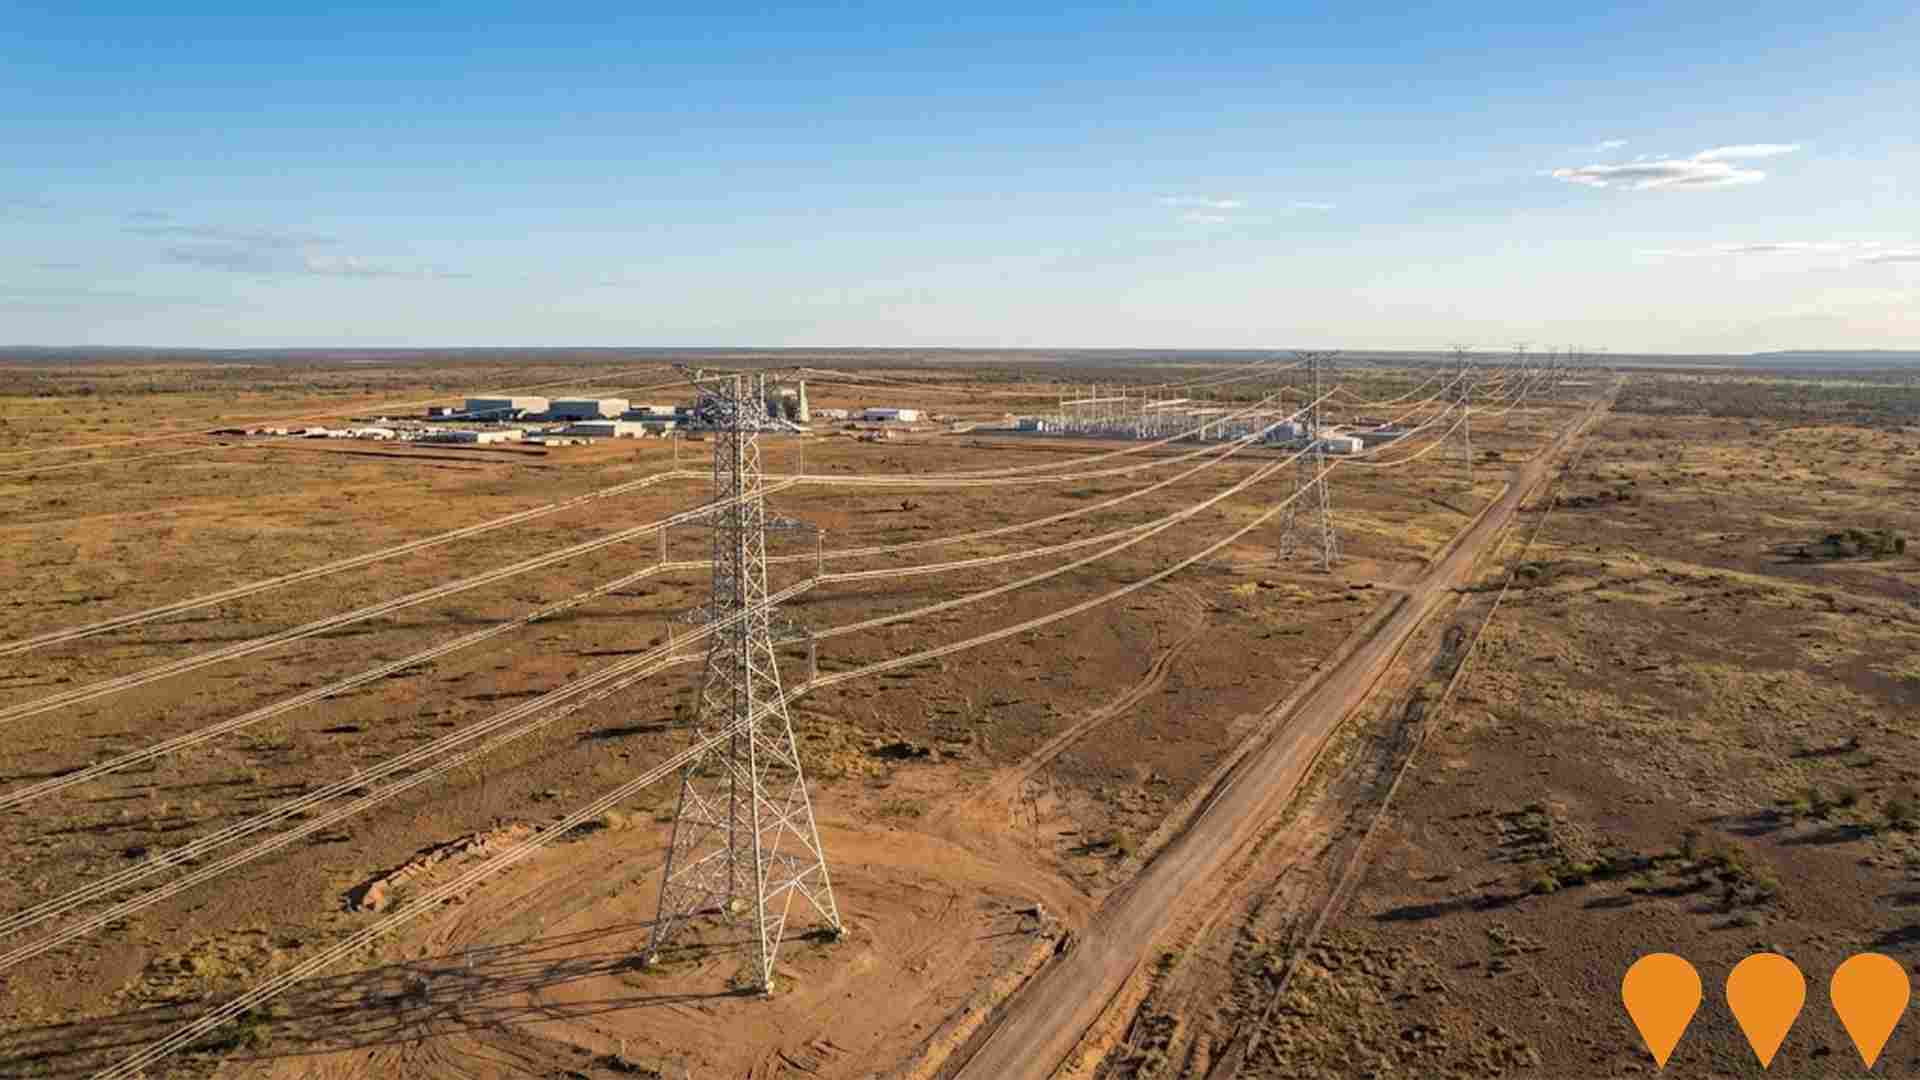
Queensland Energy and Jobs Plan
The Queensland Energy and Jobs Plan, initially a comprehensive plan for renewable energy and job creation, has been superseded by the Queensland Energy Roadmap 2025 by the new government (October 2025). The Roadmap focuses on energy affordability, reliability, and sustainability by leveraging existing coal and gas assets, increasing private sector investment in renewables and storage (targeting 6.8 GW of wind/solar and 3.8 GW of storage by 2030), and developing a new Regional Energy Hubs framework to replace Renewable Energy Zones. The initial $62 billion investment pipeline is now primarily focused on implementing the new Roadmap's priorities, including an estimated $26 billion in reduced energy system costs compared to the previous plan. The foundational legislation is the Energy Roadmap Amendment Bill 2025, which is currently before Parliament and expected to pass by December 2025, formally repealing the previous renewable energy targets. Key infrastructure projects like CopperString's Eastern Link are still progressing. The overall project is in the planning and legislative amendment phase under the new policy.
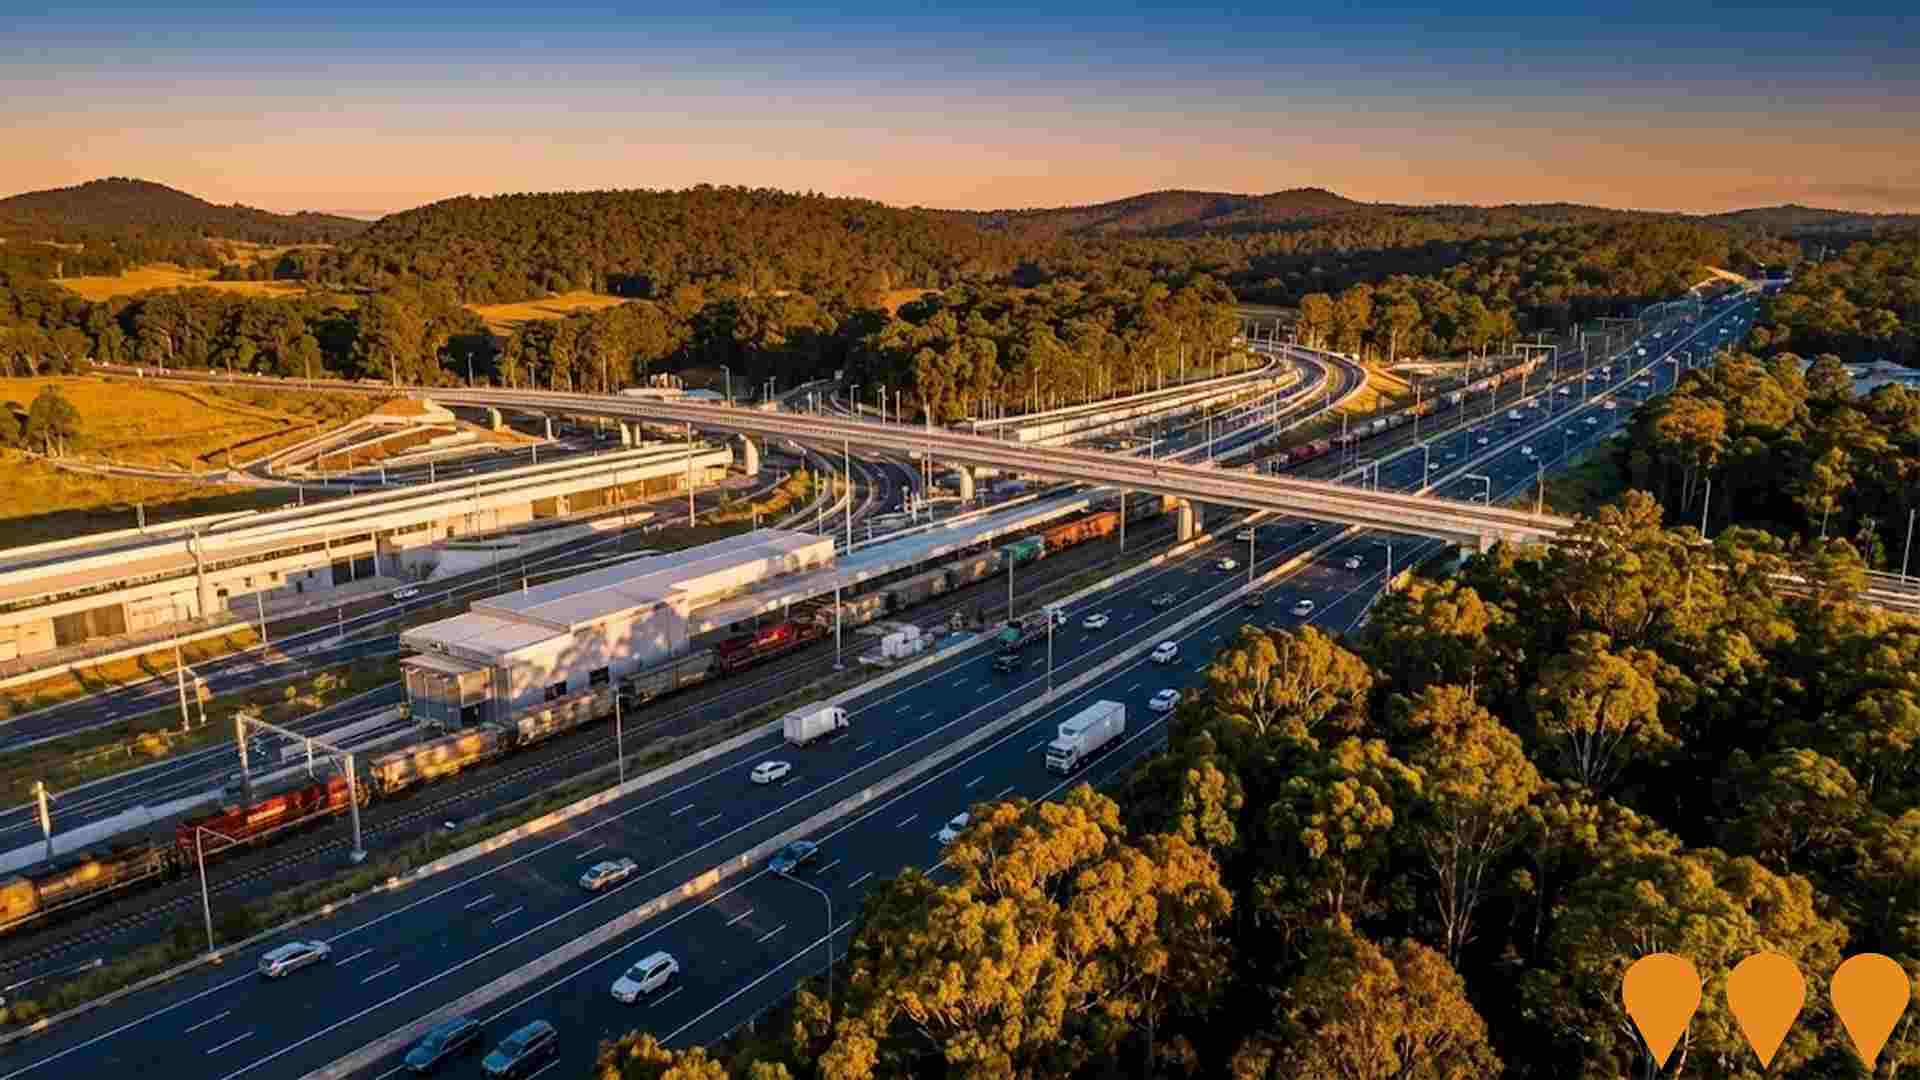
Inland Rail - Queensland Sections
The Queensland sections of Inland Rail form part of the 1,700km Melbourne-to-Brisbane freight railway. Key active segments in Queensland include Calvert to Kagaru (C2K), Helidon to Calvert (H2C), Gowrie to Kagaru (G2K overall), Border to Gowrie (B2G via NSW), and the connection at Ebenezer. The former Kagaru to Acacia Ridge and Bromelton section has been cancelled; the line now connects to the interstate network at Kagaru. Multiple sections are now under construction or in detailed design and early works as of late 2025.

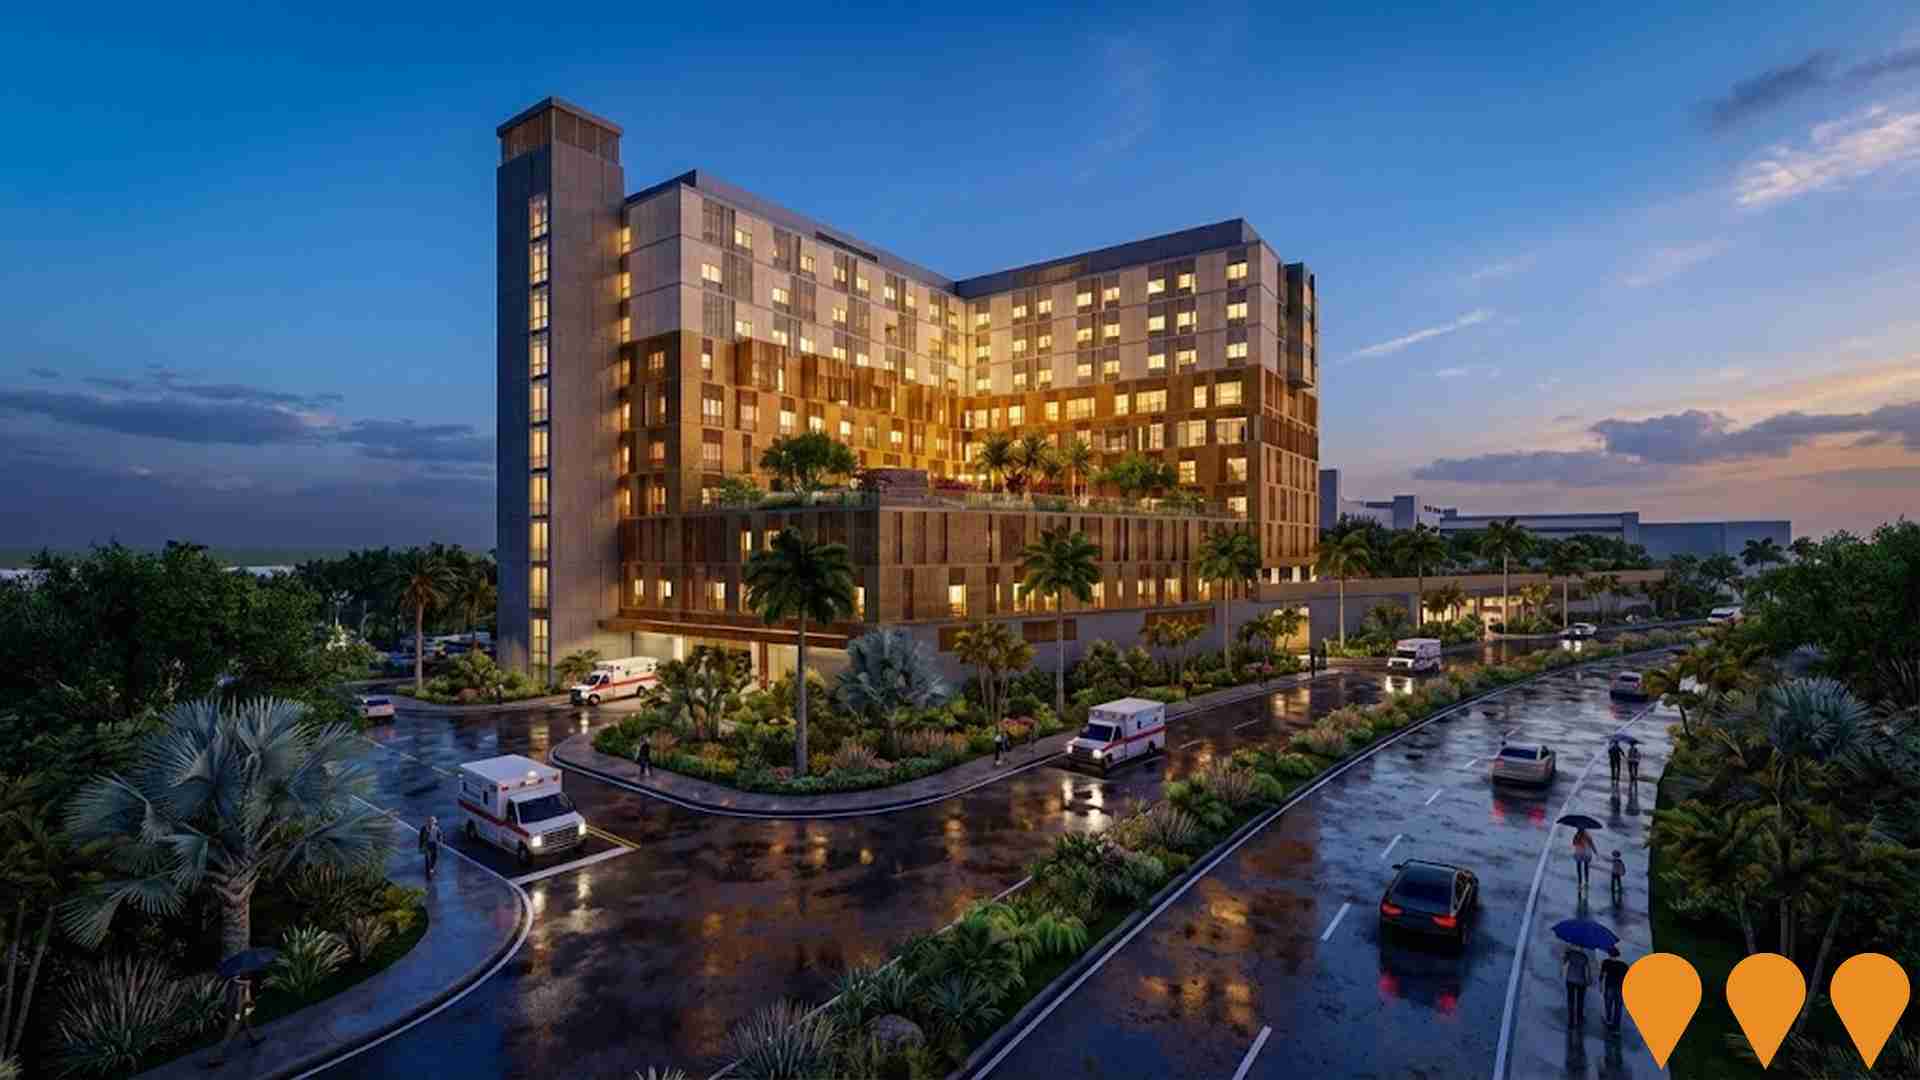
Building Future Hospitals Program
Queensland's flagship hospital infrastructure program delivering over 2,600 new and refurbished public hospital beds by 2031-32. Includes major expansions at Ipswich Hospital (Stage 2), Logan Hospital, Princess Alexandra Hospital, Townsville University Hospital, Gold Coast University Hospital and multiple new satellite hospitals and community health centres.
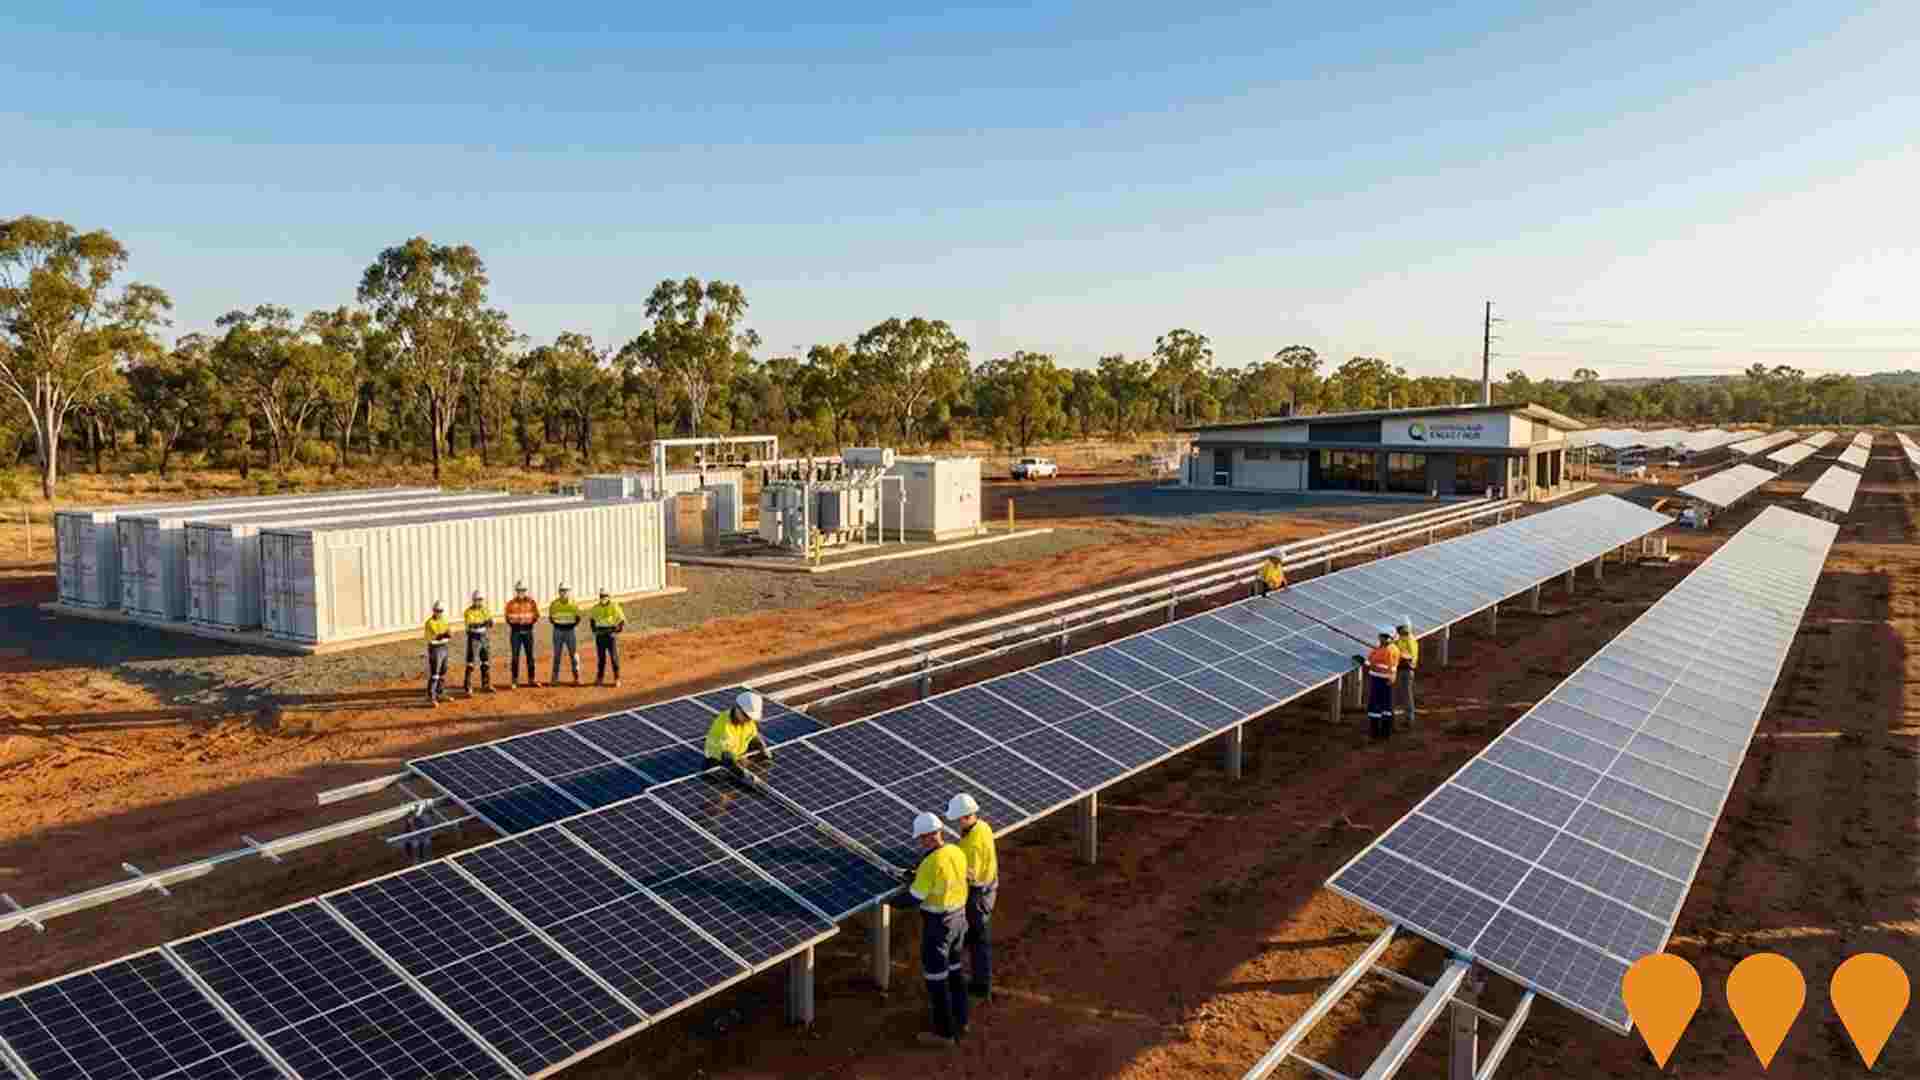
MacIntyre Wind Precinct
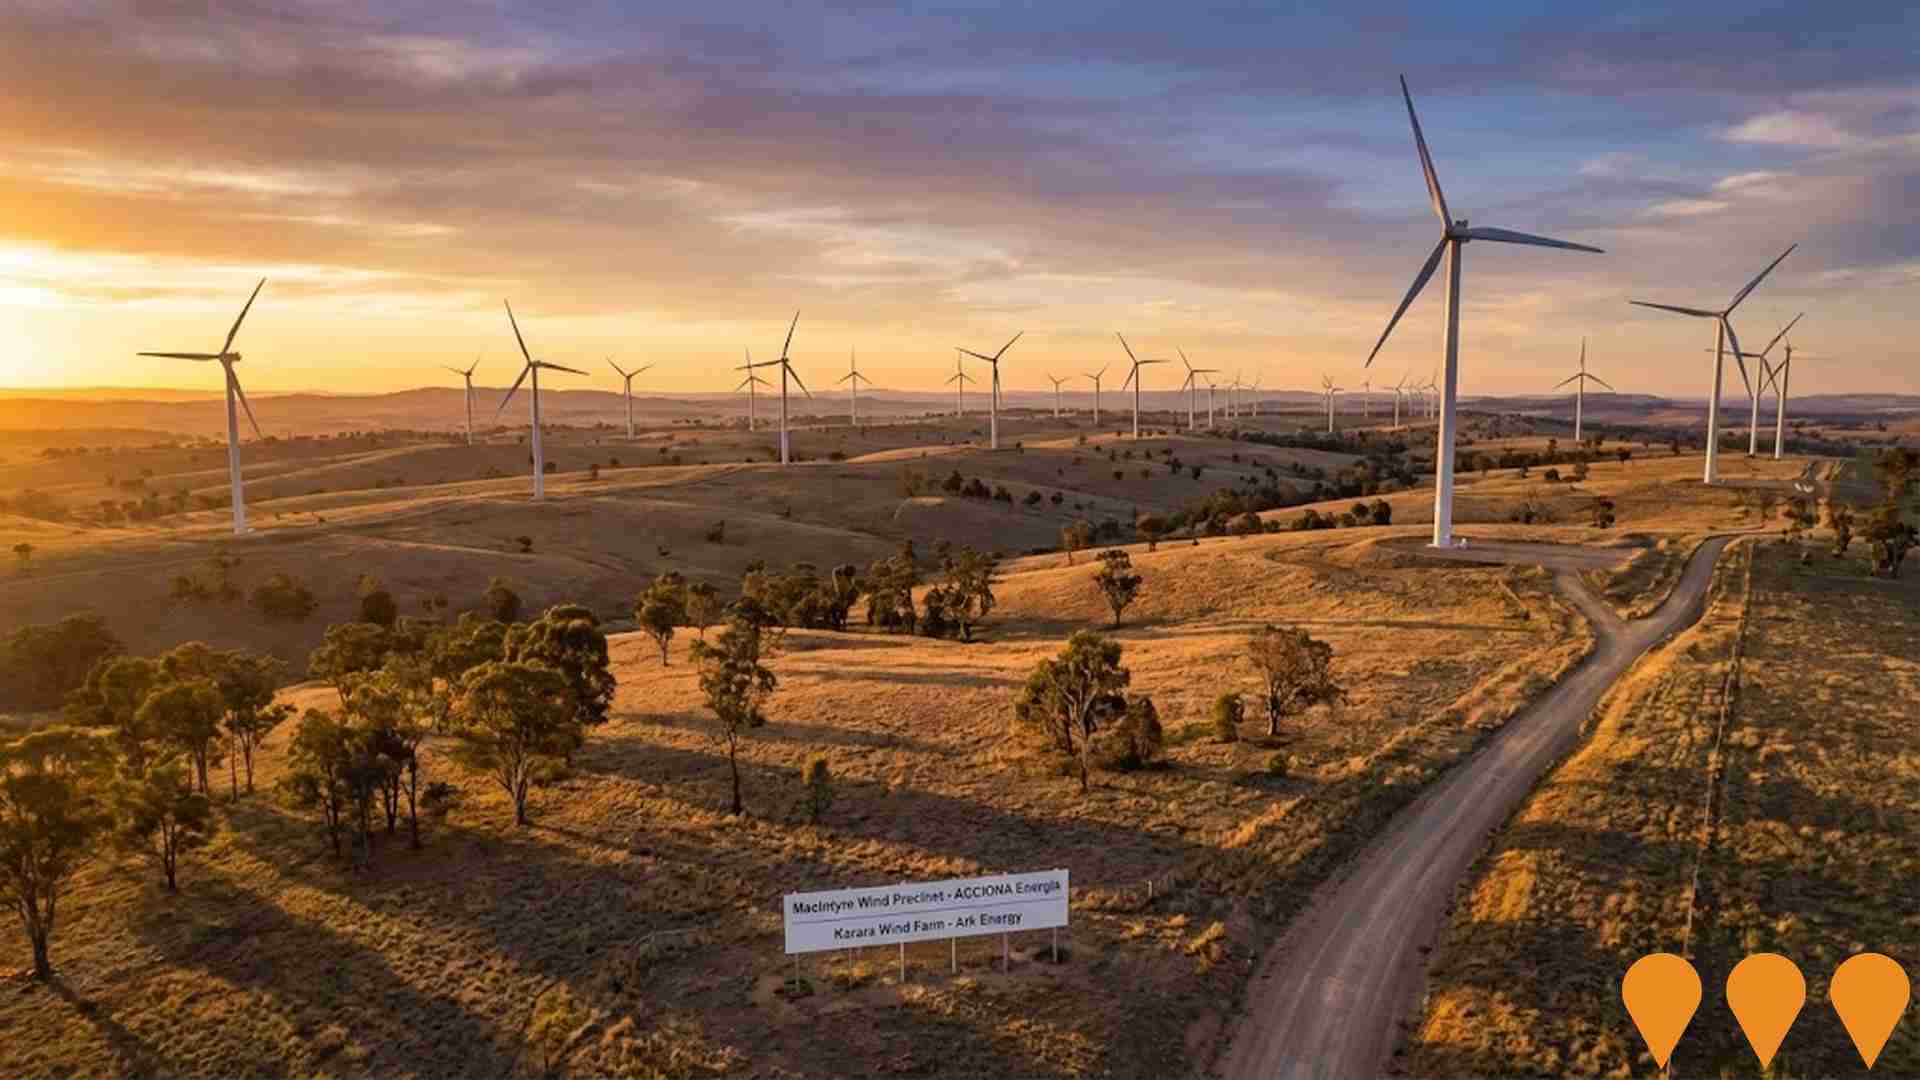
Australia's largest wind energy precinct, located west of Warwick in Queensland's Southern Downs region. The precinct includes the 923 MW MacIntyre Wind Farm (162 turbines, ACCIONA Energia) which achieved first power in November 2024 and is on track for full commercial operations by late 2025, and the 103 MW Karara Wind Farm (Ark Energy). A 400 MW / 800 MWh battery energy storage system (Karara BESS) has development approval and is expected to commence construction in 2025. The proposed 1,000 MW Herries Range Wind Farm remains in early planning. Total precinct capacity exceeds 2 GW when fully built.
Emu Swamp Dam Project (Granite Belt Irrigation Project)
A proposed 12,074 ML irrigation dam and water-supply scheme on the Severn River, 15km south-west of Stanthorpe. It includes the dam, a pipeline distribution network, and irrigation channels for the Granite Belt region. The original Environmental Impact Statement (EIS) evaluation report lapsed in April 2023, and the project is currently being re-evaluated as part of the Queensland Government's Southern and Darling Downs Regional Water Assessment (RWA) due to increased cost estimates.

Inland Rail - NSW/Queensland Border to Gowrie (B2G)
The Border to Gowrie (B2G) section of Inland Rail is a ~217km segment (149km new dual-gauge track and 68km upgraded existing track) connecting the NSW/QLD border near Yelarbon (18km southeast of Goondiwindi) to Gowrie Junction northwest of Toowoomba. Part of the Melbourne-to-Brisbane Inland Rail freight corridor. As of November 2025, the project is in the approvals phase following closure of public consultation on the revised draft EIS (12 May - 4 August 2025). Inland Rail is preparing a response to submissions for the Queensland Coordinator-General. Subject to approvals, major construction expected to commence by 2029, taking ~4 years.
Stanthorpe Wastewater Treatment Plant Upgrade
Major upgrade of the aging Stanthorpe Wastewater Treatment Plant which has reached end of life. The project involves full design and renewal of the treatment facility using the latest technology to ensure capacity for growth, improved reliability, and compliance with changing environmental standards. Concept design has been completed and detailed design is underway before construction contractors are engaged.

Employment
AreaSearch analysis reveals Stanthorpe recording weaker employment conditions than most comparable areas nationwide
Stanthorpe has a balanced workforce with diverse sector representation. Its unemployment rate was 5.4% in the past year, with an estimated employment growth of 3.8%.
As of September 2025, 2,296 residents are employed while the unemployment rate is 1.3% higher than Rest of Qld's rate of 4.1%. Workforce participation lags at 47.0%, compared to Rest of Qld's 59.1%. Leading employment industries include health care & social assistance, agriculture, forestry & fishing, and retail trade. Stanthorpe specializes in agriculture, forestry & fishing, with an employment share three times the regional level.
Mining employs only 0.6% of local workers, below Rest of Qld's 3.6%. Many residents commute elsewhere for work. In the year ending September 2025, employment increased by 3.8%, labour force by 6.9%, leading to a rise in unemployment by 2.8 percentage points. This contrasts with Rest of Qld where employment rose by 1.7% and unemployment by 0.3%. State-level data as of 25-Nov-25 shows Queensland's employment contracted by 0.01% (losing 1,210 jobs), with the state unemployment rate at 4.2%, closely aligned with the national rate of 4.3%. Jobs and Skills Australia forecasts national employment growth of 6.6% over five years and 13.7% over ten years. Applying these projections to Stanthorpe's employment mix suggests local employment should increase by 6.0% over five years and 12.8% over ten years, though this is a simple extrapolation for illustrative purposes only.
Frequently Asked Questions - Employment
Income
Income metrics place the area in the bottom 10% of locations nationally according to AreaSearch analysis
The latest postcode level ATO data for financial year 2022 shows that Stanthorpe SA2 has an income below the national average. The median income is $38,665 and the average income is $47,217. This contrasts with Rest of Qld's figures where the median income is $50,780 and the average income is $64,844. Based on Wage Price Index growth of 13.99% since financial year 2022, current estimates for Stanthorpe as of September 2025 would be approximately $44,074 (median) and $53,823 (average). Census data reveals that household, family and personal incomes in Stanthorpe all fall between the 2nd and 7th percentiles nationally. The income bracket of $400 - 799 dominates with 33.2% of residents (1,818 people), differing from the broader area where the $1,500 - 2,999 category predominates at 31.7%. Economic circumstances indicate widespread financial pressure, with 42.7% of households operating within modest weekly budgets below $800. After housing costs, 85.1% of income remains, ranking at only the 4th percentile nationally.
Frequently Asked Questions - Income
Housing
Stanthorpe is characterized by a predominantly suburban housing profile, with above-average rates of outright home ownership
Stanthorpe's dwelling structure, as per the latest Census, consisted of 88.4% houses and 11.6% other dwellings. In comparison, Non-Metro Qld had 92.3% houses and 7.6% other dwellings. Home ownership in Stanthorpe was 44.8%, with mortgaged dwellings at 23.8% and rented ones at 31.3%. The median monthly mortgage repayment was $1,200, lower than Non-Metro Qld's average of $1,300. The median weekly rent in Stanthorpe was $250, compared to Non-Metro Qld's $255. Nationally, Stanthorpe's mortgage repayments were significantly lower at $1,200 than the Australian average of $1,863, while rents were substantially lower at $250 compared to the national figure of $375.
Frequently Asked Questions - Housing
Household Composition
Stanthorpe features high concentrations of lone person households, with a lower-than-average median household size
Family households constitute 61.1% of all households, including 18.6% couples with children, 31.7% couples without children, and 9.8% single parent families. Non-family households comprise the remaining 38.9%, with lone person households at 36.2% and group households making up 2.6% of the total. The median household size is 2.1 people, which is smaller than the Rest of Qld average of 2.3.
Frequently Asked Questions - Households
Local Schools & Education
Stanthorpe faces educational challenges, with performance metrics placing it in the bottom quartile of areas assessed nationally
The area's university qualification rate is 16.3%, significantly lower than Australia's average of 30.4%. Bachelor degrees are the most common at 12.3%, followed by postgraduate qualifications (2.5%) and graduate diplomas (1.5%). Vocational credentials are prevalent, with 37.2% of residents aged 15+ holding them, including advanced diplomas (9.2%) and certificates (28.0%). Educational participation is high at 25.1%, with 10.3% in primary education, 8.7% in secondary education, and 1.9% pursuing tertiary education.
Educational participation is notably high, with 25.1% of residents currently enrolled in formal education. This includes 10.3% in primary education, 8.7% in secondary education, and 1.9% pursuing tertiary education.
Frequently Asked Questions - Education
Schools Detail
Nearby Services & Amenities
Transport
Transport servicing is very low compared to other areas nationally based on assessment of service frequency, route connectivity and accessibility
Stanthorpe has seven active public transport stops, all of which operate buses. These stops are served by two different routes that together offer 20 weekly passenger trips. The accessibility of these services is limited, with residents typically living 977 meters away from the nearest stop.
On average, there are two bus trips per day across all routes, equating to roughly two weekly trips per individual stop.
Frequently Asked Questions - Transport
Transport Stops Detail
Health
Health performance in Stanthorpe is a key challenge with a range of health conditions having marked impacts on both younger and older age cohorts
Stanthorpe faces significant health challenges, with various conditions affecting both younger and older age groups. Approximately 46% (~2,519 individuals) have private health cover, lower than the national average of 55.3%.
The most prevalent medical issues are arthritis (12.4%) and mental health concerns (8.9%). Conversely, 59.6% report having no medical ailments, compared to 62.0% in the rest of Queensland. Stanthorpe has a higher proportion of residents aged 65 and over at 32.4% (1,776 people), compared to 27.0% in the rest of Queensland.
Frequently Asked Questions - Health
Cultural Diversity
Stanthorpe ranks below the Australian average when compared to other local markets across a number of language and cultural background related metrics
Stanthorpe, surveyed in June 2016, had a low cultural diversity index with 88.3% of its population being Australian citizens, 83.2% born in Australia, and 90.4% speaking English only at home. Christianity was the dominant religion, practiced by 62.6%, compared to 63.9% across the Rest of Queensland. The top ancestry groups were English (30.0%), Australian (27.2%), and Irish (8.5%).
Notably, Italian (8.2%) and German (4.4%) ethnicities were overrepresented in Stanthorpe compared to regional averages of 2.8% and 5.6%, respectively. Korean ethnicity was also slightly higher at 0.4%.
Frequently Asked Questions - Diversity
Age
Stanthorpe ranks among the oldest 10% of areas nationwide
Stanthorpe's median age is 50 years, which is significantly older than Rest of Qld's 41 and higher than the Australian median of 38. The population aged 65-74 is particularly prominent at 16.6%, compared to the national average of 9.4%. In contrast, the 35-44 age group comprises only 9.8% in Stanthorpe, lower than Rest of Qld's figure. Post-2021 Census data shows changes in age distribution: the 15-24 cohort grew from 8.9% to 11.1%, while the 75-84 group increased from 10.5% to 11.5%. Conversely, the 5-14 age group declined from 11.6% to 9.4%, and the 45-54 cohort dropped from 11.3% to 10.2%. By 2041, demographic modeling projects significant changes in Stanthorpe's age profile, with the 85+ age group expanding by 139 people (60%) from 233 to 373. Senior residents aged 65 and above will drive 68% of population growth, reflecting aging trends. Both the 65-74 and 45-54 age groups are projected to decrease in number.
