Chart Color Schemes
This analysis uses ABS Statistical Areas Level 2 (SA2) boundaries, which can materially differ from Suburbs and Localities (SAL) even when sharing similar names.
SA2 boundaries are defined by the Australian Bureau of Statistics and are designed to represent communities for statistical reporting (e.g., census and ERP).
Suburbs and Localities (SAL) represent commonly-used suburb/locality names (postal-style areas) and may use different geographic boundaries. For comprehensive analysis, consider reviewing both boundary types if available.
est. as @ -- *
ABS ERP | -- people | --
2021 Census | -- people
Sales Activity
Curious about local property values? Filter the chart to assess the volume and appreciation (including resales) trends and regional comparisons, or scroll to the map below view this information at an individual property level.
Find a Recent Sale
Sales Detail
Population
Southern Downs - East is positioned among the lower quartile of areas assessed nationally for population growth based on AreaSearch's assessment of recent, and medium term trends
Southern Downs - East's population was approximately 4,705 as of November 2025. This figure represents an increase of 345 people from the 2021 Census total of 4,360. The growth is inferred from ABS estimated resident population data of 4,595 in June 2024 and additional validated new addresses since the Census date. This results in a population density ratio of 2.9 persons per square kilometer. Southern Downs - East's population growth rate of 7.9% since the 2021 census exceeded both its SA4 region (5.5%) and SA3 area, indicating it as a leader in regional growth. Interstate migration contributed approximately 89.6% to this overall population increase.
AreaSearch uses ABS/Geoscience Australia projections for each SA2 area released in 2024 with a base year of 2022. For areas not covered by this data and years post-2032, Queensland State Government's SA2 area projections from 2023 based on 2021 data are adopted. However, these state projections lack age category splits, so AreaSearch applies proportional growth weightings in line with ABS Greater Capital Region projections released in 2023 and based on 2022 data for each age cohort. Future population dynamics anticipate lower quartile growth for national regional areas. By 2041, the area is expected to increase by 81 persons, reflecting a decrease of 0.6% over the 17 years based on the latest annual ERP population numbers.
Frequently Asked Questions - Population
Development
Recent residential development output has been above average within Southern Downs - East when compared nationally
Southern Downs - East recorded approximately 28 residential properties granted approval annually over the past five financial years, totalling 143 homes. In fiscal year 26 so far, 14 approvals have been recorded. On average, 2.1 people moved to the area per new home constructed each year between fiscal years 2021 and 2025, reflecting robust demand that supports property values. New homes were built at an average expected construction cost value of $280,000, below the regional average, suggesting more affordable housing options for buyers.
This financial year has seen $2.3 million in commercial approvals, indicating minimal commercial development activity. Compared to the rest of Queensland, Southern Downs - East recorded somewhat elevated construction, with 49.0% above the regional average per person over the five-year period, preserving reasonable buyer options while sustaining existing property demand. New development consisted of 96.0% standalone homes and 4.0% attached dwellings, maintaining the area's traditional low-density character with a focus on family homes appealing to those seeking space.
With approximately 145 people per approval, Southern Downs - East reflects a developing area. Given that population is expected to remain stable or decline, Southern Downs - East should see reduced pressure on housing in the future, potentially creating opportunities for buyers.
Frequently Asked Questions - Development
Infrastructure
Southern Downs - East has moderate levels of nearby infrastructure activity, ranking in the top 50% nationally
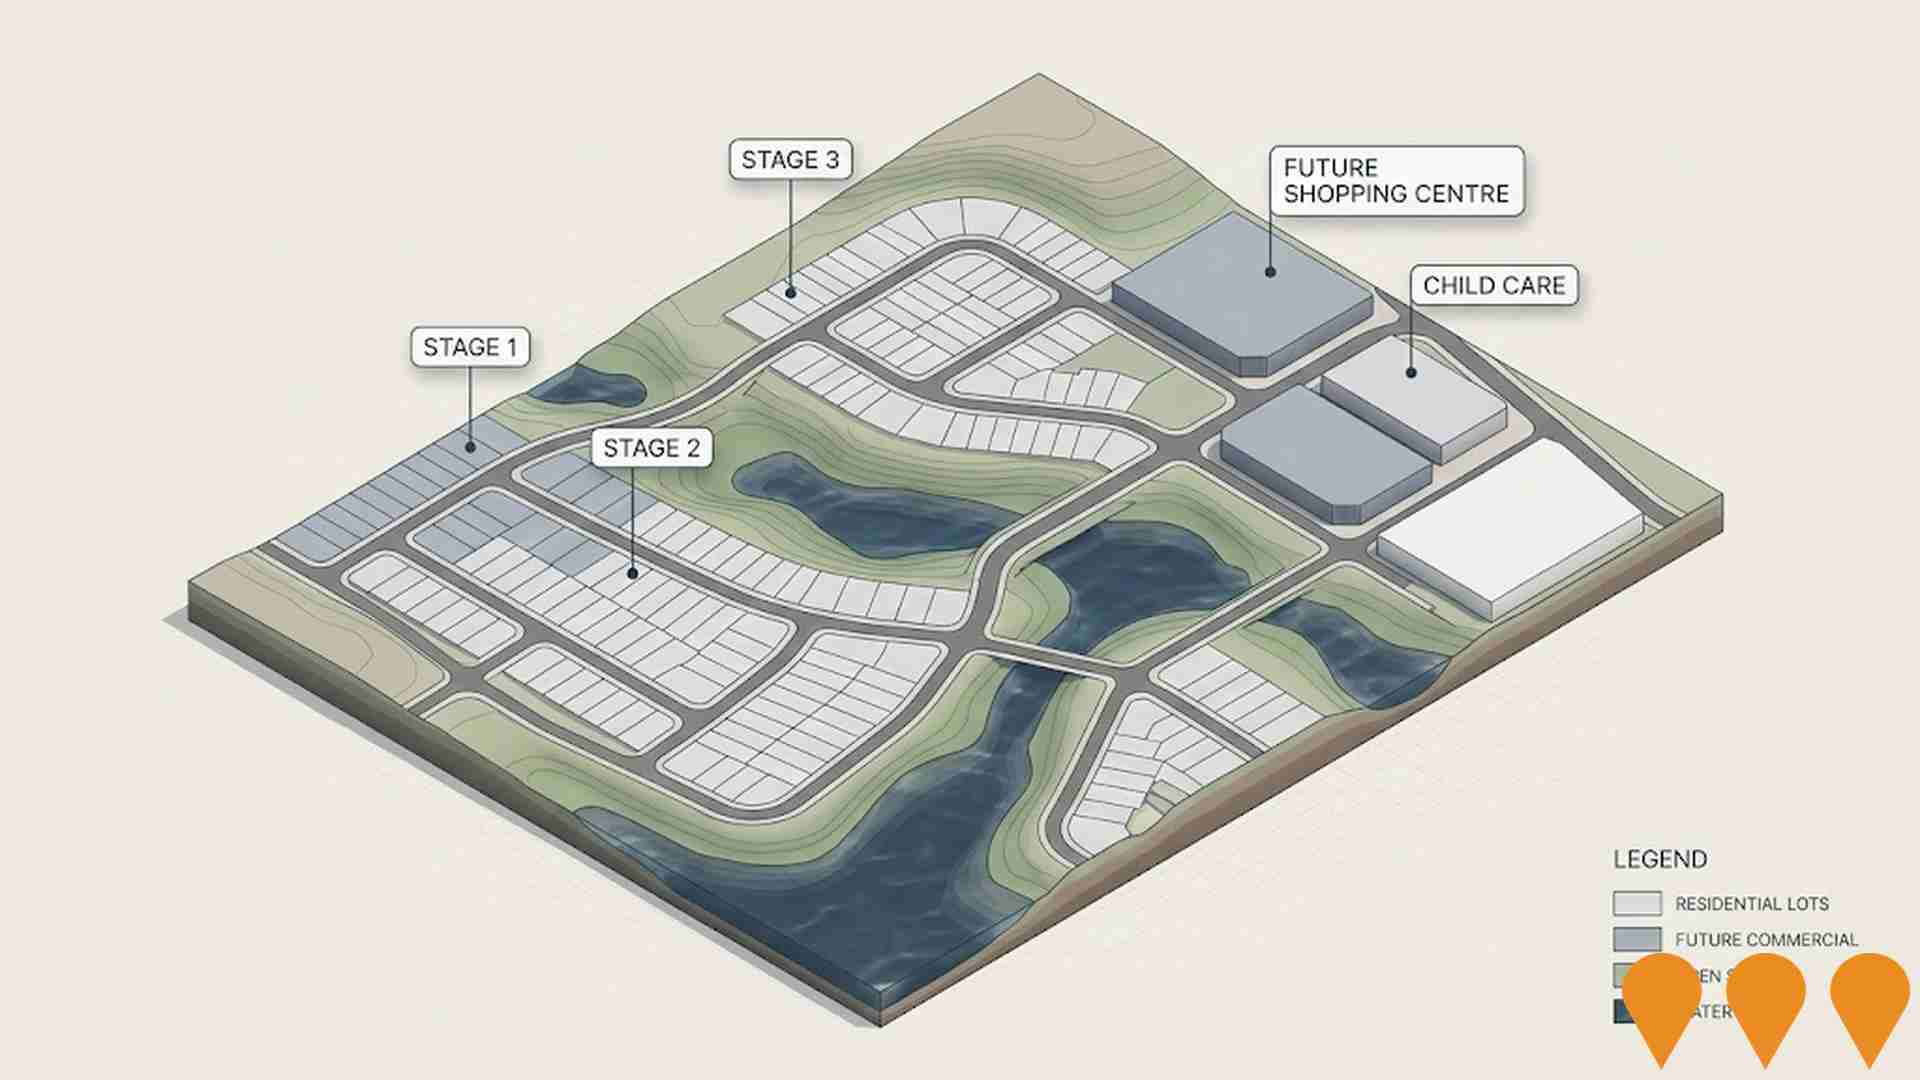
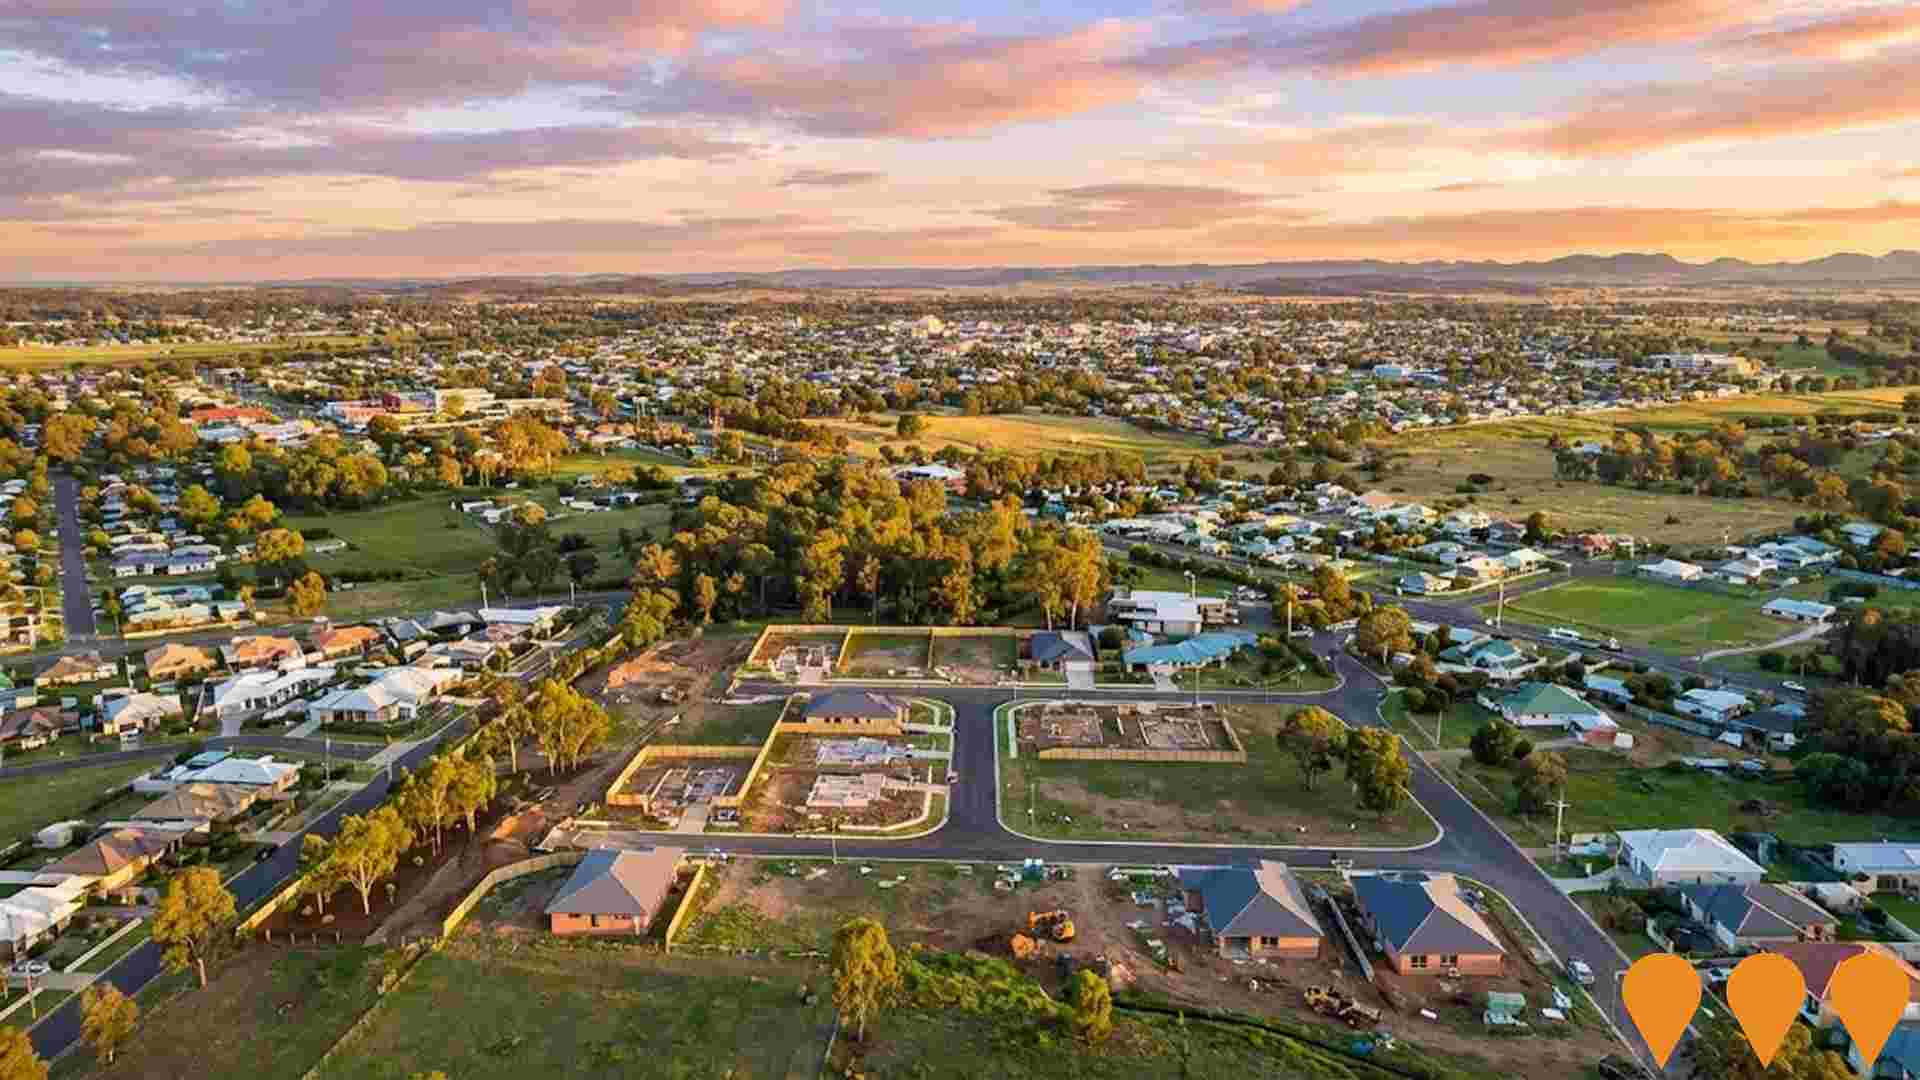
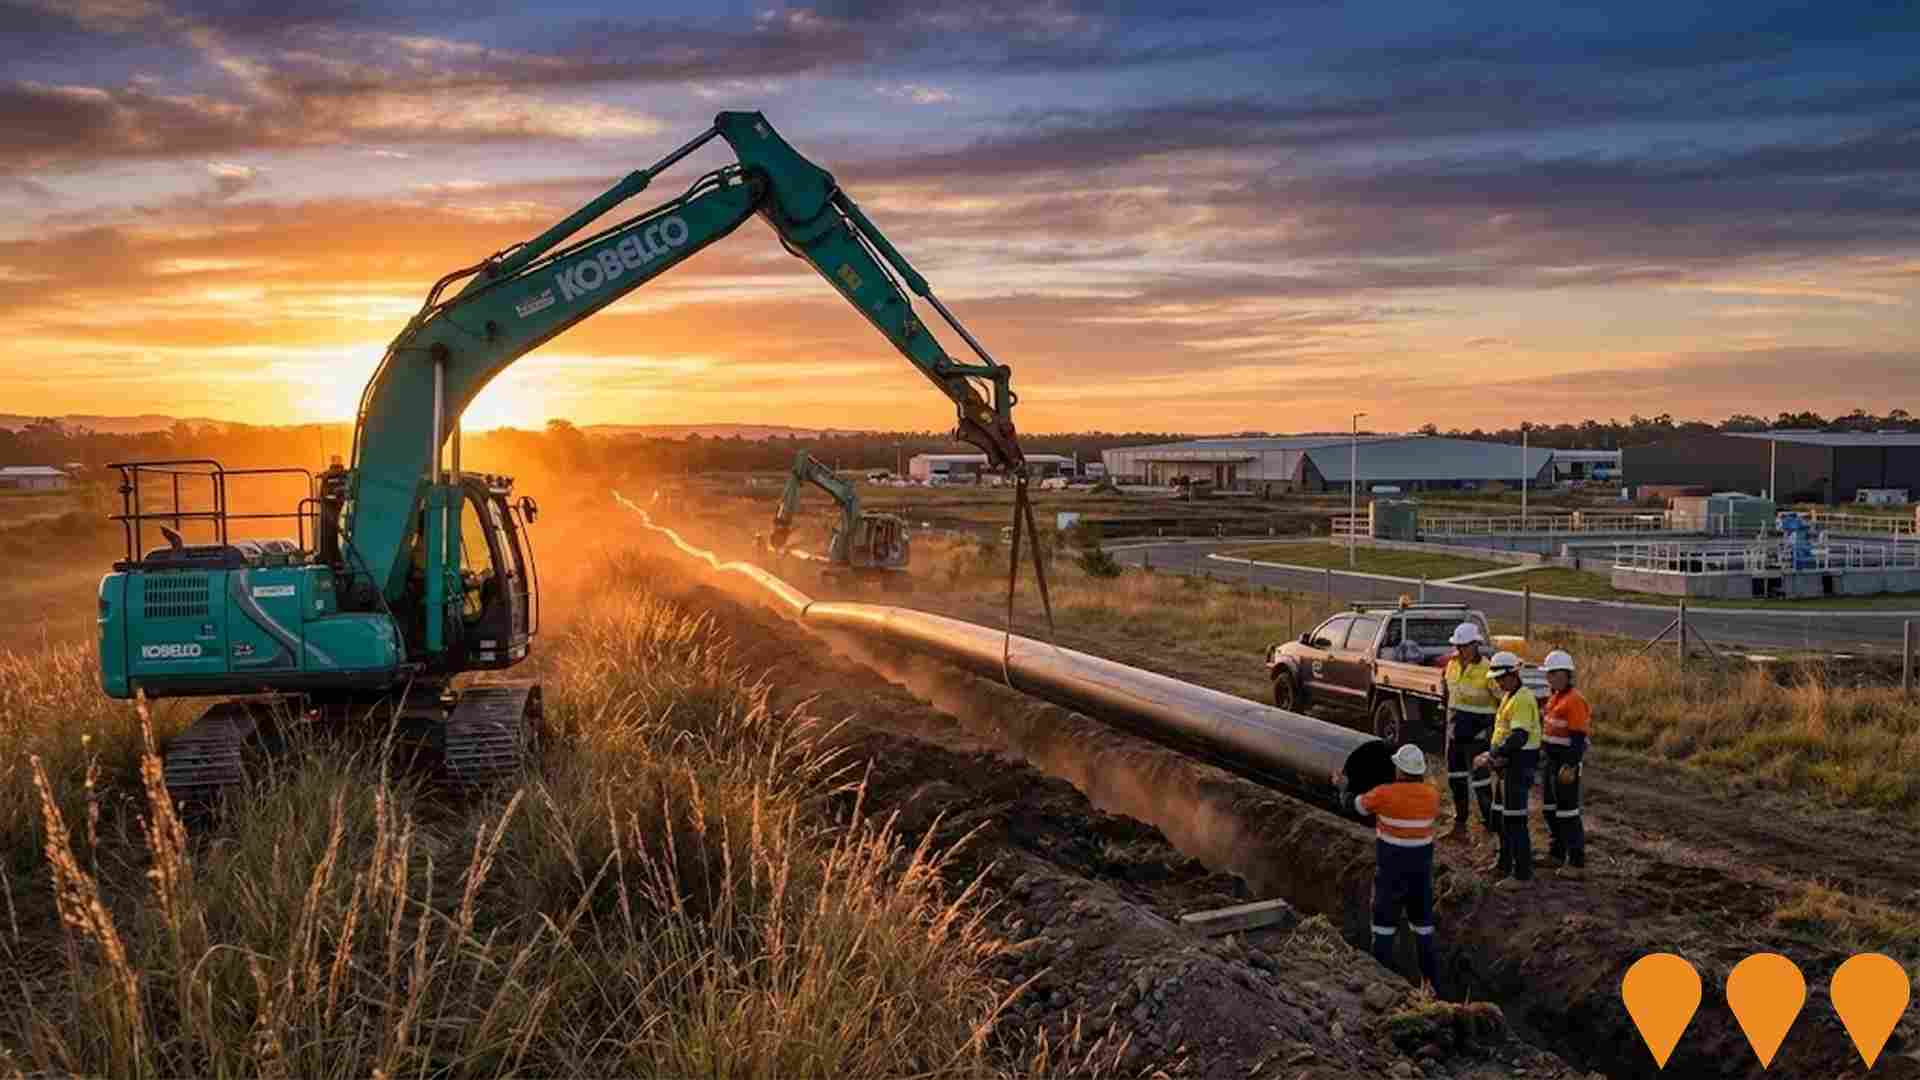
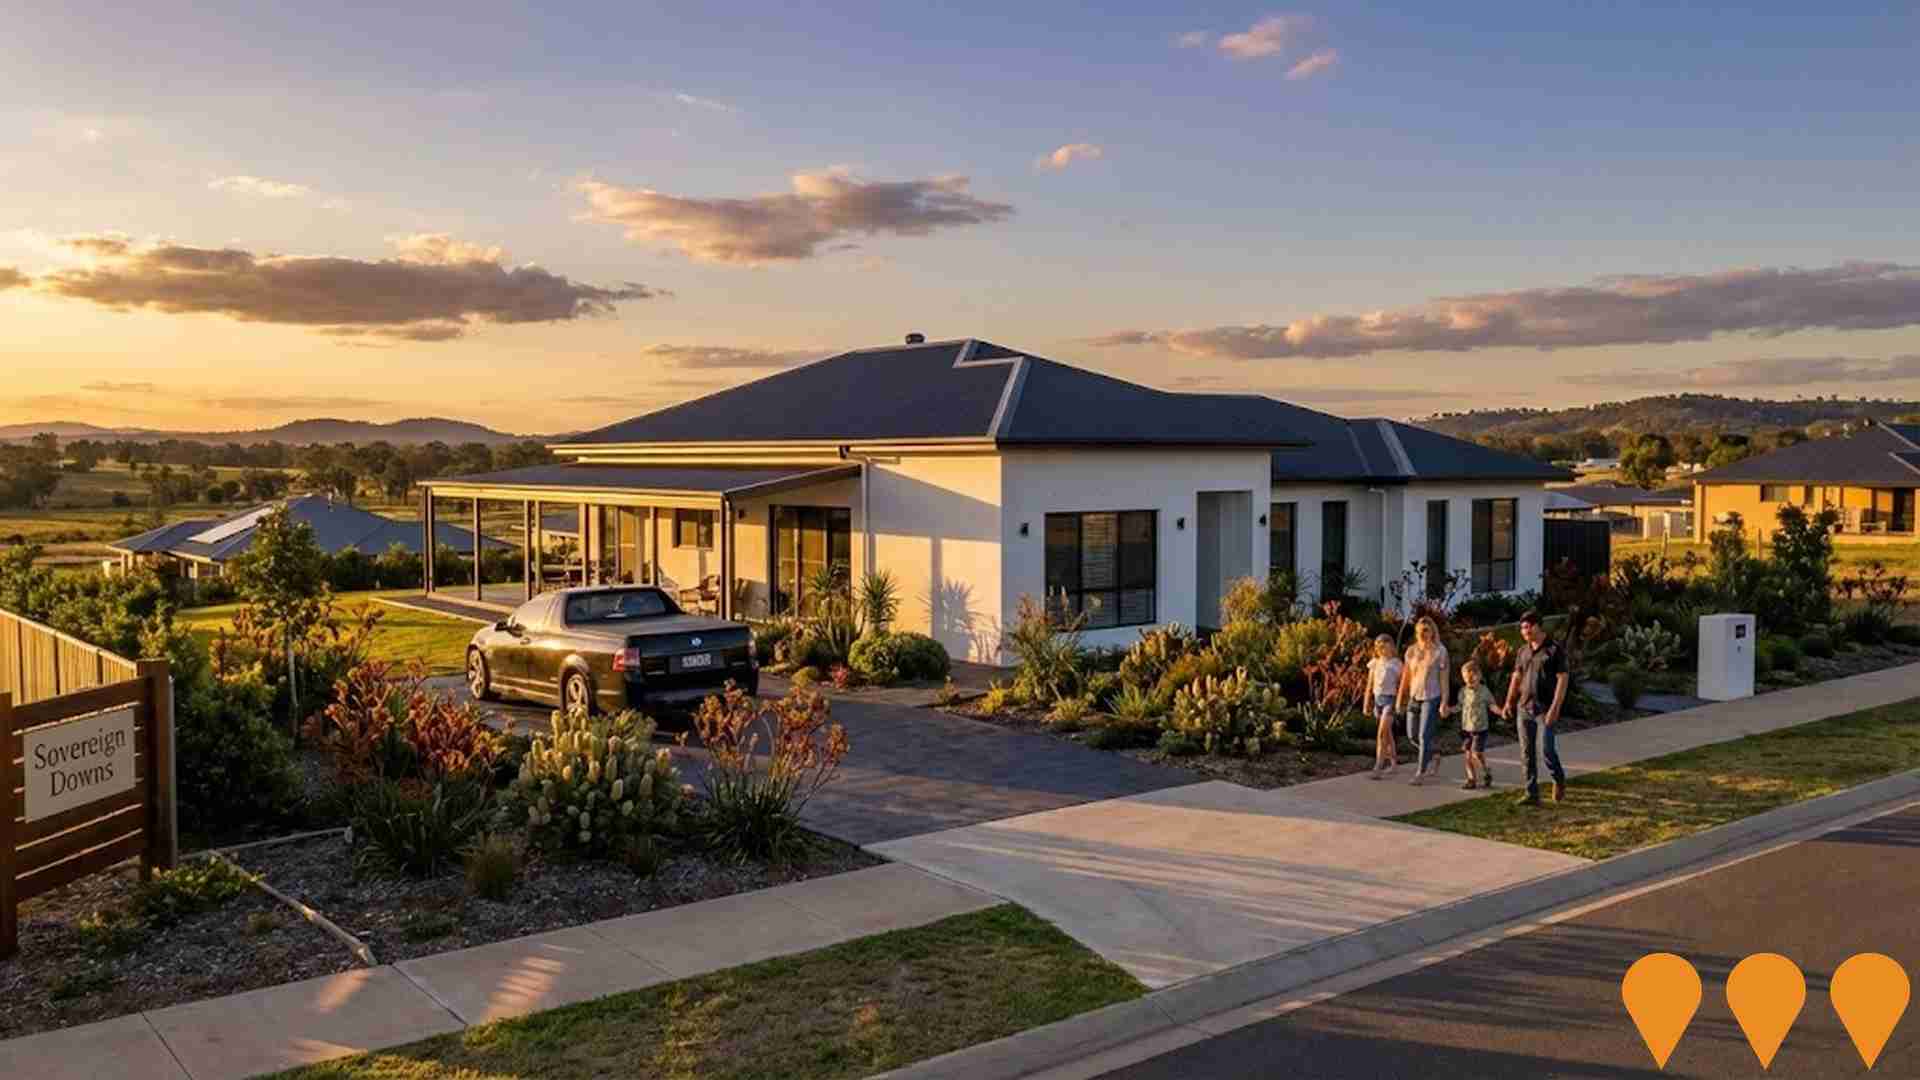
Changes to local infrastructure significantly influence an area's performance. AreaSearch has identified 11 projects likely impacting the area. Notable projects include Warwick Solar Farm, Warwick Industrial Estate Water Recycling Pipeline, Aleva Estate Residential Development, and Warwick Saleyards Redevelopment Project. The following list details those likely most relevant.
Professional plan users can use the search below to filter and access additional projects.
INFRASTRUCTURE SEARCH
 Denotes AI-based impression for illustrative purposes only, not to be taken as definitive under any circumstances. Please follow links and conduct other investigations from the project's source for actual imagery. Developers and project owners wishing us to use original imagery please Contact Us and we will do so.
Frequently Asked Questions - Infrastructure
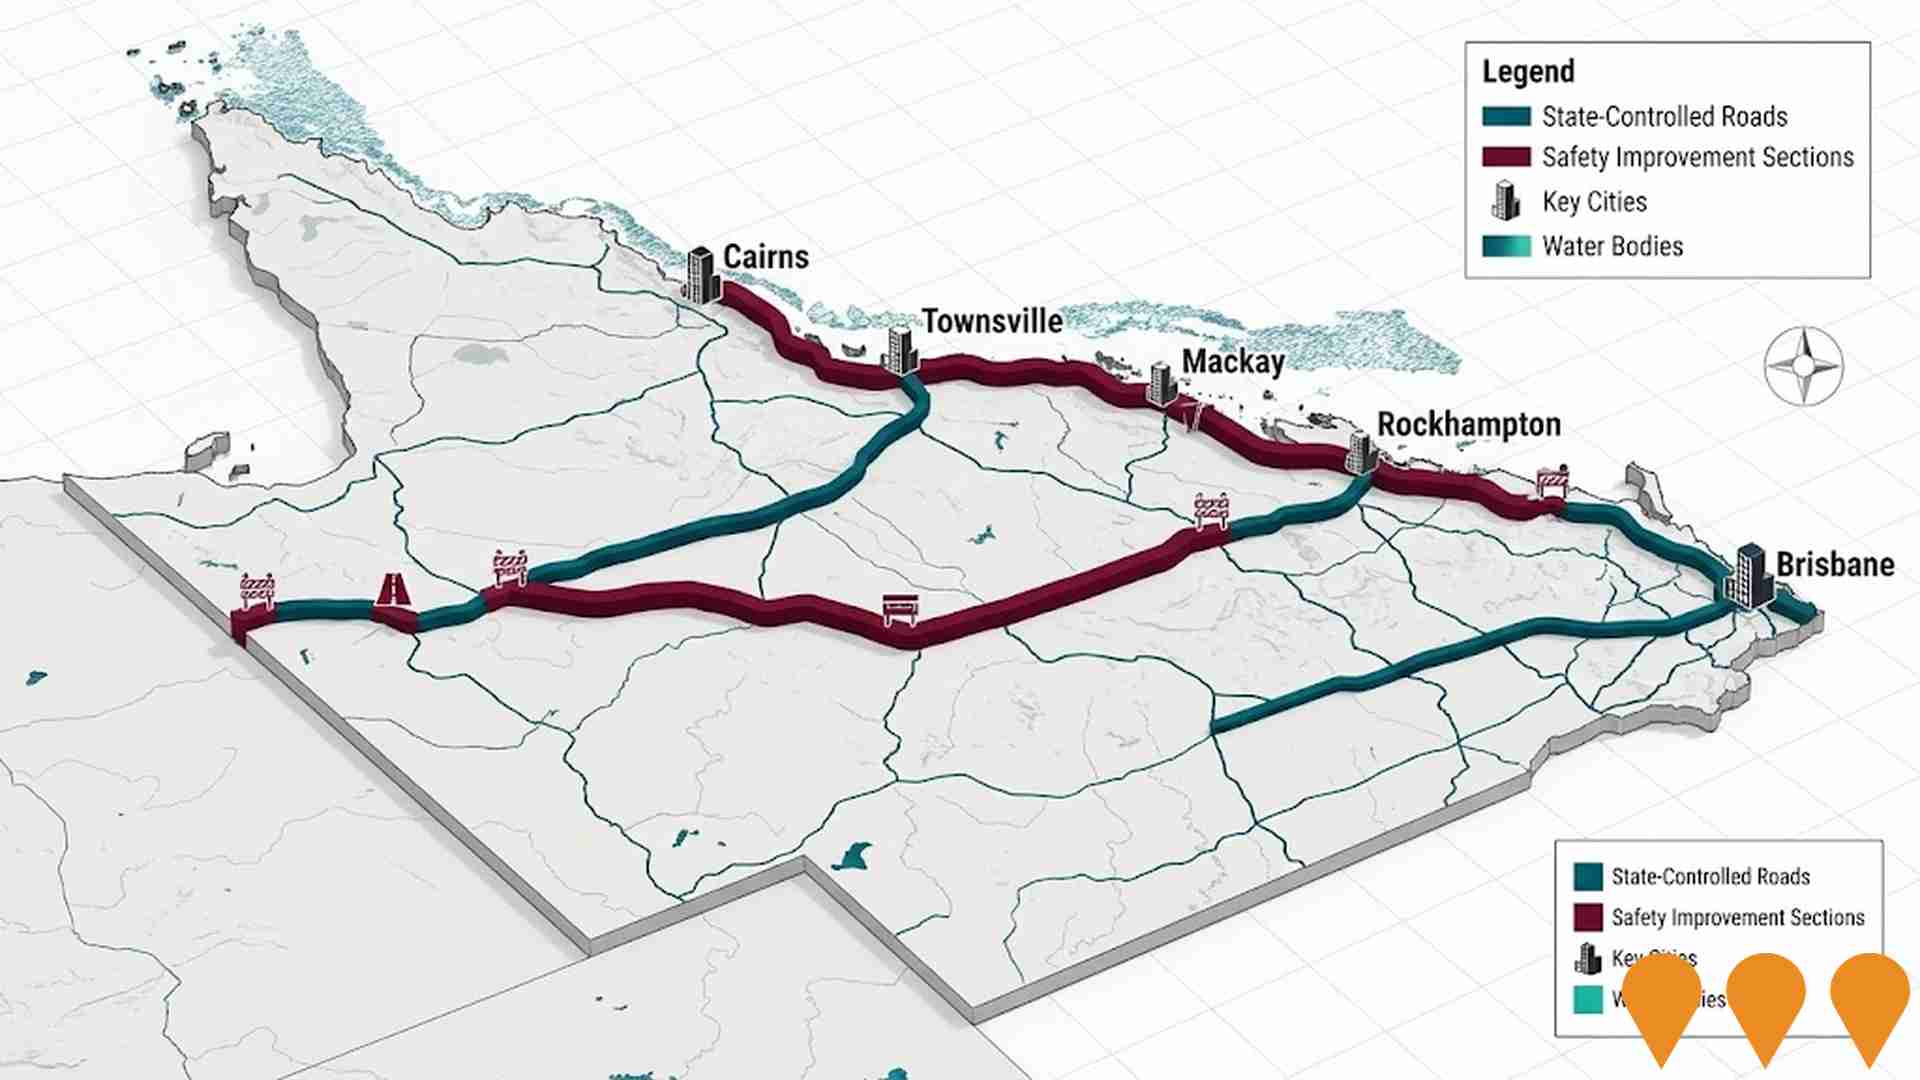
Inland Rail - Queensland Sections
The Queensland sections of Inland Rail form part of the 1,700km Melbourne-to-Brisbane freight railway. Key active segments in Queensland include Calvert to Kagaru (C2K), Helidon to Calvert (H2C), Gowrie to Kagaru (G2K overall), Border to Gowrie (B2G via NSW), and the connection at Ebenezer. The former Kagaru to Acacia Ridge and Bromelton section has been cancelled; the line now connects to the interstate network at Kagaru. Multiple sections are now under construction or in detailed design and early works as of late 2025.

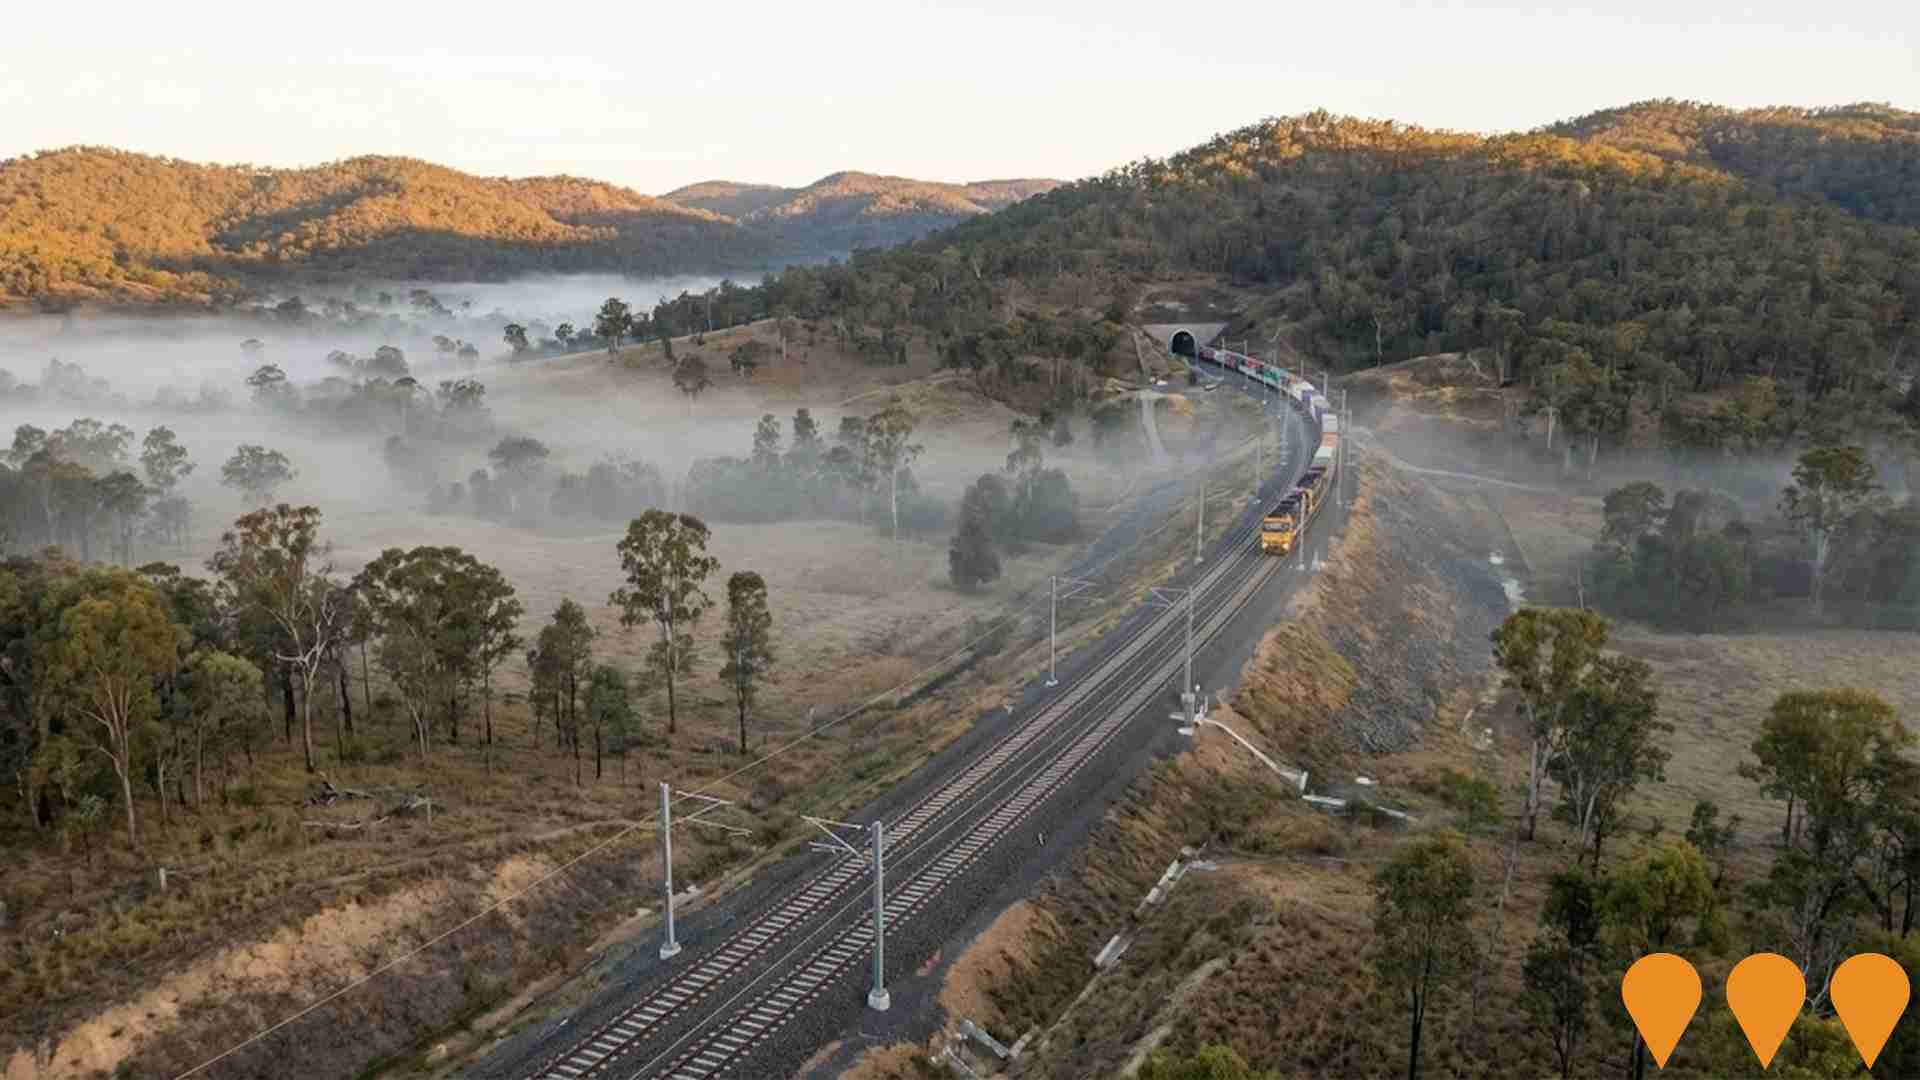
Inland Rail - Gowrie to Kagaru (G2K)
The 128km Gowrie to Kagaru (G2K) section forms the southern Queensland component of the Melbourne-to-Brisbane Inland Rail programme. It includes approximately 8km of tunnels (including the 6.2km Toowoomba Range tunnel), 51 bridges, 10 viaducts and multiple level crossing upgrades. The project is split into three subsections: Gowrie-Helidon (G2H), Helidon-Calvert (H2C) and Calvert-Kagaru (C2K). All three subsections have now received Coordinator-General approval in Queensland and bilateral EPBC approval from the Australian Government. Detailed design and early works are progressing with major construction expected to commence in 2026.
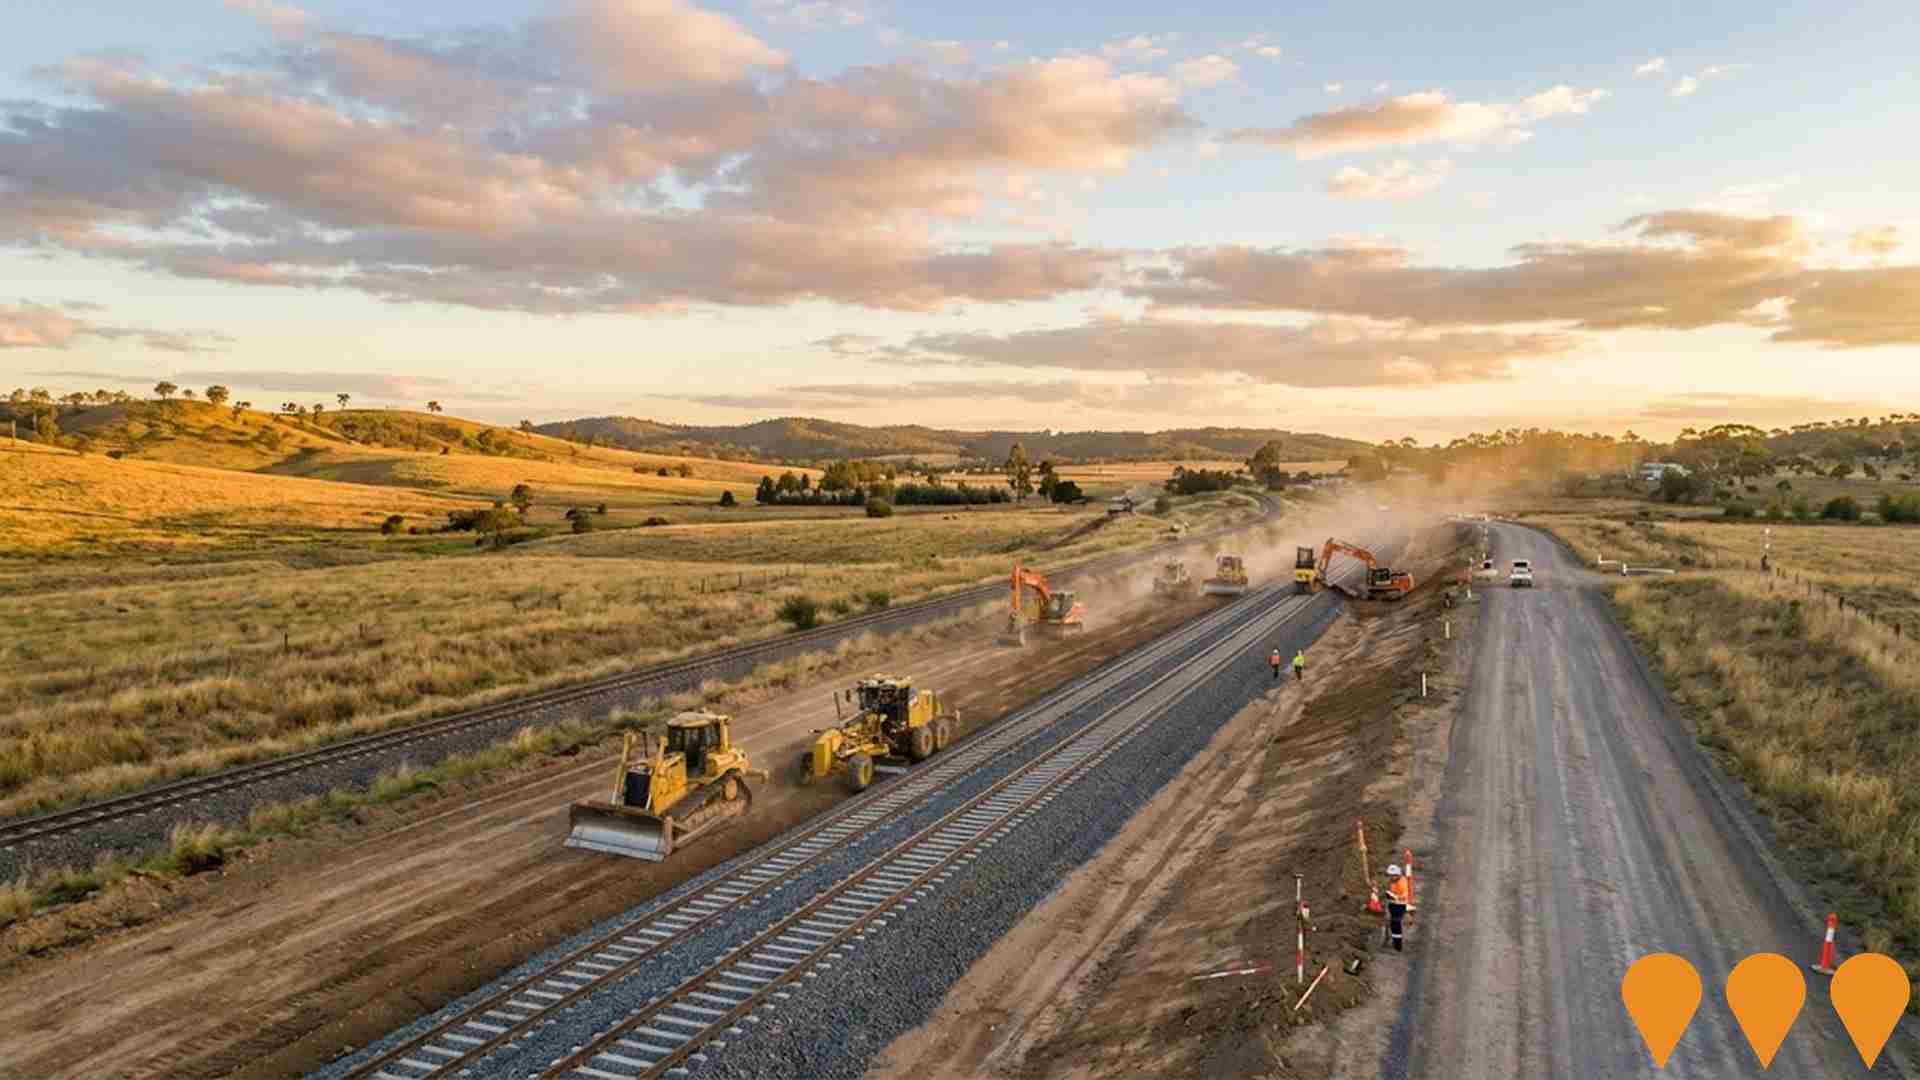
Inland Rail - NSW/Queensland Border to Gowrie (B2G)
The Border to Gowrie (B2G) section of Inland Rail is a ~217km segment (149km new dual-gauge track and 68km upgraded existing track) connecting the NSW/QLD border near Yelarbon (18km southeast of Goondiwindi) to Gowrie Junction northwest of Toowoomba. Part of the Melbourne-to-Brisbane Inland Rail freight corridor. As of November 2025, the project is in the approvals phase following closure of public consultation on the revised draft EIS (12 May - 4 August 2025). Inland Rail is preparing a response to submissions for the Queensland Coordinator-General. Subject to approvals, major construction expected to commence by 2029, taking ~4 years.
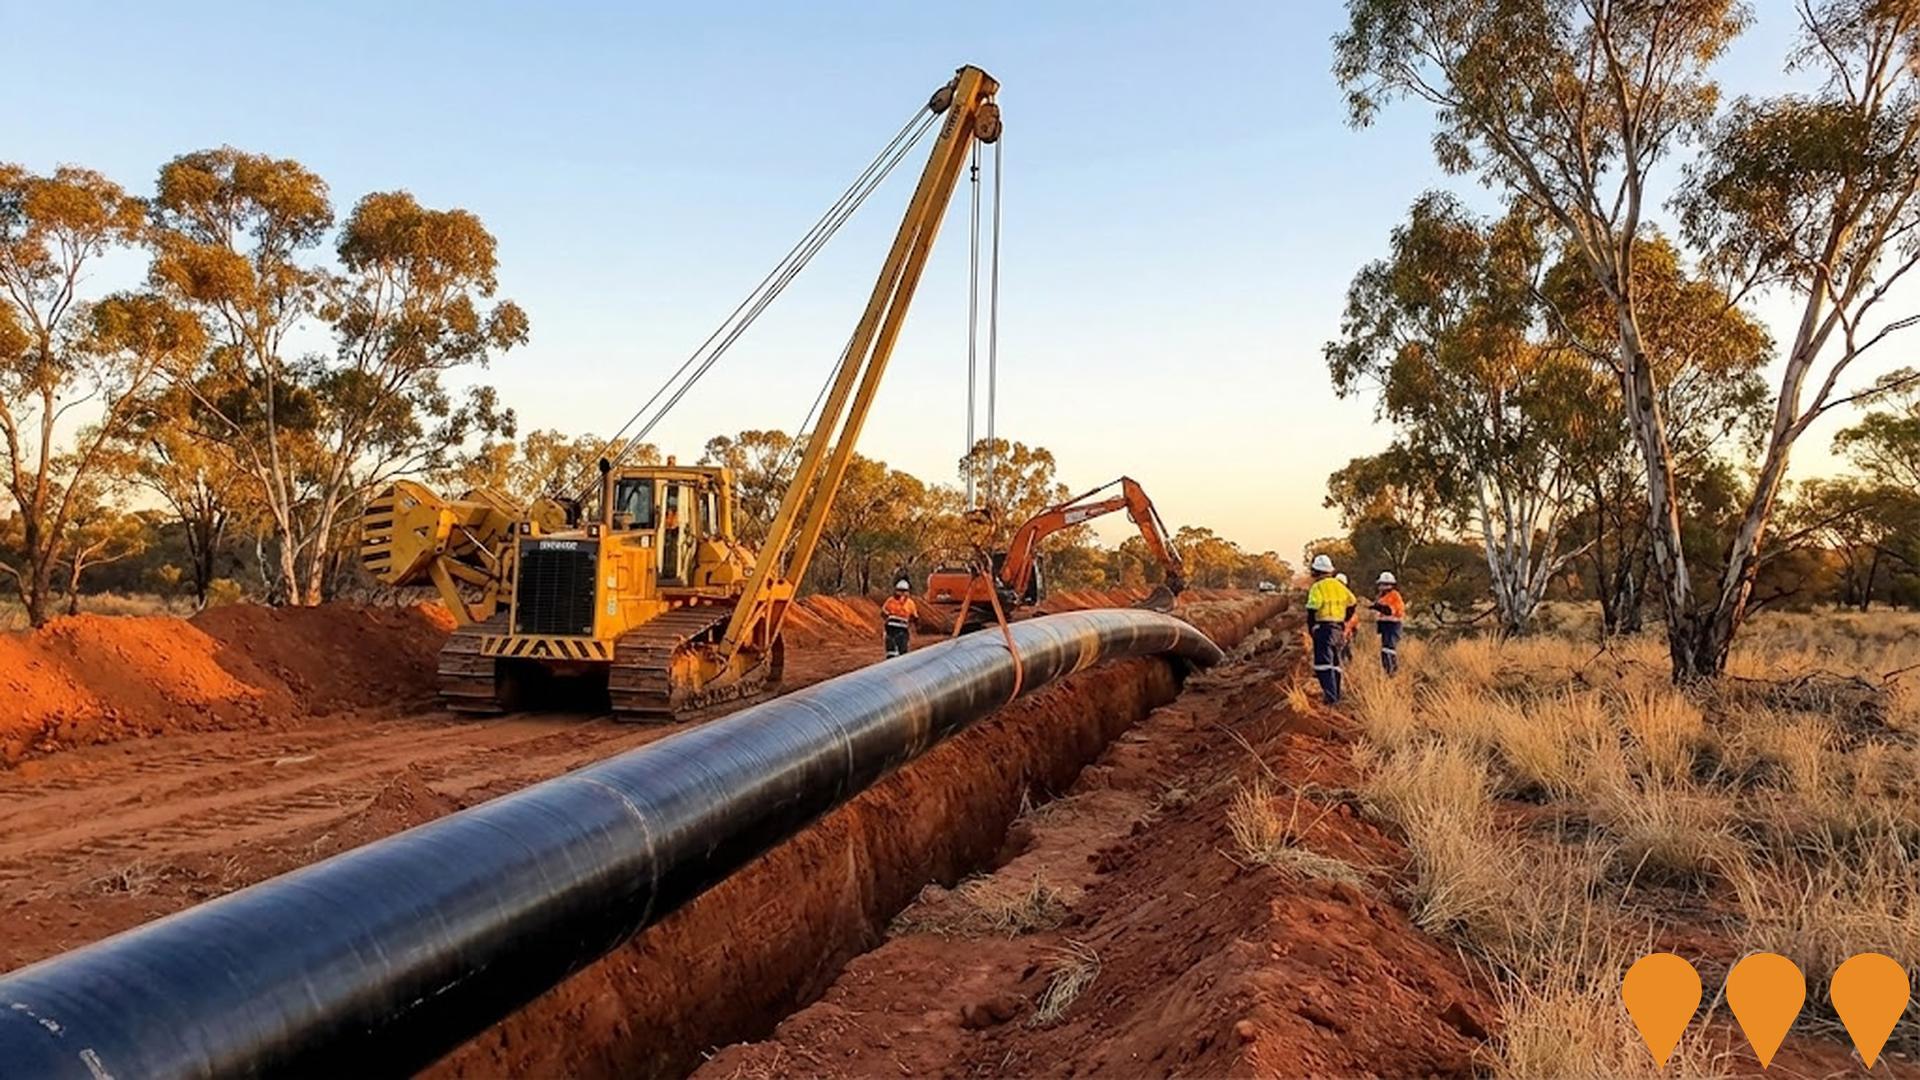
Toowoomba to Warwick Pipeline
Approximately 111 km underground raw water pipeline transferring water from Wivenhoe Dam via existing Toowoomba bulk water infrastructure (connecting near Mount Kynoch Water Treatment Plant) to a new 15 ML reservoir near Leslie Dam in Warwick. Provides permanent treated water supply to Cambooya, Greenmount, Nobby and Clifton; drought contingency supply to Warwick, Allora, Yangan and (by carting) Stanthorpe and Killarney. Procurement for head contractor underway (as of mid-2024), with construction planned to commence 2026 and completion targeted for 2027 (weather and conditions permitting). Queensland Government-funded project delivered by Seqwater.
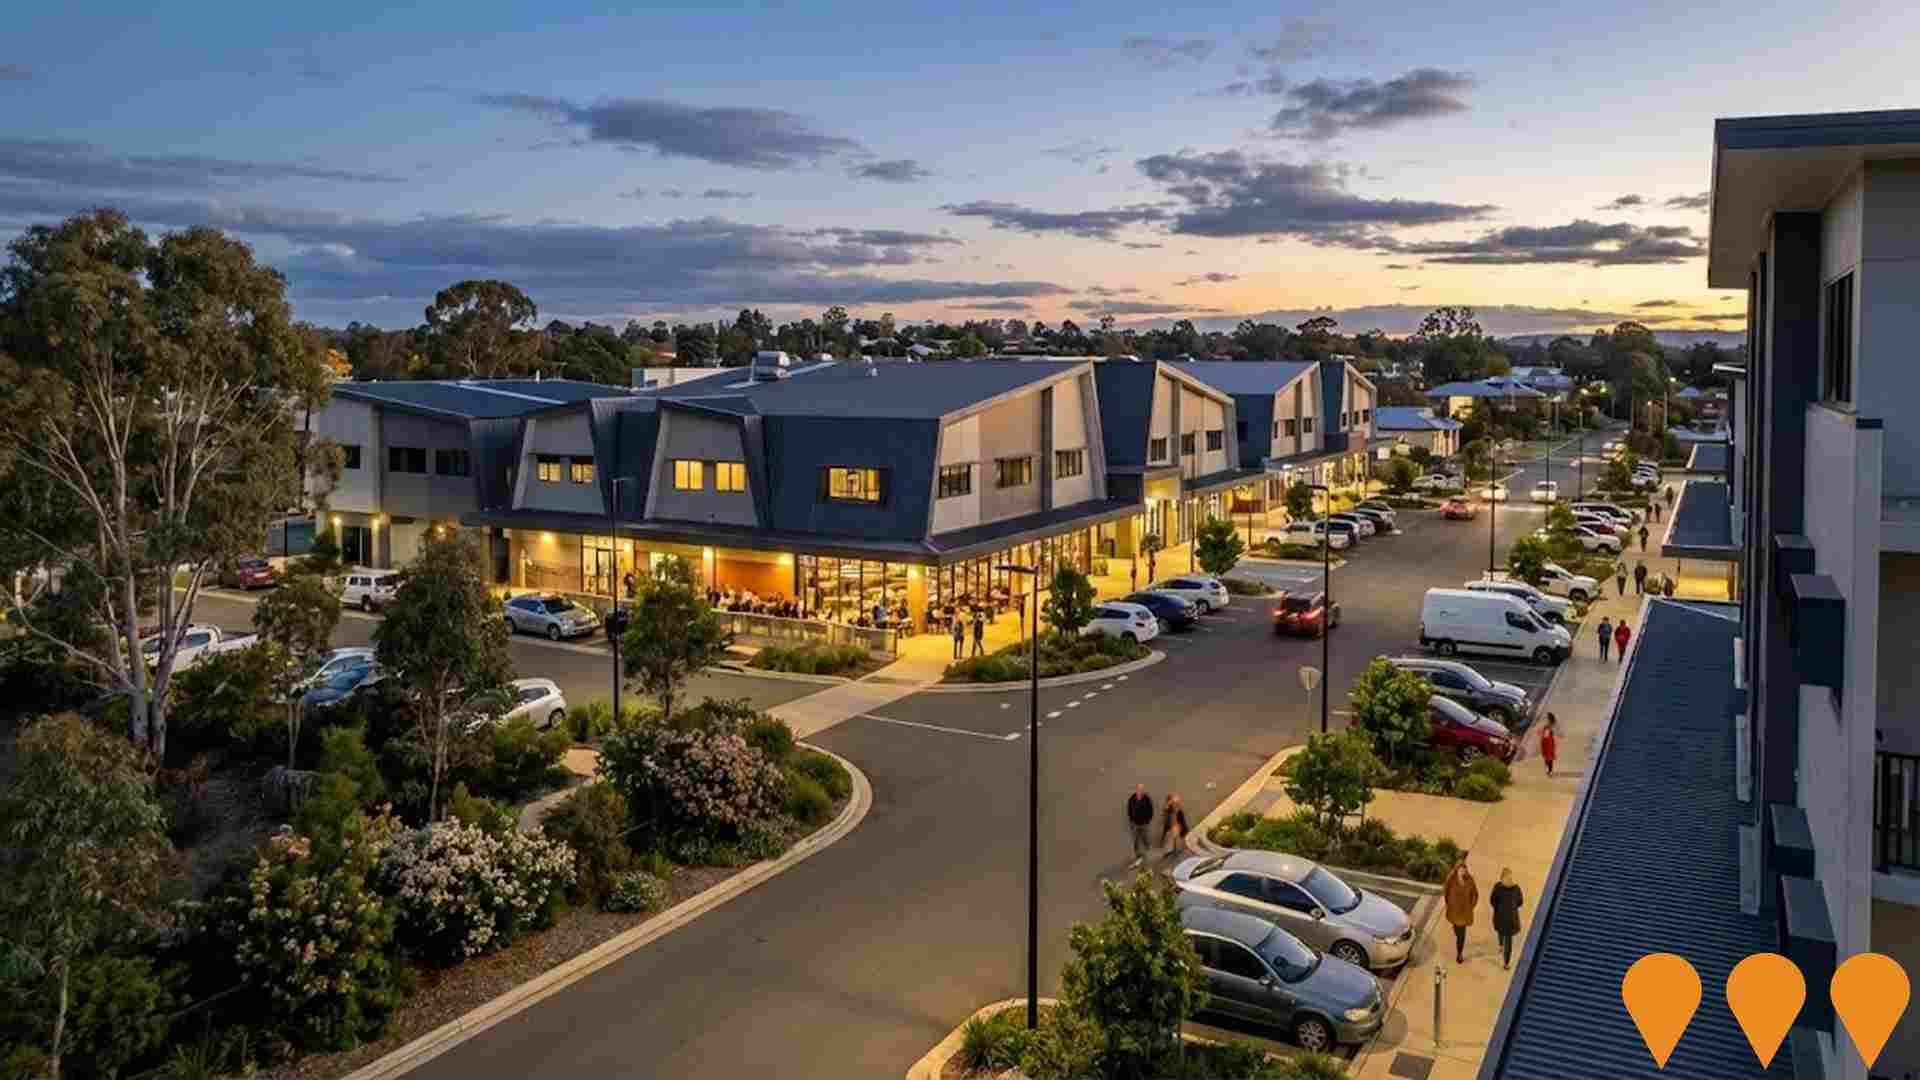
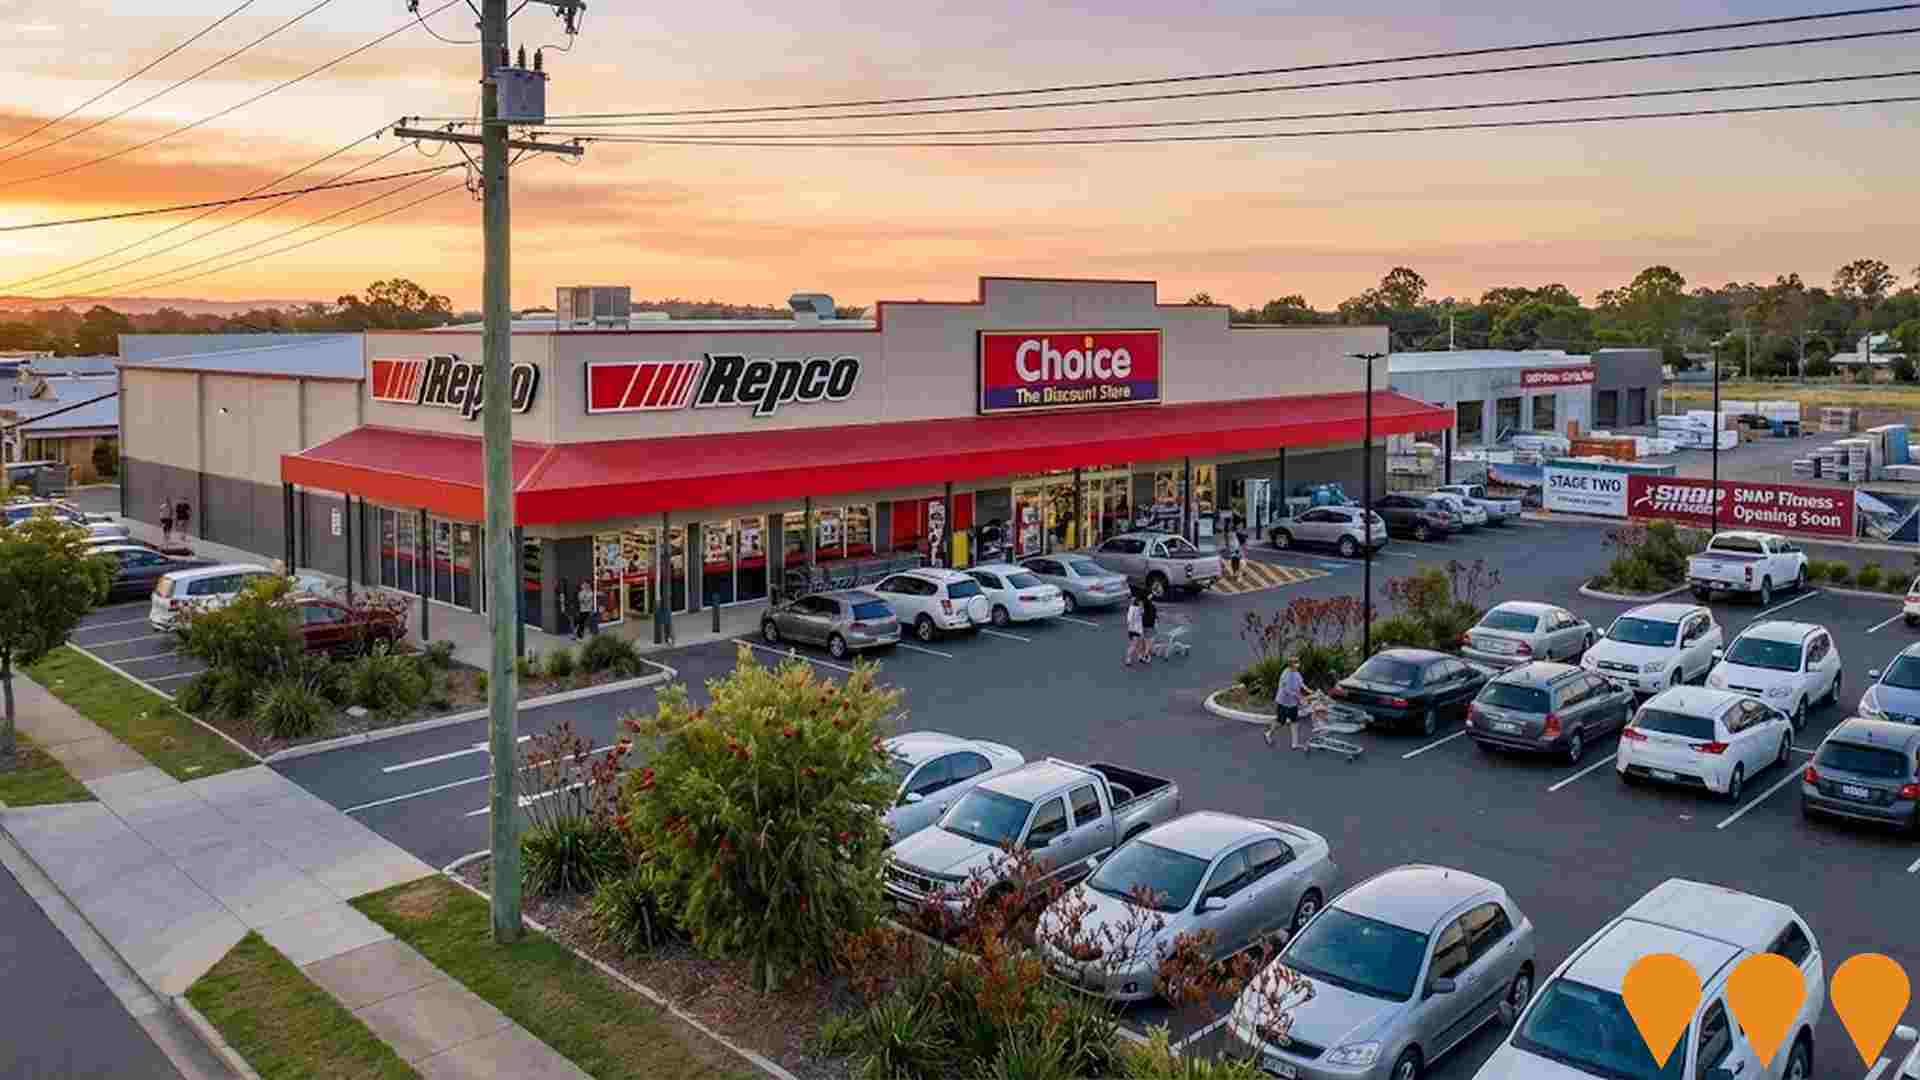
Warwick Home & Co Retail Centre
A fully refurbished 2,522sqm large format retail centre completed in March 2025, anchored by national tenants Repco and Choice The Discount Store. The centre was transformed from a former Bunnings warehouse and features 41 on-grade car spaces. Stage Two development is underway with DA approval imminent for an additional 1,895sqm retail centre with 46 car parks, pre-committed to SNAP Fitness and other national retailers. Located on Warwick's main thoroughfare with excellent visibility and access via three street frontages.
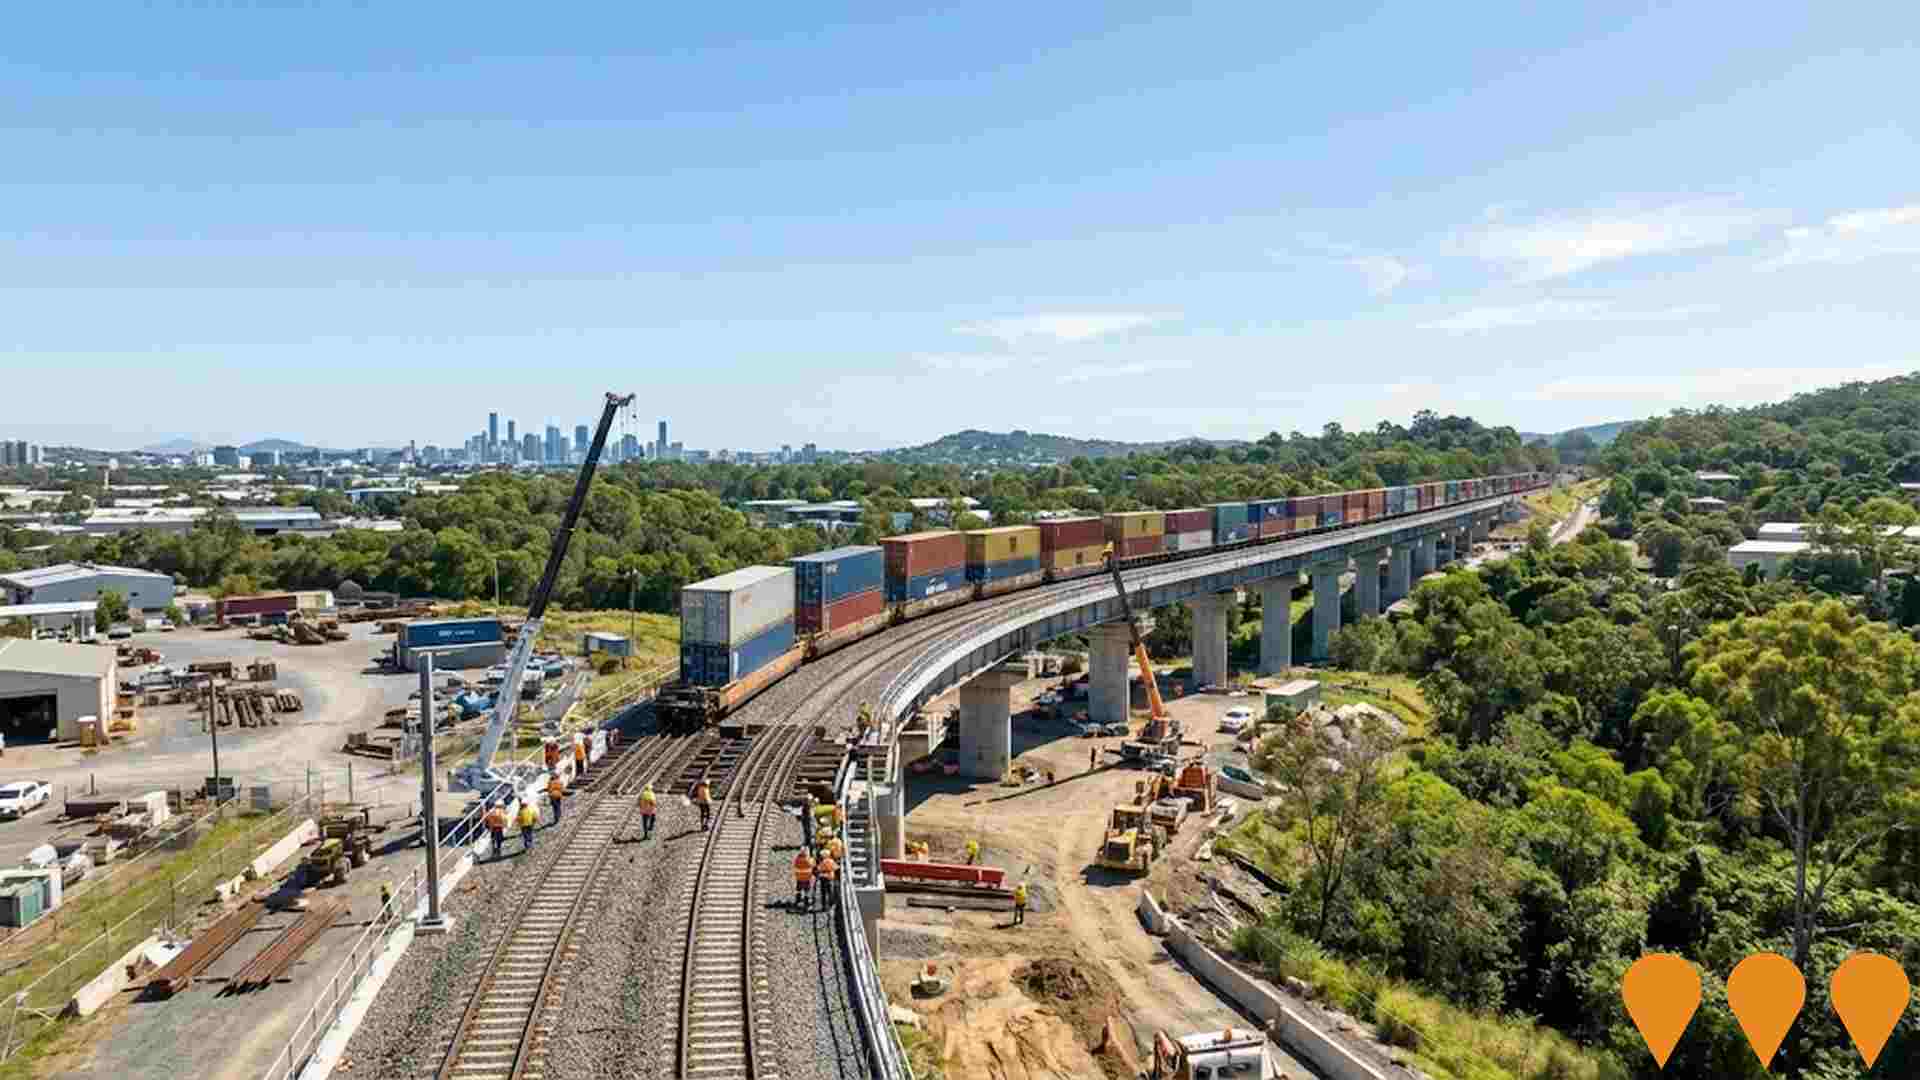
Inland Rail - Kagaru to Acacia Ridge and Bromelton (K2ARB)
The Kagaru to Acacia Ridge and Bromelton (K2ARB) section of Inland Rail involves enhancements to approximately 49km of existing dual-gauge track between Brisbane and the NSW-QLD border for double-stacked freight trains. Works include track lowering, bridge modifications, and new/extended crossing loops at locations such as Larapinta, Greenbank, and Bromelton. This section remains in planning with no construction underway as of November 2025. Note: The original dedicated K2ARB alignment was discontinued following the 2023 Independent Review of Inland Rail; enhancements to the existing corridor are under consideration but not yet committed.
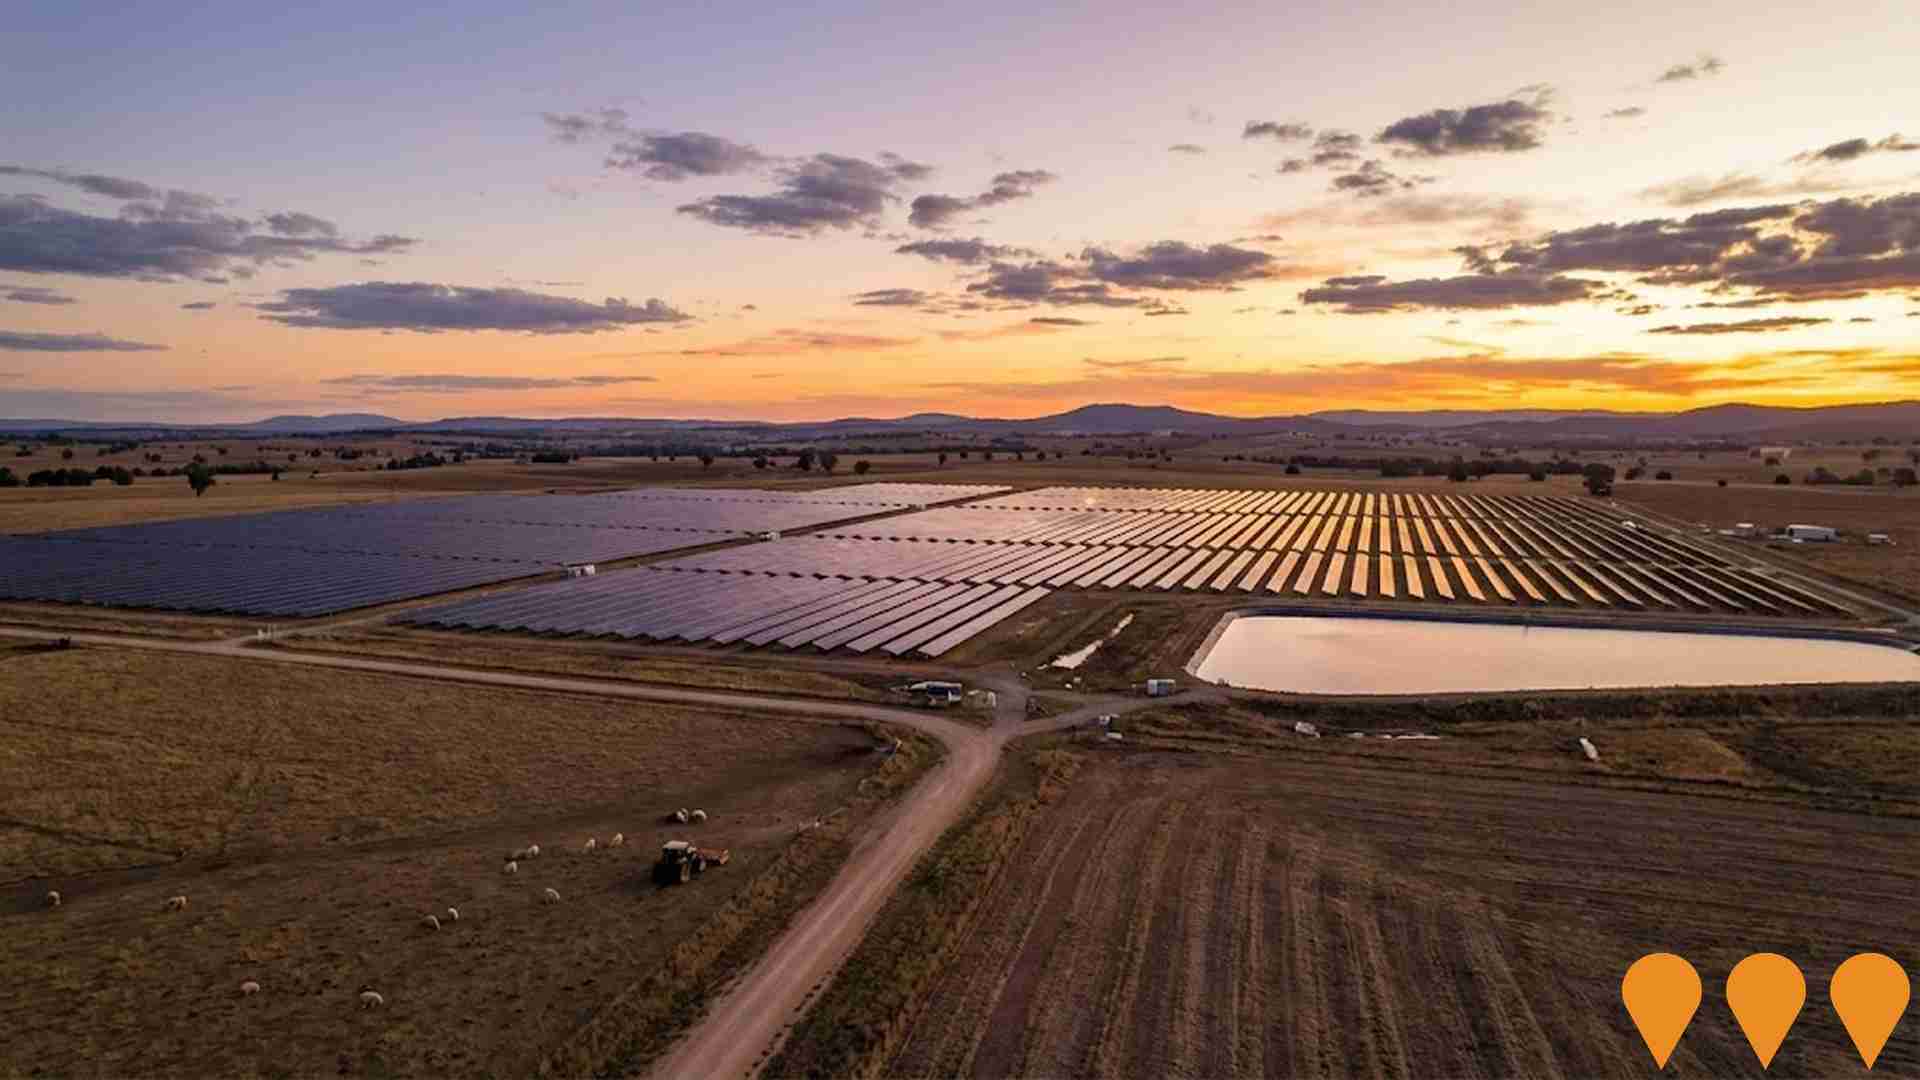
Warwick Solar Farm
Large-scale solar photovoltaic facility designed to generate clean renewable energy for the Queensland grid. The solar farm features thousands of solar panels across multiple hectares with battery storage capacity to provide consistent power supply. The project supports Queensland's renewable energy targets and provides local employment during construction and operation phases.
Warwick Saleyards Redevelopment Project
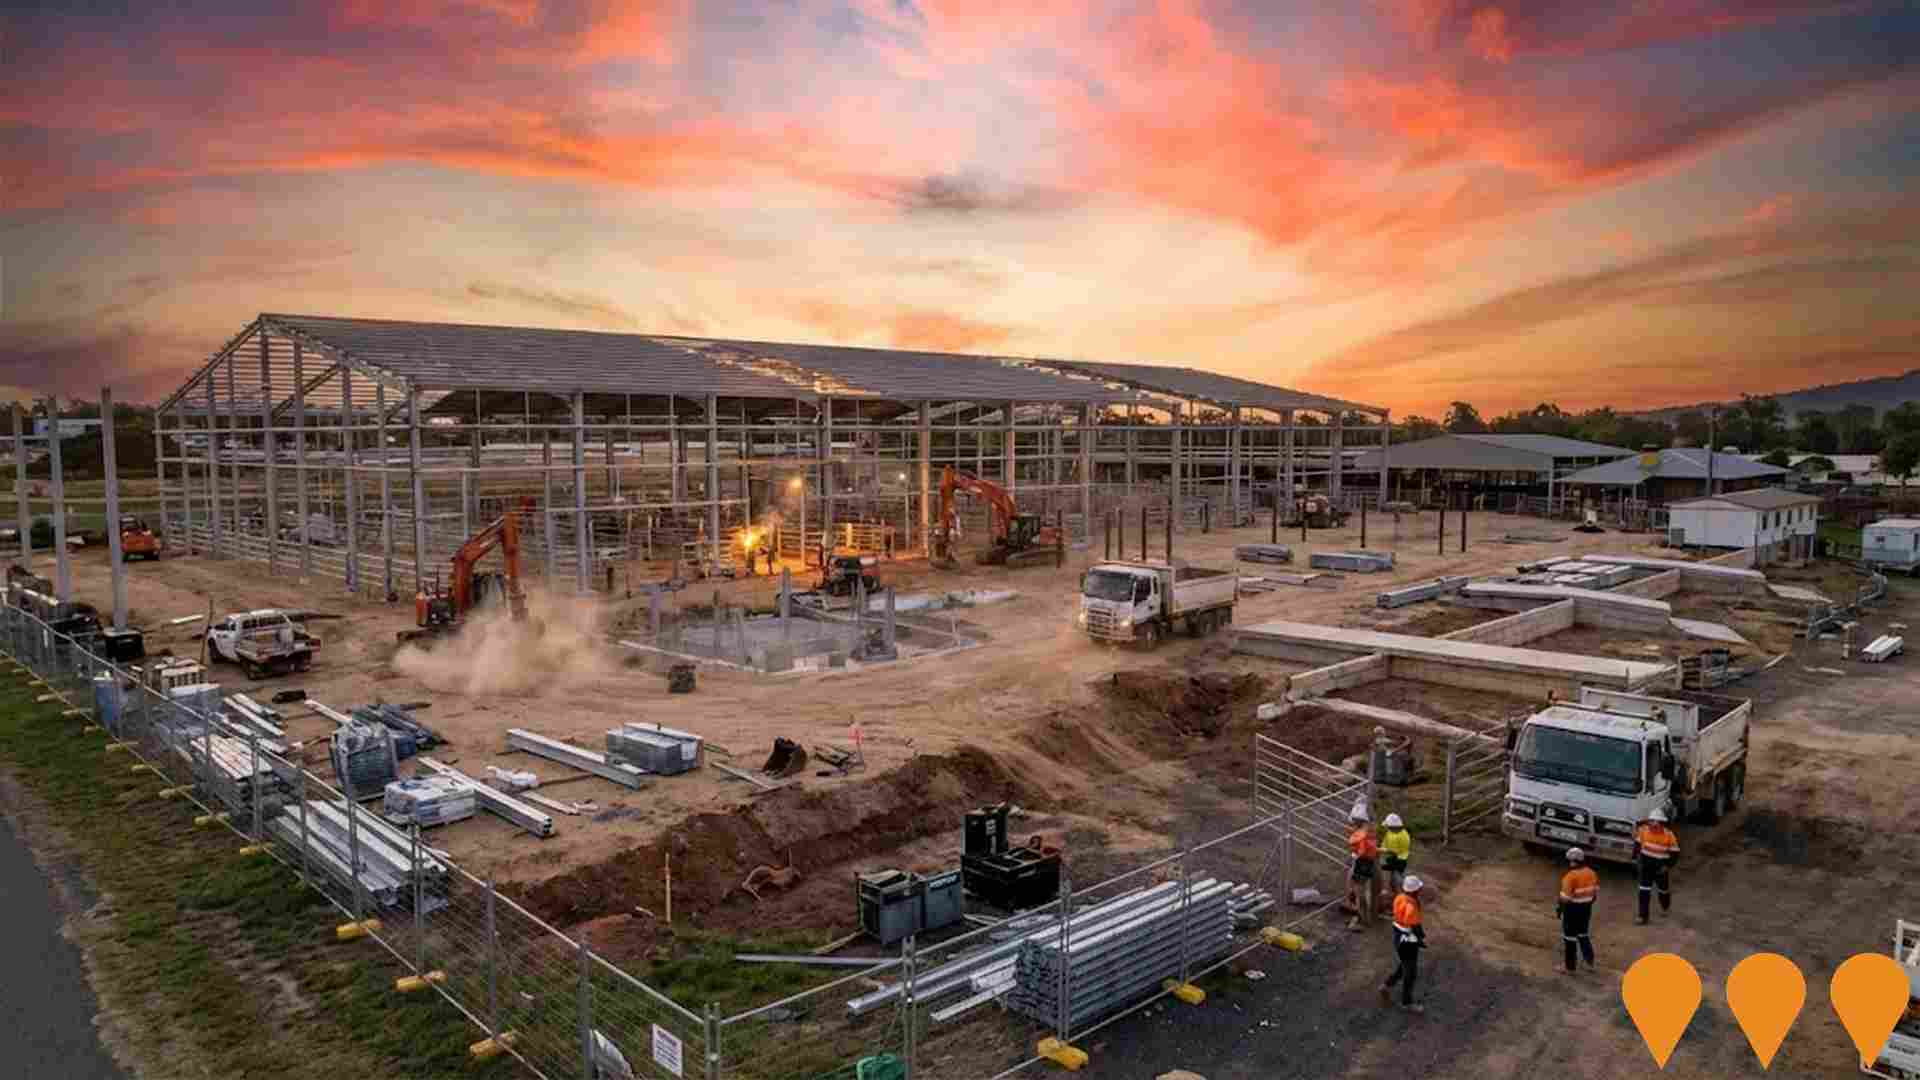
Major redevelopment of the historic Warwick Saleyards to create a modern livestock selling facility with improved animal welfare standards, enhanced facilities for buyers and sellers, and increased capacity. The project includes new covered selling areas, improved drainage, upgraded roads and enhanced biosecurity measures to maintain Warwick's position as a leading cattle selling centre.
Employment
Employment conditions in Southern Downs - East demonstrate exceptional strength compared to most Australian markets
Southern Downs - East had as of September 2025 an unemployment rate of 2.4%, with estimated employment growth of 5.6% over the past year. The area's workforce is balanced across white and blue collar jobs, with diverse sector representation.
There are 2,435 residents in work, with an unemployment rate 1.6% lower than Rest of Qld's rate of 4.1%. Workforce participation is somewhat below standard at 56.5%, compared to Rest of Qld's 59.1%. Key industries for employment among residents are agriculture, forestry & fishing, health care & social assistance, and retail trade. The area has a particular specialization in agriculture, forestry & fishing, with an employment share 4.8 times the regional level.
However, health care & social assistance is under-represented, with only 12.5% of Southern Downs - East's workforce compared to 16.1% in Rest of Qld. Employment opportunities appear limited locally, as indicated by the count of Census working population versus resident population. Over a 12-month period, employment increased by 5.6%, while labour force grew by 6.9%, causing the unemployment rate to rise by 1.2 percentage points. In comparison, Rest of Qld recorded employment growth of 1.7% and unemployment rising by 0.3 percentage points. State-level data as of 25-Nov shows Queensland's employment contracted by 0.01% (losing 1,210 jobs), with the state unemployment rate at 4.2%, broadly in line with the national rate of 4.3%. National employment forecasts from Jobs and Skills Australia, covering five and ten-year periods as of May-25, suggest potential future demand within Southern Downs - East. Applying these projections to the local employment mix suggests local employment should increase by 5.4% over five years and 11.8% over ten years.
Frequently Asked Questions - Employment
Income
The area's income levels rank in the lower 15% nationally based on AreaSearch comparative data
AreaSearch's latest postcode level ATO data for financial year ending June 30, 2022 shows that median income in Southern Downs - East SA2 is $42,759 and average income is $49,991. This contrasts with Rest of Qld where median income is $50,780 and average income is $64,844. Based on Wage Price Index growth of 13.99% from July 2022 to September 2025, estimated median income for Southern Downs - East would be approximately $48,741 and average income would be around $56,985. According to the 2021 Census, household incomes in Southern Downs - East fall between the 12th and 16th percentiles nationally. The predominant income cohort spans 28.8% of locals (1,355 people), with incomes ranging from $1,500 to $2,999. This aligns with the broader area where this cohort represents 31.7%. Housing costs are modest, with 88.4% of income retained, but total disposable income ranks at just the 21st percentile nationally.
Frequently Asked Questions - Income
Housing
Southern Downs - East is characterized by a predominantly suburban housing profile, with above-average rates of outright home ownership
Southern Downs - East's dwelling structures, as per the latest Census, were 99.0% houses and 1.0% other dwellings (semi-detached, apartments, 'other' dwellings). Non-Metro Qld had 92.3% houses and 7.6% other dwellings. Home ownership in Southern Downs - East was at 51.0%, with mortgaged dwellings at 33.8% and rented ones at 15.2%. The median monthly mortgage repayment was $1,386, higher than Non-Metro Qld's average of $1,300. Median weekly rent in Southern Downs - East was $240, compared to Non-Metro Qld's $255. Nationally, mortgage repayments were significantly lower at $1,863, and rents substantially below the national figure of $375.
Frequently Asked Questions - Housing
Household Composition
Southern Downs - East has a typical household mix, with a higher-than-average median household size
Family households constitute 74.4% of all households, including 25.4% couples with children, 39.6% couples without children, and 8.3% single parent families. Non-family households account for the remaining 25.6%, with lone person households at 23.5% and group households comprising 2.3%. The median household size is 2.4 people, larger than the Rest of Qld average of 2.3.
Frequently Asked Questions - Households
Local Schools & Education
Southern Downs - East faces educational challenges, with performance metrics placing it in the bottom quartile of areas assessed nationally
The area's university qualification rate is 17.0%, significantly lower than the Australian average of 30.4%. Bachelor degrees are most common at 12.0%, followed by postgraduate qualifications (2.9%) and graduate diplomas (2.1%). Vocational credentials are prevalent, with 39.4% of residents aged 15+ holding them, including advanced diplomas (9.1%) and certificates (30.3%). Educational participation is high at 25.7%, with 10.4% in primary education, 9.2% in secondary education, and 2.0% pursuing tertiary education.
Educational participation is notably high, with 25.7% of residents currently enrolled in formal education. This includes 10.4% in primary education, 9.2% in secondary education, and 2.0% pursuing tertiary education.
Frequently Asked Questions - Education
Schools Detail
Nearby Services & Amenities
Transport
Transport servicing is very low compared to other areas nationally based on assessment of service frequency, route connectivity and accessibility
Southern Downs - East has five operational public transport stops, all offering bus services. These stops are served by one route collectively offering ten weekly passenger trips. Transport accessibility is limited, with residents typically located 8189 meters from the nearest stop.
Service frequency averages one trip per day across all routes, equating to approximately two weekly trips per individual stop.
Frequently Asked Questions - Transport
Transport Stops Detail
Health
Health performance in Southern Downs - East is lower than average with common health conditions somewhat prevalent across both younger and older age cohorts
Southern Downs East faces significant health challenges with common health conditions prevalent across both younger and older age cohorts. The rate of private health cover is extremely low at approximately 46% of the total population (~2169 people), compared to the national average of 55.3%.
The most common medical conditions are arthritis, impacting 10.6% of residents, and asthma, affecting 7.7%. A total of 64.8% of residents declare themselves completely clear of medical ailments, compared to 62.0% across the Rest of Qld. The area has 28.5% of residents aged 65 and over (1339 people), higher than the 27.0% in the Rest of Qld. Health outcomes among seniors are above average, performing better than the general population in health metrics.
Frequently Asked Questions - Health
Cultural Diversity
The latest Census data sees Southern Downs - East placing among the least culturally diverse areas in the country when compared across a range of language and cultural background related metrics
Southern Downs-East had a cultural diversity below average, with 90.7% being citizens, 91.6% born in Australia, and 97.7% speaking English only at home. Christianity was the main religion, comprising 68.1%, compared to 63.9% across Rest of Qld. The top three ancestry groups were Australian (31.6%), English (31.4%), and Irish (11.6%).
Notable divergences included Scottish at 9.6% (vs regional 8.5%), German at 5.5% (vs 5.6%), and Australian Aboriginal at 2.4% (vs 3.6%).
Frequently Asked Questions - Diversity
Age
Southern Downs - East ranks among the oldest 10% of areas nationwide
Southern Downs - East has a median age of 51, which is higher than Rest of Qld's figure of 41 and Australia's national average of 38 years. Compared to Rest of Qld's average, the 65-74 cohort is notably over-represented in Southern Downs - East at 17.4%, while the 25-34 age group is under-represented at 7.2%. This concentration of the 65-74 age group is significantly higher than the national average of 9.4%. Between 2021 and present, the 75 to 84 age group has grown from 7.2% to 8.5%, while the 55 to 64 cohort increased from 17.6% to 18.8%. Conversely, the 5 to 14 age group has declined from 11.4% to 9.8% and the 45 to 54 age group dropped from 14.3% to 13.1%. Looking ahead to 2041, demographic projections indicate significant shifts in Southern Downs - East's age structure. The 85+ age cohort is projected to increase markedly by 85 people, from 122 to 208. Senior residents aged 65 and above will drive 67% of population growth, underscoring trends towards demographic aging. In contrast, population declines are projected for the 55 to 64 and 35 to 44 age cohorts.
