Chart Color Schemes
This analysis uses ABS Statistical Areas Level 2 (SA2) boundaries, which can materially differ from Suburbs and Localities (SAL) even when sharing similar names.
SA2 boundaries are defined by the Australian Bureau of Statistics and are designed to represent communities for statistical reporting (e.g., census and ERP).
Suburbs and Localities (SAL) represent commonly-used suburb/locality names (postal-style areas) and may use different geographic boundaries. For comprehensive analysis, consider reviewing both boundary types if available.
est. as @ -- *
ABS ERP | -- people | --
2021 Census | -- people
Sales Activity
Curious about local property values? Filter the chart to assess the volume and appreciation (including resales) trends and regional comparisons, or scroll to the map below view this information at an individual property level.
Find a Recent Sale
Sales Detail
Population
Kyogle is positioned among the lower quartile of areas assessed nationally for population growth based on AreaSearch's assessment of recent, and medium term trends
Kyogle's population is around 7,842 as of November 2025. This reflects an increase of 231 people (3.0%) since the 2021 Census, which reported a population of 7,611 people. The change is inferred from the estimated resident population of 7,711 from the ABS as of June 2024 and an additional 37 validated new addresses since the Census date. This level of population equates to a density ratio of 4.0 persons per square kilometer. Kyogle's growth since the 2021 census exceeded that of the SA3 area (0.5%), marking it as a growth leader in the region. Overseas migration contributed approximately 50.6% of overall population gains during recent periods.
AreaSearch is adopting ABS/Geoscience Australia projections for each SA2 area, released in 2024 with 2022 as the base year. For areas not covered by this data, AreaSearch utilises NSW State Government's SA2 level projections, released in 2022 with 2021 as the base year. Growth rates by age group from these aggregations are applied to all areas for years 2032 to 2041. Projections indicate a decline in overall population over this period, with Kyogle's population expected to reduce by 809 persons by 2041. However, growth across specific age cohorts is anticipated, led by the 85 and over age group, projected to expand by 143 people.
Frequently Asked Questions - Population
Development
Residential development activity is lower than average in Kyogle according to AreaSearch's national comparison of local real estate markets
Kyogle averaged approximately 17 new dwelling approvals annually over the past five financial years from FY21 to FY25, totalling 86 homes. In FY26, 10 dwellings have been approved so far. Each year, an average of two new residents per dwelling has been recorded since FY21, indicating robust demand that supports property values.
The average construction cost value for new dwellings over this period was $339,000. This financial year, $7.5 million in commercial development approvals have been recorded, suggesting limited focus on commercial development. Compared to the Rest of NSW, Kyogle records about three-quarters the building activity per person and ranks among the 44th percentile nationally, implying more limited choices for buyers and supporting demand for existing properties. However, building activity has accelerated in recent years.
Recent construction consists of 86.0% detached houses and 14.0% townhouses or apartments, maintaining Kyogle's low-density nature with a focus on detached housing that attracts space-seeking buyers. The estimated population per dwelling approval is 374 people, reflecting the area's quiet, low-activity development environment. Given stable or declining population forecasts, Kyogle may experience less housing pressure in the future, creating favourable conditions for buyers.
Frequently Asked Questions - Development
Infrastructure
Kyogle has moderate levels of nearby infrastructure activity, ranking in the 43rdth percentile nationally
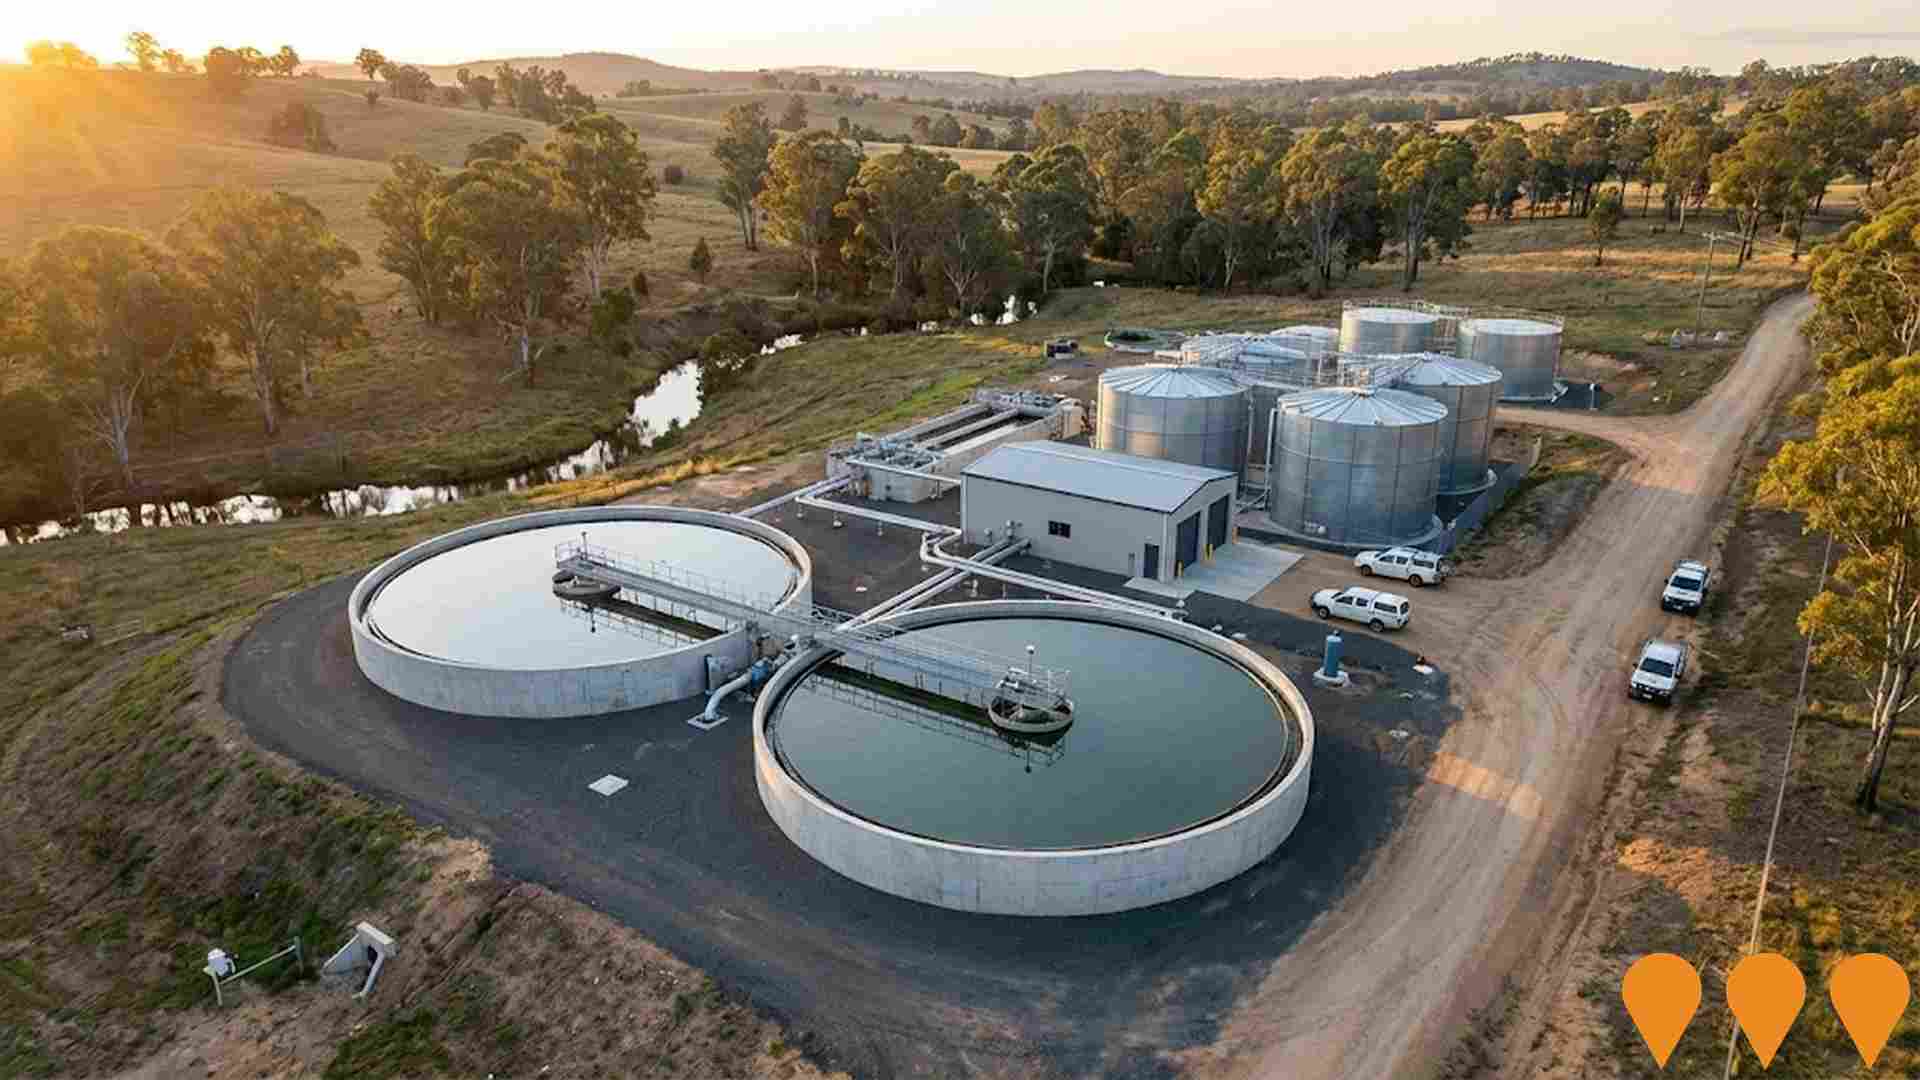
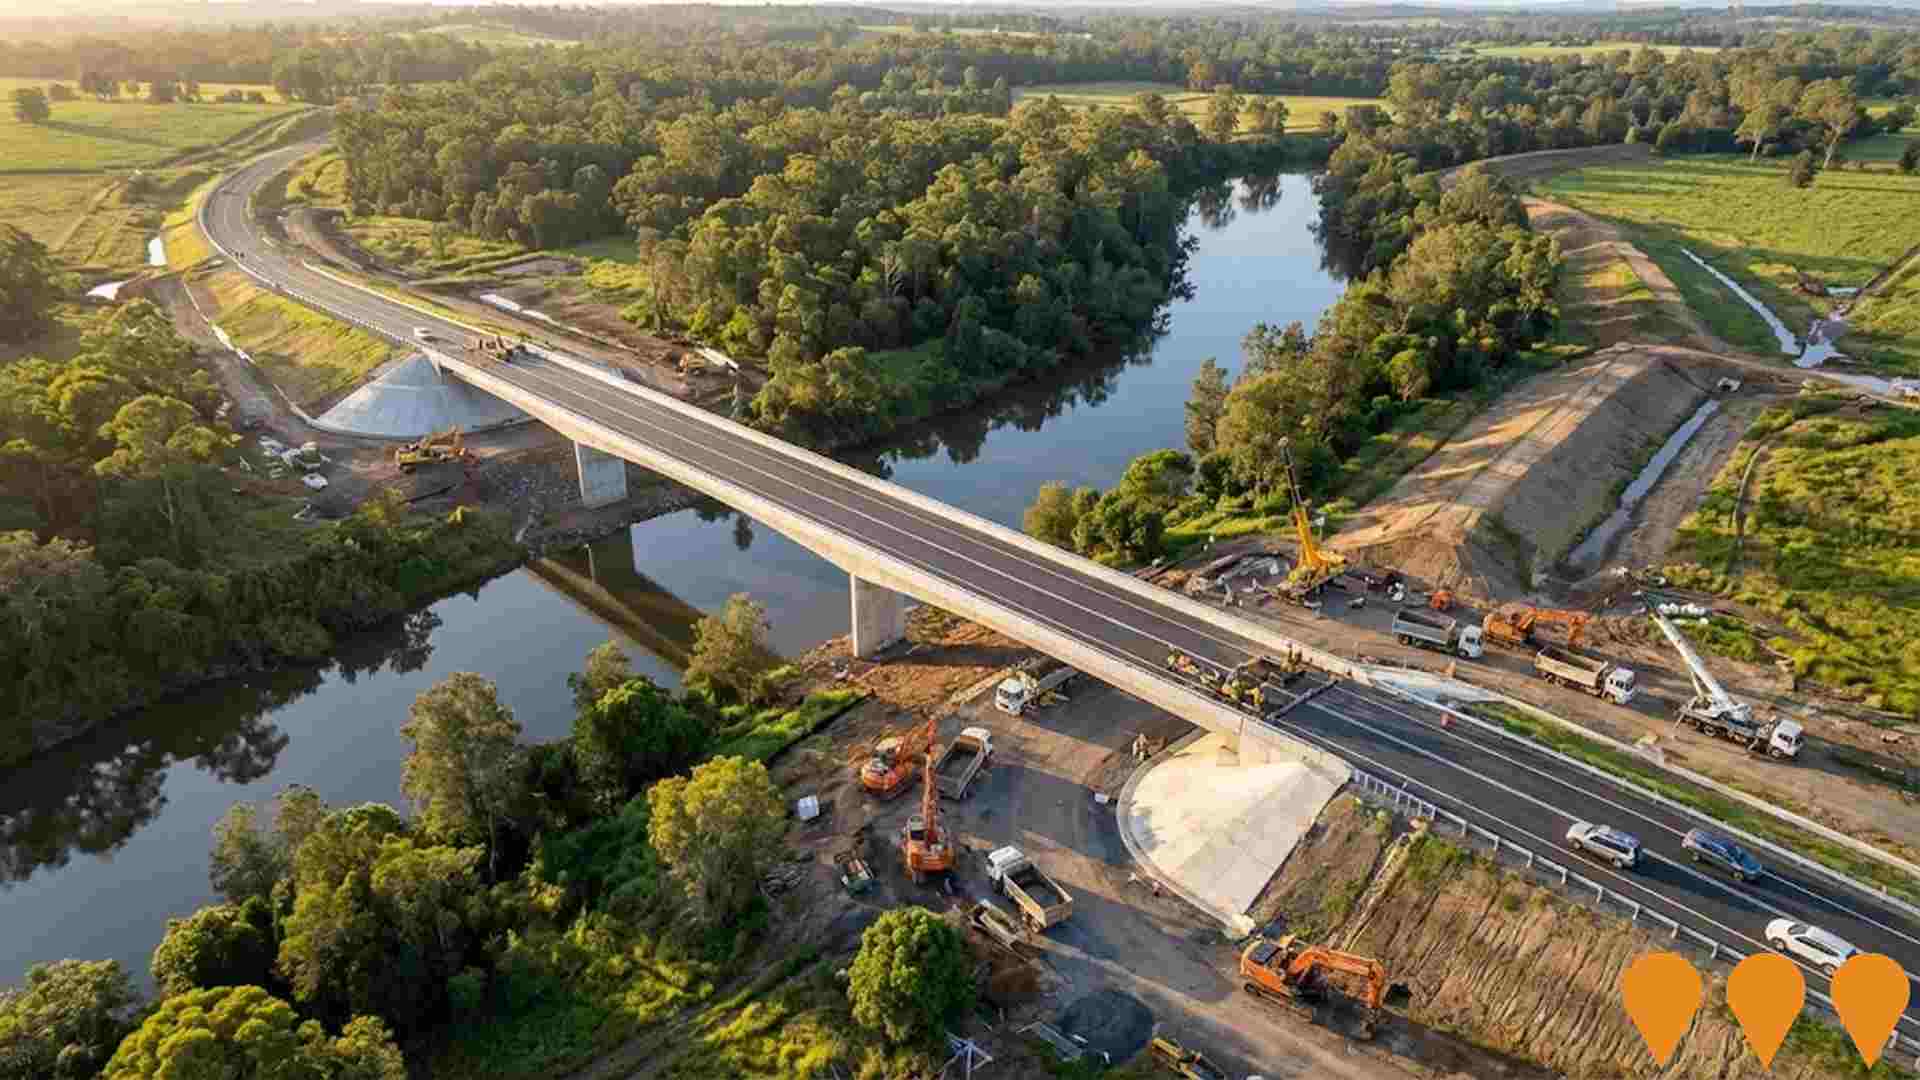
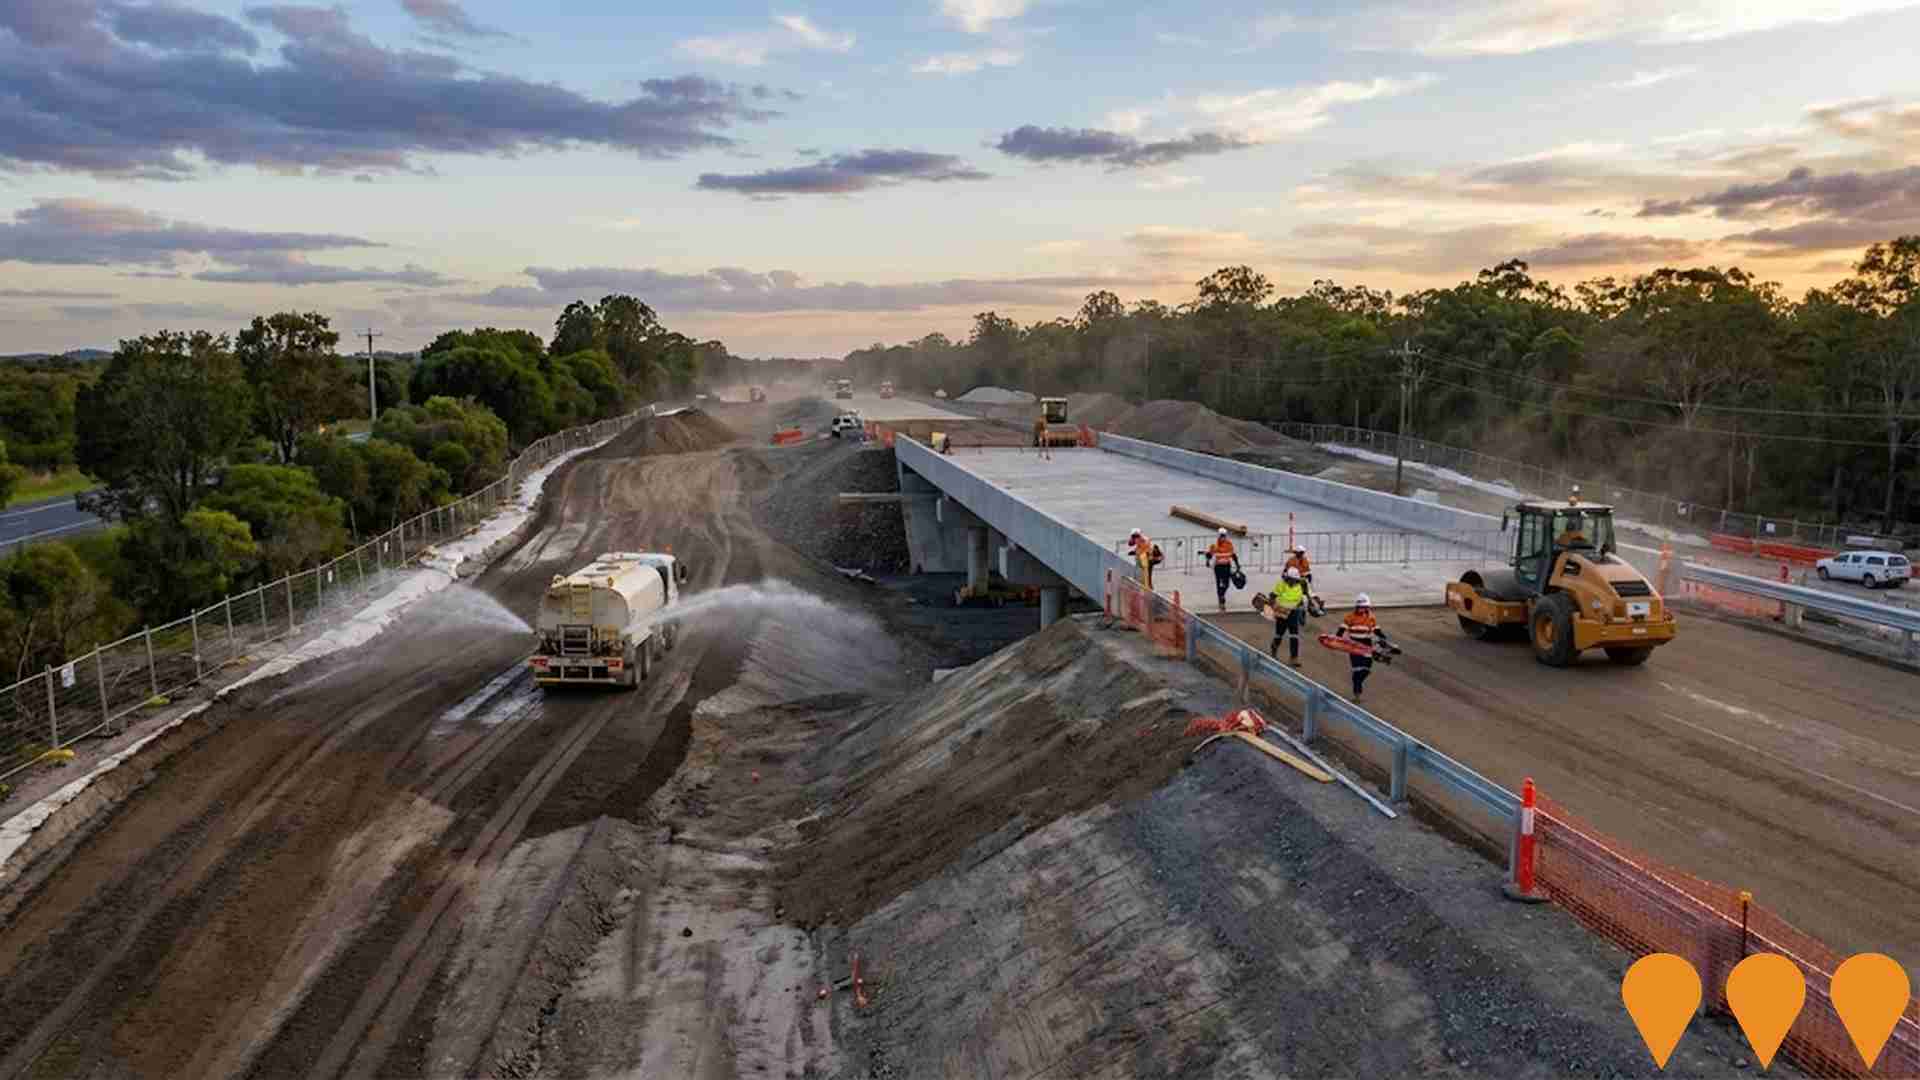
Five projects identified by AreaSearch are expected to impact the area significantly: Summerville Solar Farm, Lismore Flood Restoration - Roads and Bridges (commencing 2021), Lismore Flood Recovery and Resilience Program (commenced July 2020), and Urbenville Water Treatment Plant Upgrade (completed June 2021).
Professional plan users can use the search below to filter and access additional projects.
INFRASTRUCTURE SEARCH
 Denotes AI-based impression for illustrative purposes only, not to be taken as definitive under any circumstances. Please follow links and conduct other investigations from the project's source for actual imagery. Developers and project owners wishing us to use original imagery please Contact Us and we will do so.
Frequently Asked Questions - Infrastructure
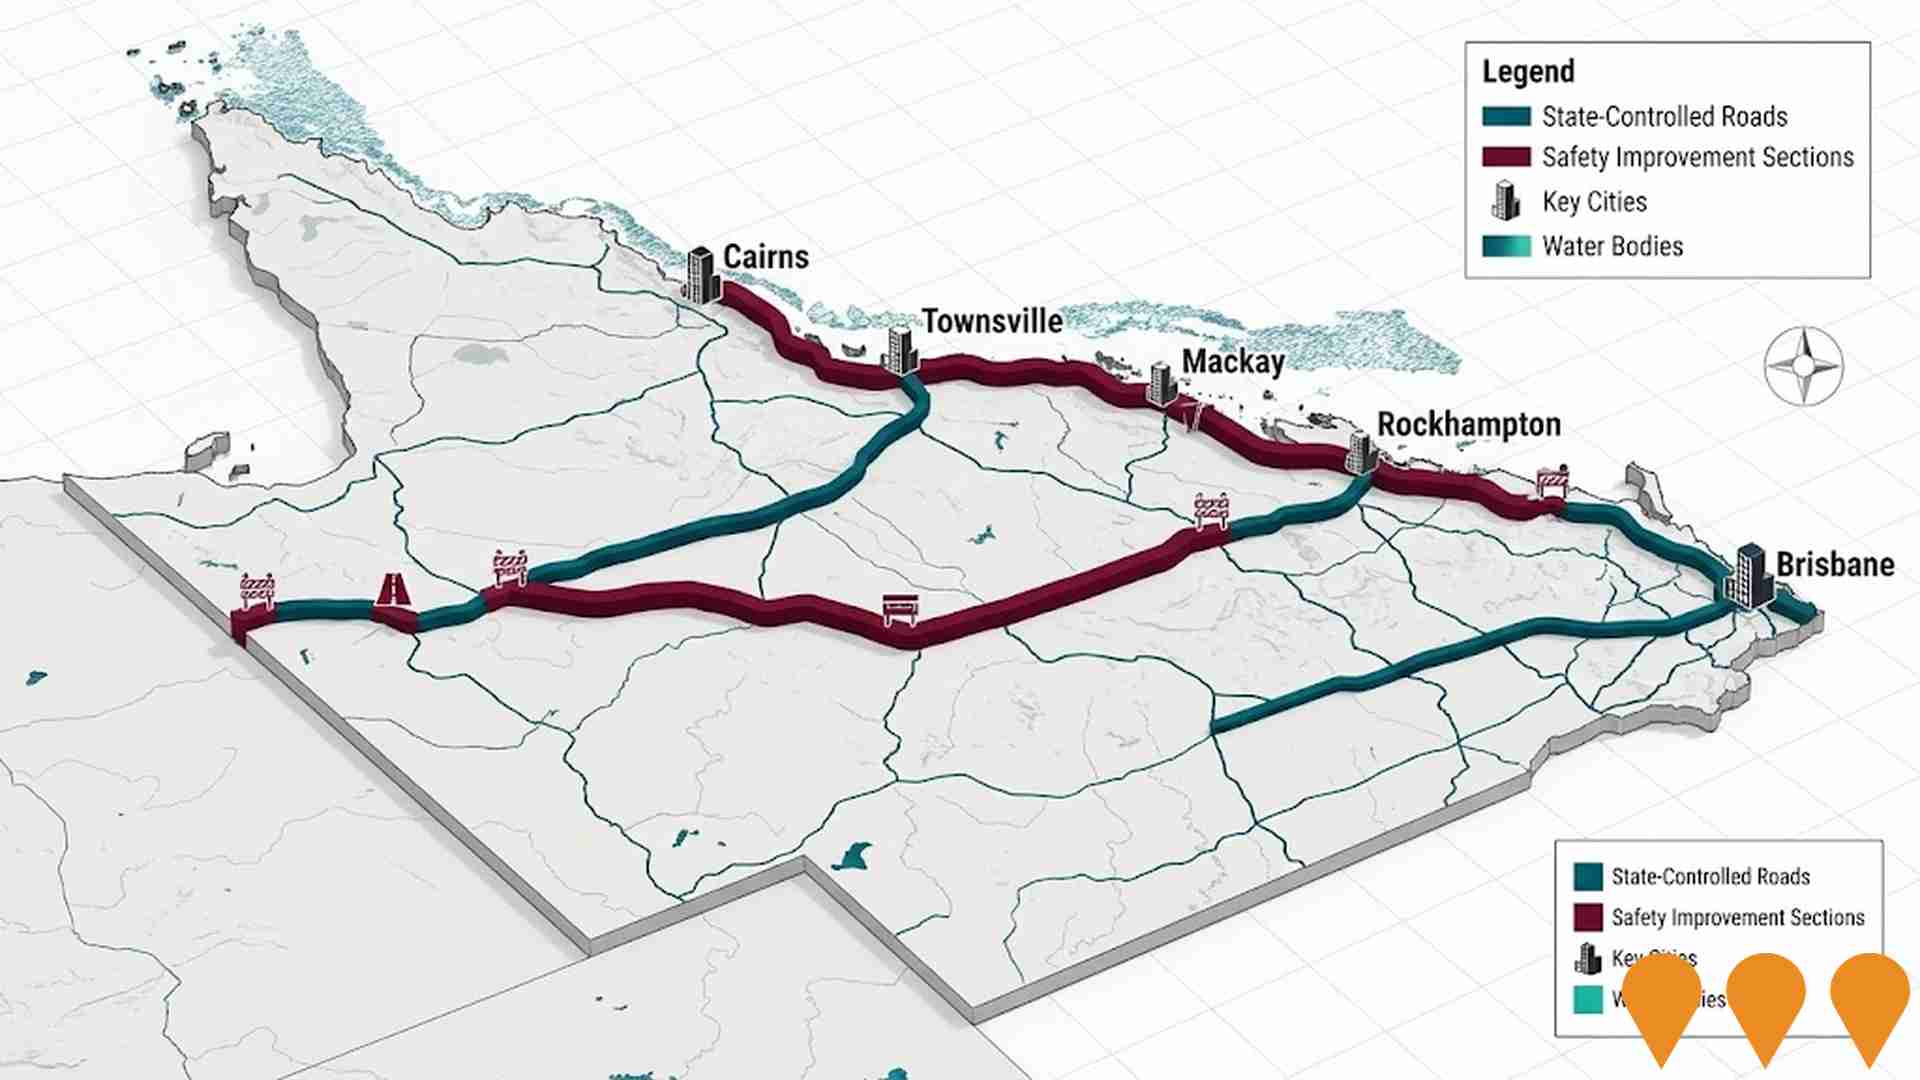
Queensland Energy Roadmap Infrastructure
The Queensland Energy Roadmap 2025 is the State Government's strategic plan to deliver affordable, reliable, and sustainable energy. Replaces the former Energy and Jobs Plan, focusing on extending the life of state-owned coal assets, a $1.6 billion Electricity Maintenance Guarantee, and the $400 million Queensland Energy Investment Fund. Key infrastructure includes the CopperString transmission line and new gas-fired generation, while the Pioneer-Burdekin Pumped Hydro project has been cancelled in favor of smaller storage options.
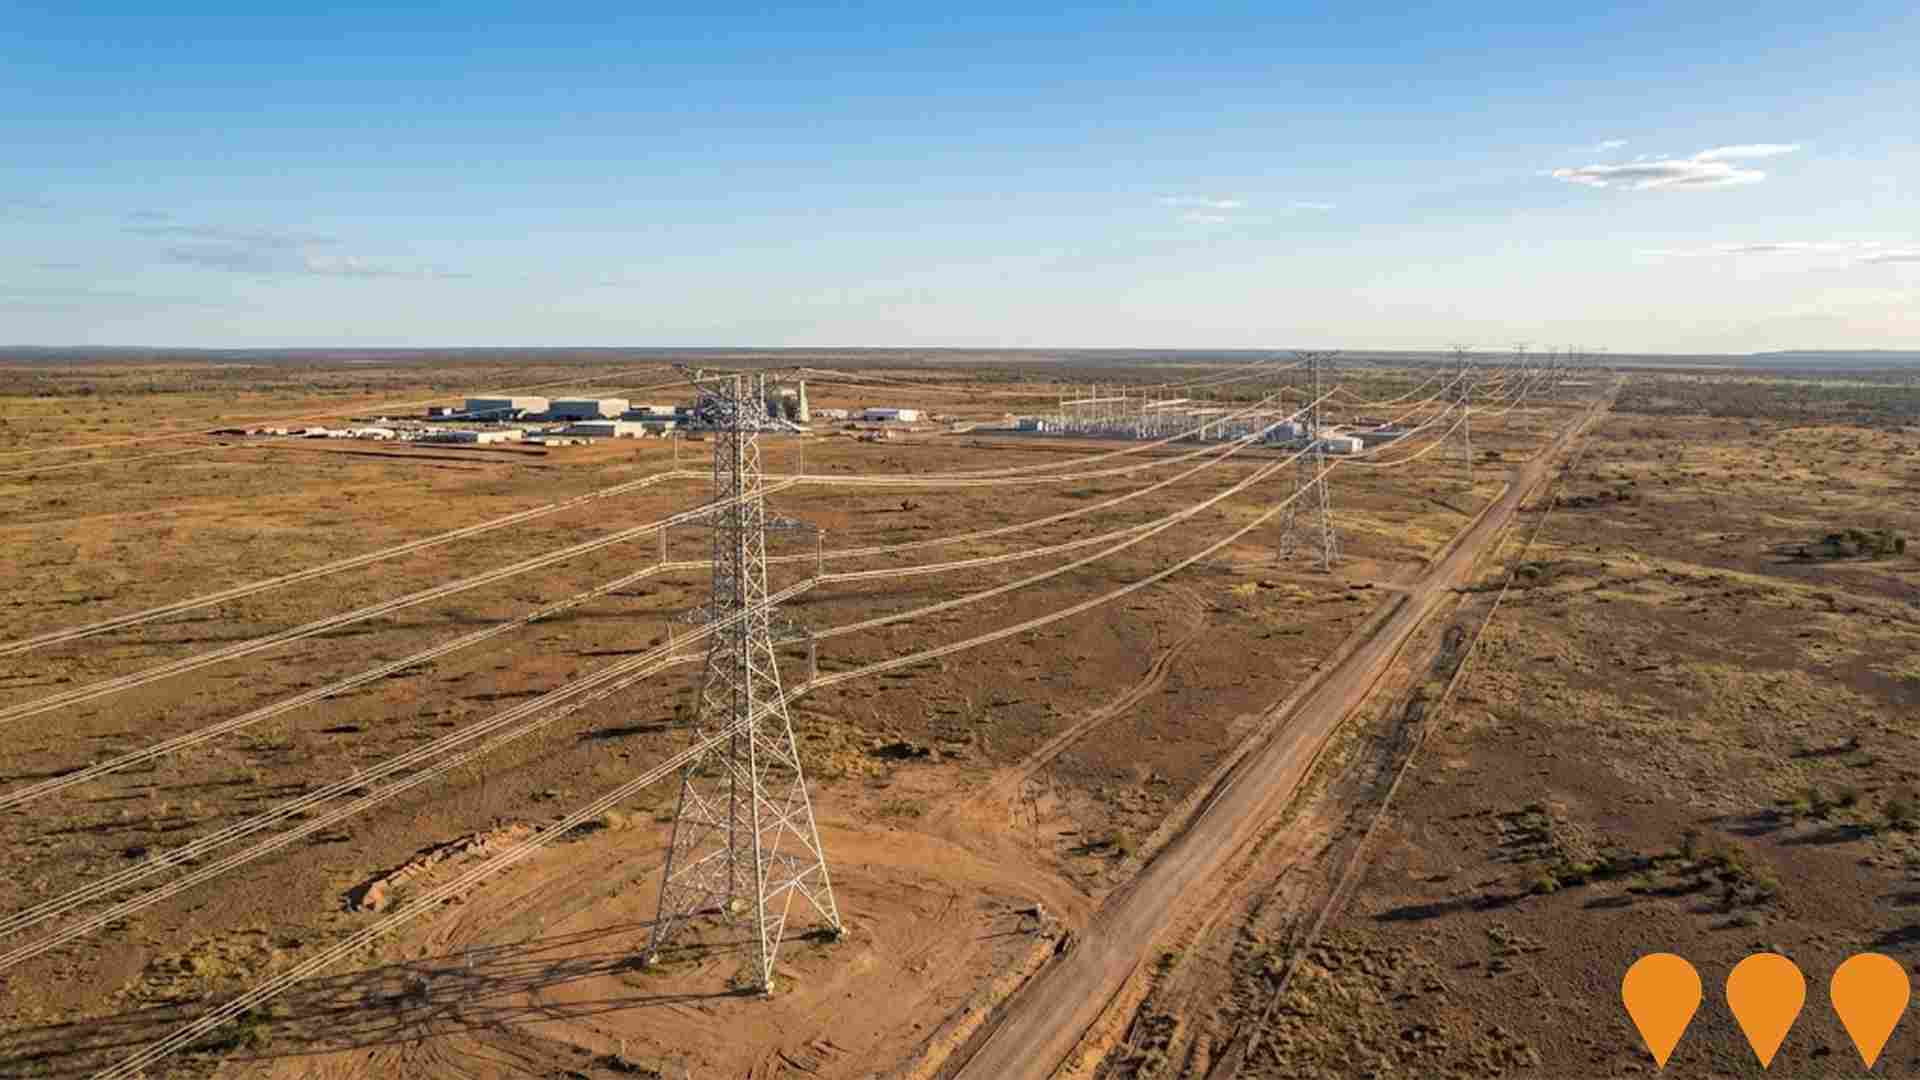
Queensland Energy and Jobs Plan
The Queensland Energy and Jobs Plan, initially a comprehensive plan for renewable energy and job creation, has been superseded by the Queensland Energy Roadmap 2025 by the new government (October 2025). The Roadmap focuses on energy affordability, reliability, and sustainability by leveraging existing coal and gas assets, increasing private sector investment in renewables and storage (targeting 6.8 GW of wind/solar and 3.8 GW of storage by 2030), and developing a new Regional Energy Hubs framework to replace Renewable Energy Zones. The initial $62 billion investment pipeline is now primarily focused on implementing the new Roadmap's priorities, including an estimated $26 billion in reduced energy system costs compared to the previous plan. The foundational legislation is the Energy Roadmap Amendment Bill 2025, which is currently before Parliament and expected to pass by December 2025, formally repealing the previous renewable energy targets. Key infrastructure projects like CopperString's Eastern Link are still progressing. The overall project is in the planning and legislative amendment phase under the new policy.
Brisbane 2032 Olympic and Paralympic Games Infrastructure Program
The $7.1 billion infrastructure program for the Brisbane 2032 Olympic and Paralympic Games includes a new ~60,000-seat main stadium at Victoria Park (hosting opening/closing ceremonies and athletics), a new Brisbane Arena (Roma Street or alternate location), venue upgrades to QSAC and Suncorp Stadium, new and upgraded aquatic centres, athletes' villages, and supporting transport improvements across South East Queensland. The program emphasises existing venues where possible with targeted new builds for legacy benefit.

Inland Rail - Queensland Sections
The Queensland sections of Inland Rail form part of the 1,700km Melbourne-to-Brisbane freight railway. Key active segments in Queensland include Calvert to Kagaru (C2K), Helidon to Calvert (H2C), Gowrie to Kagaru (G2K overall), Border to Gowrie (B2G via NSW), and the connection at Ebenezer. The former Kagaru to Acacia Ridge and Bromelton section has been cancelled; the line now connects to the interstate network at Kagaru. Multiple sections are now under construction or in detailed design and early works as of late 2025.

Lismore Flood Recovery and Resilience Program
Multi-year program to repair and upgrade community infrastructure damaged in the February/March 2022 floods across Lismore and surrounding areas. Delivered jointly by Lismore City Council, the NSW Reconstruction Authority and the Australian Government, it includes road and bridge repairs, levee upgrades, pump stations, drainage improvements, park restoration, water and sewer assets, and betterment works to increase future flood resilience.
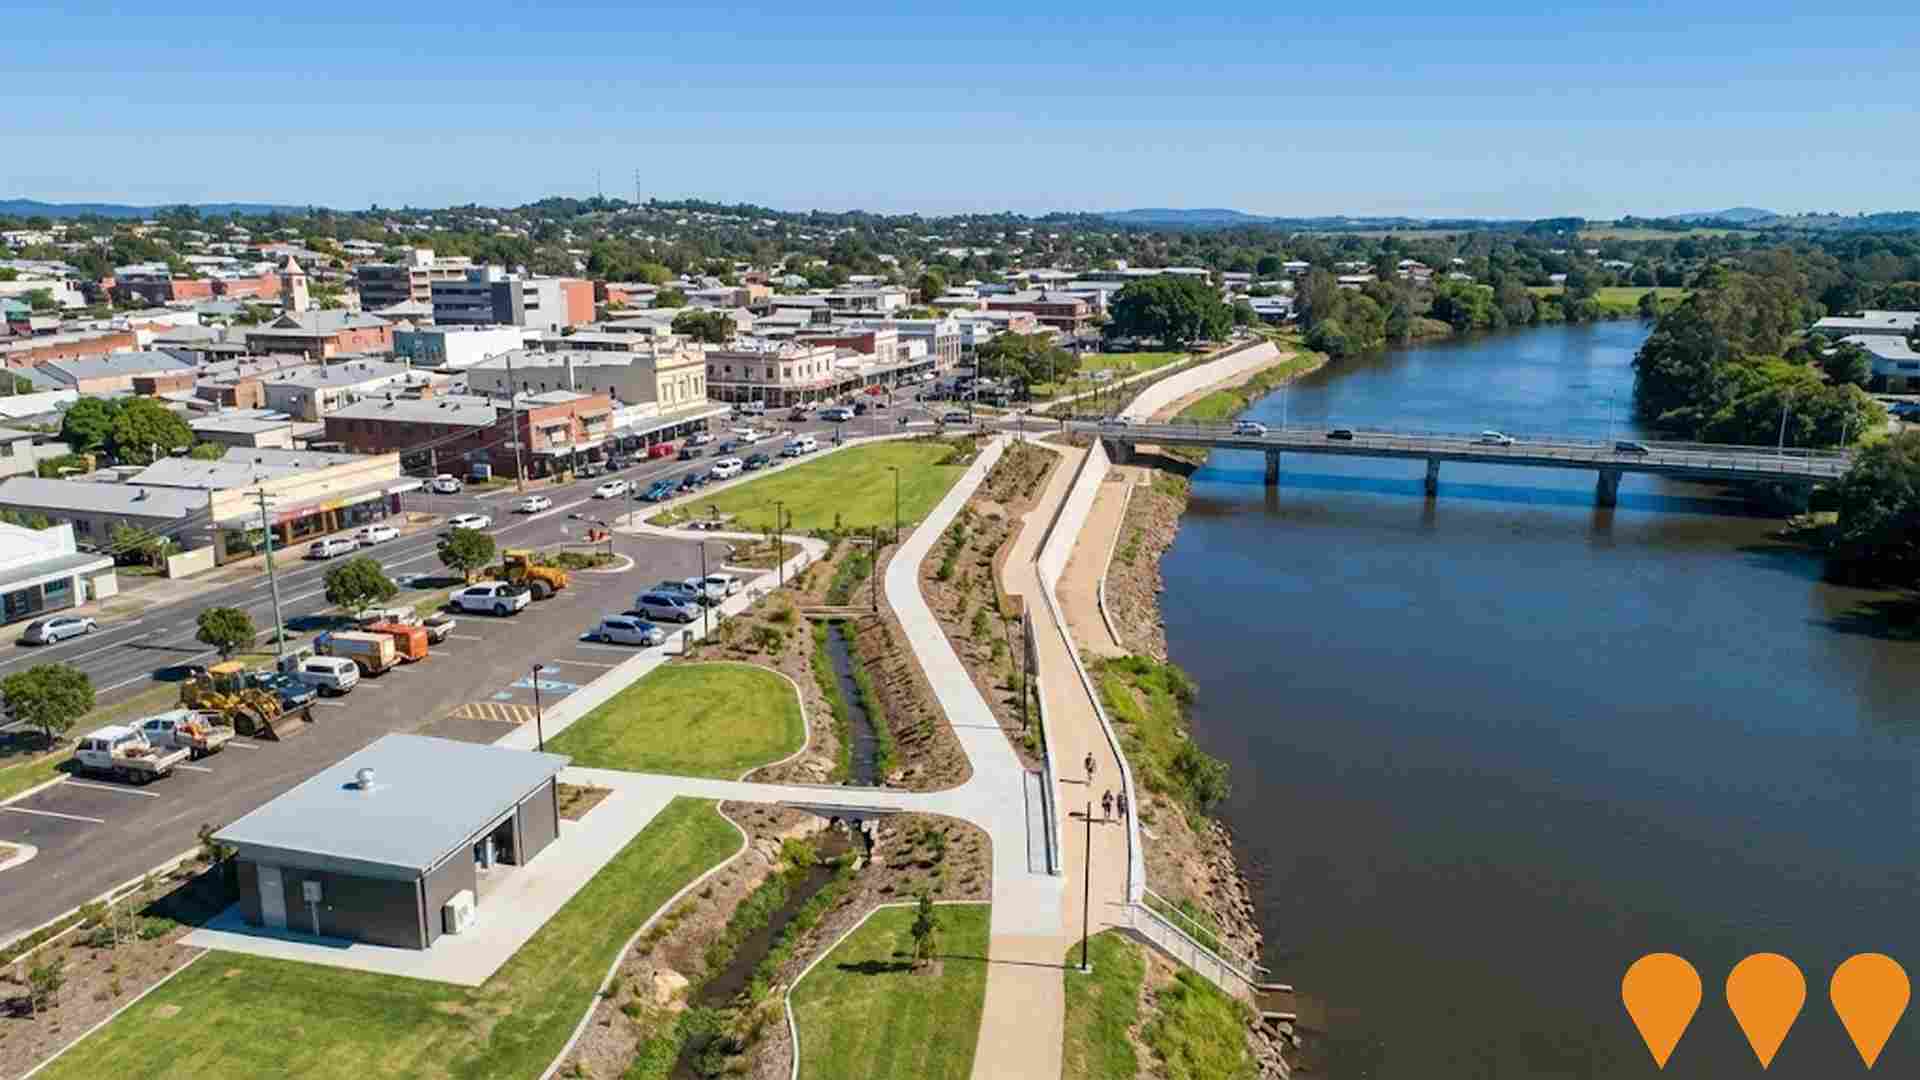
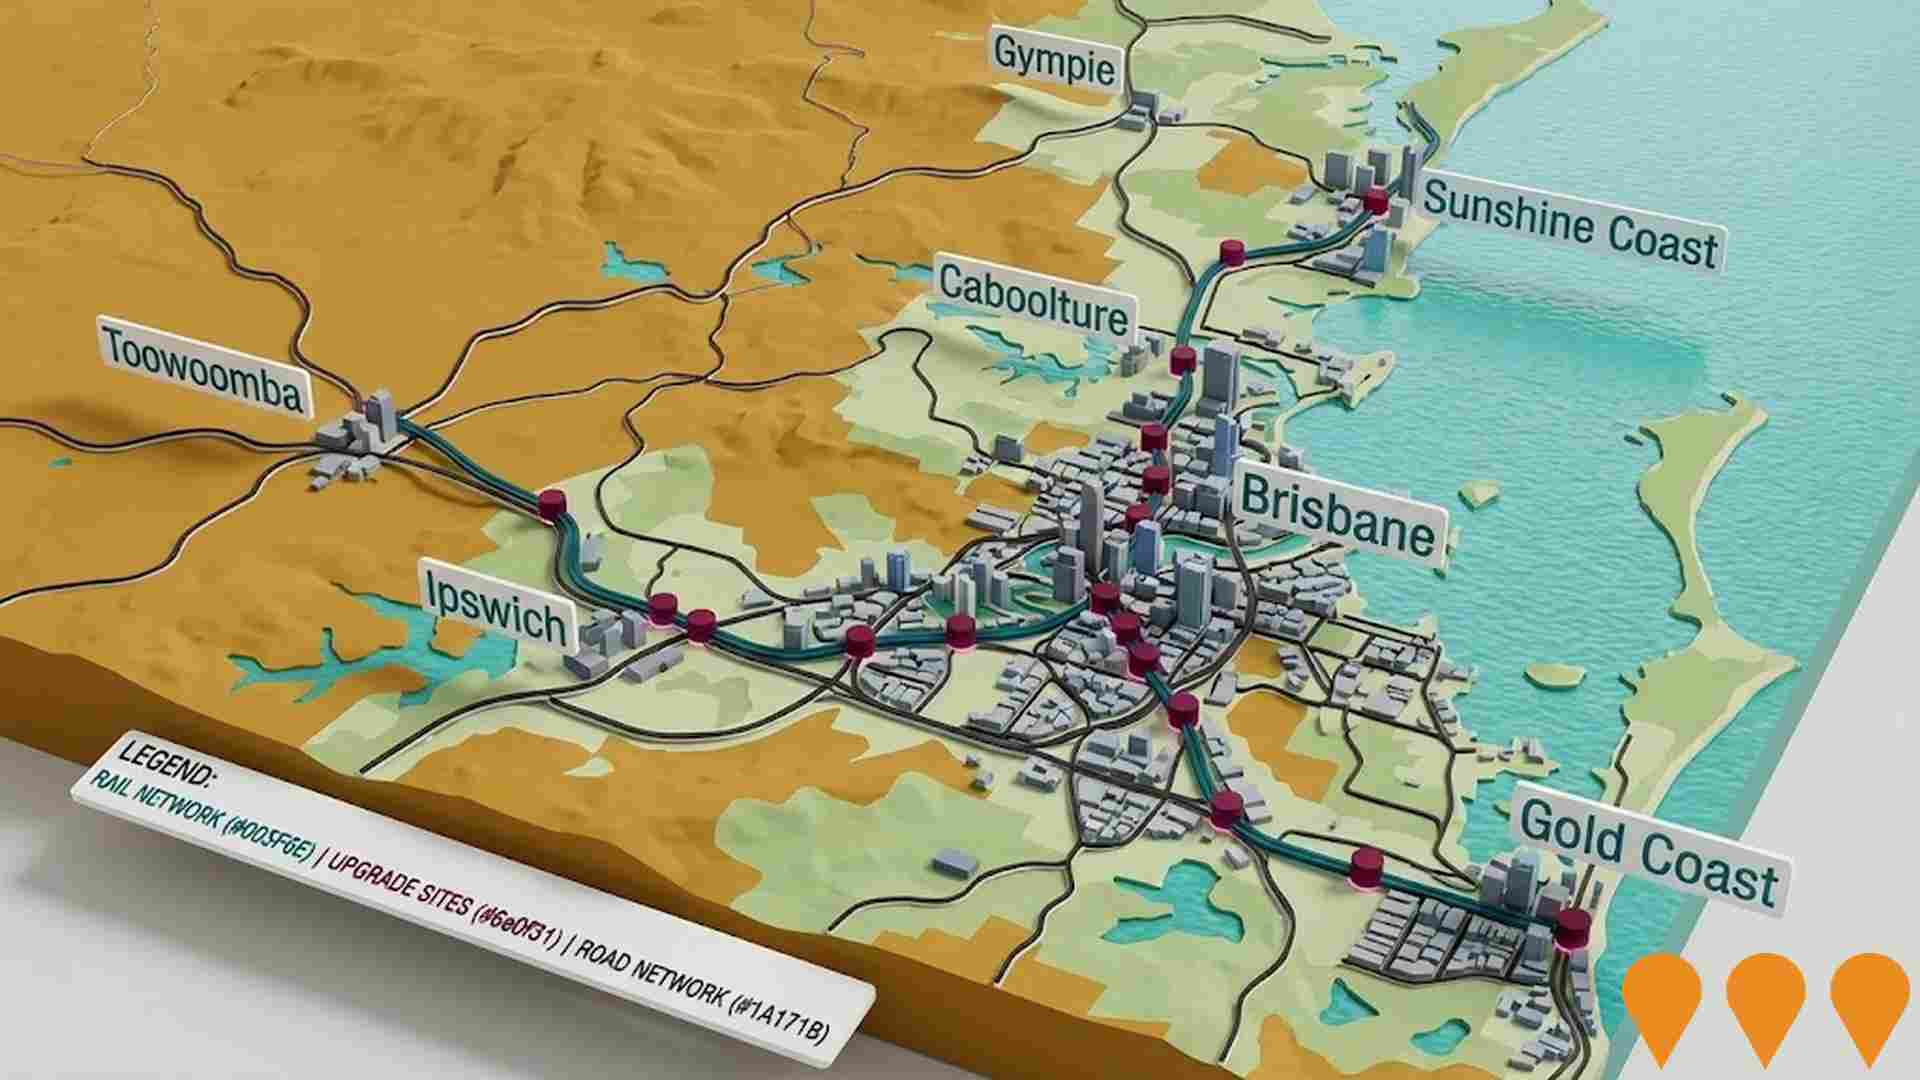
Brisbane to Gold Coast Transport Corridor Upgrades (Corridor Program)
A program of major transport upgrades along the Brisbane to Gold Coast corridor, incorporating multiple individual projects (such as the **Logan and Gold Coast Faster Rail** and the **Coomera Connector (M9)**) to enhance connectivity, reduce congestion, and support population growth. Components are at various stages, with key rail and road projects currently in **Construction** and **Planning** phases.
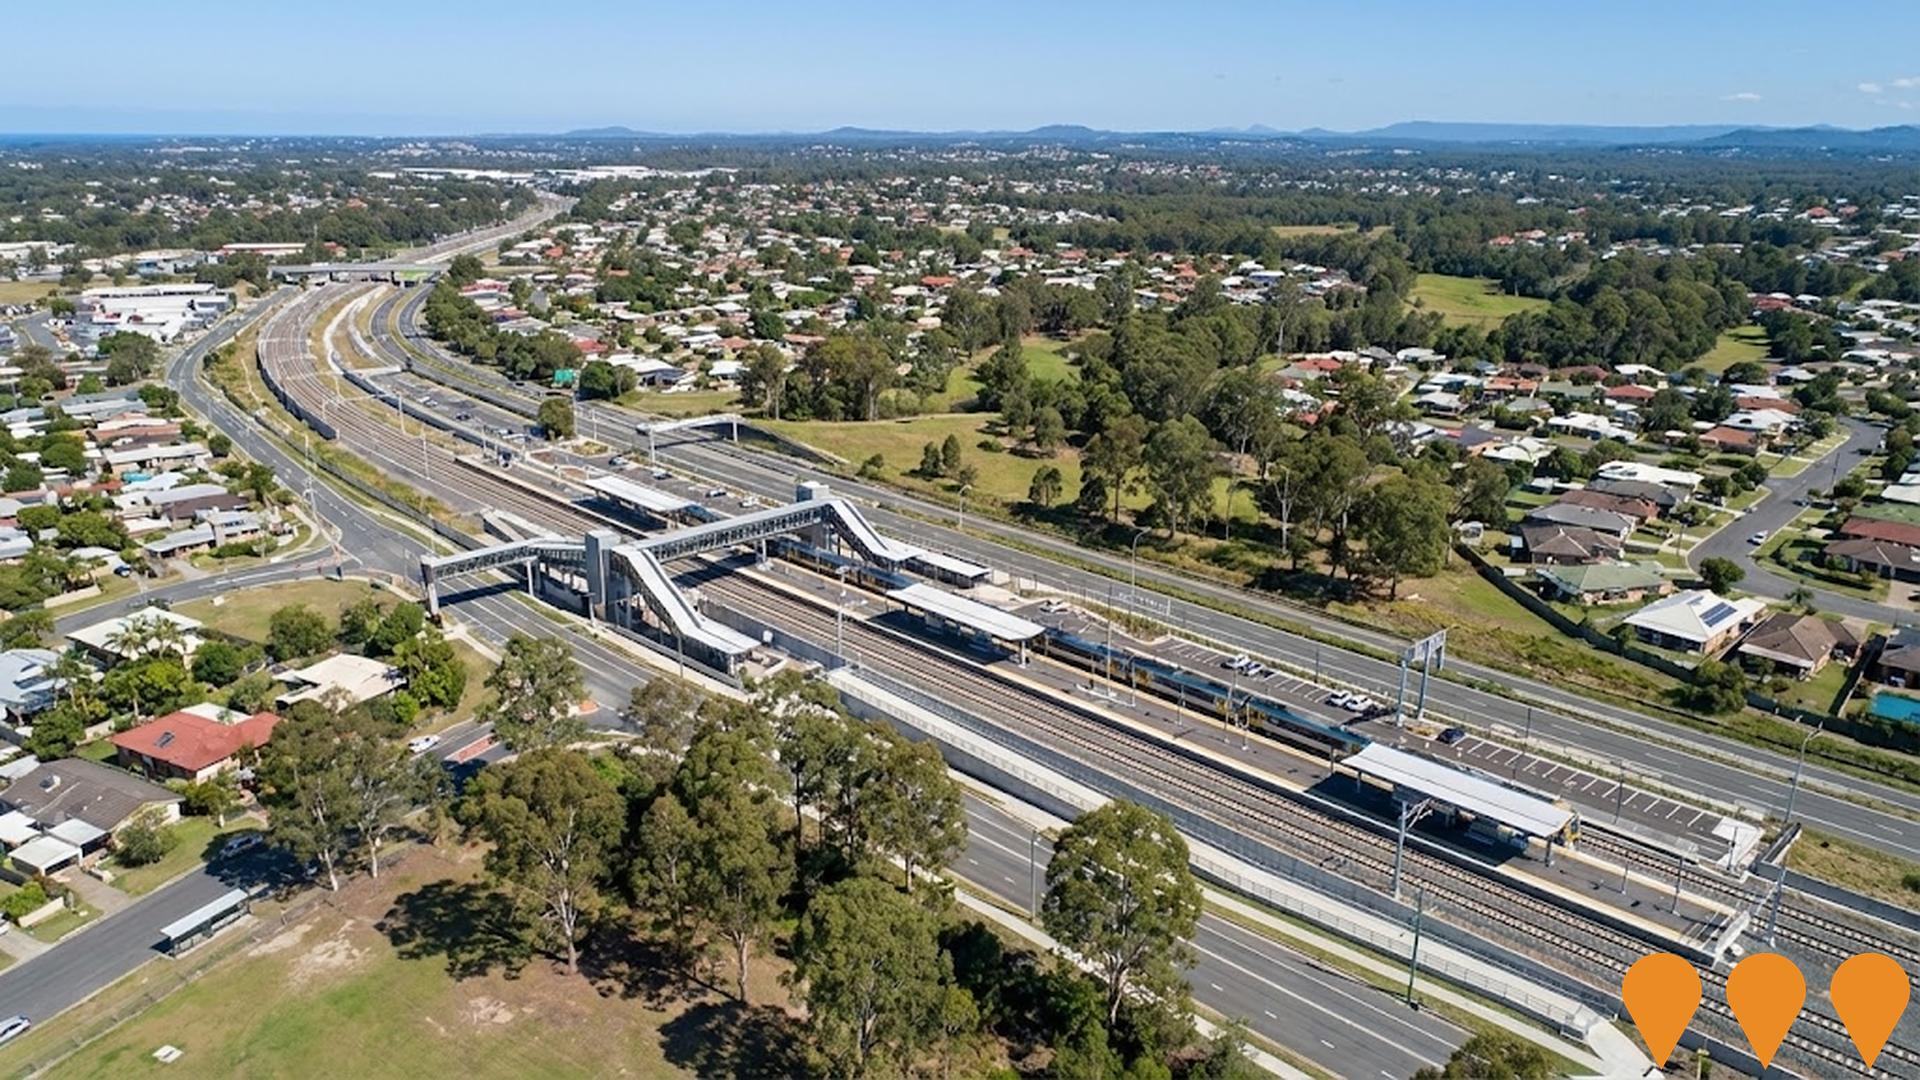
Building Future Hospitals Program
Queensland's flagship hospital infrastructure program delivering over 2,600 new and refurbished public hospital beds by 2031-32. Includes major expansions at Ipswich Hospital (Stage 2), Logan Hospital, Princess Alexandra Hospital, Townsville University Hospital, Gold Coast University Hospital and multiple new satellite hospitals and community health centres.
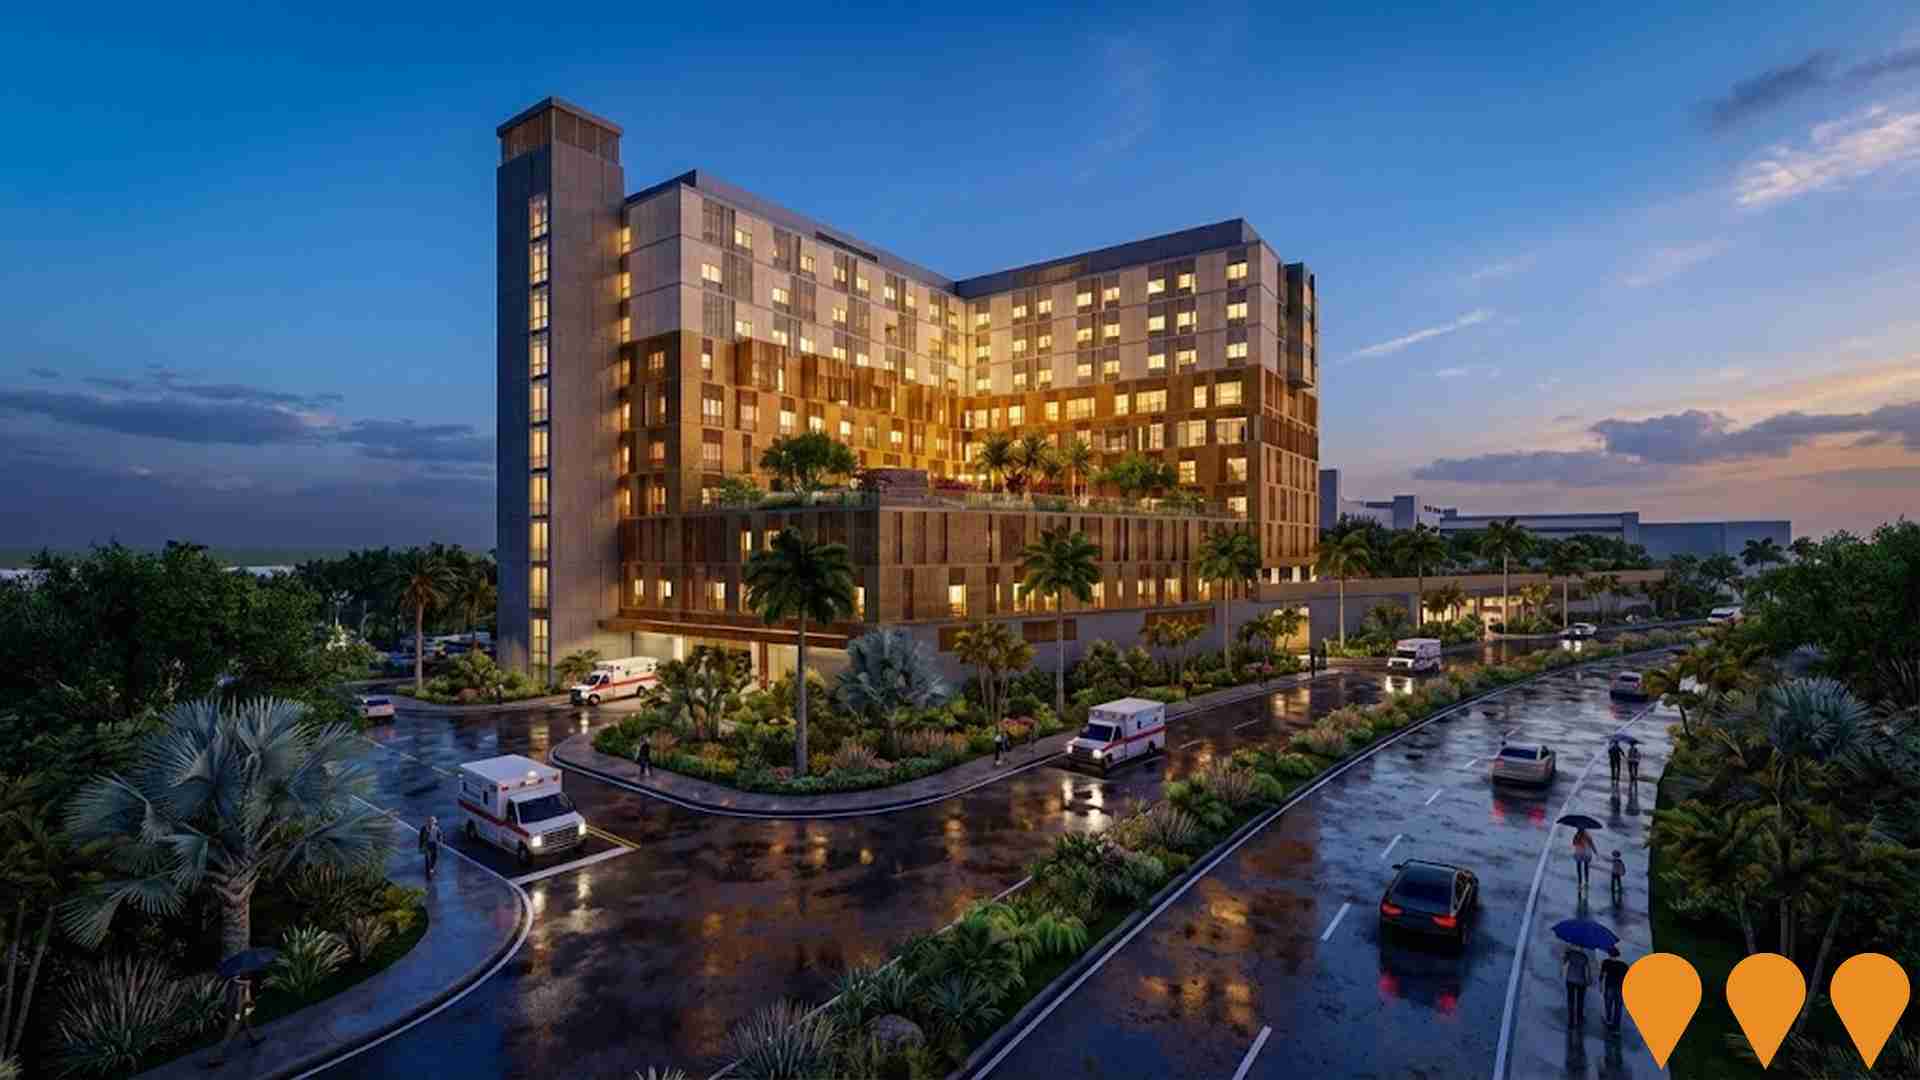
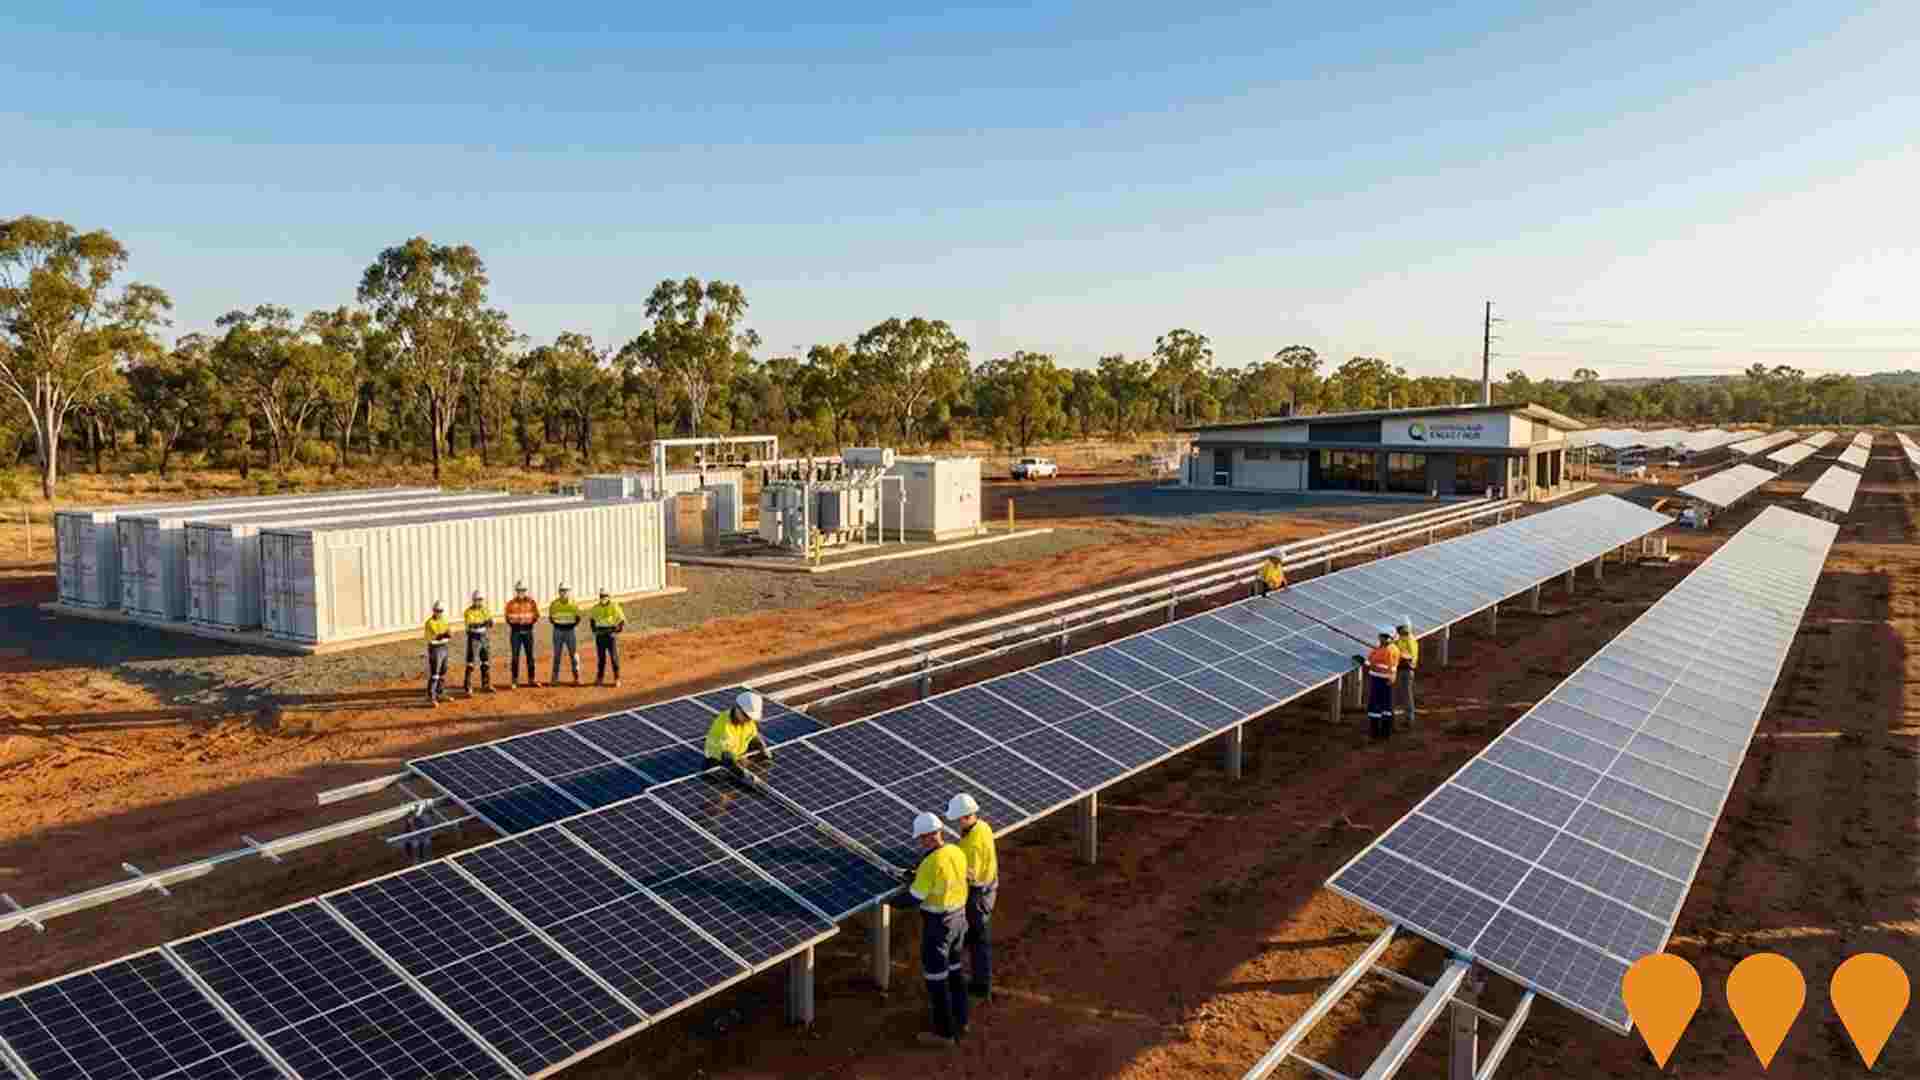
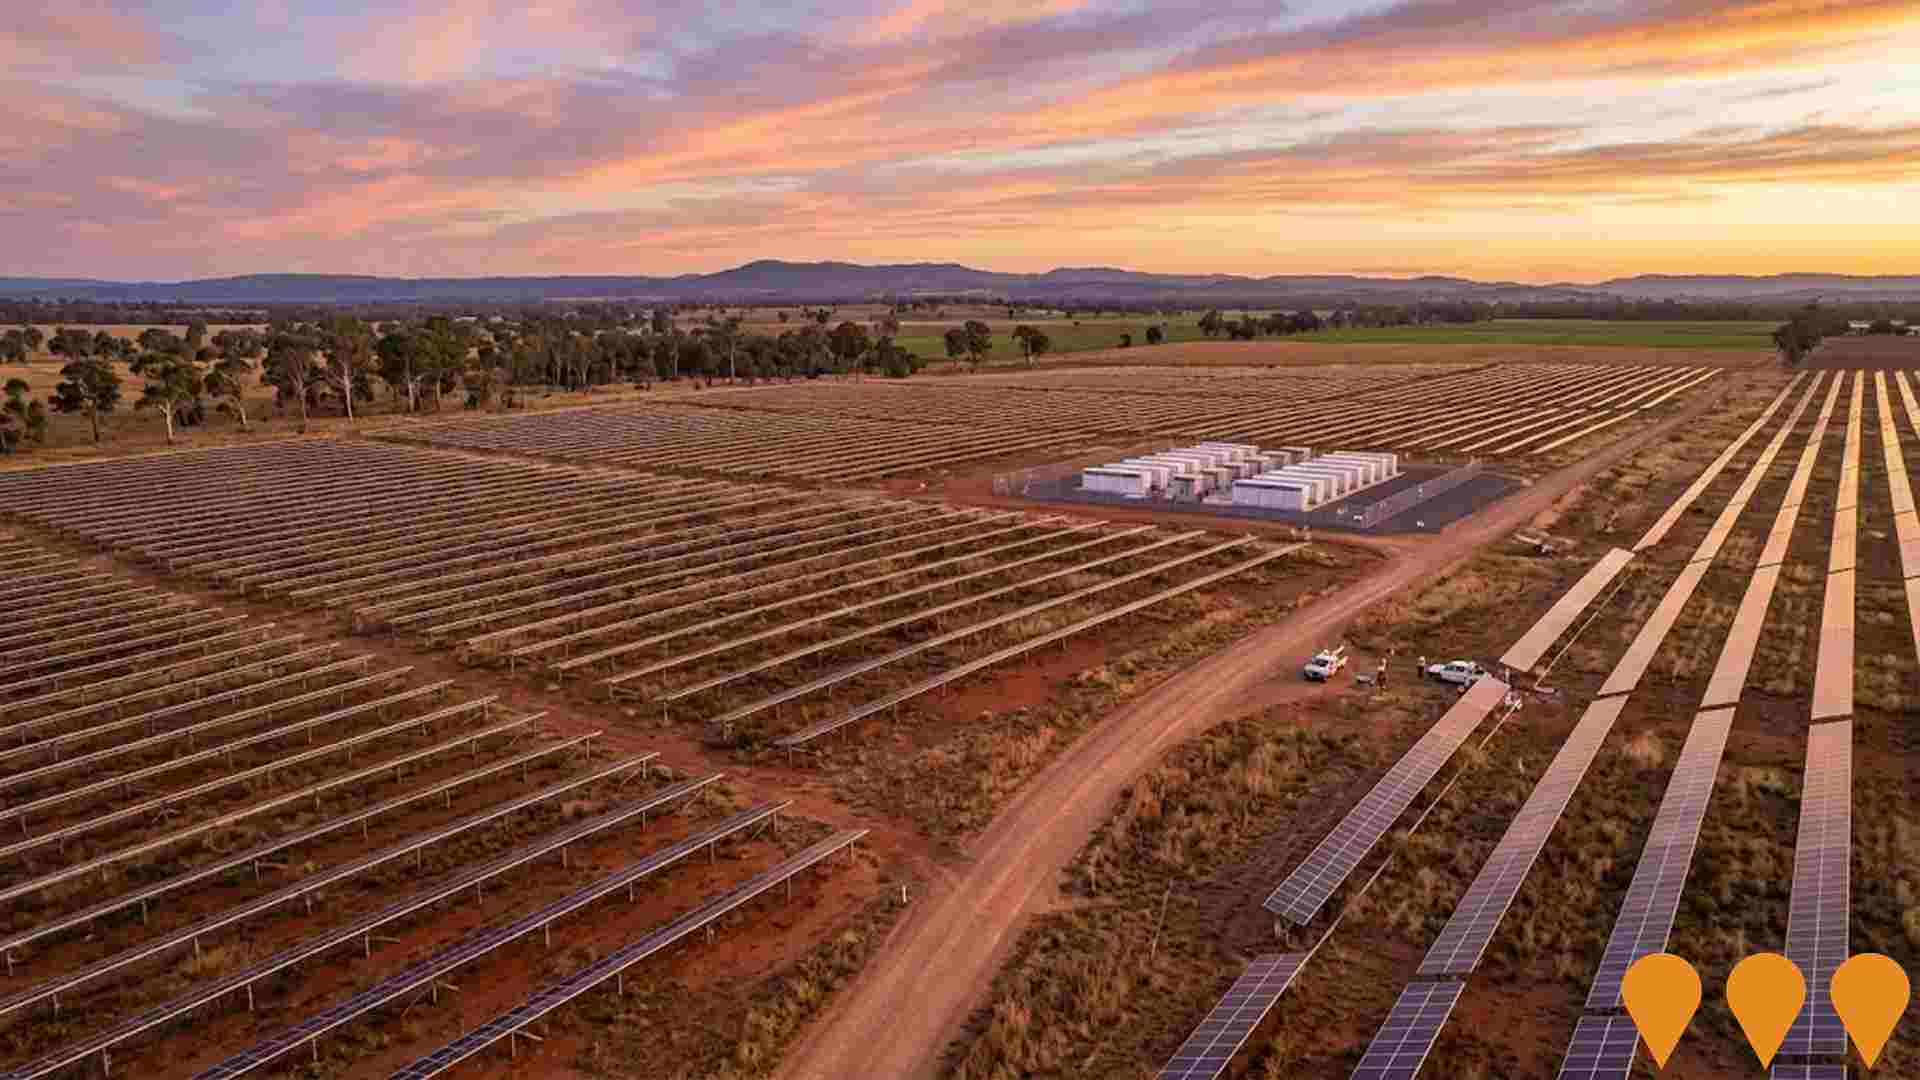
Summerville Solar Farm
A 90MW solar farm with a 360MWh battery energy storage system spanning 240 hectares, featuring 215,000 PV panels and capable of powering 36,000 homes. The project will reduce greenhouse gas emissions by over 139,000 tonnes annually and includes a $3.1 million community benefit fund for Richmond Valley Council.
Employment
AreaSearch assessment indicates Kyogle faces employment challenges relative to the majority of Australian markets
Kyogle has an unemployment rate of 5.6% as of September 2025. There are 3,088 residents employed while the unemployment rate is 1.8% higher than Rest of NSW's rate of 3.8%.
Workforce participation stands at 47.4%, significantly lower than Rest of NSW's 56.4%. Key industries for employment among residents are health care & social assistance, agriculture, forestry & fishing, and construction. Agriculture, forestry & fishing is notably concentrated with employment levels at 2.6 times the regional average. Public administration & safety is under-represented, with only 4.6% of Kyogle's workforce compared to Rest of NSW's 7.5%.
Over the year to September 2025, labour force levels decreased by 2.5% and employment declined by 0.8%, leading to a fall in unemployment rate by 1.6 percentage points. In contrast, Rest of NSW saw employment fall by 0.5%, labour force contract by 0.1%, and unemployment rise by 0.4%. State-level data to 25-Nov shows NSW employment contracted by 0.03% (losing 2,260 jobs), with the state unemployment rate at 3.9%. National employment forecasts from May-25 project national growth of 6.6% over five years and 13.7% over ten years. Applying these projections to Kyogle's employment mix suggests local employment should increase by 6.0% over five years and 13.0% over ten years, assuming constant population projections.
Frequently Asked Questions - Employment
Income
Income metrics place the area in the bottom 10% of locations nationally according to AreaSearch analysis
As per AreaSearch's latest postcode level ATO data released for financial year 2022, Kyogle SA2's median income among taxpayers is $37,415. The average income in the same period is $45,800. This is below the national average. In comparison, Rest of NSW has a median income of $49,459 and an average of $62,998. Based on Wage Price Index growth of 12.61% since financial year 2022, estimated median income as of September 2025 would be approximately $42,133. The estimated average income for the same period is $51,575. Census data reveals household, family and personal incomes in Kyogle fall between the 3rd and 5th percentiles nationally. Income brackets indicate that 29.4% of locals (2,305 people) predominantly earn within the $400 - $799 category, differing from broader area patterns where $1,500 - $2,999 dominates with 29.9%. After housing costs, 86.4% of income remains, ranking at the 6th percentile nationally.
Frequently Asked Questions - Income
Housing
Kyogle is characterized by a predominantly suburban housing profile, with above-average rates of outright home ownership
In Kyogle, as per the latest Census, 95.2% of dwellings were houses, with the remaining 4.8% comprising semi-detached homes, apartments, and other types. This differs from Non-Metro NSW's figures of 86.8% houses and 13.2% other dwellings. Home ownership in Kyogle stood at 51.9%, with mortgaged properties at 27.1% and rented ones at 21.0%. The median monthly mortgage repayment was $1,300, lower than Non-Metro NSW's average of $1,452. The median weekly rent in Kyogle was $270, compared to Non-Metro NSW's $300. Nationally, Kyogle's mortgage repayments were significantly lower at $1,300 versus Australia's average of $1,863, and rents were substantially below the national figure of $375.
Frequently Asked Questions - Housing
Household Composition
Kyogle features high concentrations of lone person households, with a lower-than-average median household size
Family households account for 64.3% of all households, including 19.5% couples with children, 31.4% couples without children, and 12.5% single parent families. Non-family households constitute the remaining 35.7%, with lone person households at 32.3% and group households comprising 3.6%. The median household size is 2.3 people, which is smaller than the Rest of NSW average of 2.4.
Frequently Asked Questions - Households
Local Schools & Education
Educational outcomes in Kyogle fall within the lower quartile nationally, indicating opportunities for improvement in qualification attainment
The area's university qualification rate is 18.0%, significantly lower than the NSW average of 32.2%. This presents both a challenge and an opportunity for targeted educational initiatives. Bachelor degrees are the most common at 13.1%, followed by postgraduate qualifications (2.7%) and graduate diplomas (2.2%). Vocational credentials are prominent, with 40.8% of residents aged 15+ holding them - advanced diplomas at 11.3% and certificates at 29.5%.
Educational participation is high, with 28.6% of residents currently enrolled in formal education. This includes 11.0% in primary education, 8.4% in secondary education, and 2.6% pursuing tertiary education.
Frequently Asked Questions - Education
Schools Detail
Nearby Services & Amenities
Transport
Transport servicing is low compared to other areas nationally based on assessment of service frequency, route connectivity and accessibility
Kyogle has 450 active public transport stops, including train and bus services. These are covered by 38 routes offering a total of 494 weekly passenger trips. Residents enjoy excellent transport accessibility, with an average distance of 160 meters to the nearest stop.
Service frequency is 70 trips daily across all routes, translating to approximately one weekly trip per individual stop.
Frequently Asked Questions - Transport
Transport Stops Detail
Health
Health performance in Kyogle is well below average with prevalence of common health conditions notable across both younger and older age cohorts
Kyogle faces significant health challenges, with common conditions prevalent across both younger and older age groups. Private health cover is low at approximately 47% (around 3,654 people), compared to the national average of 55.3%.
The most common conditions are arthritis (11.1%) and mental health issues (9.0%). About 62.0% report no medical ailments, similar to Rest of NSW at 61.9%. Kyogle has a higher proportion of residents aged 65 and over, at 29.0% (2,278 people), compared to 22.9% in Rest of NSW. Health outcomes among seniors are better than average, outperforming the general population.
Frequently Asked Questions - Health
Cultural Diversity
Kyogle is considerably less culturally diverse than average when assessed alongside AreaSearch's national rankings for language and cultural background related metrics
Kyogle has a low level of cultural diversity, with 88.8% of its population being citizens, 89.1% born in Australia, and 96.3% speaking English only at home. Christianity is the predominant religion in Kyogle, accounting for 51.0% of the population, slightly lower than the 52.4% average across Rest of NSW. The top three ancestry groups in Kyogle are English (31.7%), Australian (30.3%), and Irish (10.6%).
Notably, Scottish ancestry is relatively high at 9.0%, compared to 8.5% regionally. Australian Aboriginal ancestry is present at 3.9%, slightly lower than the regional average of 4.6%. German ancestry is present at 3.4%, equal to the regional average.
Frequently Asked Questions - Diversity
Age
Kyogle ranks among the oldest 10% of areas nationwide
Kyogle's median age at 51 years is significantly higher than the Rest of NSW average of 43 years and considerably older than the Australian median of 38 years. Compared to the Rest of NSW average, Kyogle has a notably over-represented cohort aged 65-74 (18.0%), while those aged 25-34 are under-represented (7.3%). This concentration of the 65-74 age group is well above the national average of 9.4%. Post-Census data from 2021 shows that the 75 to 84 age group has grown from 7.1% to 8.3%, while the 65 to 74 cohort increased from 16.9% to 18.0%. Conversely, the 55 to 64 cohort declined from 18.6% to 16.5%, and the 45 to 54 group dropped from 12.2% to 11.0%. By 2041, Kyogle's age composition is expected to see notable shifts. The 85+ age group is projected to grow by 60% (129 people), reaching 345 from 215. This growth is driven entirely by the aging population dynamic, with those aged 65 and above comprising all of the projected growth. Conversely, both the 0-4 and 35-44 age groups are expected to see reduced numbers.
