Chart Color Schemes
This analysis uses ABS Statistical Areas Level 2 (SA2) boundaries, which can materially differ from Suburbs and Localities (SAL) even when sharing similar names.
SA2 boundaries are defined by the Australian Bureau of Statistics and are designed to represent communities for statistical reporting (e.g., census and ERP).
Suburbs and Localities (SAL) represent commonly-used suburb/locality names (postal-style areas) and may use different geographic boundaries. For comprehensive analysis, consider reviewing both boundary types if available.
est. as @ -- *
ABS ERP | -- people | --
2021 Census | -- people
Sales Activity
Curious about local property values? Filter the chart to assess the volume and appreciation (including resales) trends and regional comparisons, or scroll to the map below view this information at an individual property level.
Find a Recent Sale
Sales Detail
Population
Population growth drivers in Murwillumbah Surrounds are slightly above average based on AreaSearch's ranking of recent, and medium term trends
Murwillumbah Surrounds' population is 10,799 as of November 2025. This shows an increase of 447 people since the 2021 Census, which reported a population of 10,352. The change is inferred from ABS's estimated resident population of 10,695 in June 2024 and 56 new addresses validated since the Census date. This results in a density ratio of 11.9 persons per square kilometer. Murwillumbah Surrounds' growth of 4.3% since 2021 exceeded the SA4 region's 3.3%. Population growth was primarily driven by interstate migration, contributing approximately 36.0% of overall gains.
AreaSearch uses ABS/Geoscience Australia projections for each SA2 area, released in 2024 with a base year of 2022. For areas not covered, NSW State Government's SA2 level projections are used, released in 2022 with a base year of 2021. Growth rates by age group from these aggregations are applied to all areas for years 2032 to 2041. Based on demographic trends, the area is projected to expand by 2,061 persons to 2041, reflecting an 18.1% total gain over 17 years.
Frequently Asked Questions - Population
Development
Residential development activity is lower than average in Murwillumbah Surrounds according to AreaSearch's national comparison of local real estate markets
Murwillumbah Surrounds has seen approximately 13 new homes approved annually over the past five financial years, totalling 67 homes. As of FY26, 19 approvals have been recorded. On average, 8.6 new residents per year arrive for each dwelling constructed between FY21 and FY25. This has led to a significant outpacing of supply by demand, which typically puts upward pressure on prices and increases competition among buyers.
New properties are constructed at an average expected cost value of $390,000. In FY26, $19.9 million in commercial development approvals have been recorded, indicating balanced commercial development activity compared to the rest of NSW. However, Murwillumbah Surrounds has significantly less development activity than the regional average, with 58.0% fewer approvals per person. This scarcity of new homes typically strengthens demand and prices for existing properties. Recent construction comprises 90.0% detached houses and 10.0% medium and high-density housing, preserving the area's low density nature and attracting space-seeking buyers.
The estimated population count is 1545 people per dwelling approval, reflecting its quiet development environment. Population forecasts indicate Murwillumbah Surrounds will gain 1,952 residents by 2041. If current development rates continue, housing supply may not keep pace with population growth, potentially increasing competition among buyers and supporting stronger price growth.
Frequently Asked Questions - Development
Infrastructure
Murwillumbah Surrounds has very high levels of nearby infrastructure activity, ranking in the top 20% nationally
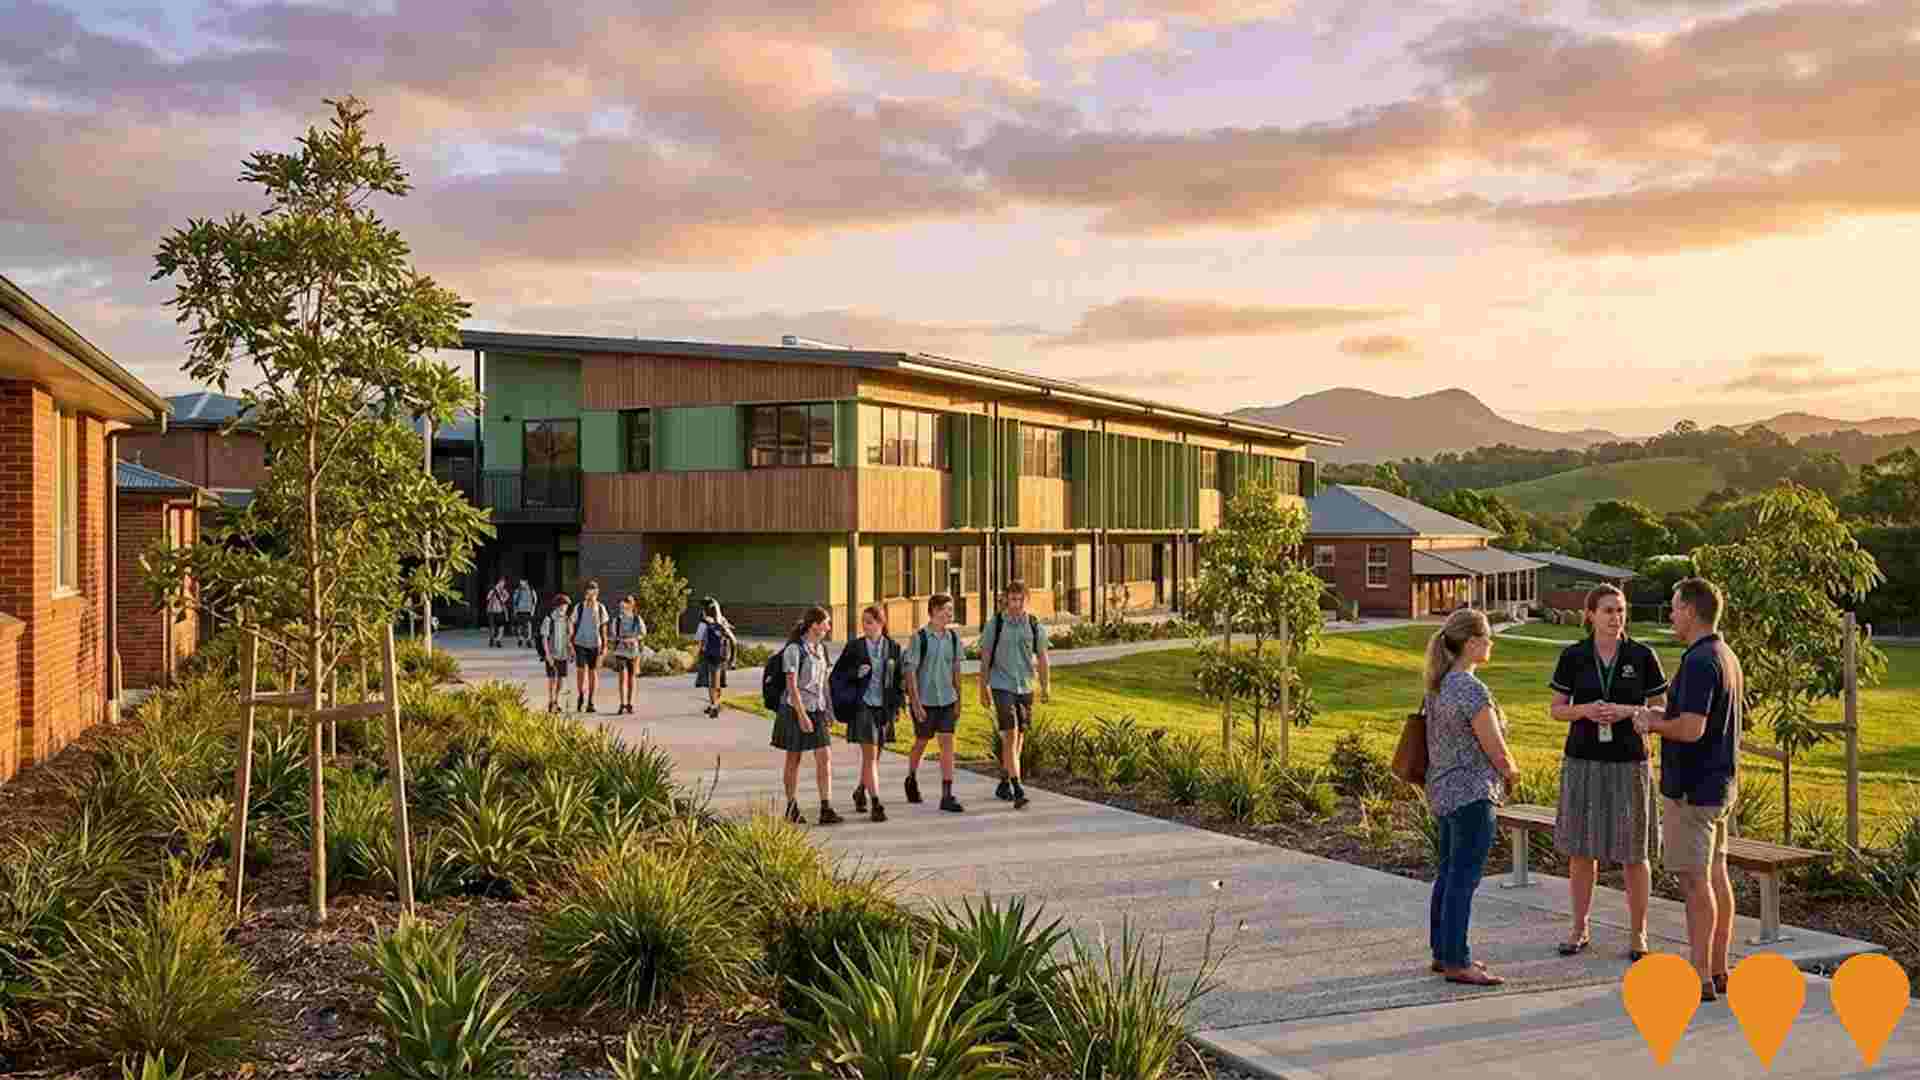
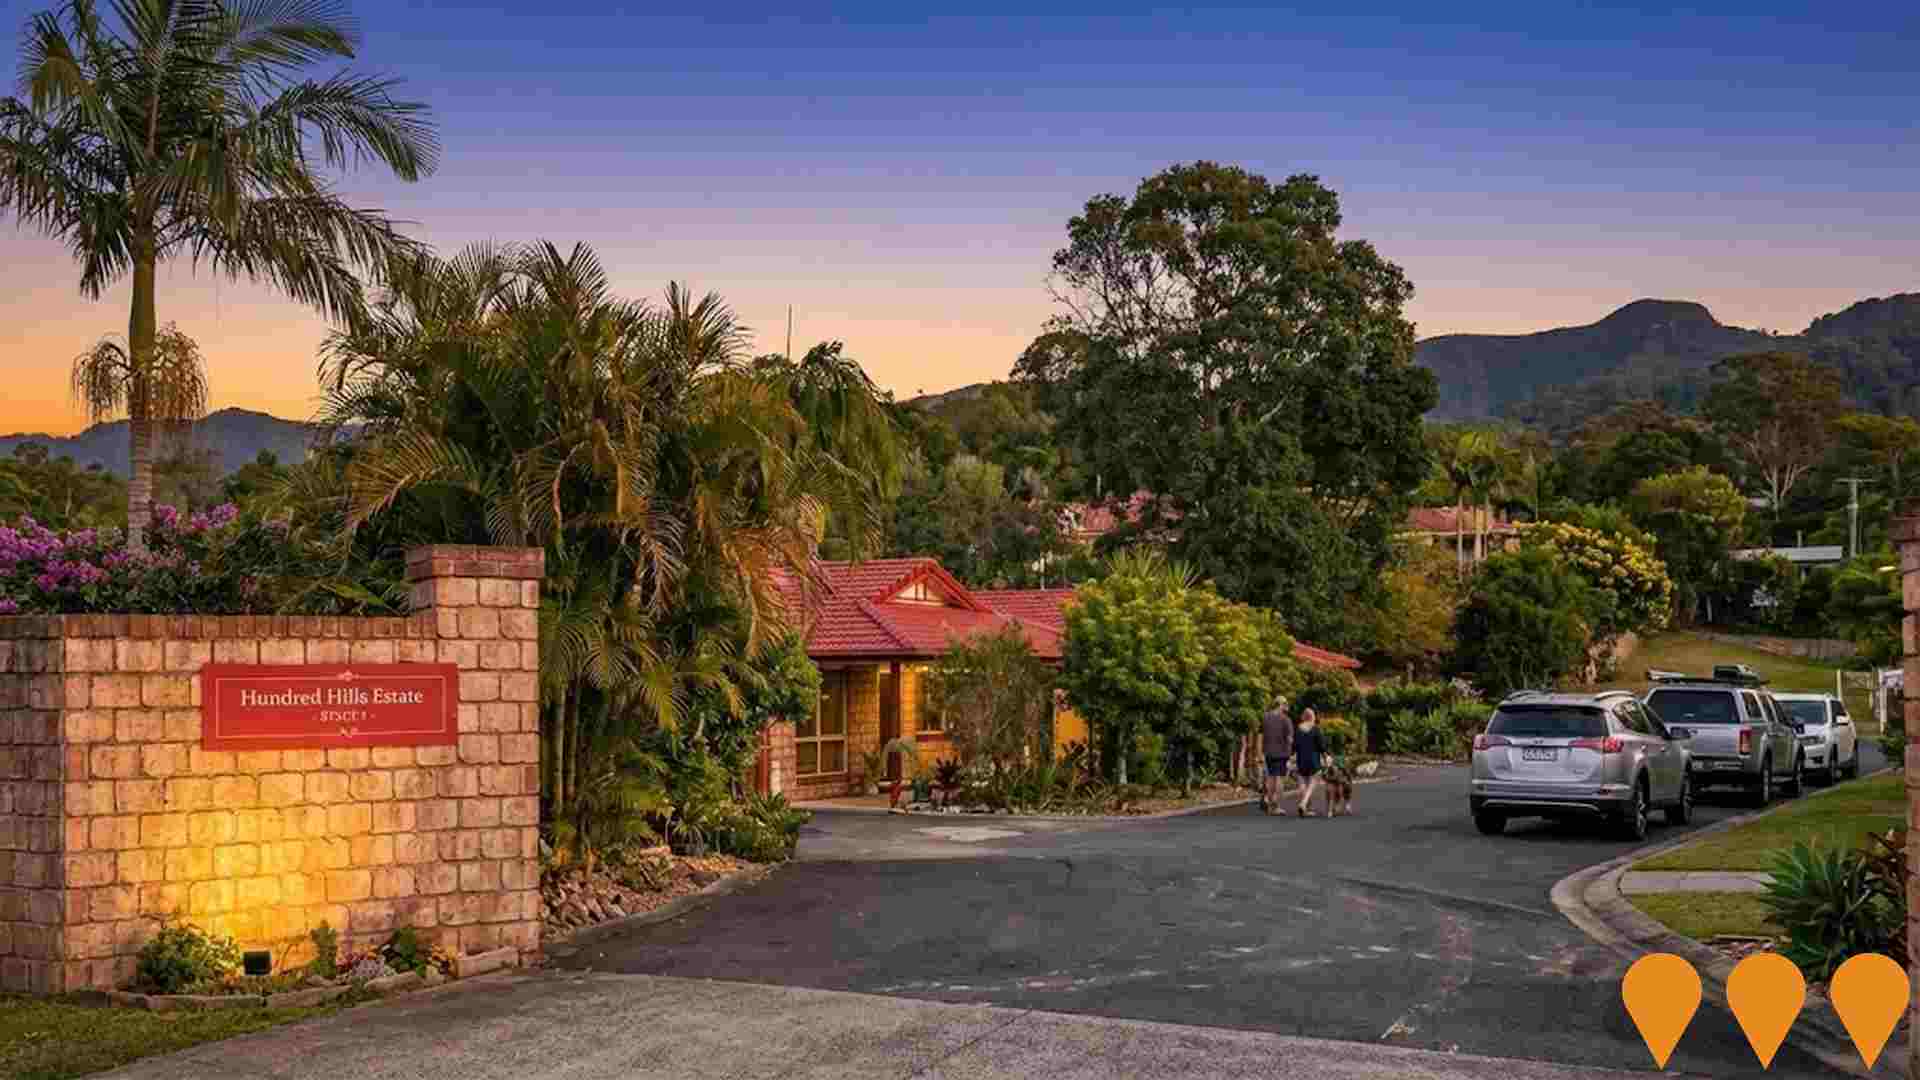
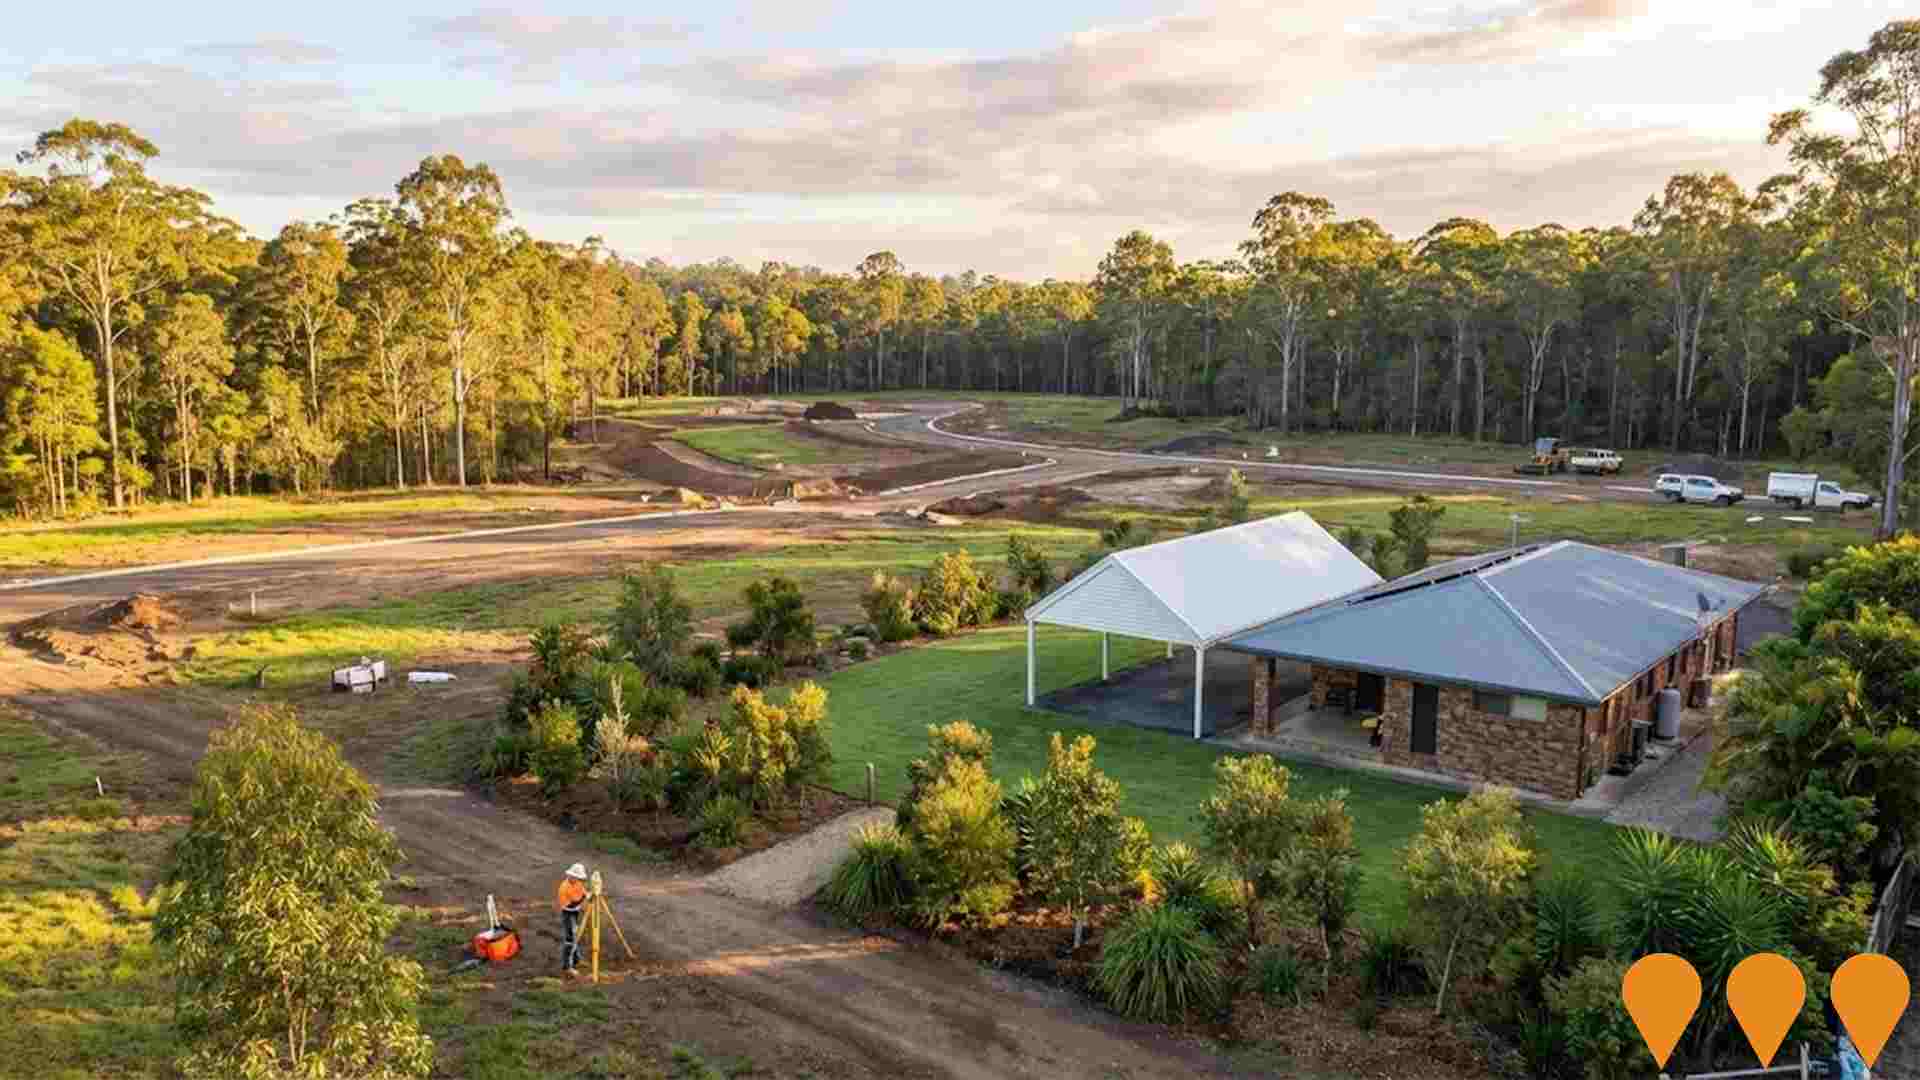
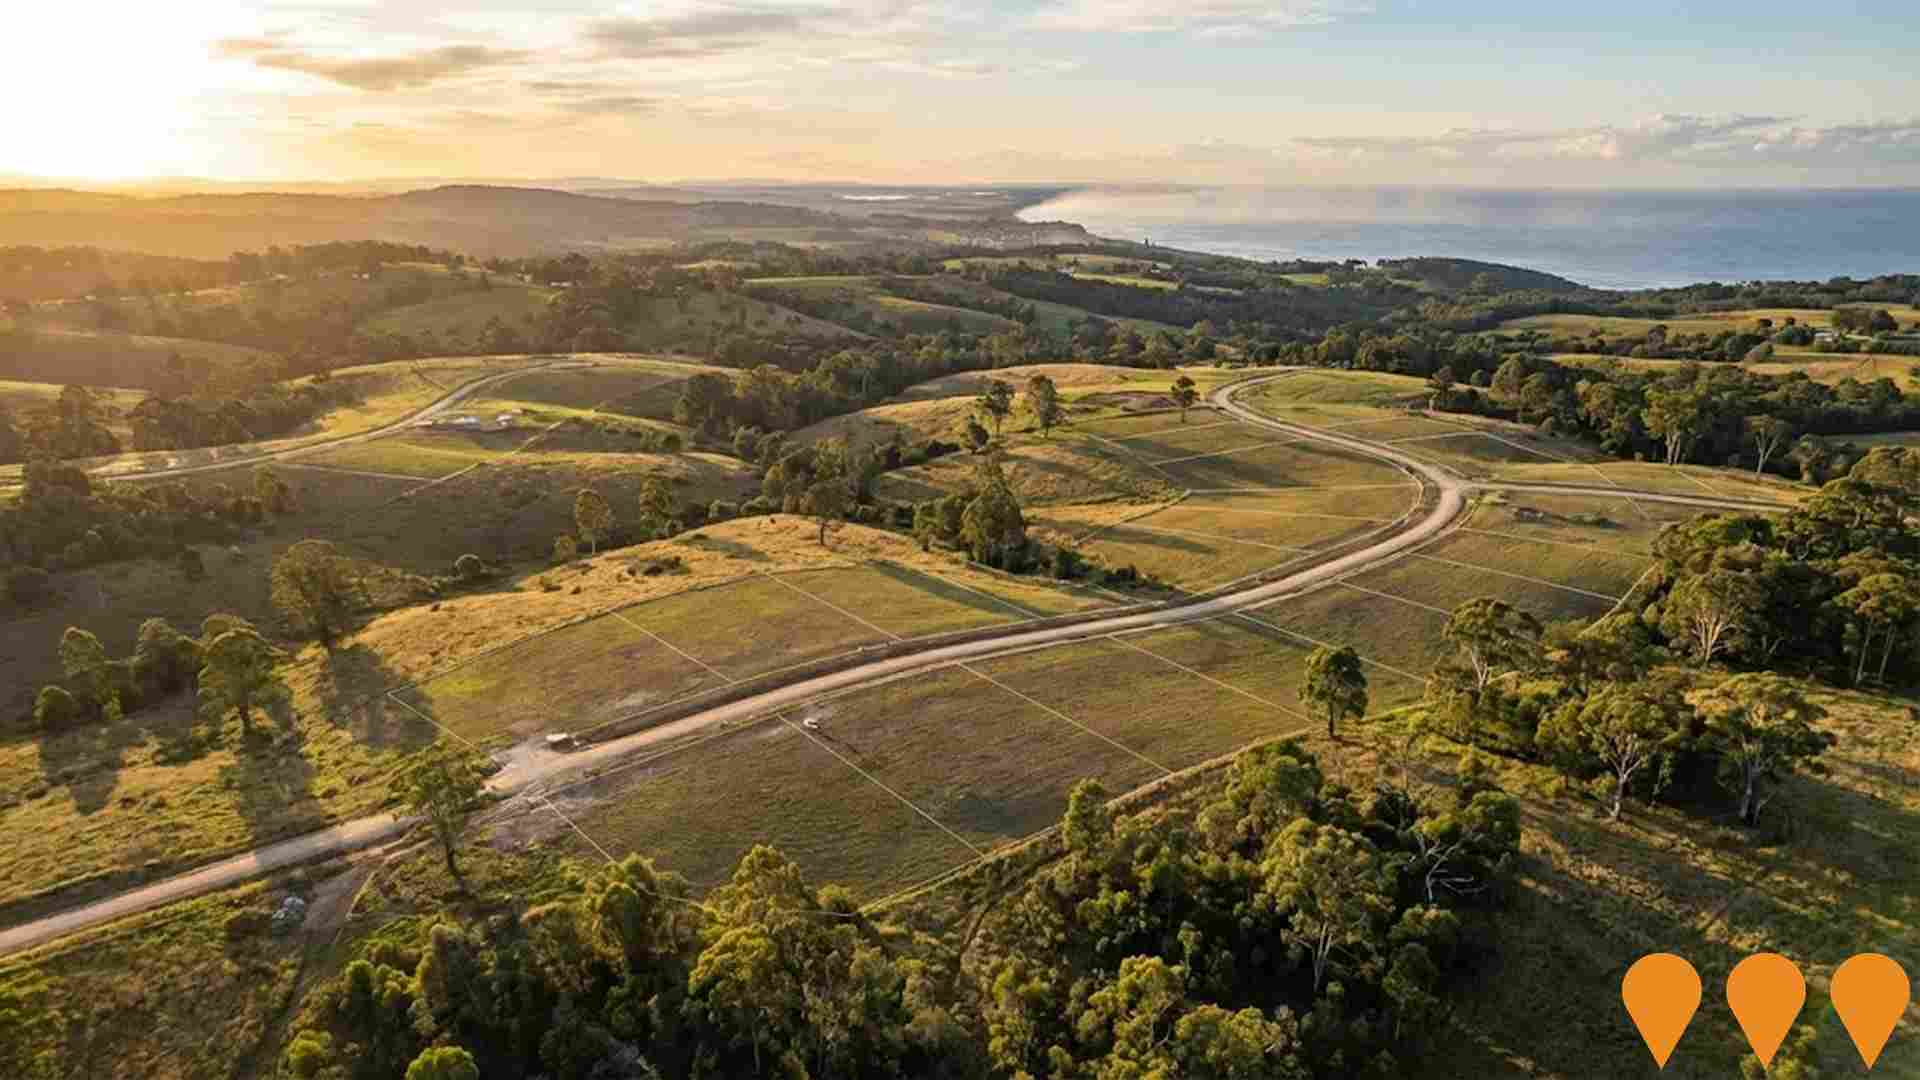
Changes to local infrastructure significantly influence an area's performance. AreaSearch has identified 24 projects that could impact the area. Notable projects include Murwillumbah Depot, Quarry Business Park, Animal Pound and Rehoming Centre, and Hundred Hills Estate. The following list details those likely to be most relevant.
Professional plan users can use the search below to filter and access additional projects.
INFRASTRUCTURE SEARCH
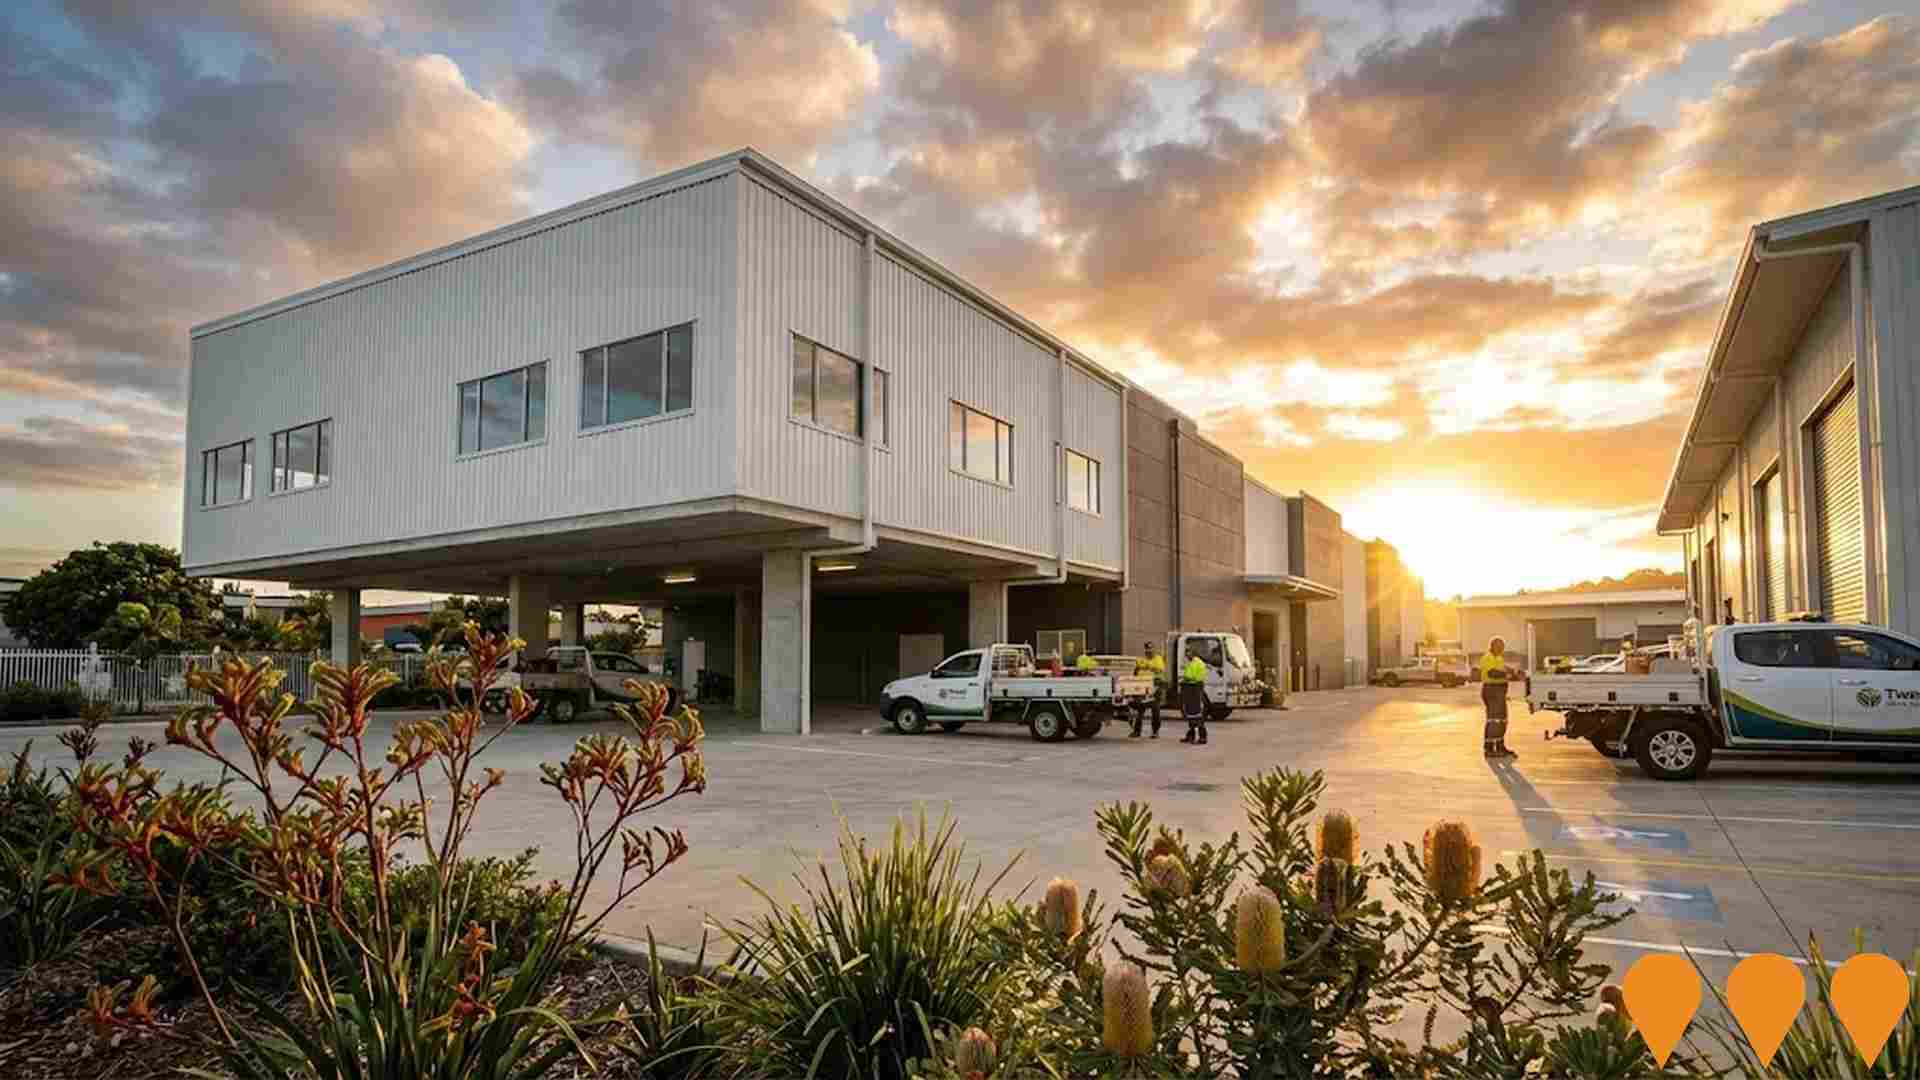
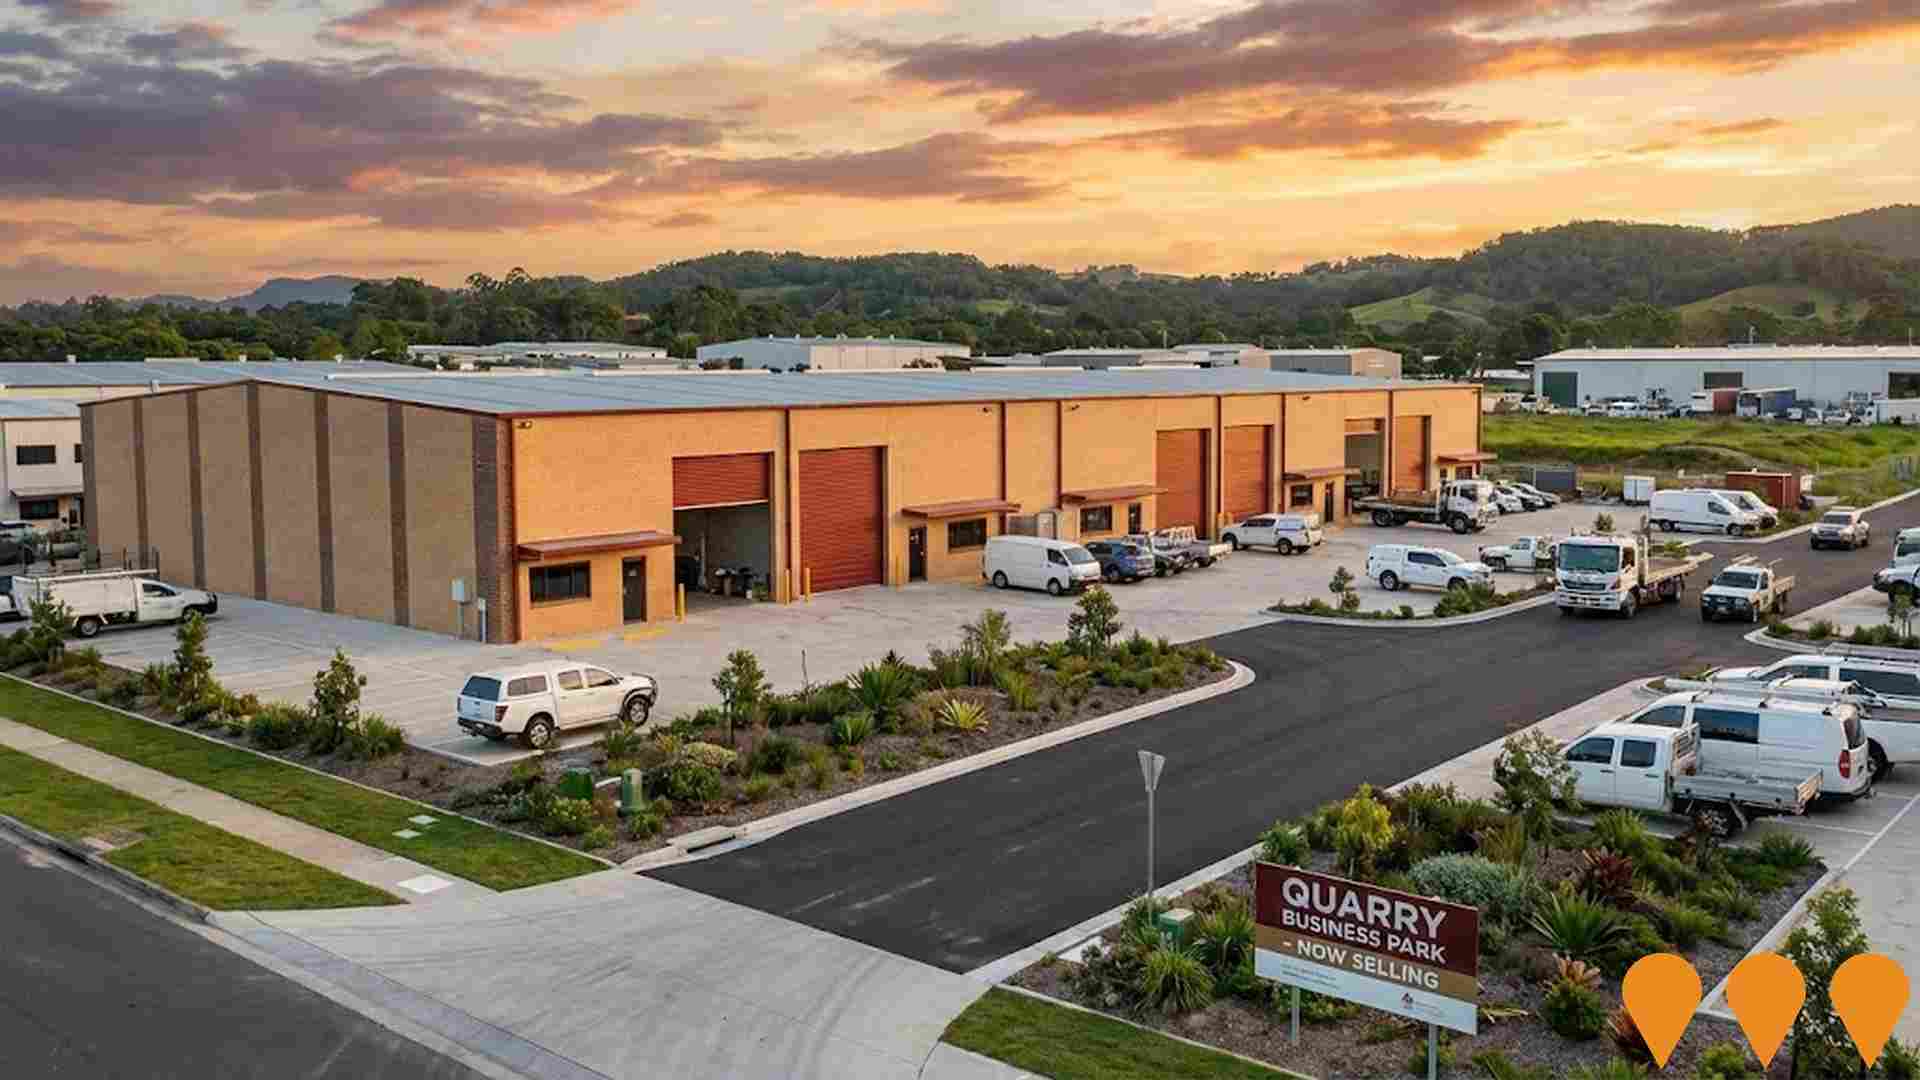
 Denotes AI-based impression for illustrative purposes only, not to be taken as definitive under any circumstances. Please follow links and conduct other investigations from the project's source for actual imagery. Developers and project owners wishing us to use original imagery please Contact Us and we will do so.
Frequently Asked Questions - Infrastructure
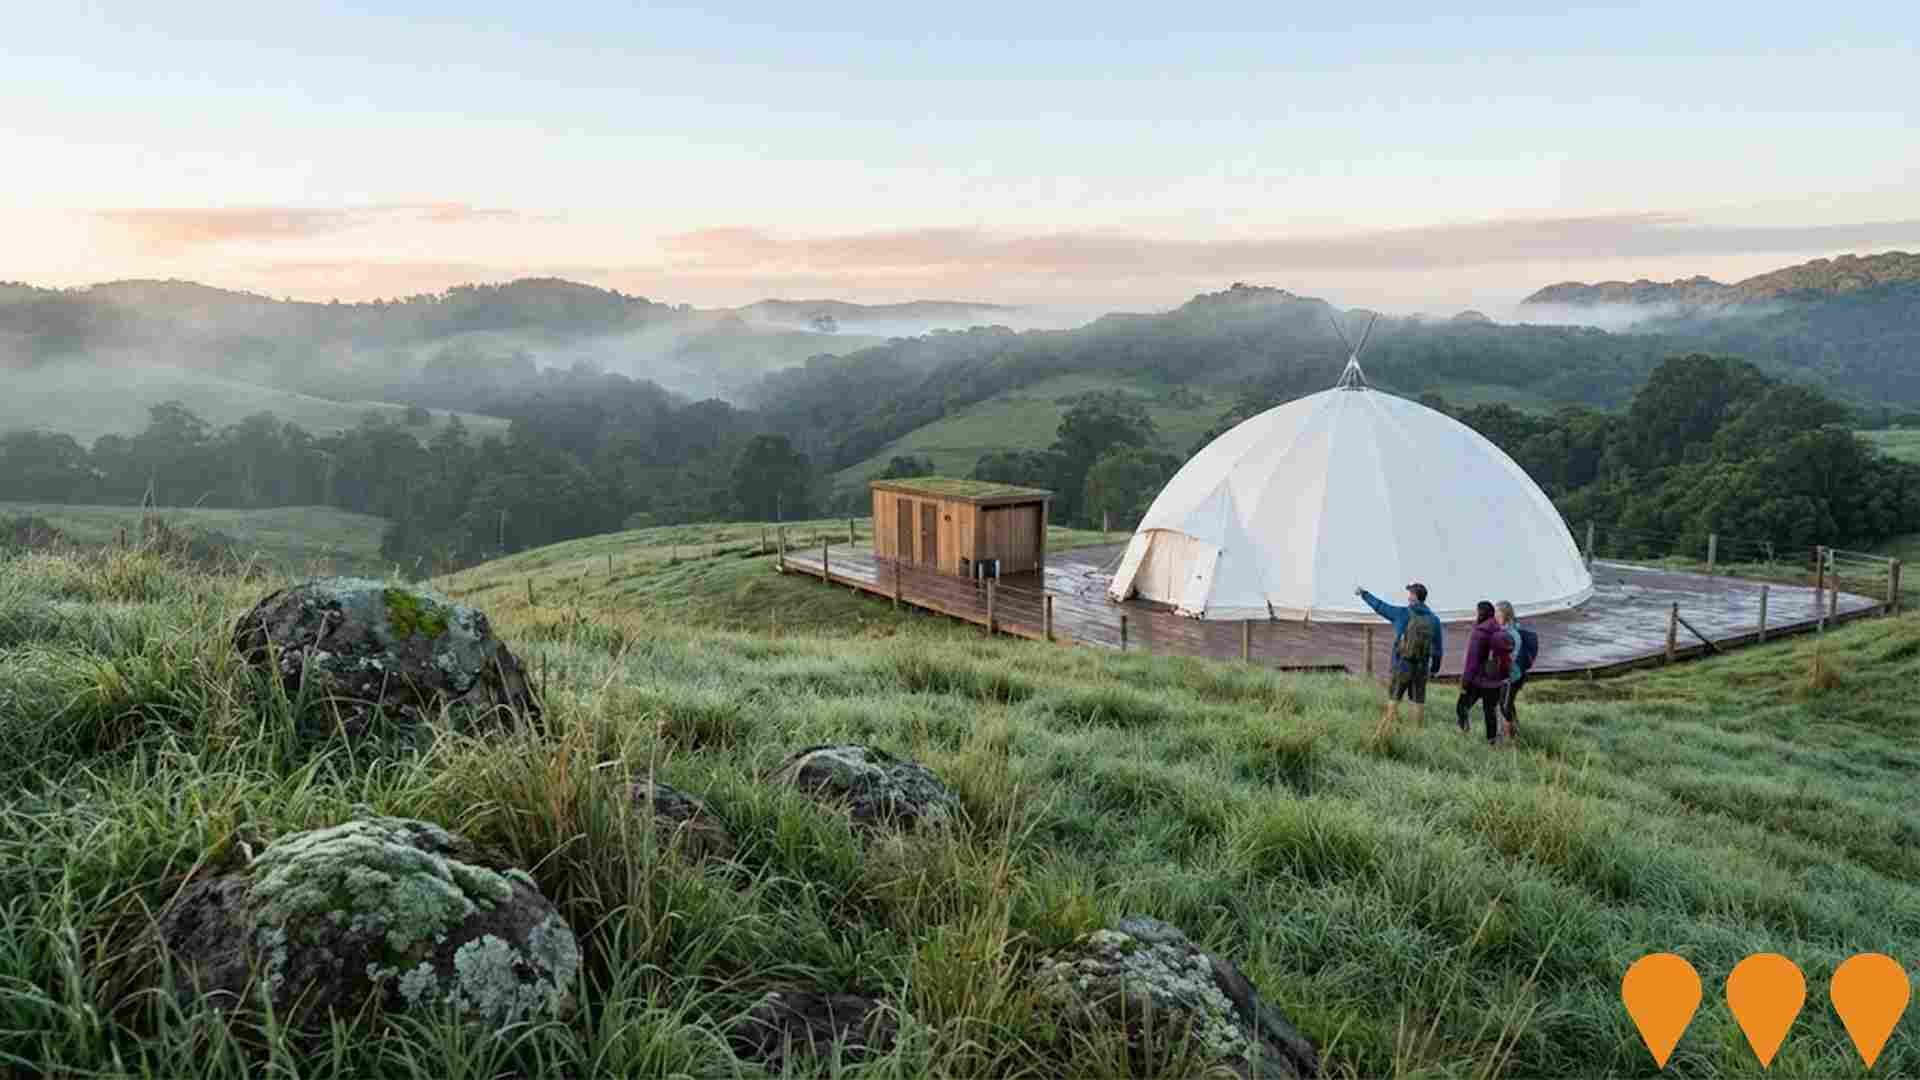
Clarrie Hall Dam Raise
Raising the Clarrie Hall Dam wall by 8.5 metres to increase storage capacity from 16,000 ML to 42,300 ML, providing long-term water security for Tweed Shire to beyond 2050 and improving flood mitigation downstream.

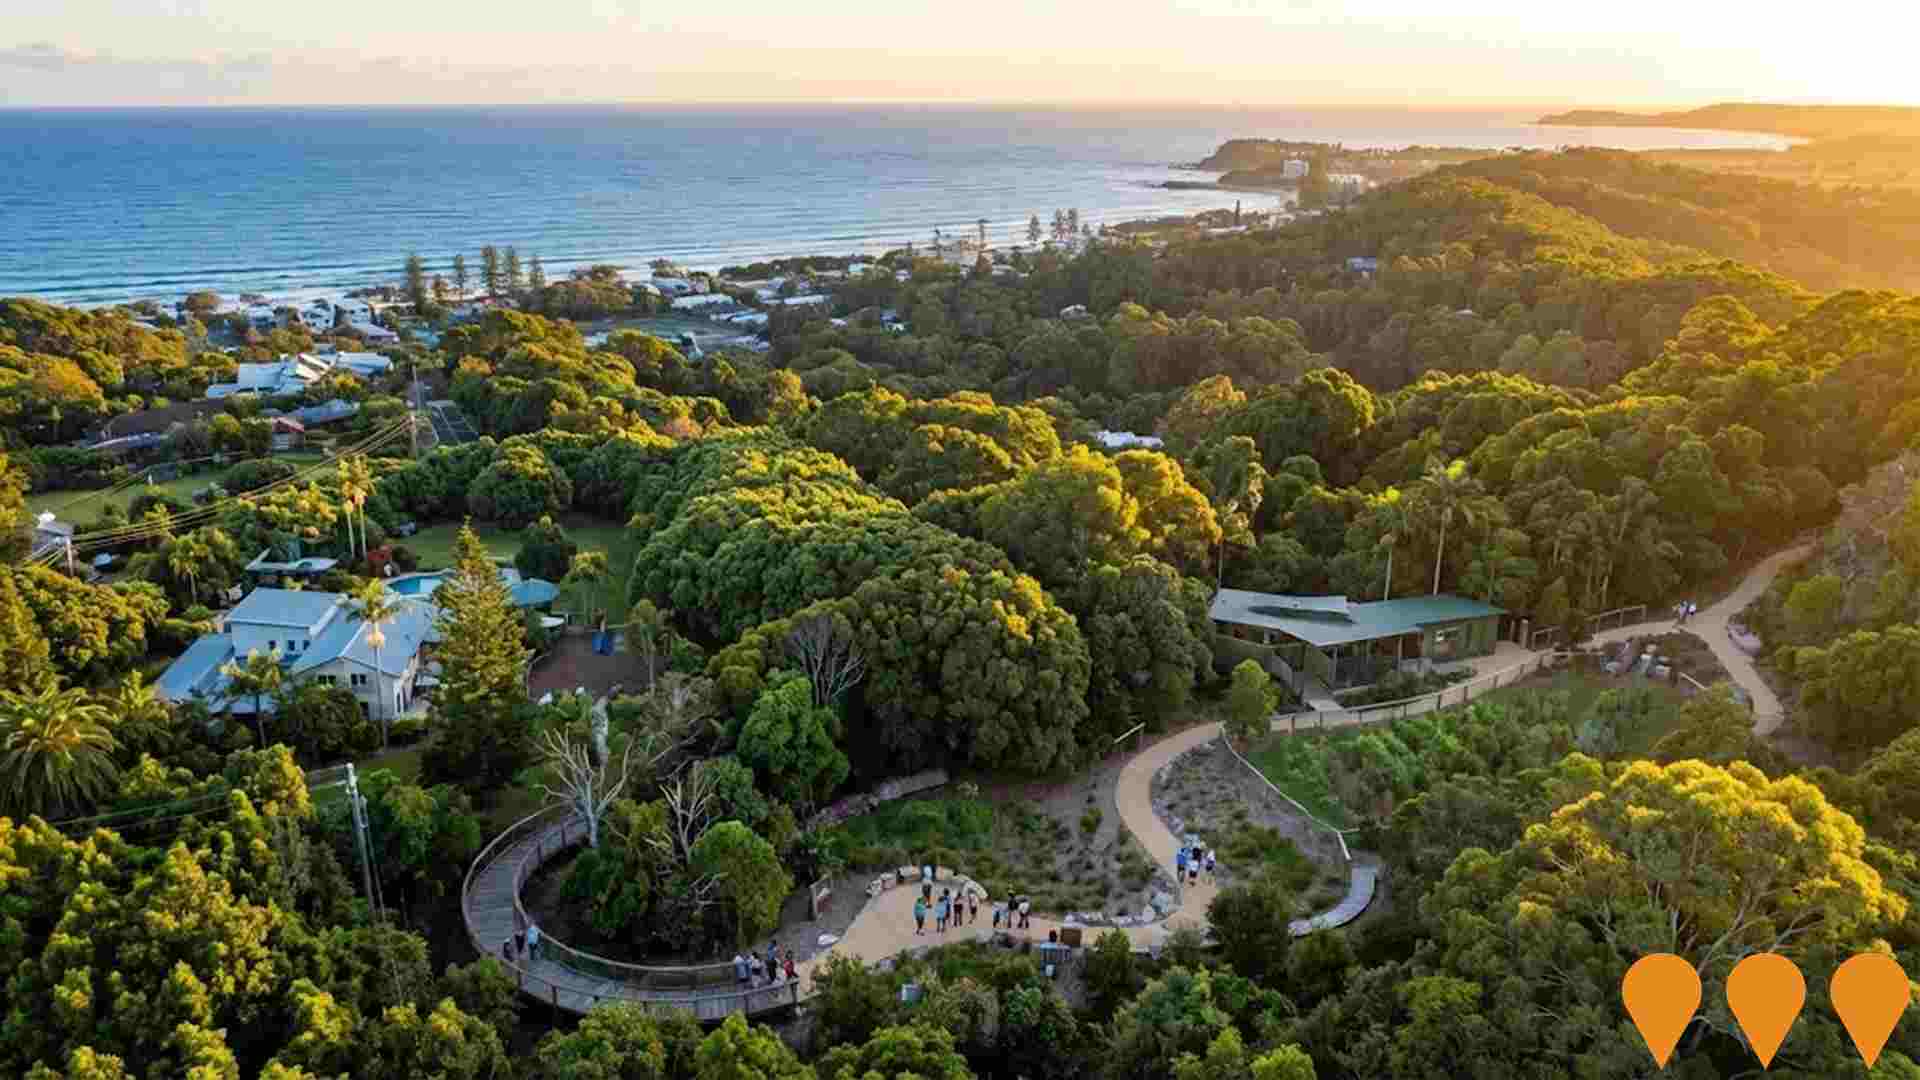
Currumbin Eco-Parkland
The Currumbin Eco-Parkland project will preserve a unique 148-hectare parcel of land at Currumbin, transforming it into one of Australia's largest eco-parks. The 'Activation Plan' (March 2024) outlines an initial phase of work, backed by a $31 million investment, which includes ecological restoration, wetland rehabilitation, new nature-based recreational trails, site amenities, and koala habitat protections, including a new koala facility and fodder plantation. This project aims to enhance the Gold Coast's reputation as a tourism destination while supporting wildlife conservation. Land acquisition was completed in late 2021, and ecological and civil works have commenced.
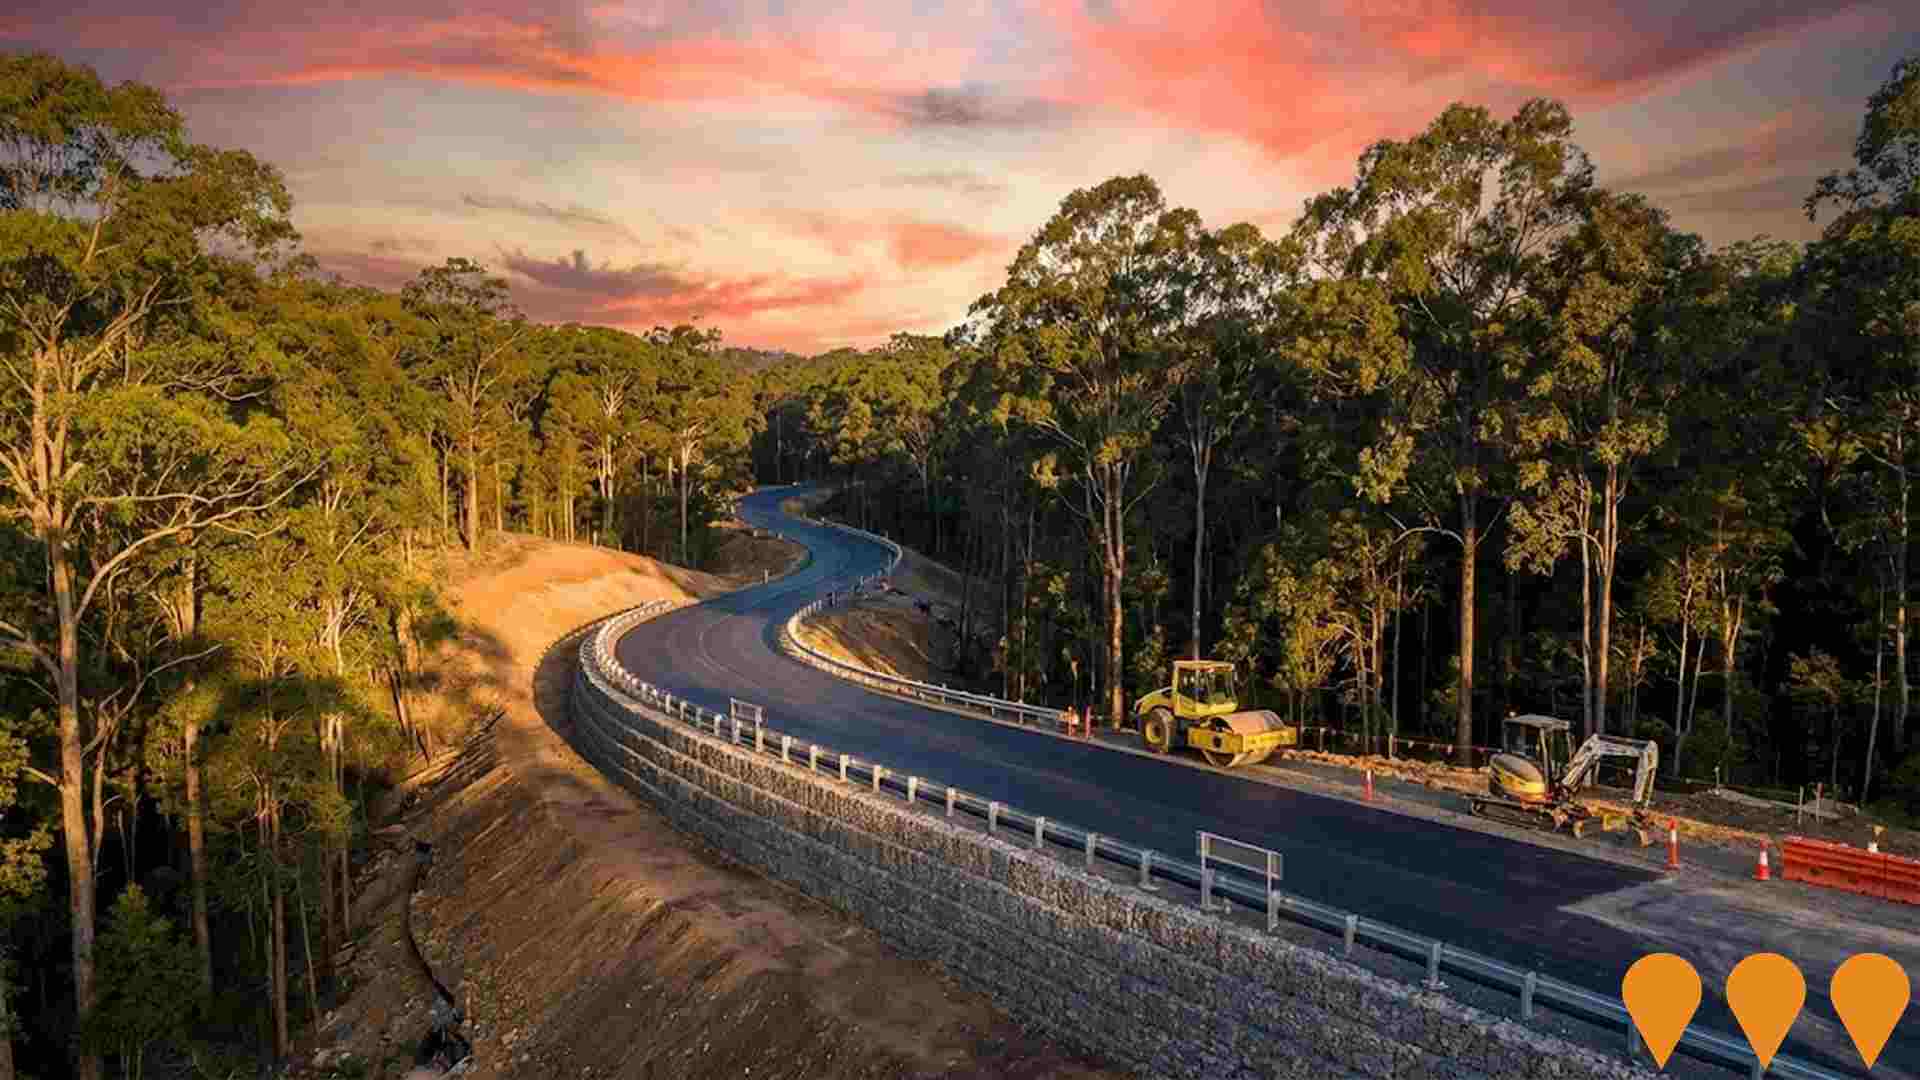
Industry Central Land Swap
A strategic land swap initiative by Tweed Shire Council to relocate businesses from flood-prone areas in South Murwillumbah to flood-free industrial land at Industry Central, enhancing economic resilience against future floods. Infrastructure works completed in March 2025, with businesses now preparing to build and relocate.

Northern Rivers Rail Trail - Tweed Section
A 24 km shared-use rail trail from Murwillumbah to Crabbes Creek along the former Casino-Murwillumbah railway corridor (Tweed Section). Part of the broader 132-134 km Northern Rivers Rail Trail. Features 18 restored railway bridges, 2 tunnels, accessible paths, and scenic rural views. Opened March 2023, developed by Tweed Shire Council to boost tourism, recreation, and the local economy. High usage has exceeded expectations with significant positive economic impact.

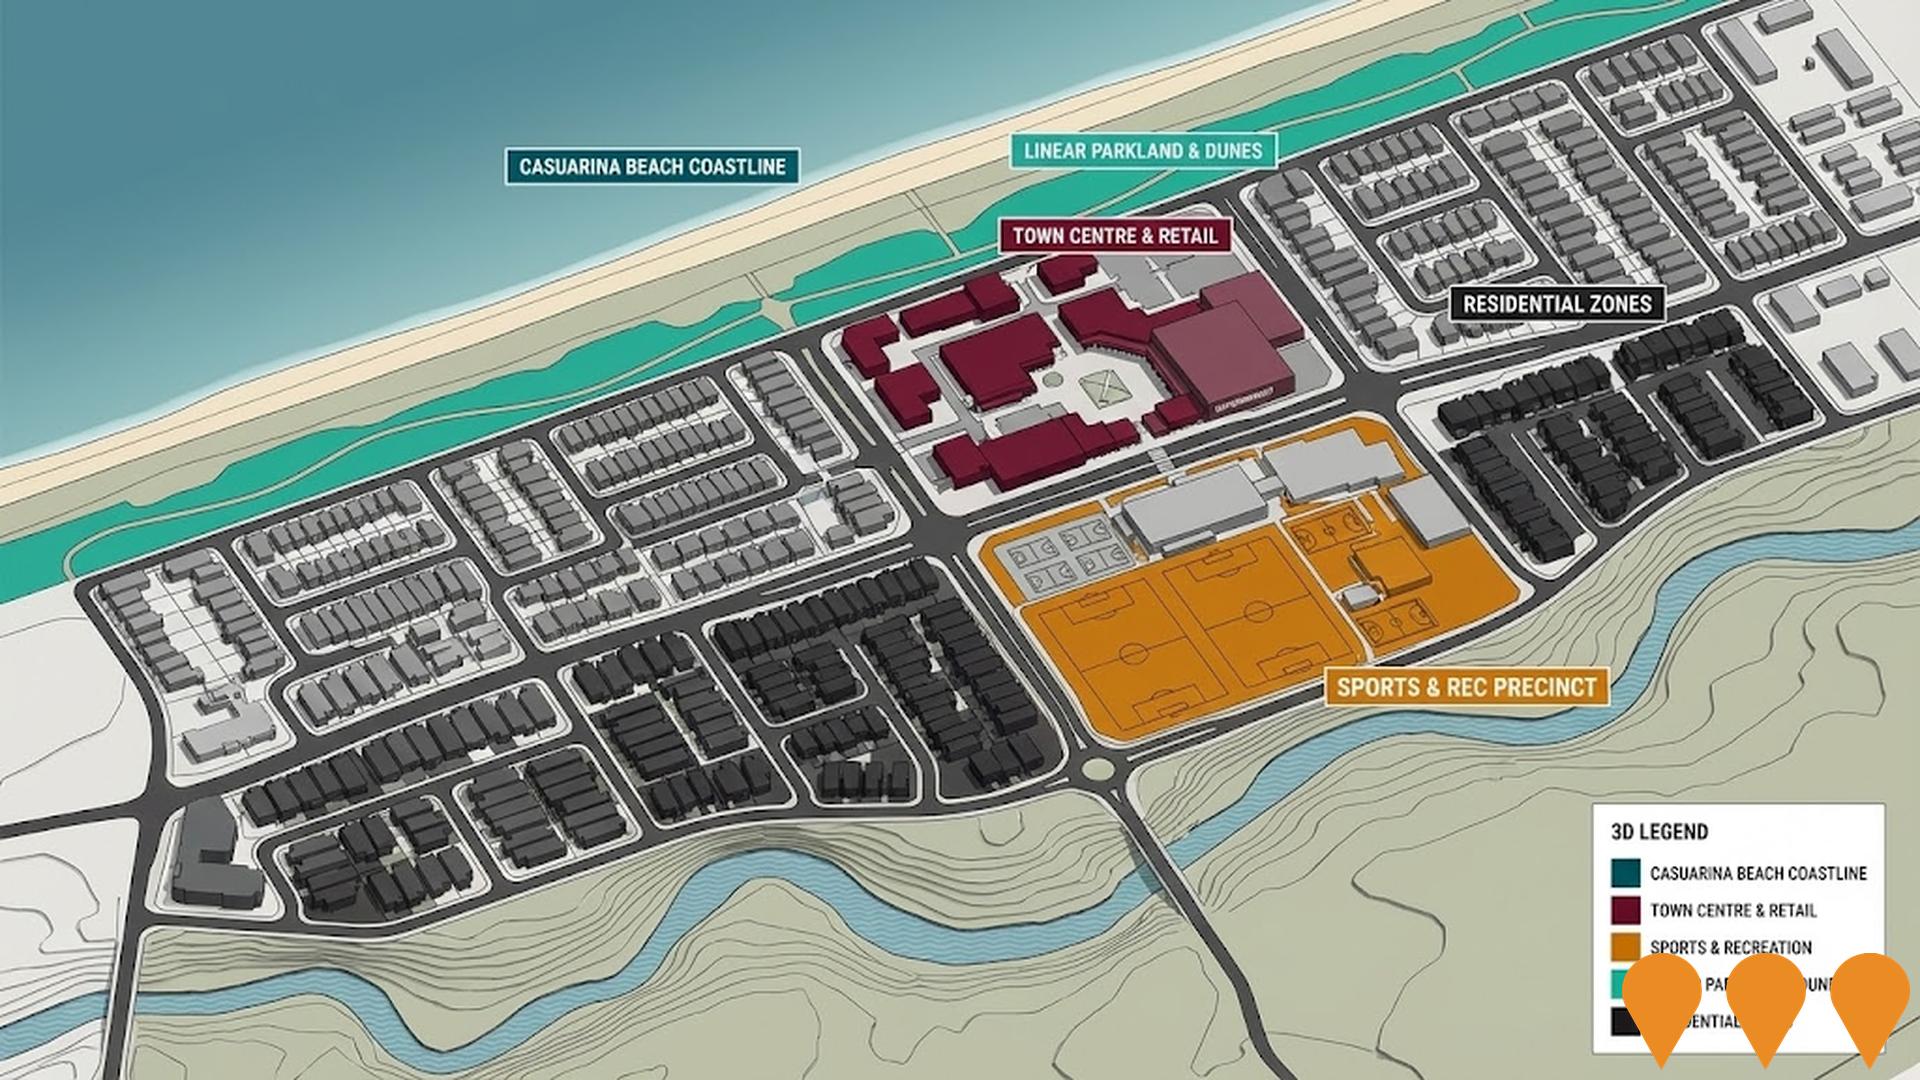
Casuarina Beach Development
A $1 billion, 15-year master-planned community with over 183 hectares of land on 3.5km of coastline. The land was a decommissioned coastal sand mine. The community has a resident population of approximately 7,000 people, featuring residential lots, town centre with Coles supermarket, 9-hectare sports and recreational centre, district shopping centre and 3.5km linear ocean-side parkland and dune protection area.
Animal Pound and Rehoming Centre
A state-of-the-art facility for impounding, sheltering, and rehoming animals, including veterinary care, animal enrichment spaces, administrative hub for Rangers and not-for-profit partners, housing up to 80 companion animals (40 dogs and 40 cats), and storage for impounded vehicles.

Murwillumbah Depot
A modern, purpose-built facility to support Council operations, including sustainability features like solar panels and EV charging, relocated via land swap for flood resilience. Construction commenced in May 2025 with completion expected in June 2026.
Quarry Business Park
A new industrial land estate in South Murwillumbah, offering 19 freehold lots ranging from 2,006m2 to 6,799m2, zoned E4 General Industrial, located in a historically flood-free setting within the regions key growth corridor, providing flexible, high-quality land with long-term value.
Employment
AreaSearch analysis reveals Murwillumbah Surrounds recording weaker employment conditions than most comparable areas nationwide
Murwillumbah Surrounds has an unemployment rate of 4.3% as of September 2025. It has a skilled workforce with diverse sector representation.
There are 5,023 residents in work while the unemployment rate is 0.5% higher than Rest of NSW's rate of 3.8%. Workforce participation is lower at 53.7%, compared to Rest of NSW's 56.4%. Leading employment industries include health care & social assistance, construction, and agriculture, forestry & fishing. The area has a notable concentration in agriculture, forestry & fishing, with employment levels at 1.8 times the regional average.
Public administration & safety employs only 4.6% of local workers, below Rest of NSW's 7.5%. Labour force decreased by 2.4% and employment declined by 2.0% over a 12-month period ending September 2025, causing unemployment to fall by 0.4 percentage points. In contrast, Rest of NSW experienced an employment decline of 0.5% and labour force decline of 0.1%, with a rise in unemployment of 0.4 percentage points. State-level data as of 25-Nov-25 shows NSW employment contracted by 0.03% (losing 2,260 jobs), with the state unemployment rate at 3.9%. National employment forecasts from May-25 estimate a growth of 6.6% over five years and 13.7% over ten years. Applying these projections to Murwillumbah Surrounds's employment mix suggests local employment should increase by 6.3% over five years and 13.2% over ten years, based on simple weighting extrapolation for illustrative purposes.
Frequently Asked Questions - Employment
Income
Income figures position the area below 75% of locations analysed nationally by AreaSearch
The median income among taxpayers in Murwillumbah Surrounds SA2 was $40,866 in financial year 2022. The average income stood at $51,563 during the same period. These figures are lower than those for Rest of NSW, which were $49,459 and $62,998 respectively. By September 2025, based on a Wage Price Index growth of 12.61%, estimated incomes would be approximately $46,019 (median) and $58,065 (average). According to the 2021 Census, household, family and personal incomes in Murwillumbah Surrounds fall between the 16th and 27th percentiles nationally. The income bracket of $1,500 - 2,999 captures 30.6% of the community (3,304 individuals), which is consistent with broader trends in the surrounding region at 29.9%. After housing costs, 85.7% of income remains, ranking at the 30th percentile nationally. The area's SEIFA income ranking places it in the 4th decile.
Frequently Asked Questions - Income
Housing
Murwillumbah Surrounds is characterized by a predominantly suburban housing profile, with above-average rates of outright home ownership
Murwillumbah Surrounds' dwelling structure, as per the latest Census, consisted of 98.5% houses and 1.5% other dwellings. In comparison, Non-Metro NSW had 66.3% houses and 33.8% other dwellings. Home ownership in Murwillumbah Surrounds was 48.5%, with mortgaged dwellings at 35.6% and rented ones at 15.9%. The median monthly mortgage repayment was $1,745, lower than Non-Metro NSW's average of $1,872. The median weekly rent in Murwillumbah Surrounds was $350, compared to Non-Metro NSW's $400. Nationally, mortgage repayments were lower at $1,745 than the Australian average of $1,863, and rents were less at $350 than the national figure of $375.
Frequently Asked Questions - Housing
Household Composition
Murwillumbah Surrounds features high concentrations of group households, with a higher-than-average median household size
Family households constitute 74.4% of all households, including 28.1% couples with children, 34.0% couples without children, and 11.5% single parent families. Non-family households account for the remaining 25.6%, with lone person households at 21.5% and group households comprising 4.0% of the total. The median household size is 2.6 people, which is larger than the Rest of NSW average of 2.4.
Frequently Asked Questions - Households
Local Schools & Education
Educational attainment in Murwillumbah Surrounds aligns closely with national averages, showing typical qualification patterns and performance metrics
Murwillumbah Surrounds' residents aged 15+ have 24.2% university degrees, compared to NSW's 32.2%, indicating potential for educational development. Bachelor degrees are most common at 16.8%, followed by postgraduate qualifications (4.5%) and graduate diplomas (2.9%). Vocational credentials are prominent, with 42.1% of residents holding them, including advanced diplomas (12.1%) and certificates (30.0%). Educational participation is high at 30.9%, with 11.2% in primary education, 9.6% in secondary education, and 3.6% pursuing tertiary education.
Educational participation is notably high, with 30.9% of residents currently enrolled in formal education. This includes 11.2% in primary education, 9.6% in secondary education, and 3.6% pursuing tertiary education.
Frequently Asked Questions - Education
Schools Detail
Nearby Services & Amenities
Transport
Transport servicing is moderate compared to other areas nationally based on assessment of service frequency, route connectivity and accessibility
The analysis of public transport in Murwillumbah Surrounds indicates that there are 582 active transport stops currently operating. These stops serve a mix of bus routes, with a total of 59 individual routes providing service to the area. Together, these routes facilitate 697 weekly passenger trips.
The accessibility of transport is rated as excellent, with residents typically located within 150 meters from their nearest transport stop. On average, there are 99 trips per day across all routes, which equates to approximately one weekly trip per individual stop.
Frequently Asked Questions - Transport
Transport Stops Detail
Health
Murwillumbah Surrounds's residents are relatively healthy in comparison to broader Australia with a fairly standard level of common health conditions seen across both young and old age cohorts
Murwillumbah Surrounds' health metrics closely align with national benchmarks. Common health conditions are seen across both young and old age groups. Private health cover is extremely low at approximately 46% of the total population (~5,010 people), compared to 49.3% in Rest of NSW and a national average of 55.3%.
The most prevalent medical conditions are arthritis (9.4%) and mental health issues (7.9%). 68.3% of residents report no medical ailments, compared to 64.2% in Rest of NSW. 22.7% of residents are aged 65 and over (2,453 people), lower than the 26.1% in Rest of NSW. Health outcomes among seniors are strong and perform better than the general population in health metrics.
Frequently Asked Questions - Health
Cultural Diversity
Murwillumbah Surrounds is considerably less culturally diverse than average when assessed alongside AreaSearch's national rankings for language and cultural background related metrics
Murwillumbah Surrounds, as per the findings, exhibited lower cultural diversity with 85.5% of its population being citizens, 85.7% born in Australia, and 95.5% speaking English only at home. Christianity was the predominant religion, comprising 42.2% of people in Murwillumbah Surrounds. The most notable overrepresentation was seen in Judaism, with 0.2% of the population compared to the same percentage across Rest of NSW.
Regarding ancestry, the top three groups were English at 32.3%, Australian at 28.9%, and Irish at 10.5%. Notably, Scottish, French, and Welsh ethnicities showed similar representations to regional averages: Scottish at 8.7% (vs 8.7%), French at 0.6% (vs 0.5%), and Welsh at 0.6% (vs 0.6%).
Frequently Asked Questions - Diversity
Age
Murwillumbah Surrounds hosts an older demographic, ranking in the top quartile nationwide
Murwillumbah Surrounds has a median age of 47 years, which is significantly higher than the Rest of NSW average of 43 and substantially exceeds the national average of 38 years. The age profile shows that those aged 55-64 are particularly prominent, making up 16.8% of the population, while the 25-34 group comprises only 8.0%. This concentration of 55-64 year-olds is well above the national average of 11.2%. Between 2021 and present, the 75 to 84 age group has grown from 5.2% to 6.6%, while the 15 to 24 cohort has increased from 10.1% to 11.3%. Conversely, the 55 to 64 cohort has declined from 18.9% to 16.8%, and the 45 to 54 group has dropped from 14.0% to 12.9%. By 2041, Murwillumbah Surrounds is expected to see notable shifts in its age composition. The 75 to 84 group is projected to grow by 54%, adding 384 people and reaching a total of 1,095 from the current 710. The 65 to 74 group is expected to display more modest growth, with an increase of only 2% and an addition of 35 residents.
