Chart Color Schemes
This analysis uses ABS Statistical Areas Level 2 (SA2) boundaries, which can materially differ from Suburbs and Localities (SAL) even when sharing similar names.
SA2 boundaries are defined by the Australian Bureau of Statistics and are designed to represent communities for statistical reporting (e.g., census and ERP).
Suburbs and Localities (SAL) represent commonly-used suburb/locality names (postal-style areas) and may use different geographic boundaries. For comprehensive analysis, consider reviewing both boundary types if available.
est. as @ -- *
ABS ERP | -- people | --
2021 Census | -- people
Sales Activity
Curious about local property values? Filter the chart to assess the volume and appreciation (including resales) trends and regional comparisons, or scroll to the map below view this information at an individual property level.
Find a Recent Sale
Sales Detail
Population
An assessment of population growth drivers in Erina - Green Point reveals an overall ranking slightly below national averages considering recent, and medium term trends
Erina - Green Point's population was 14,734 as of November 2025, a decrease of 24 people from the 2021 Census figure of 14,758. This decline is inferred from an estimated resident population of 14,706 in June 2024 and 153 validated new addresses since the Census date. The population density was 436 persons per square kilometer. While Erina - Green Point saw a 0.2% decrease since the census, the surrounding SA3 area grew by 2.3%. Overseas migration contributed approximately 64.6% of recent population gains in the area. AreaSearch uses ABS/Geoscience Australia projections for each SA2 area released in 2024 with a base year of 2022, and NSW State Government's SA2 level projections for areas not covered by this data, released in 2022 with a base year of 2021.
Growth rates by age group are applied to all areas from 2032 to 2041. Population projections indicate an increase just below the median of national statistical areas, with Erina - Green Point expected to expand by 998 persons to 2041, reflecting a total gain of 6.4% over the 17 years.
Frequently Asked Questions - Population
Development
AreaSearch assessment of residential development drivers sees a low level of activity in Erina - Green Point, placing the area among the bottom 25% of areas assessed nationally
Erina - Green Point has seen approximately 24 dwellings receiving development approval annually. Over the past five financial years, from FY-21 to FY-25124 homes were approved, with a further 5 approved in FY-26. Despite a declining population in recent years, this level of development activity has been adequate relative to other areas, potentially benefiting buyers.
The average construction cost value for new dwellings is $494,000, indicating that developers are targeting the premium market segment with higher-end properties. In FY-26, $26.9 million in commercial development approvals have been recorded, suggesting moderate levels of commercial development. Compared to Greater Sydney, Erina - Green Point has significantly less development activity, 56.0% below the regional average per person. This constrained new construction typically reinforces demand and pricing for existing dwellings, although building activity has accelerated in recent years. The area's development activity is also below average nationally, reflecting its maturity and potentially indicating planning constraints. New development consists of 53.0% detached houses and 47.0% attached dwellings, with a growing mix of townhouses and apartments offering options across different price points.
This marks a significant shift from existing housing patterns, which are currently 84.0% houses, suggesting diminishing developable land availability and responding to evolving lifestyle preferences and housing affordability needs. The estimated population density is 592 people per dwelling approval, reflecting its quiet, low activity development environment. According to the latest AreaSearch quarterly estimate, Erina - Green Point is expected to grow by 944 residents through to 2041. Construction is maintaining a reasonable pace with projected growth, although buyers may face growing competition as population increases.
Frequently Asked Questions - Development
Infrastructure
Erina - Green Point has moderate levels of nearby infrastructure activity, ranking in the 43rdth percentile nationally
Changes to local infrastructure significantly impact an area's performance. AreaSearch has identified 55 projects that may affect this region. Notable ones include Green Point Foreshore Masterplan & Reserve Upgrades, Green Point Shopping Village Expansion, Central Coast Grammar School Campus Expansion, and Broadlands Estate Green Point. The following list details those most relevant.
Professional plan users can use the search below to filter and access additional projects.
INFRASTRUCTURE SEARCH
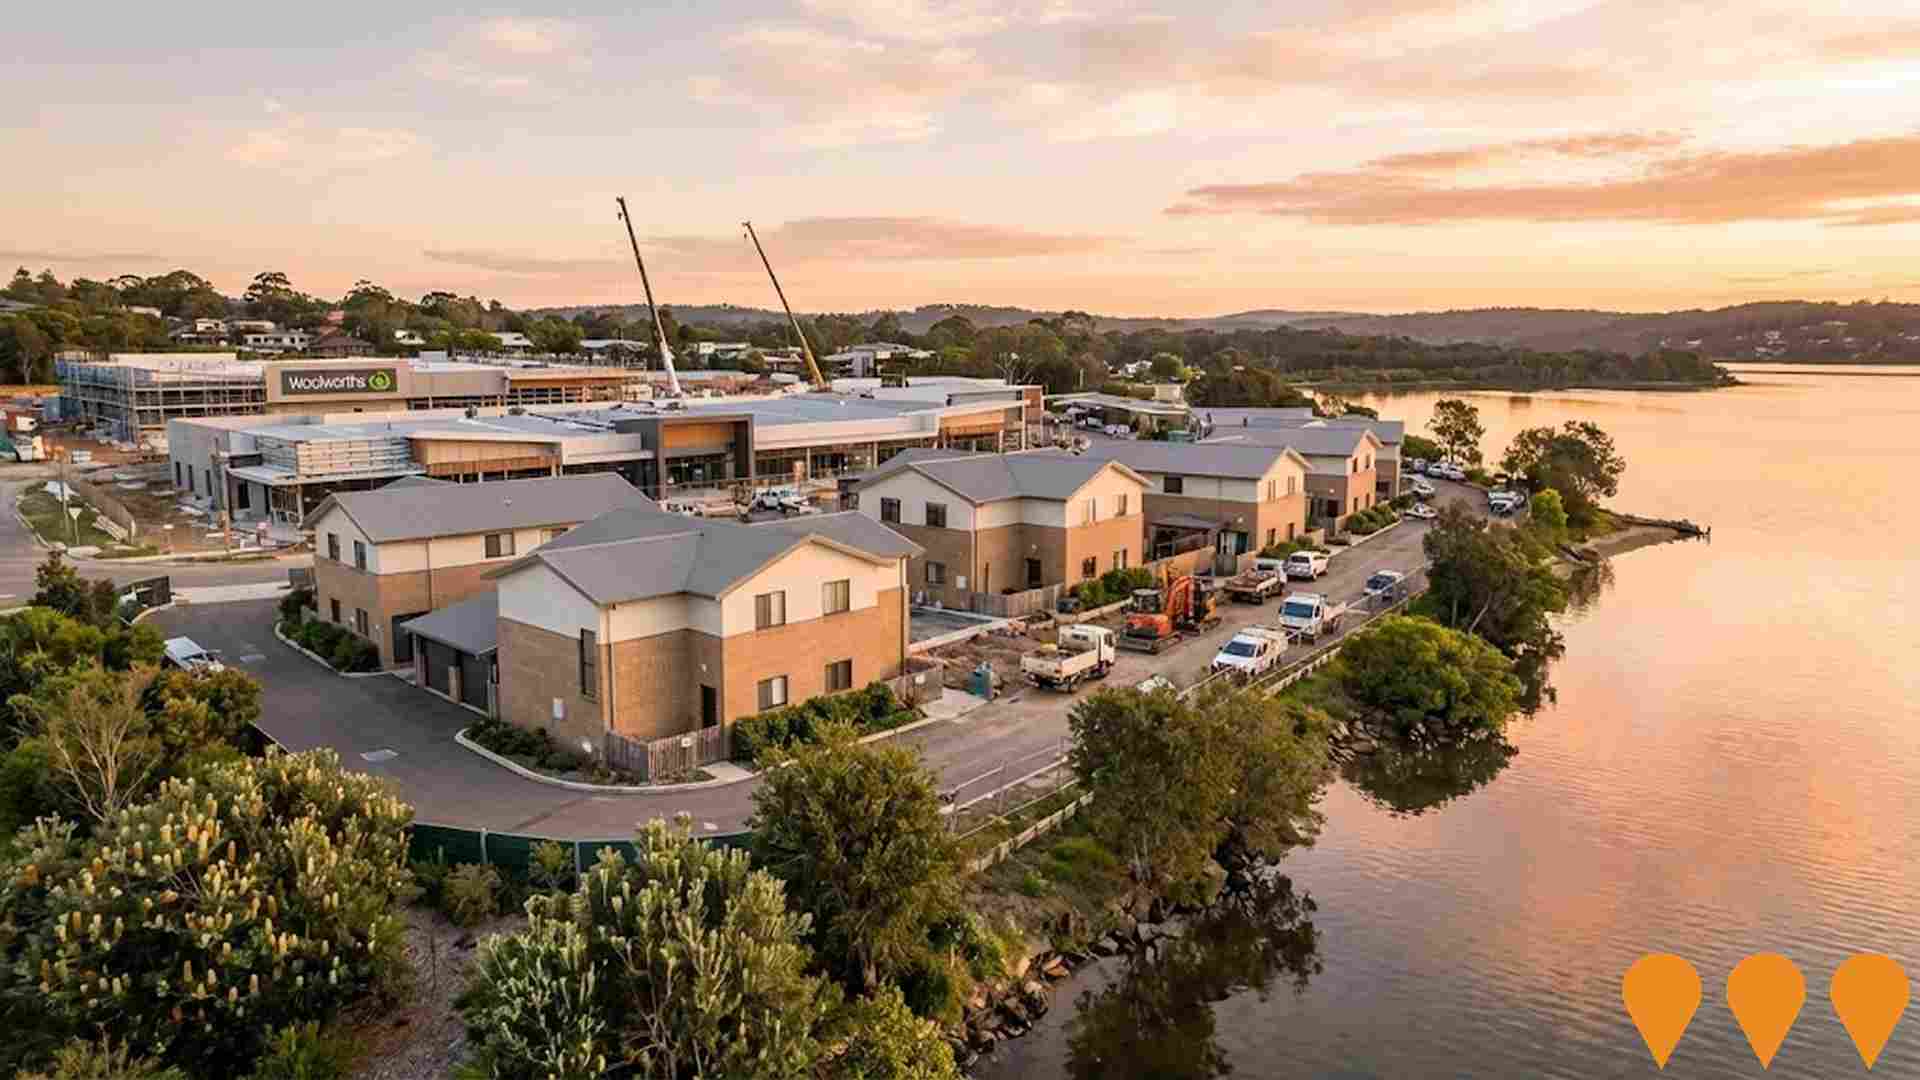
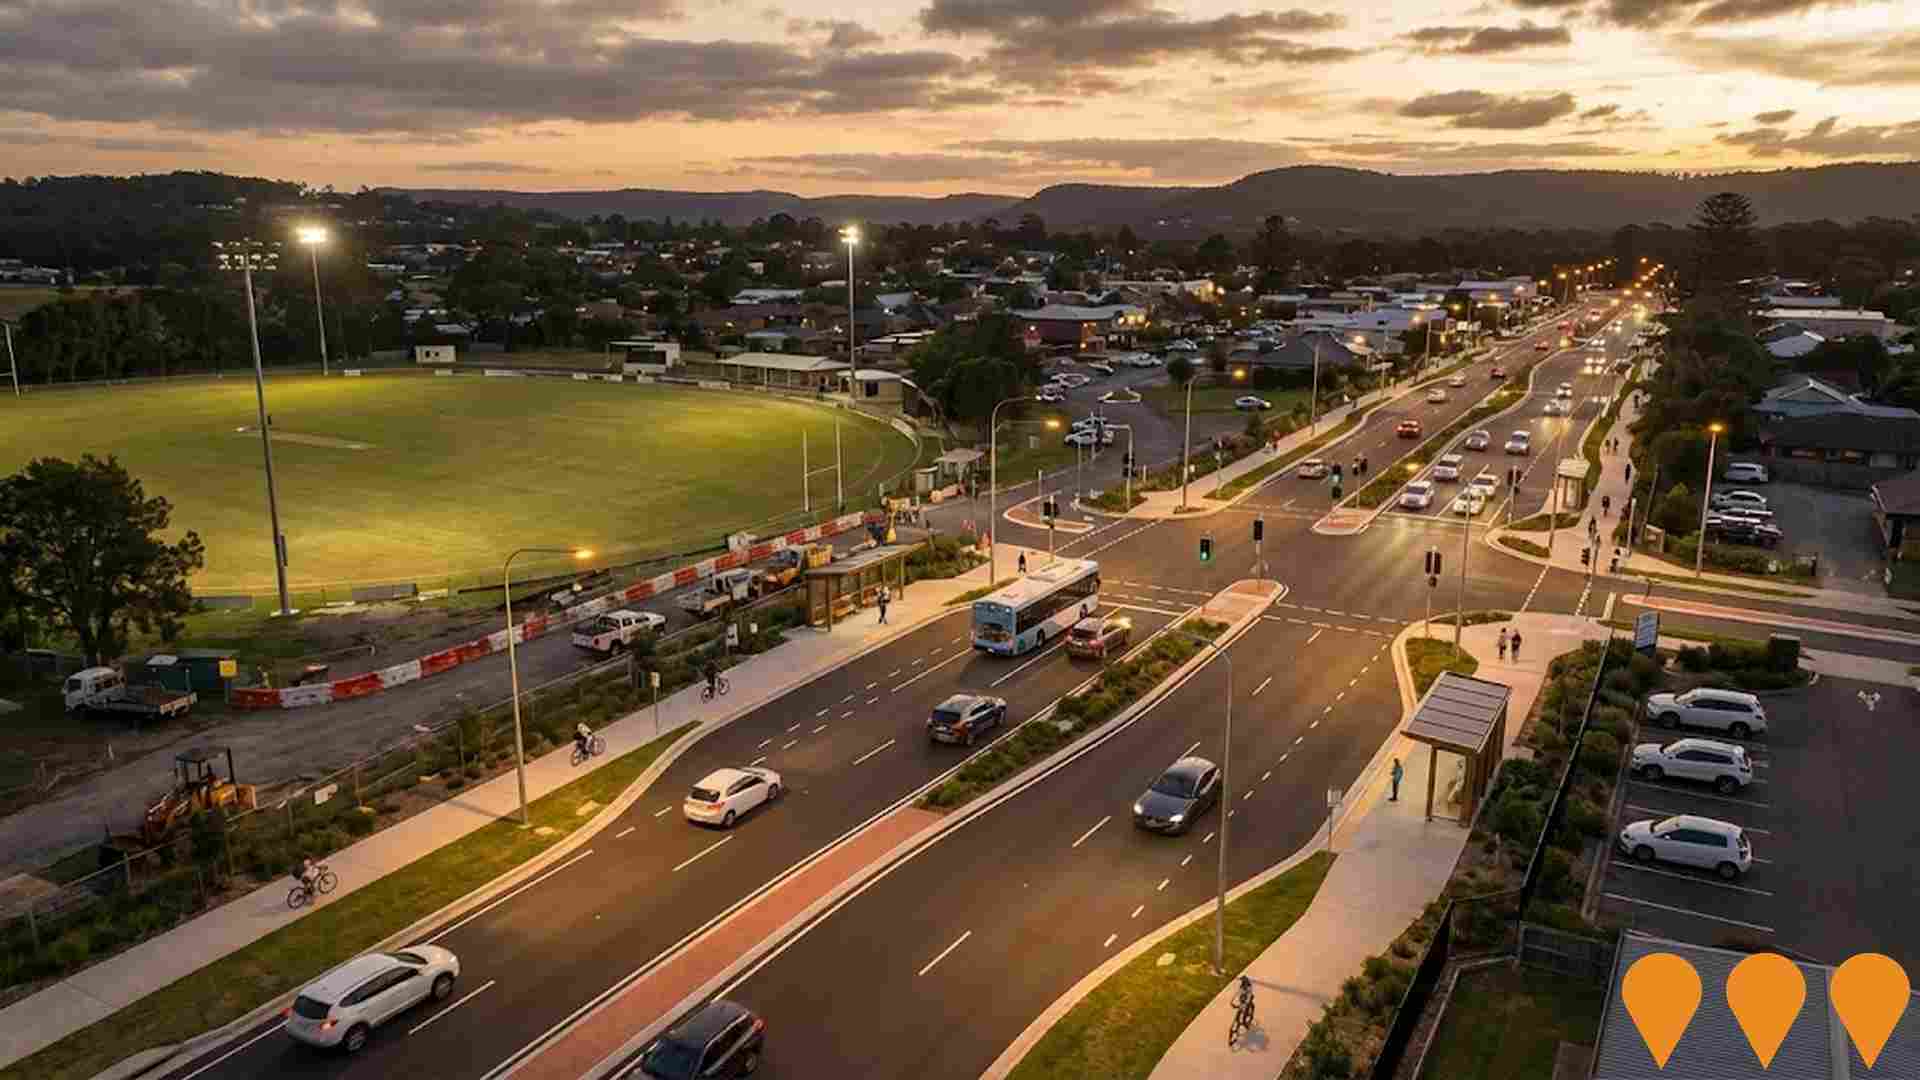
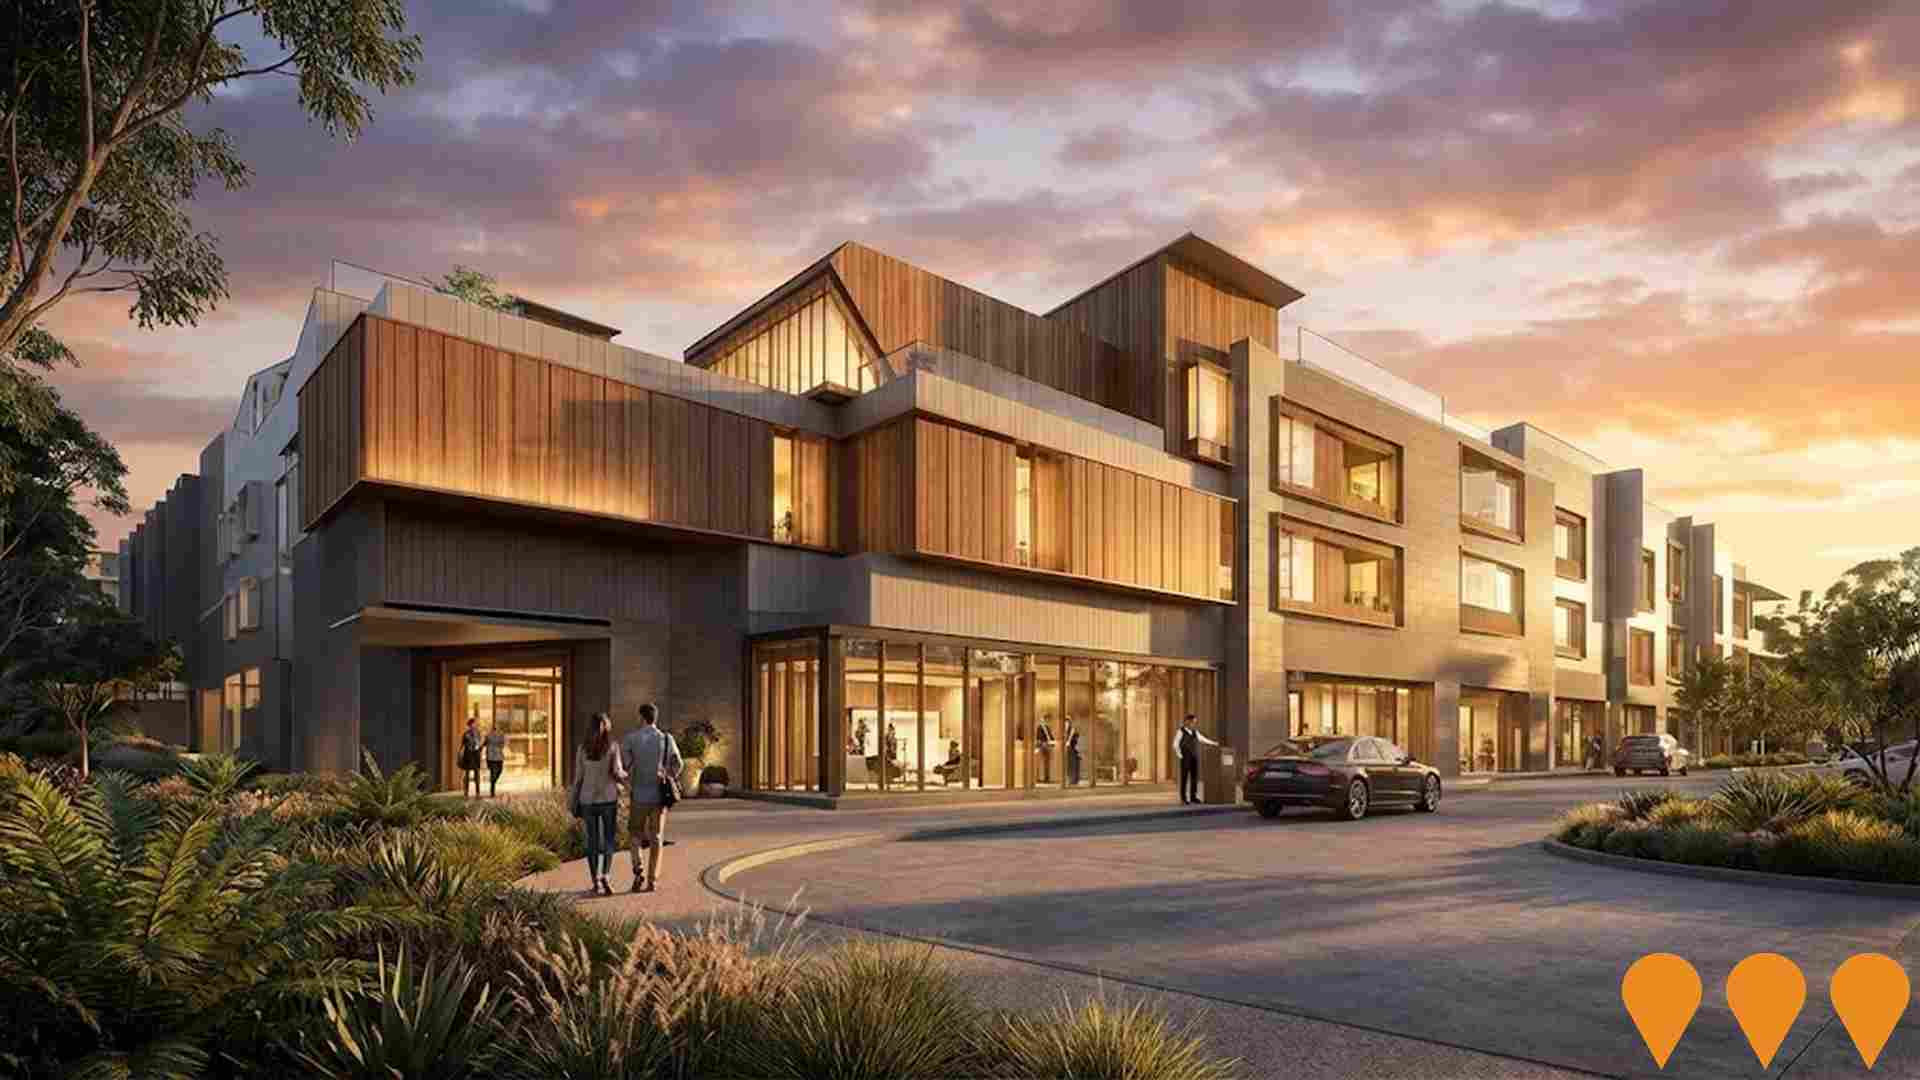
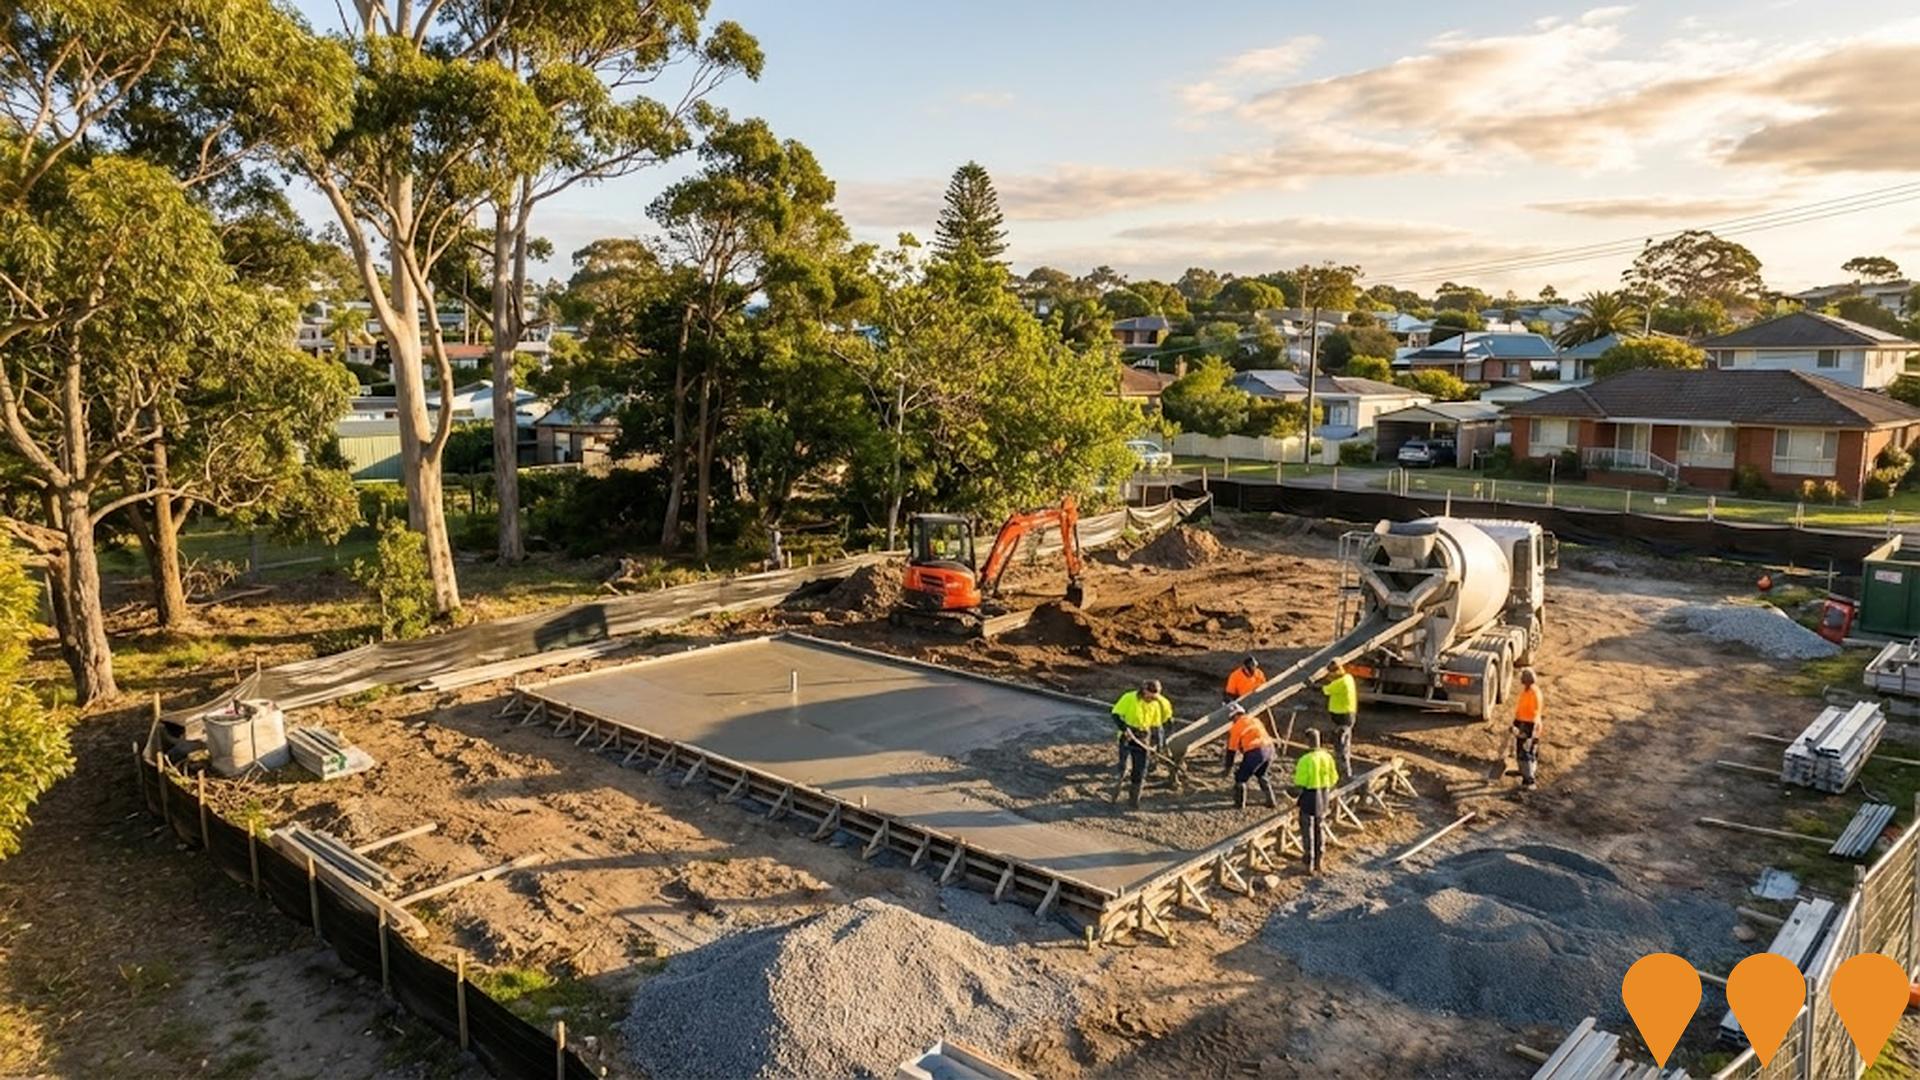
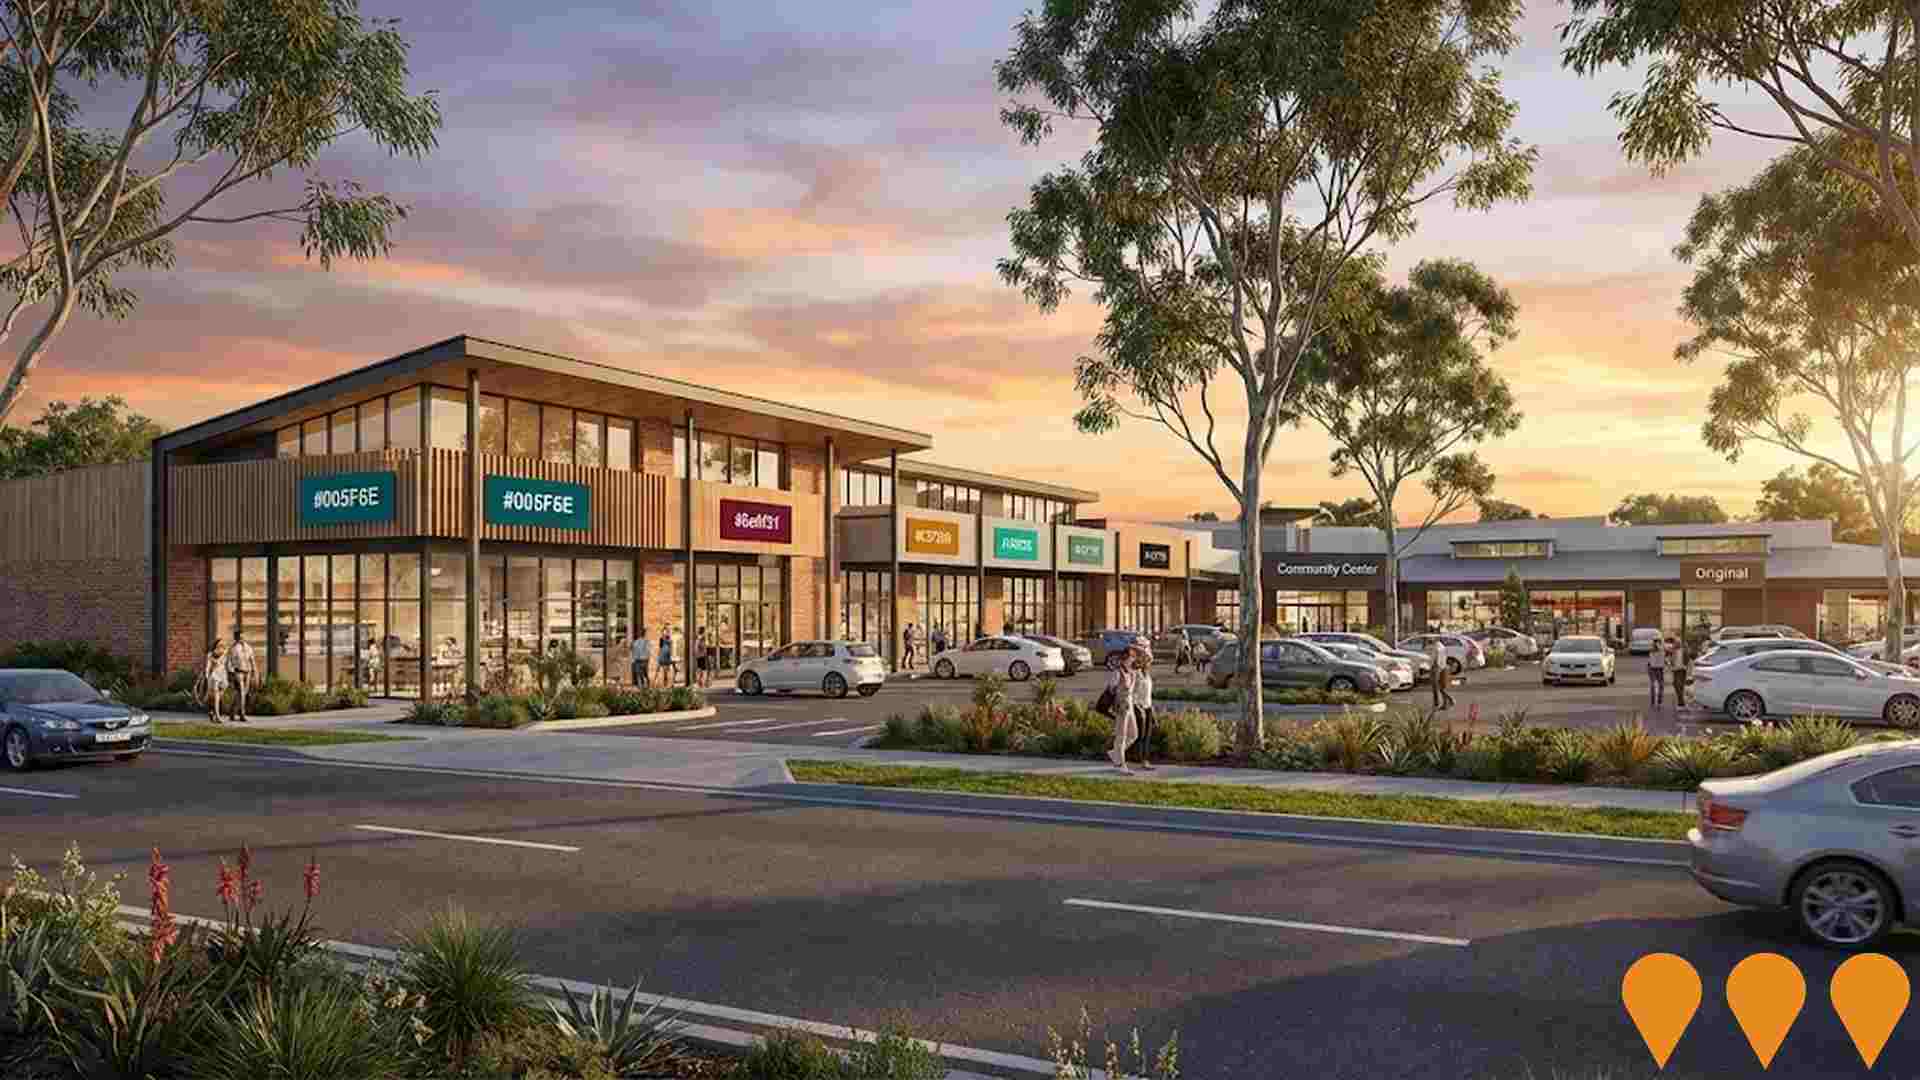
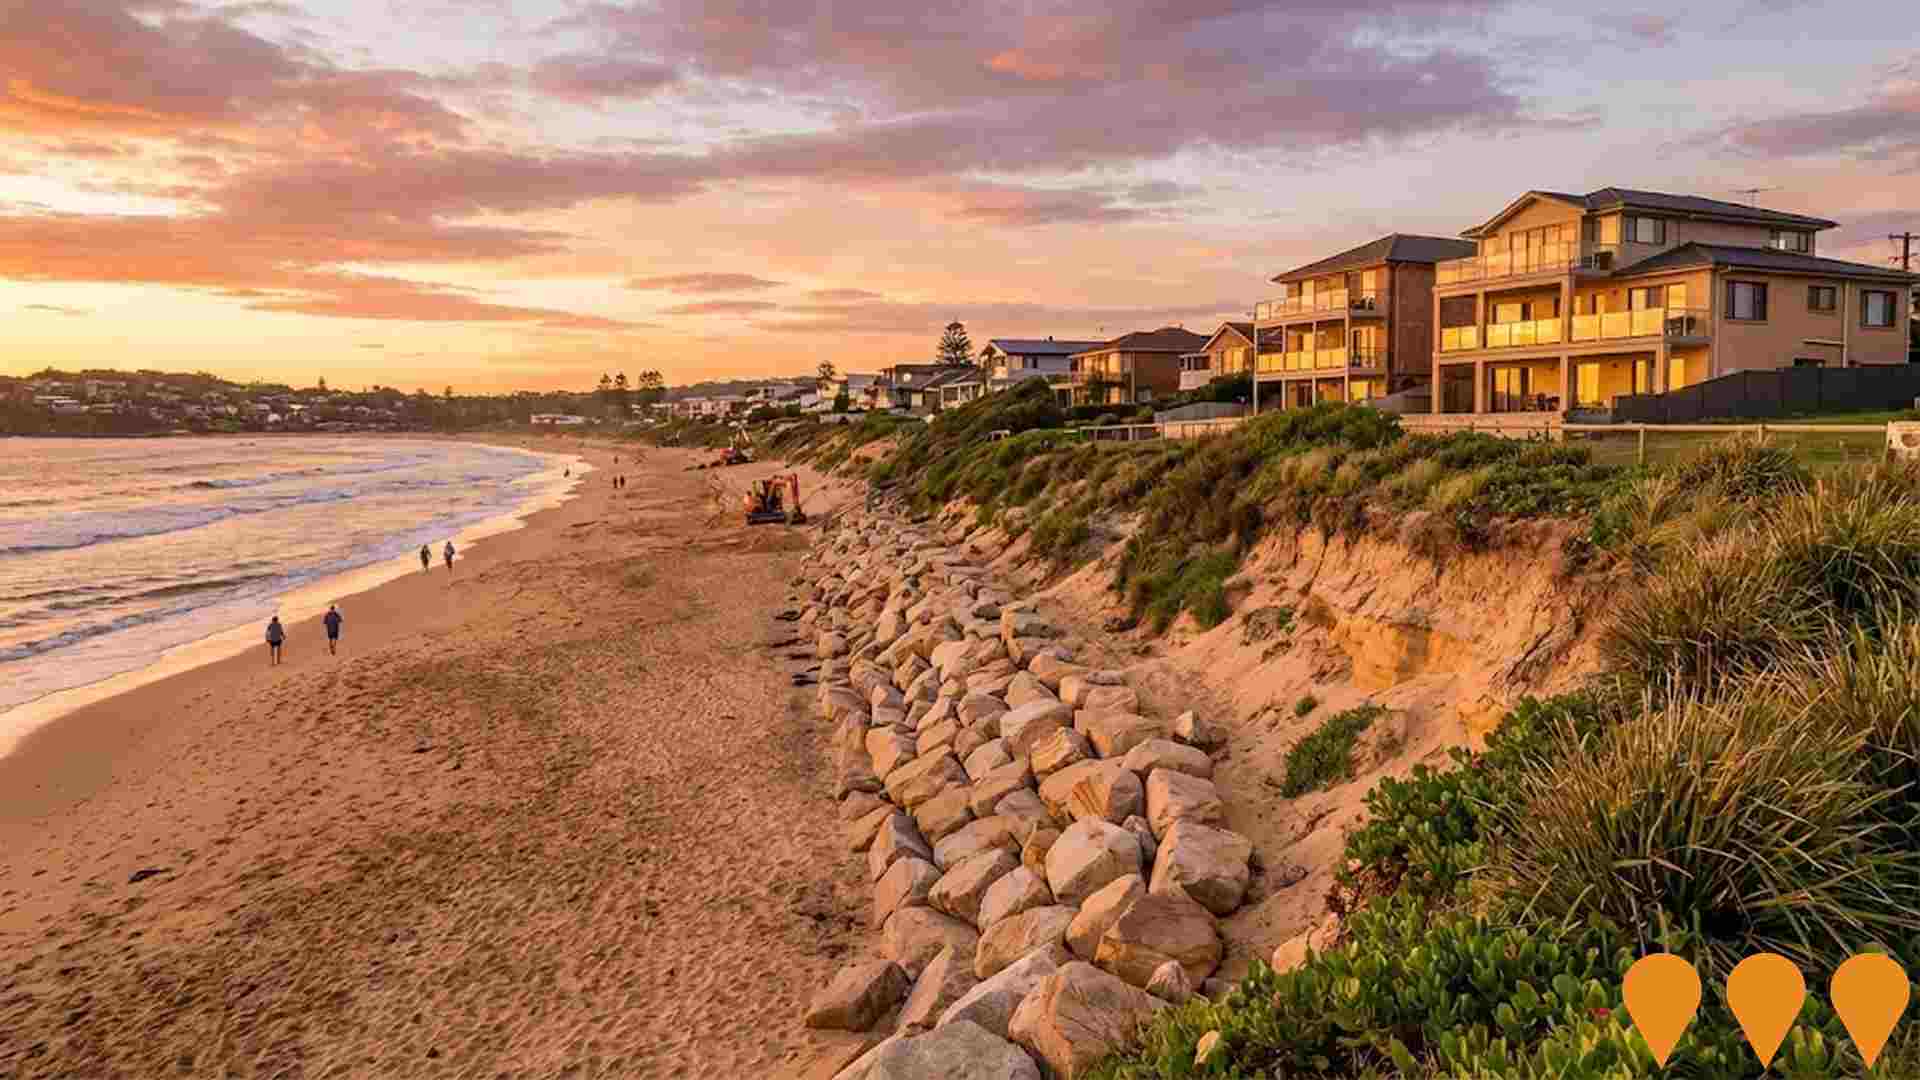
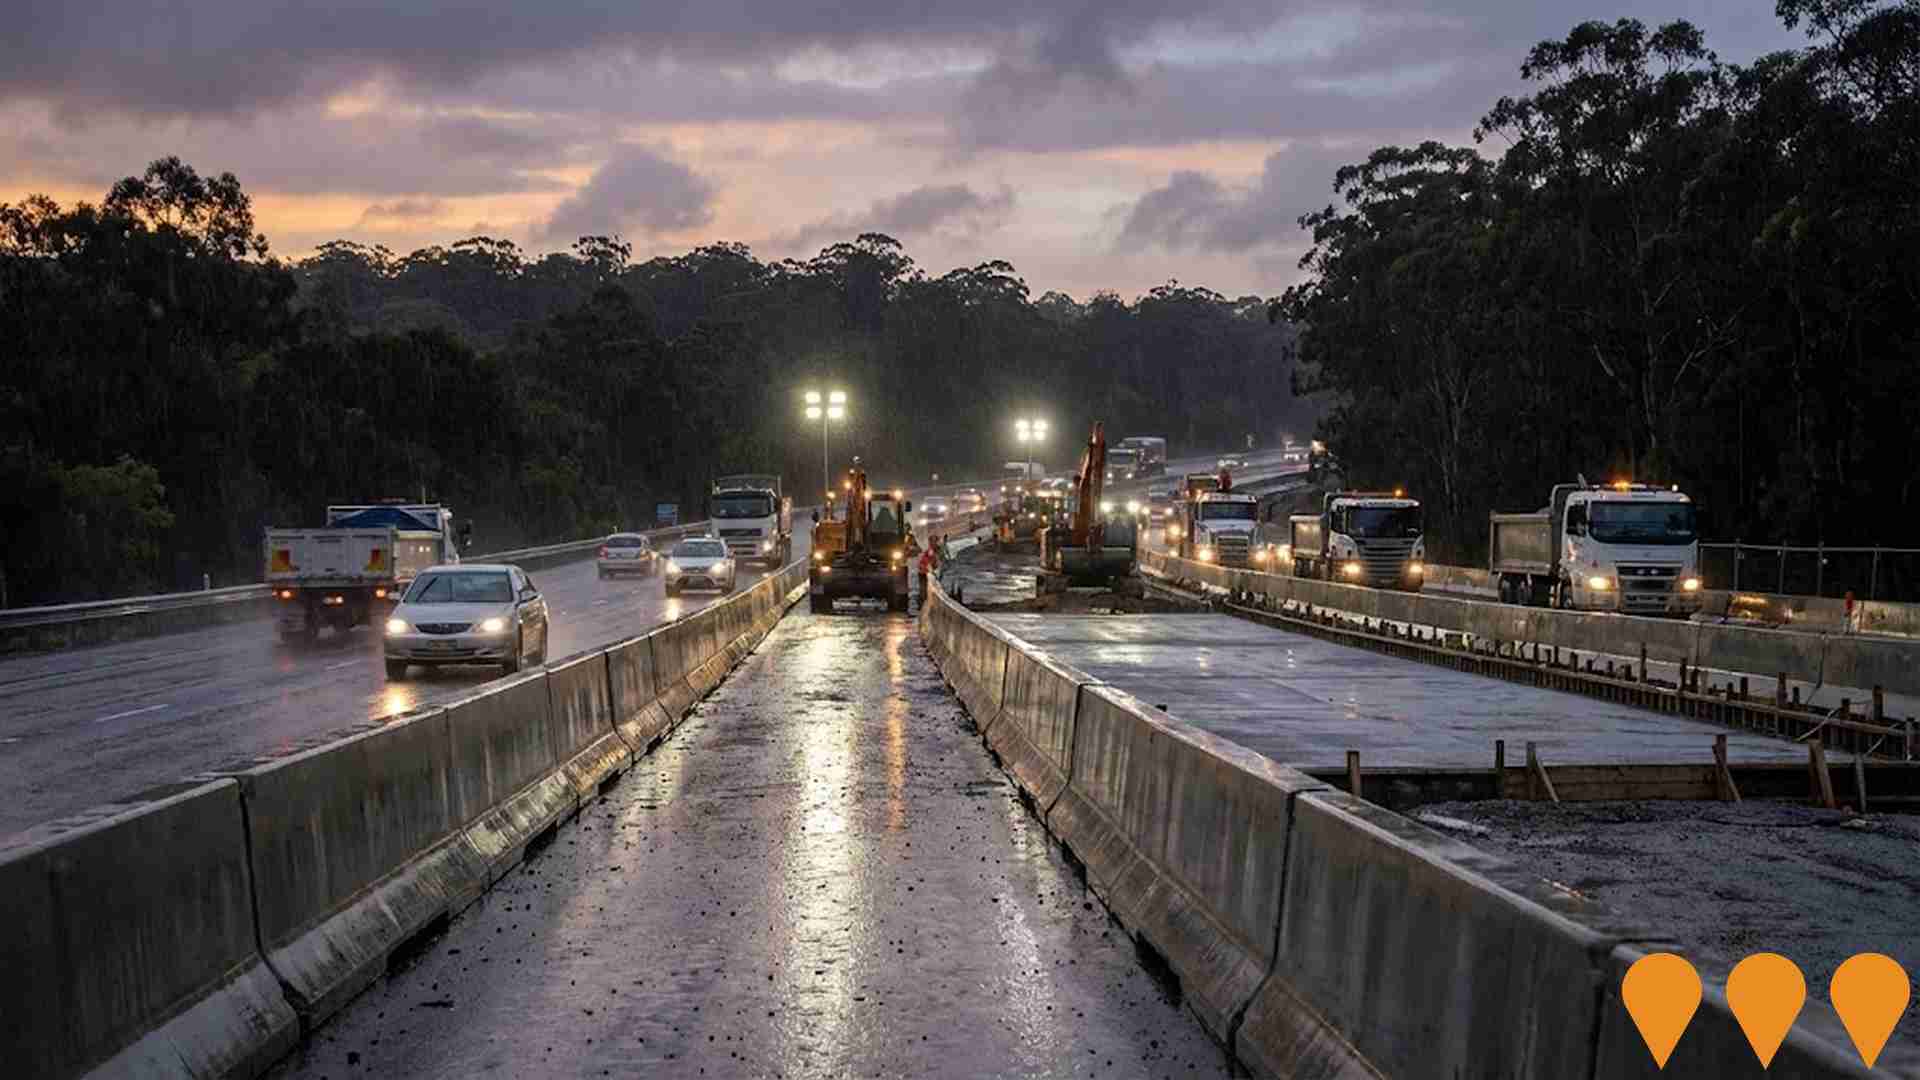
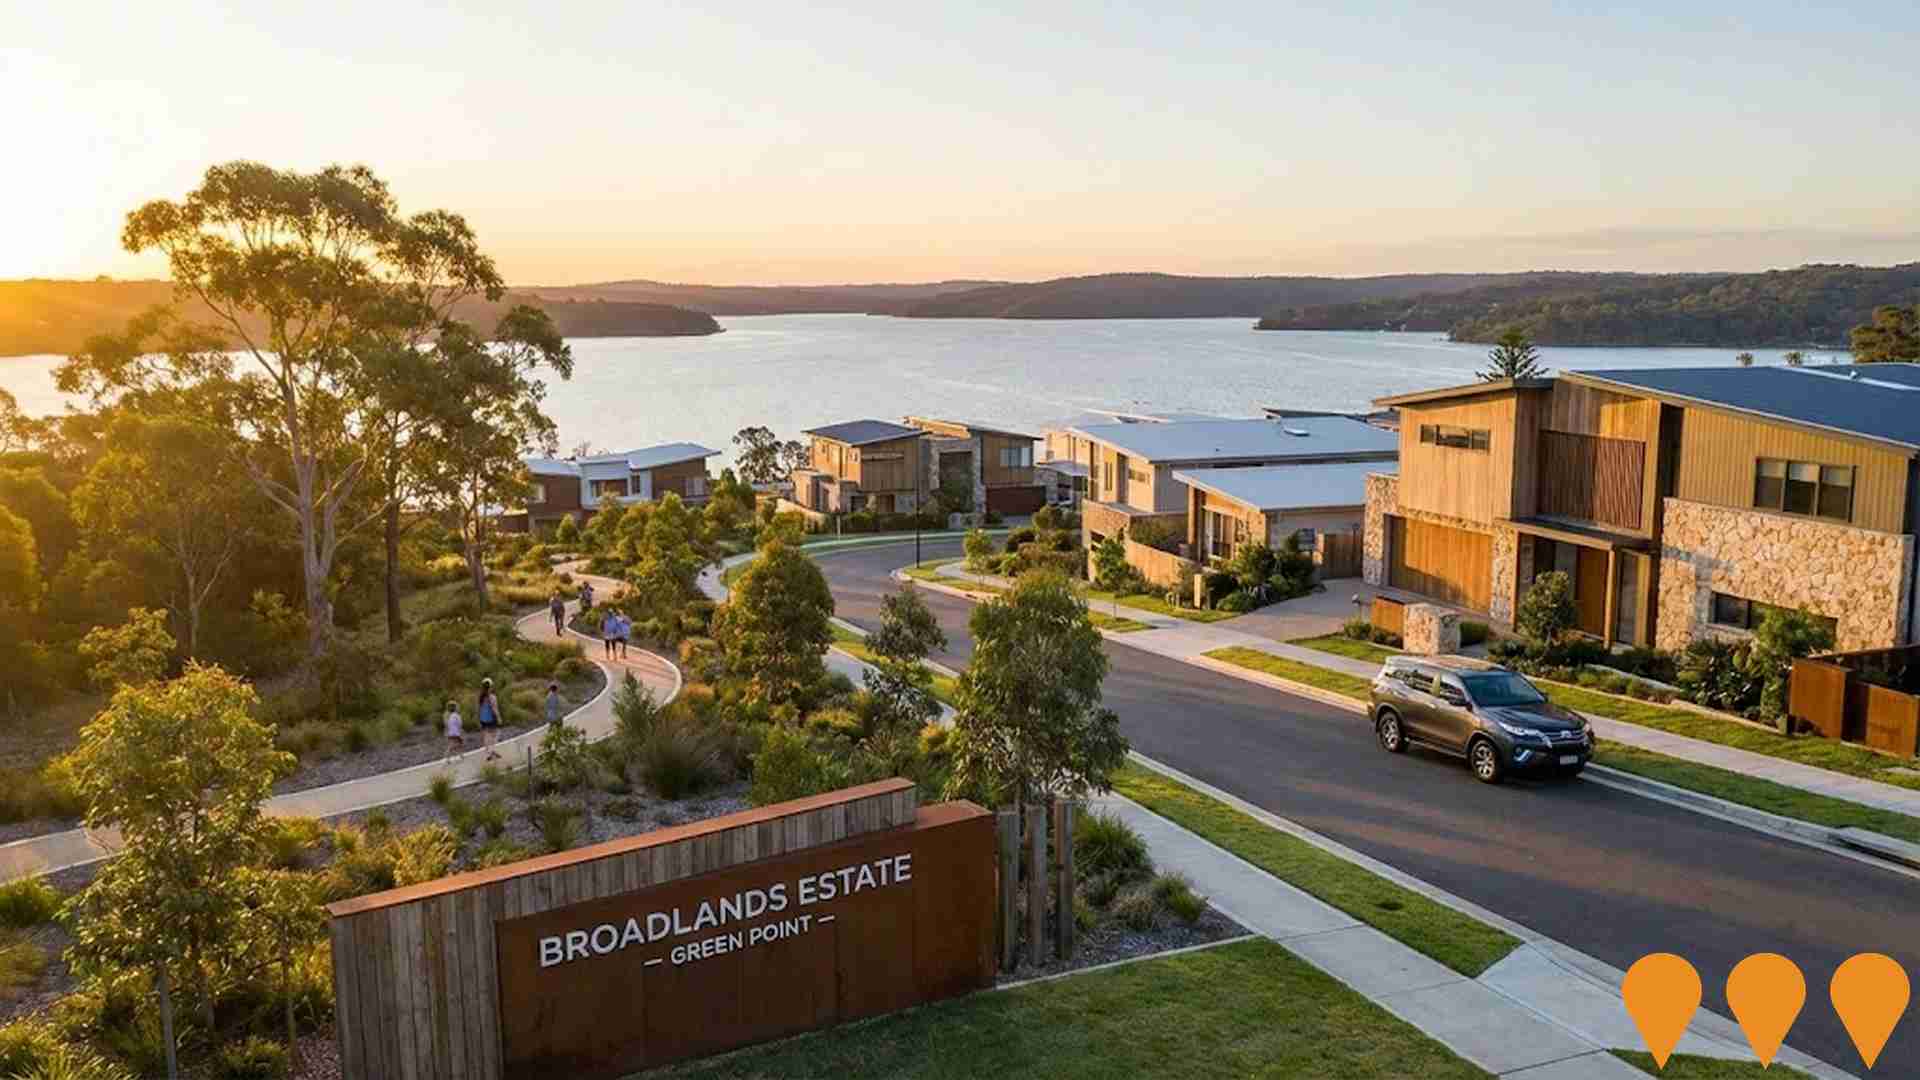
 Denotes AI-based impression for illustrative purposes only, not to be taken as definitive under any circumstances. Please follow links and conduct other investigations from the project's source for actual imagery. Developers and project owners wishing us to use original imagery please Contact Us and we will do so.
Frequently Asked Questions - Infrastructure
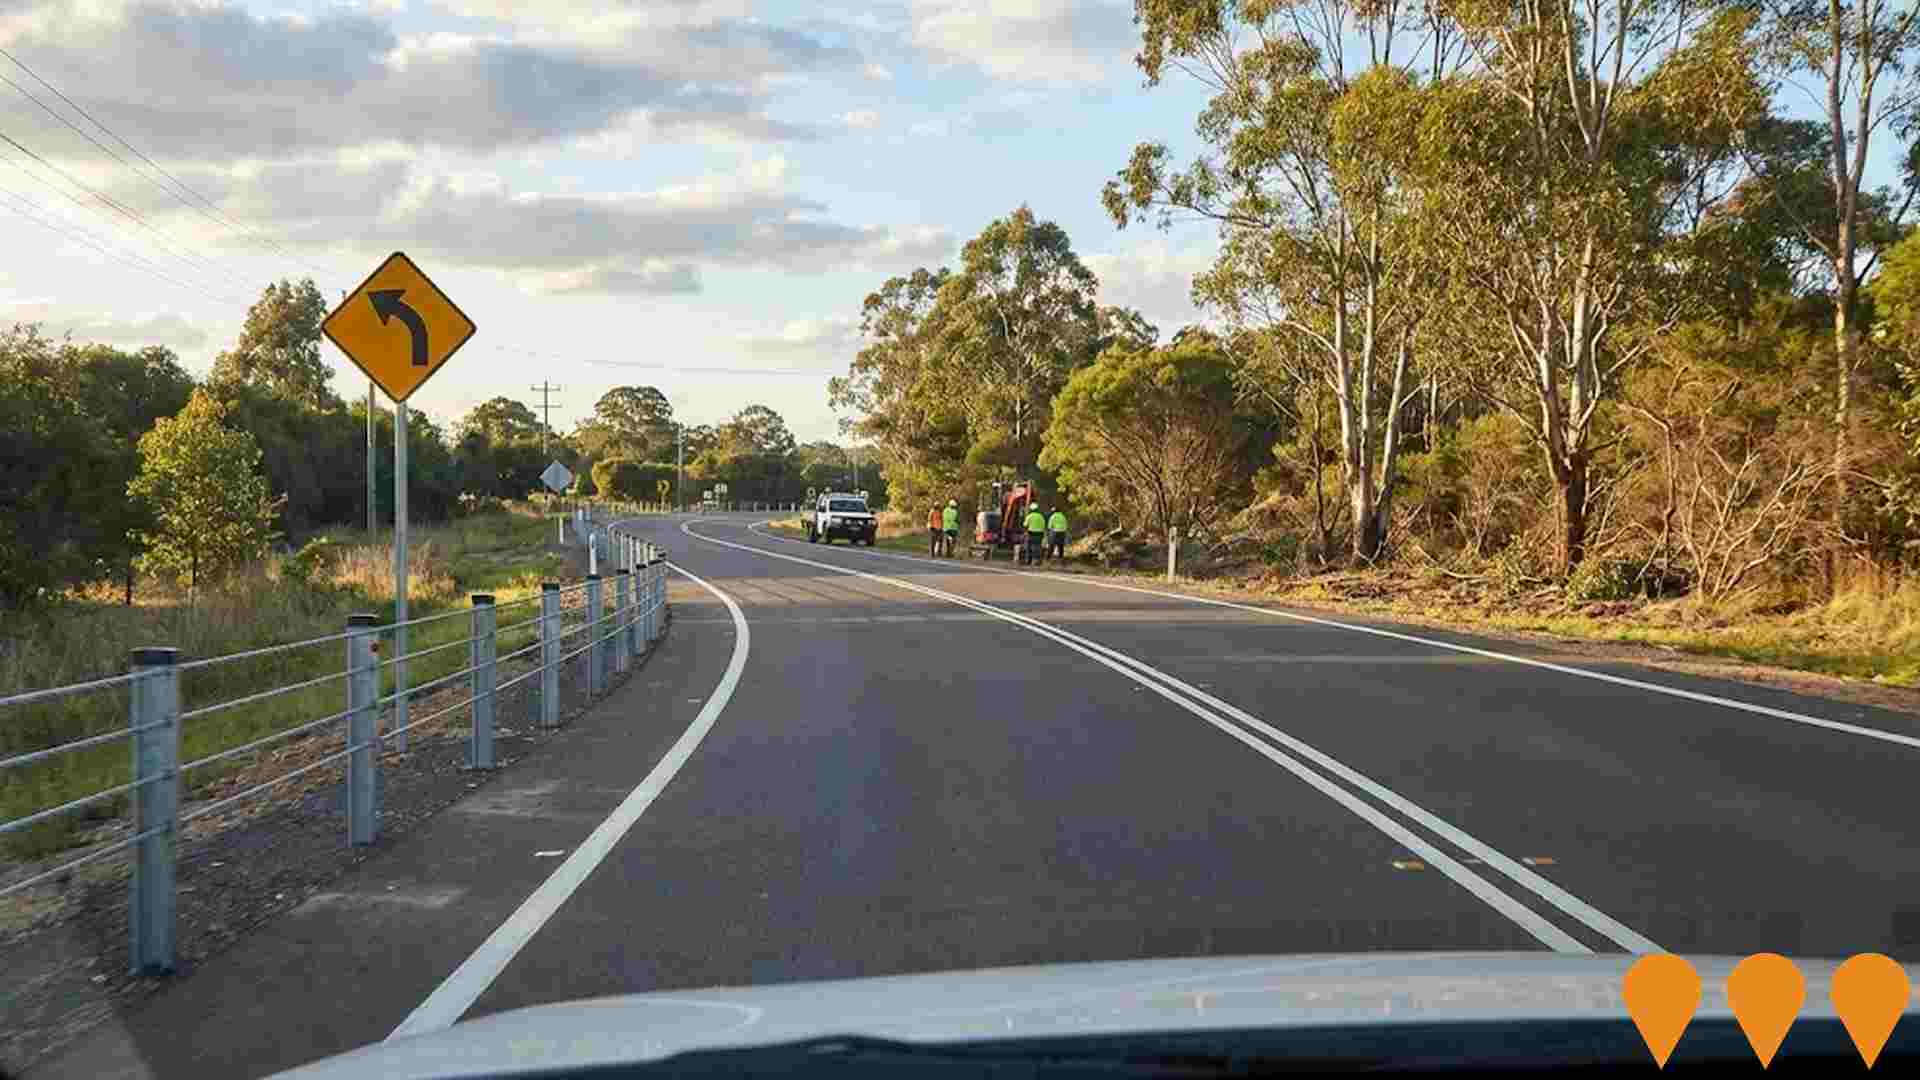
Green Point Foreshore Masterplan & Reserve Upgrades
Major upgrade of the Green Point foreshore reserve including new playgrounds, picnic facilities, walking paths, waterfront access improvements, and landscaping works as part of a community-driven masterplan.

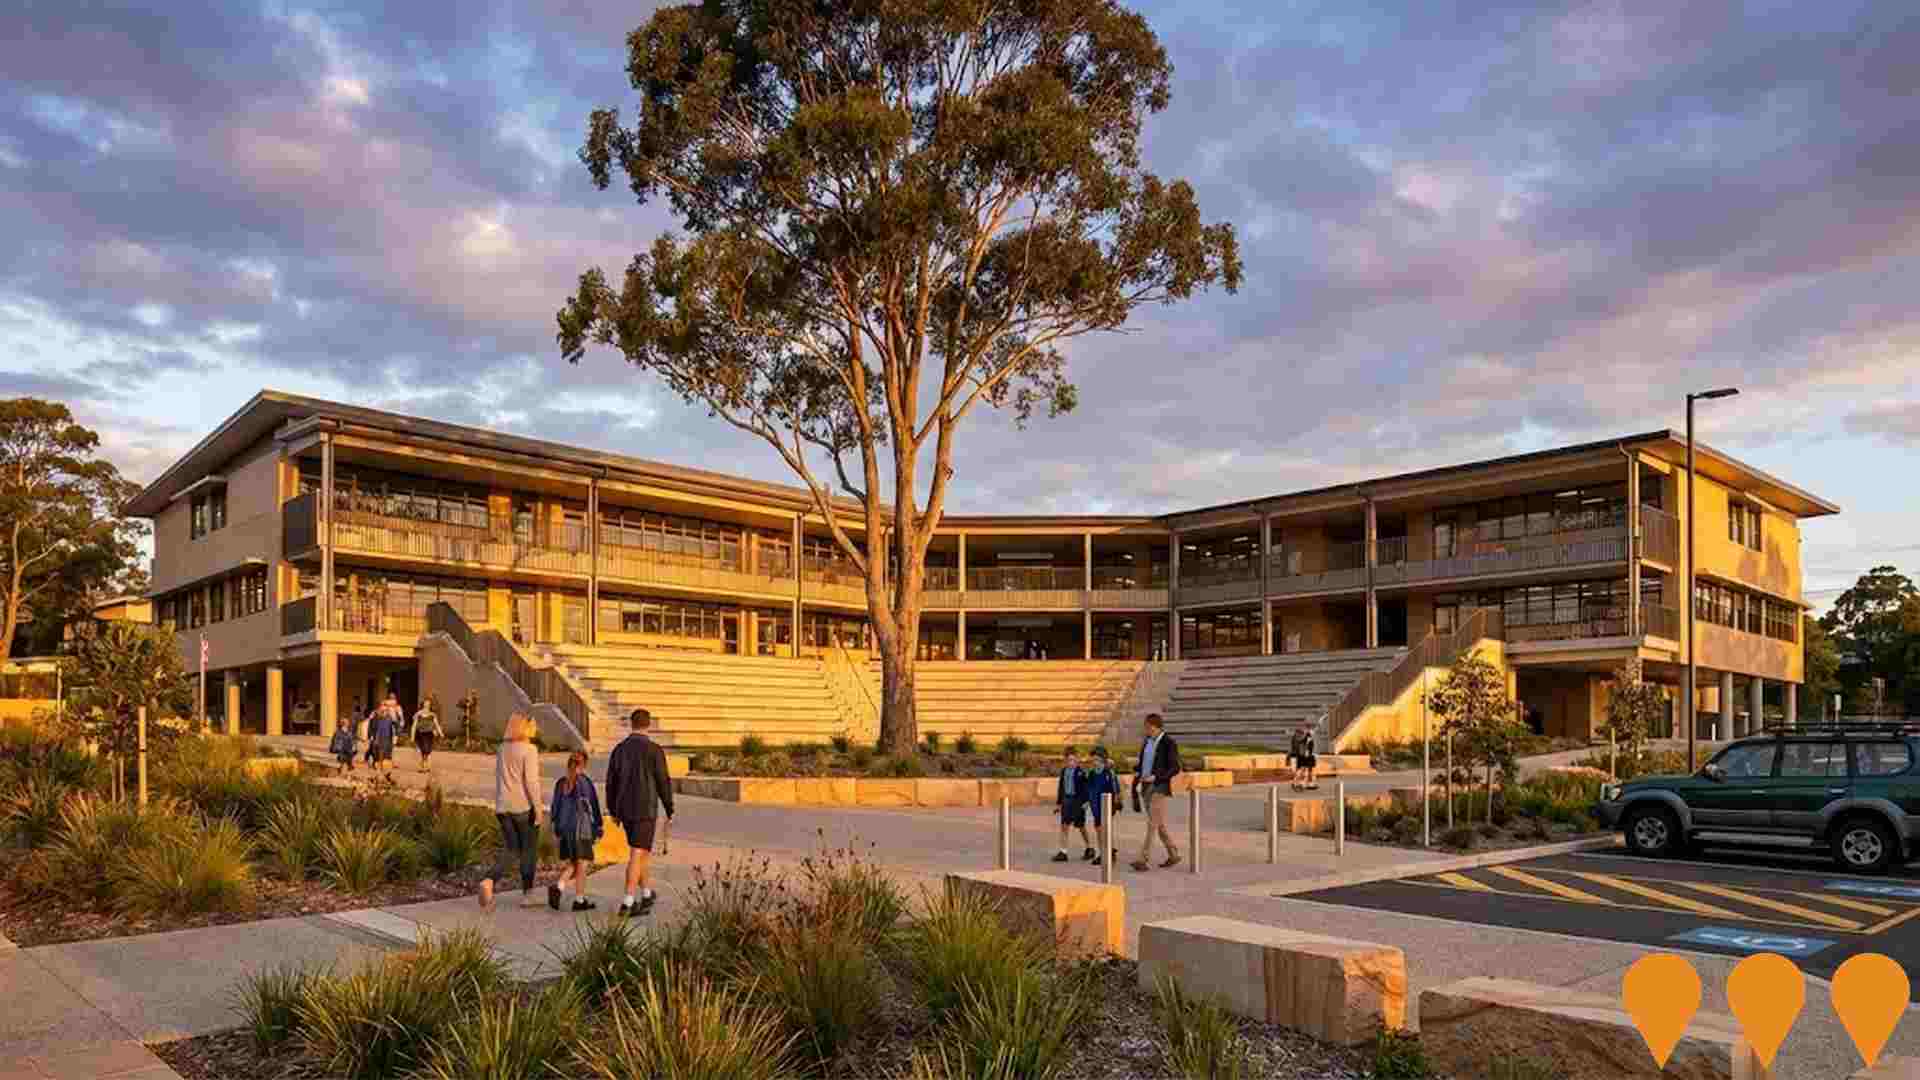
Central Coast Grammar School Campus Expansion
Multi stage campus expansion at Central Coast Grammar School's Erina Heights campus delivering a new K 6 junior school, senior college facilities, performing arts centre, upgraded sports fields and canteen under the school's facilities master plan.
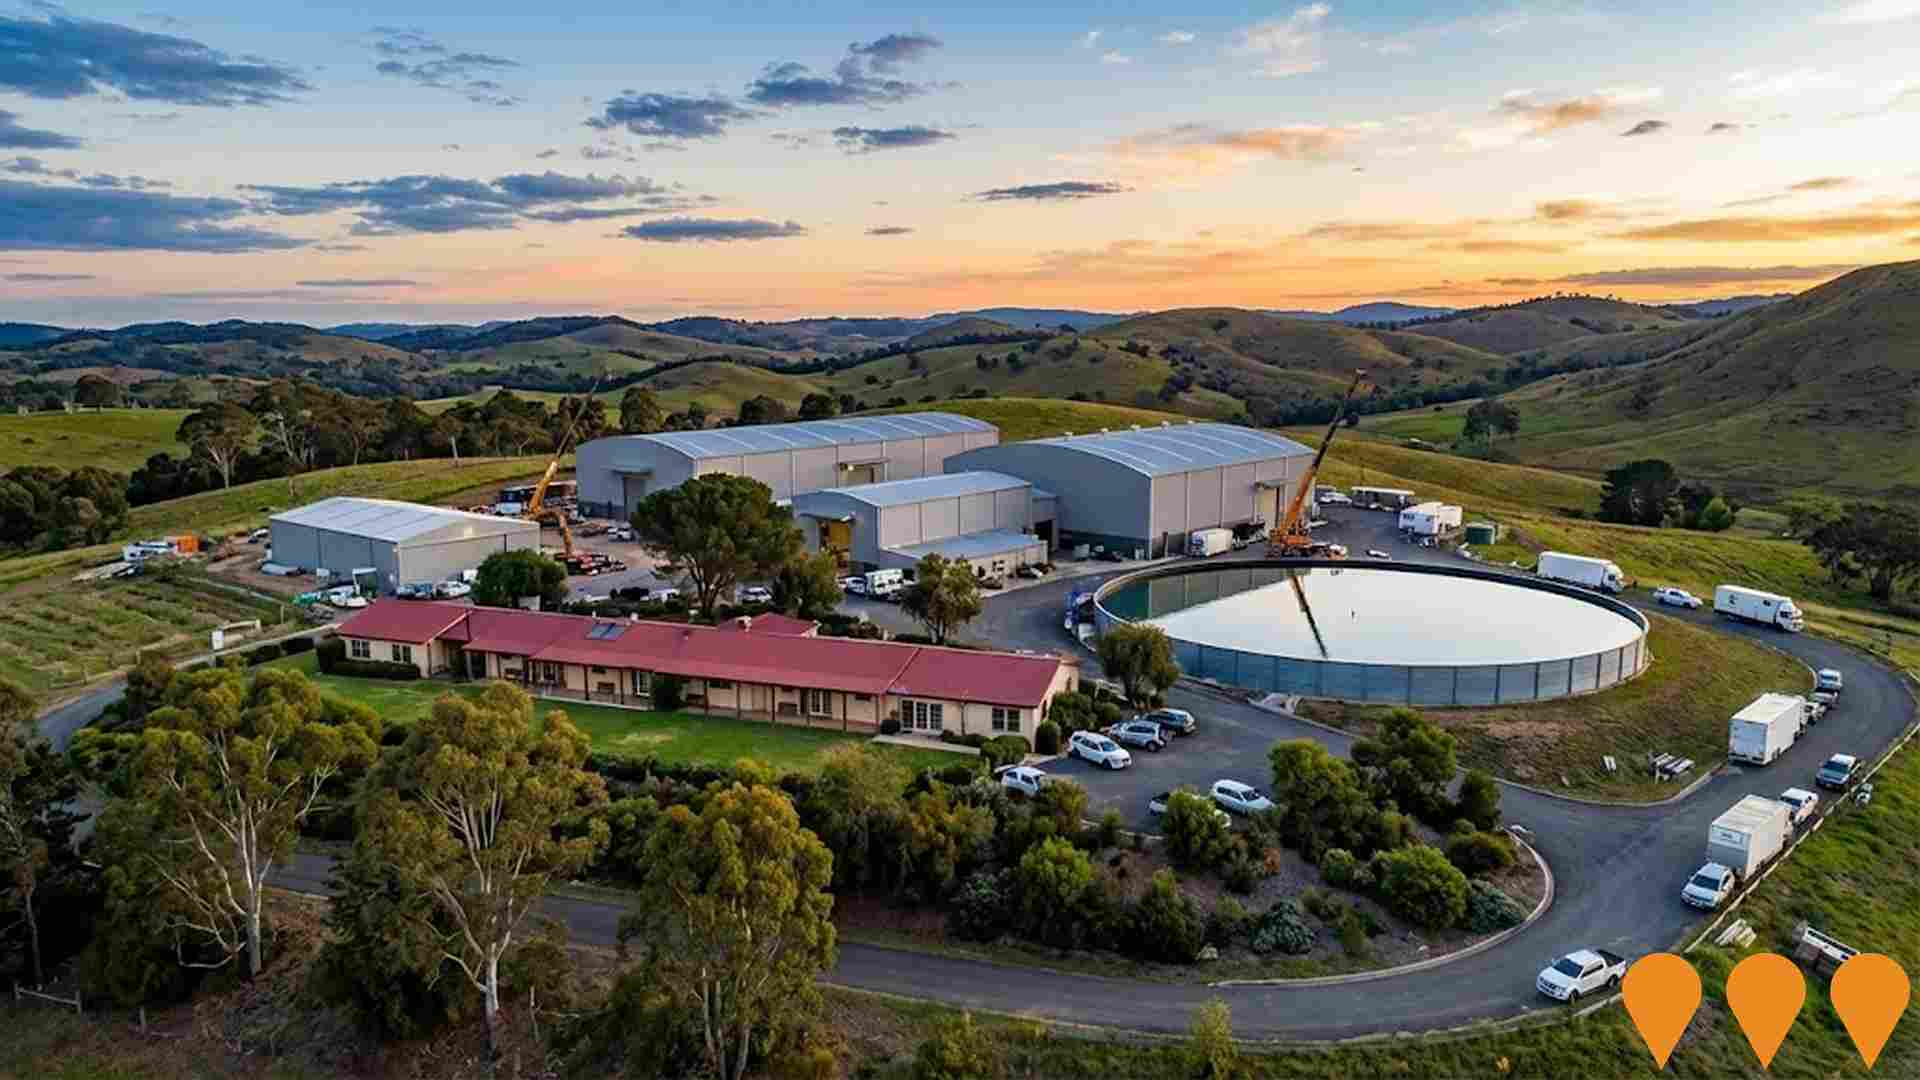
Central Coast Film Studios
Proposed $230 million film and television production facility at Calga featuring 10 state-of-the-art sound stages, Australia's largest water tank, production offices, training and education precinct, film museum, and supporting infrastructure developed by Heath Bonnefin and Craig Giles.
Central Coast Highway Upgrade - Wamberal to Bateau Bay
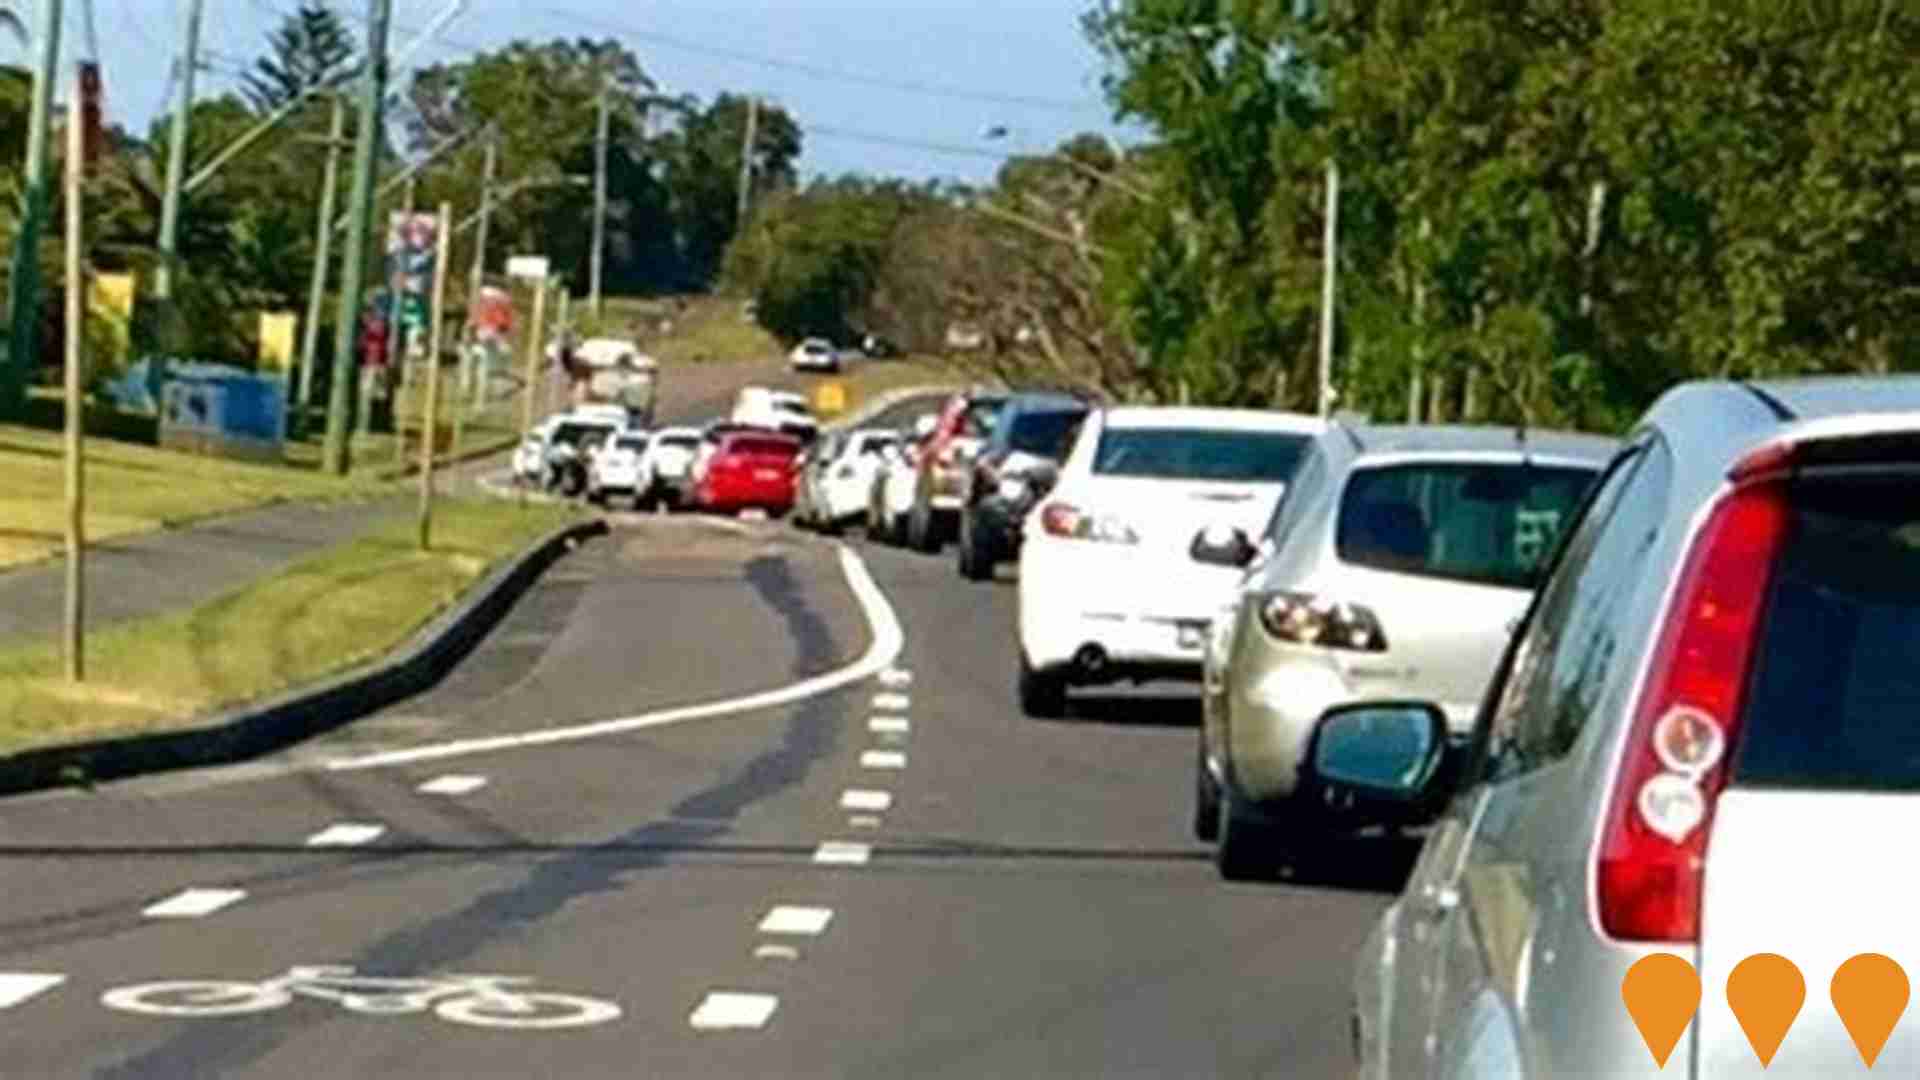
The NSW Government is planning to upgrade the Central Coast Highway between Wamberal and Bateau Bay to improve traffic flow and safety. The project will deliver better connections for the growing Central Coast community and support the local economy through improved access.
Green Point Shopping Village Expansion
Approved expansion and refurbishment of Green Point Shopping Village including additional retail tenancies, improved parking, and upgraded community facilities.
Wamberal Beach Coastal Protection Works
Comprehensive coastal protection strategy for Wamberal Beach including rock revetment, beach nourishment, and dune restoration to protect homes and infrastructure from coastal erosion. The project addresses the ongoing threat to waterfront properties from storm surge and sea level rise.
M1 Pacific Motorway Kariong to Somersby Widening
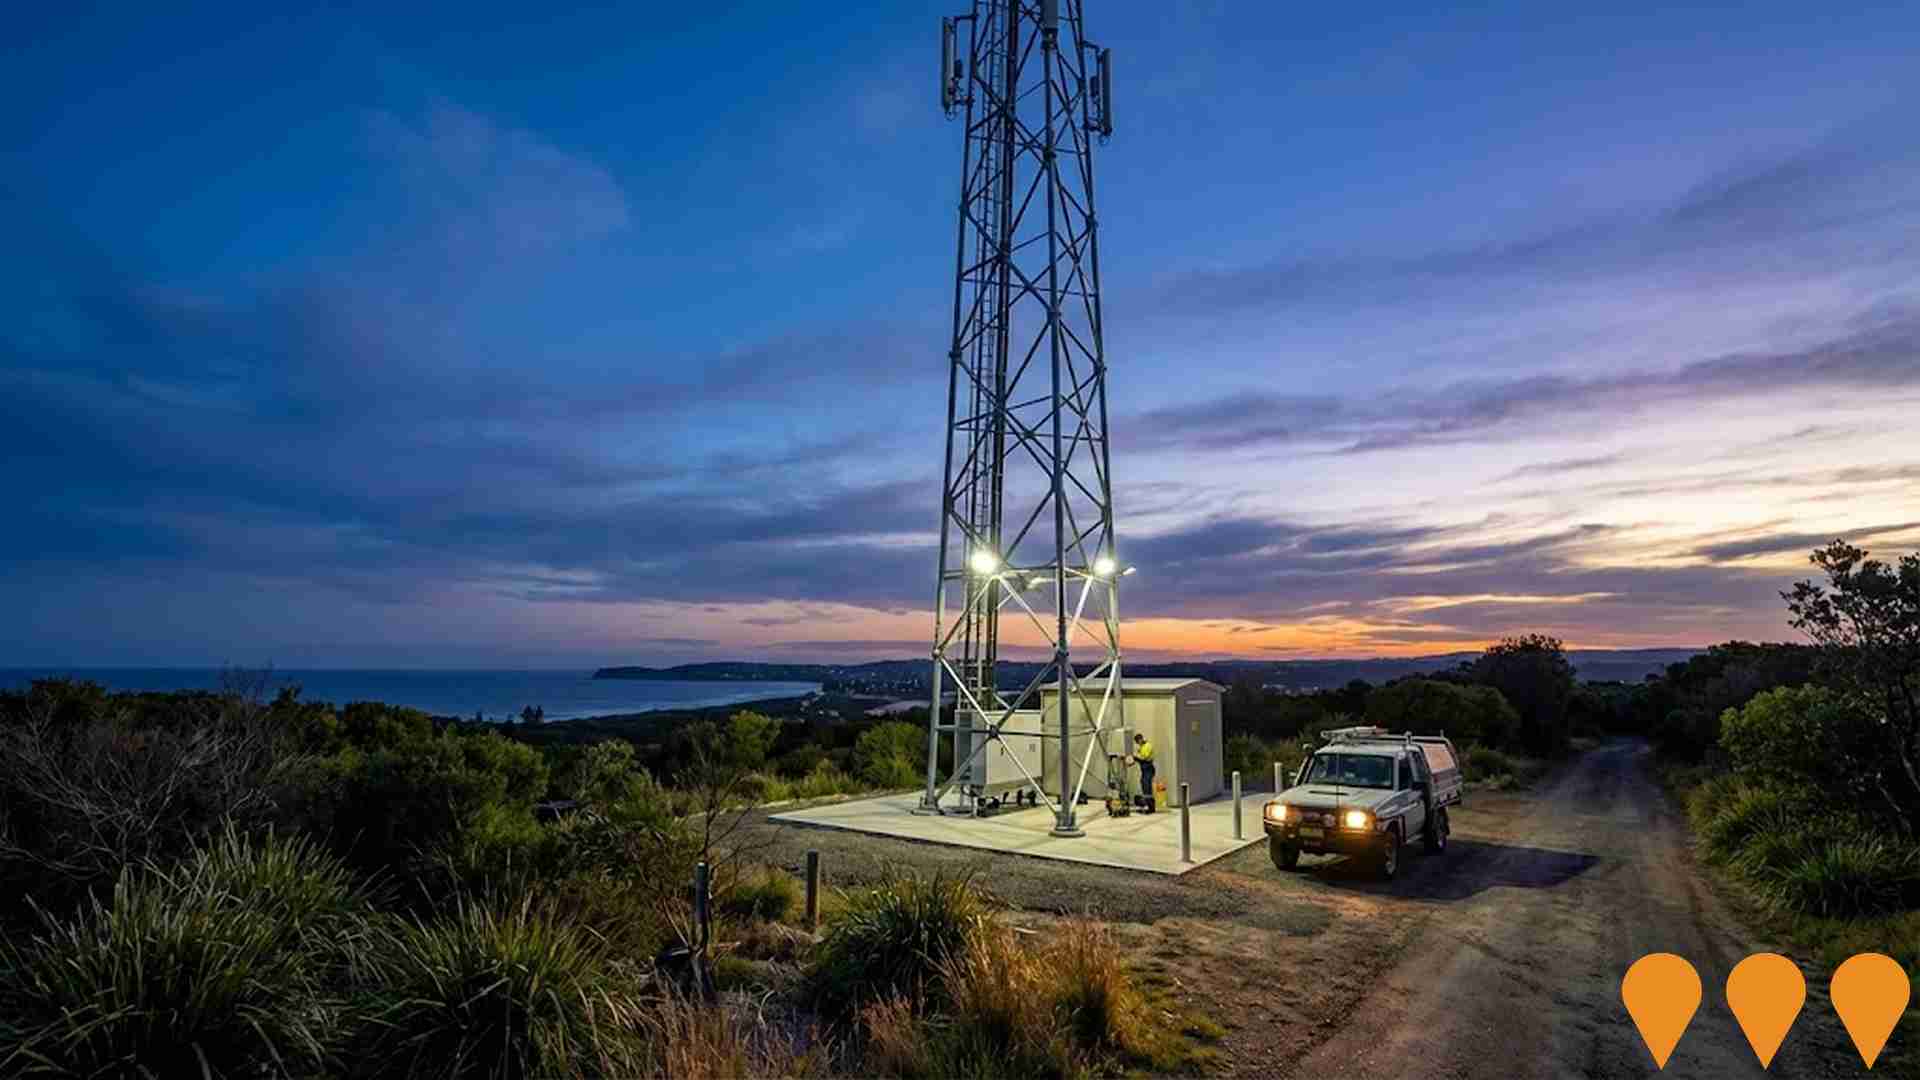
Widening of M1 Pacific Motorway between Kariong and Somersby interchanges to improve traffic flow and reduce congestion on this critical corridor between Sydney and Newcastle.
Broadlands Estate Green Point
Large masterplanned residential community featuring over 300 premium land lots and completed homes in an elevated waterfront-adjacent position with parklands and walking trails.
Employment
Employment conditions in Erina - Green Point demonstrate exceptional strength compared to most Australian markets
Erina - Green Point has a skilled labour force with prominent representation in essential services sectors. Its unemployment rate is 1.9%, lower than Greater Sydney's 4.2%.
Employment growth over the past year was estimated at 2.7%. As of September 2025, 6,719 residents are employed, with an unemployment rate of 2.3% and workforce participation at 49.0%. Dominant employment sectors include health care & social assistance, construction, and retail trade. The area specialises in health care & social assistance, with an employment share 1.4 times the regional level, while finance & insurance shows lower representation at 3.7% versus the regional average of 7.3%.
The worker-to-resident ratio is 0.7, indicating higher-than-average local employment opportunities. Between September 2024 and September 2025, employment increased by 2.7%, labour force grew by 3.1%, raising the unemployment rate by 0.3 percentage points. In contrast, Greater Sydney saw employment rise by 2.1% and unemployment increase by 0.2 percentage points. Statewide in NSW, as of 25-November-25, employment contracted by 0.03%, losing 2,260 jobs, with an unemployment rate of 3.9%. Nationally, the unemployment rate is 4.3%. Jobs and Skills Australia forecasts national employment growth at 6.6% over five years and 13.7% over ten years. Applying these projections to Erina - Green Point's employment mix suggests local employment should increase by 7.0% over five years and 14.4% over ten years, based on a simple weighting extrapolation for illustrative purposes.
Frequently Asked Questions - Employment
Income
The area's income profile falls below national averages based on AreaSearch analysis
AreaSearch released postcode level ATO data for financial year 2022. Erina - Green Point SA2's median income among taxpayers was $50,587, with an average of $70,252. This is above the national average, which was $49,316 and $77,552 respectively in that year. Greater Sydney had a median income of $56,994 and an average of $80,856 during the same period. Based on Wage Price Index growth of 12.61% since financial year 2022, current estimates for Erina - Green Point would be approximately $56,966 (median) and $79,111 (average) as of September 2025. The 2021 Census showed household incomes in Erina - Green Point ranked between the 26th and 31st percentiles. Family incomes fell within the same range, while personal incomes were at the 30th percentile. The earnings profile indicated that 25.2% of residents earned between $400 and $799 weekly (3,712 people). This differs from regional trends where 30.9% fall within the $1,500 - $2,999 range. Income diversity was notable in Erina - Green Point, with 31.0% earning under $800 weekly and 24.7% exceeding $3,000 weekly, suggesting a mixed socioeconomic profile. Housing affordability pressures were severe, with only 83.1% of income remaining after housing costs, ranking at the 30th percentile. The area's SEIFA income ranking placed it in the 6th decile.
Frequently Asked Questions - Income
Housing
Erina - Green Point is characterized by a predominantly suburban housing profile, with above-average rates of outright home ownership
In Erina - Green Point, as per the latest Census evaluation, 83.5% of dwellings were houses, with the remaining 16.6% comprising semi-detached homes, apartments, and other types. This compares to Sydney metropolitan areas' 74.2% houses and 25.9% other dwellings. Home ownership in Erina - Green Point stood at 48.3%, with mortgaged properties making up 33.3% and rented dwellings accounting for 18.4%. The median monthly mortgage repayment was $2,167, exceeding the Sydney metro average of $2,150. Weekly rent in Erina - Green Point was $410, compared to Sydney's $400. Nationally, mortgage repayments were higher than the Australian average of $1,863, and rents exceeded the national figure of $375.
Frequently Asked Questions - Housing
Household Composition
Erina - Green Point has a typical household mix, with a lower-than-average median household size
Family households constitute 68.6% of all households, including 29.0% couples with children, 29.2% couples without children, and 9.8% single parent families. Non-family households comprise the remaining 31.4%, with lone person households at 29.7% and group households at 1.6%. The median household size is 2.4 people, which is smaller than the Greater Sydney average of 2.5.
Frequently Asked Questions - Households
Local Schools & Education
Erina - Green Point shows strong educational performance, ranking in the upper quartile nationally when assessed across multiple qualification and achievement indicators
The area's university qualification rate is 27.0%, significantly lower than Greater Sydney's average of 38.0%. Bachelor degrees are the most common at 19.1%, followed by postgraduate qualifications (5.4%) and graduate diplomas (2.5%). Vocational credentials are prevalent, with 36.7% of residents aged 15+ holding them, including advanced diplomas (12.4%) and certificates (24.3%). Educational participation is high, with 29.3% of residents currently enrolled in formal education.
This includes primary education (9.8%), secondary education (8.4%), and tertiary education (4.7%).
Frequently Asked Questions - Education
Schools Detail
Nearby Services & Amenities
Transport
Transport servicing is good compared to other areas nationally based on assessment of service frequency, route connectivity and accessibility
Transport analysis indicates 151 active public transport stops operating within Erina - Green Point area. These stops serve a variety of bus routes, totaling 136 individual routes. Together, these routes facilitate 2,658 weekly passenger trips.
The accessibility to public transport is rated as excellent, with residents located an average of 182 meters from the nearest stop. On average, there are 379 trips per day across all routes, which translates to approximately 17 weekly trips per individual stop.
Frequently Asked Questions - Transport
Transport Stops Detail
Health
Health performance in Erina - Green Point is well below average with prevalence of common health conditions notable across both younger and older age cohorts
Health data indicates significant health challenges in Erina - Green Point.
Both younger and older age groups show high prevalence of common health conditions. Approximately 54% (~8,015 people) have private health cover, which is notably higher than the Greater Sydney average. The most prevalent medical conditions are arthritis (10.9%) and mental health issues (7.9%). However, 61.5% of residents report no medical ailments, compared to 64.8% in Greater Sydney. Erina - Green Point has a higher proportion of seniors aged 65 and over at 32.3% (4,756 people), compared to the Greater Sydney average of 24.5%. Health outcomes among seniors broadly align with the general population's health profile.
Frequently Asked Questions - Health
Cultural Diversity
In terms of cultural diversity, Erina - Green Point records figures broadly comparable to the national average, as found in AreaSearch's assessment of a number of language and cultural background related metrics
Erina-Green Point's cultural diversity aligns with the broader area, where 77.9% were born in Australia, 89.9% are citizens, and 91.1% speak English only at home. Christianity is the dominant religion here, at 60.8%, compared to Greater Sydney's 53.4%. The top three ancestry groups are English (32.1%), Australian (26.3%), and Irish (9.4%).
Some ethnic groups show notable differences: South African residents are 0.7% (regional average is 0.5%), Welsh residents are also 0.7%, and Maltese residents are at 0.7%.
Frequently Asked Questions - Diversity
Age
Erina - Green Point ranks among the oldest 10% of areas nationwide
Erina - Green Point's median age is 50 years, significantly higher than Greater Sydney's 37 years and the national average of 38 years. Compared to Greater Sydney, Erina - Green Point has a higher proportion of residents aged 75-84 (13.9%) but fewer residents aged 25-34 (5.3%). This concentration of residents aged 75-84 is well above the national average of 6.0%. Between the 2021 Census and the present, the proportion of residents aged 75 to 84 has grown from 12.0% to 13.9%, while the proportion of residents aged 35 to 44 increased from 10.2% to 11.4%. Conversely, the proportion of residents aged 25 to 34 has declined from 7.2% to 5.3%, and the proportion of residents aged 85+ has dropped from 6.8% to 5.2%. By 2041, Erina - Green Point is expected to experience notable shifts in its age composition. Leading this demographic shift, the number of residents aged 75 to 84 is projected to grow by 32%, reaching 2,703 from 2,055. This growth is primarily driven by demographic aging, with residents aged 65 and older representing 82% of anticipated population growth. Conversely, both the 15-24 age group and the 5-14 age group are expected to see reduced numbers.
