Chart Color Schemes
This analysis uses ABS Statistical Areas Level 2 (SA2) boundaries, which can materially differ from Suburbs and Localities (SAL) even when sharing similar names.
SA2 boundaries are defined by the Australian Bureau of Statistics and are designed to represent communities for statistical reporting (e.g., census and ERP).
Suburbs and Localities (SAL) represent commonly-used suburb/locality names (postal-style areas) and may use different geographic boundaries. For comprehensive analysis, consider reviewing both boundary types if available.
est. as @ -- *
ABS ERP | -- people | --
2021 Census | -- people
Sales Activity
Curious about local property values? Filter the chart to assess the volume and appreciation (including resales) trends and regional comparisons, or scroll to the map below view this information at an individual property level.
Find a Recent Sale
Sales Detail
Population
Niagara Park - Lisarow is positioned among the lower quartile of areas assessed nationally for population growth based on AreaSearch's assessment of recent, and medium term trends
Niagara Park - Lisarow's population is around 8,273 as of Nov 2025. This reflects an increase of 68 people since the 2021 Census, which reported a population of 8,205. The change was inferred from ABS' estimated resident population of 8,268 in June 2024 and an additional 9 validated new addresses since the Census date. This level of population equates to a density ratio of 494 persons per square kilometer. Niagara Park - Lisarow's 0.8% growth since census positions it within 1.5 percentage points of the SA3 area (2.3%), demonstrating competitive growth fundamentals. Population growth was primarily driven by overseas migration, contributing approximately 63.6% of overall population gains during recent periods.
AreaSearch is adopting ABS/Geoscience Australia projections for each SA2 area, released in 2024 with 2022 as the base year. For areas not covered, AreaSearch utilises NSW State Government's SA2 level projections, released in 2022 with 2021 as the base year. Growth rates by age group from these aggregations are applied to all areas for years 2032 to 2041. Over this period, projections indicate a decline in overall population, with Niagara Park - Lisarow's population expected to decline by 43 persons by 2041. However, growth across specific age cohorts is anticipated, led by the 75 to 84 age group, projected to increase by 199 people.
Frequently Asked Questions - Population
Development
The level of residential development activity in Niagara Park - Lisarow is very low in comparison to the average area assessed nationally by AreaSearch
Niagara Park - Lisarow has seen approximately 12 dwellings granted development approval annually. Over the past five financial years, from FY-21 to FY-25, a total of 62 homes have been approved, with an additional 4 receiving approval in FY-26 so far. On average, about 0.4 people per year have moved to the area for each dwelling built during these years.
This suggests that new construction is keeping pace with or even exceeding demand, providing more options for buyers and potentially driving population growth beyond current projections. The average expected construction cost of new properties in the area is $300,000, aligning with broader regional development trends. In FY-26, there have been $23.8 million worth of commercial approvals, indicating consistent commercial investment activity. When compared to Greater Sydney, Niagara Park - Lisarow has significantly lower building activity, recording 60.0% below the regional average per person. This limited new supply generally supports stronger demand and values for established properties.
Nationally, this figure is also below average, reflecting the area's maturity and suggesting possible planning constraints. Recent building activity in Niagara Park - Lisarow consists exclusively of detached houses, maintaining the area's traditional low-density character with a focus on family homes appealing to those seeking space. This preference for detached housing (84.0% at Census) indicates ongoing robust demand for family homes despite increasing density pressures. The estimated population count per dwelling approval in the area is 2754 people, reflecting its quiet and low-activity development environment. With population projections indicating stability or decline, Niagara Park - Lisarow should experience reduced housing demand pressures, benefiting potential buyers.
Frequently Asked Questions - Development
Infrastructure
Niagara Park - Lisarow has moderate levels of nearby infrastructure activity, ranking in the 45thth percentile nationally
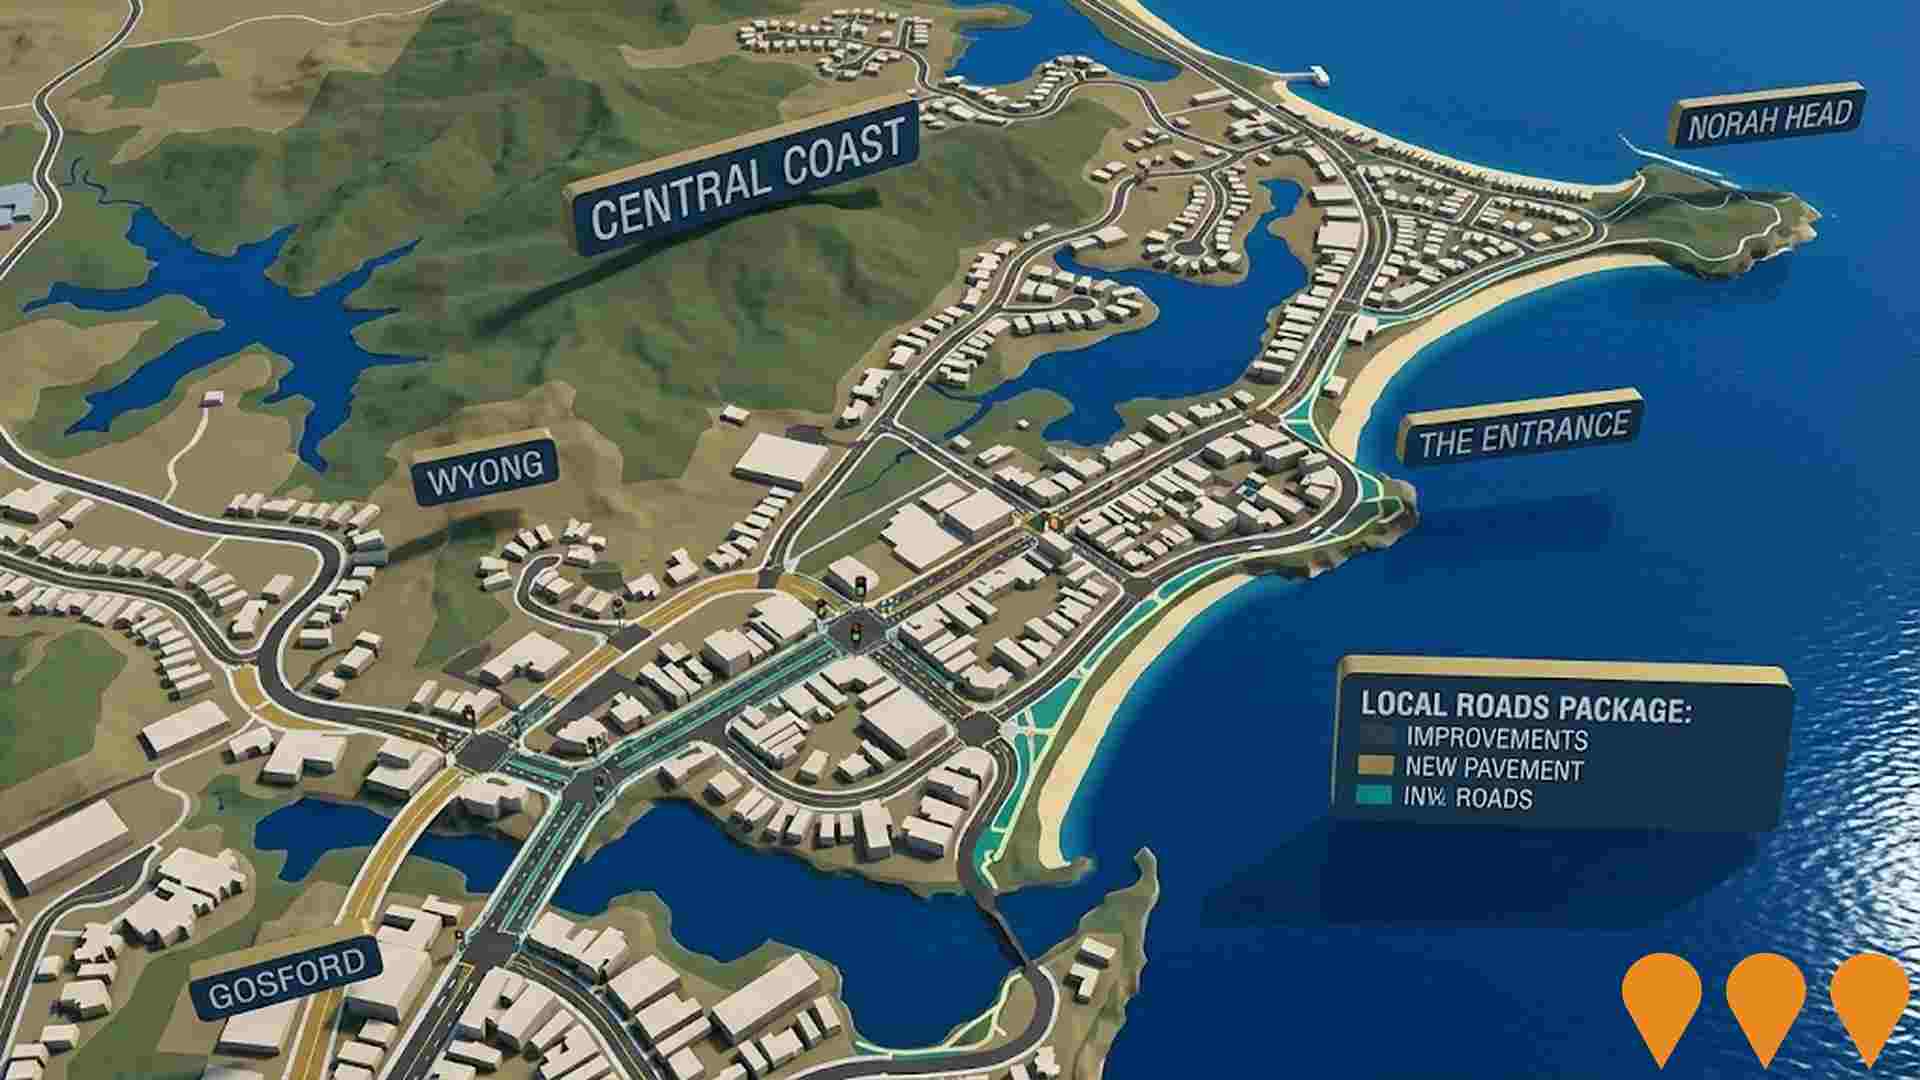
Changes to local infrastructure significantly affect an area's performance. AreaSearch has identified 14 projects that could impact the area. Notable ones include Narara Ecovillage, Narara District Master Plan, Wyoming Shopping Village Upgrade, and Narara Community Centre and Library Redevelopment. The following list details those most likely to be relevant.
Professional plan users can use the search below to filter and access additional projects.
INFRASTRUCTURE SEARCH
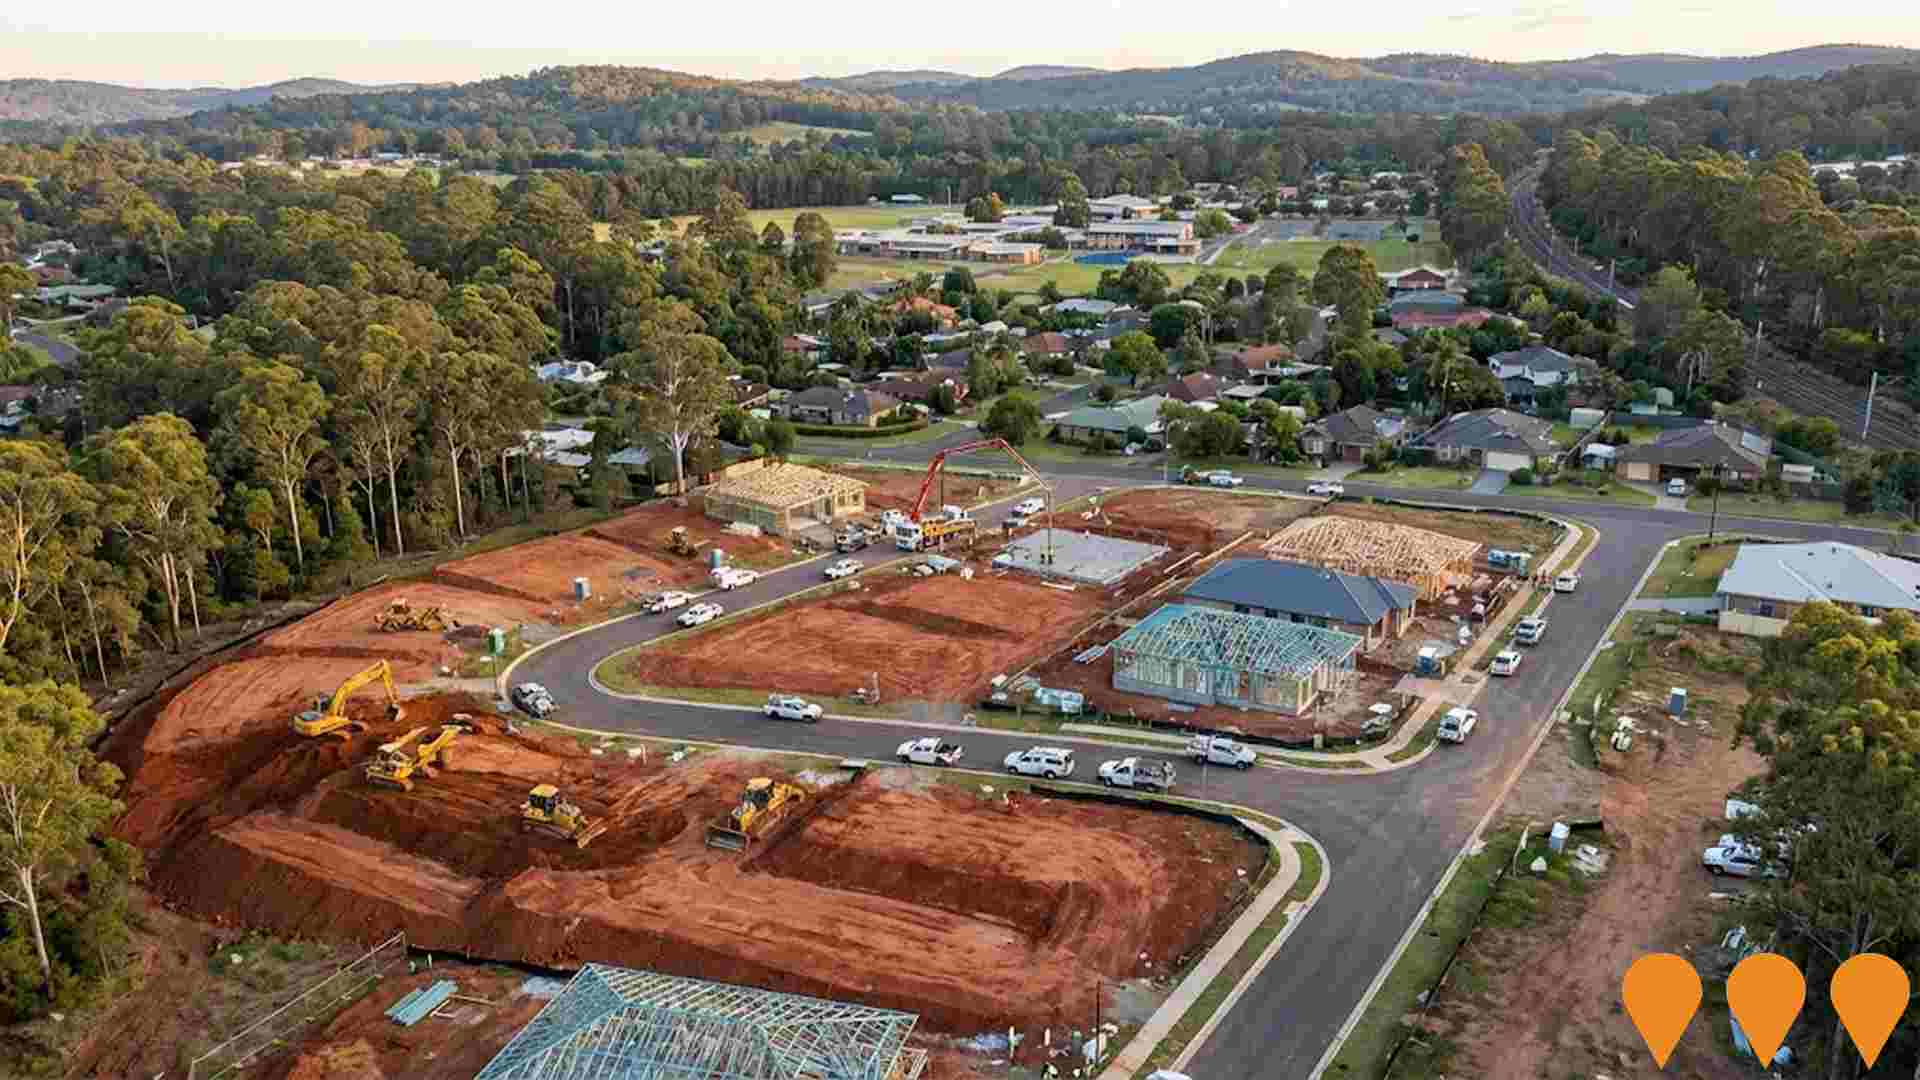
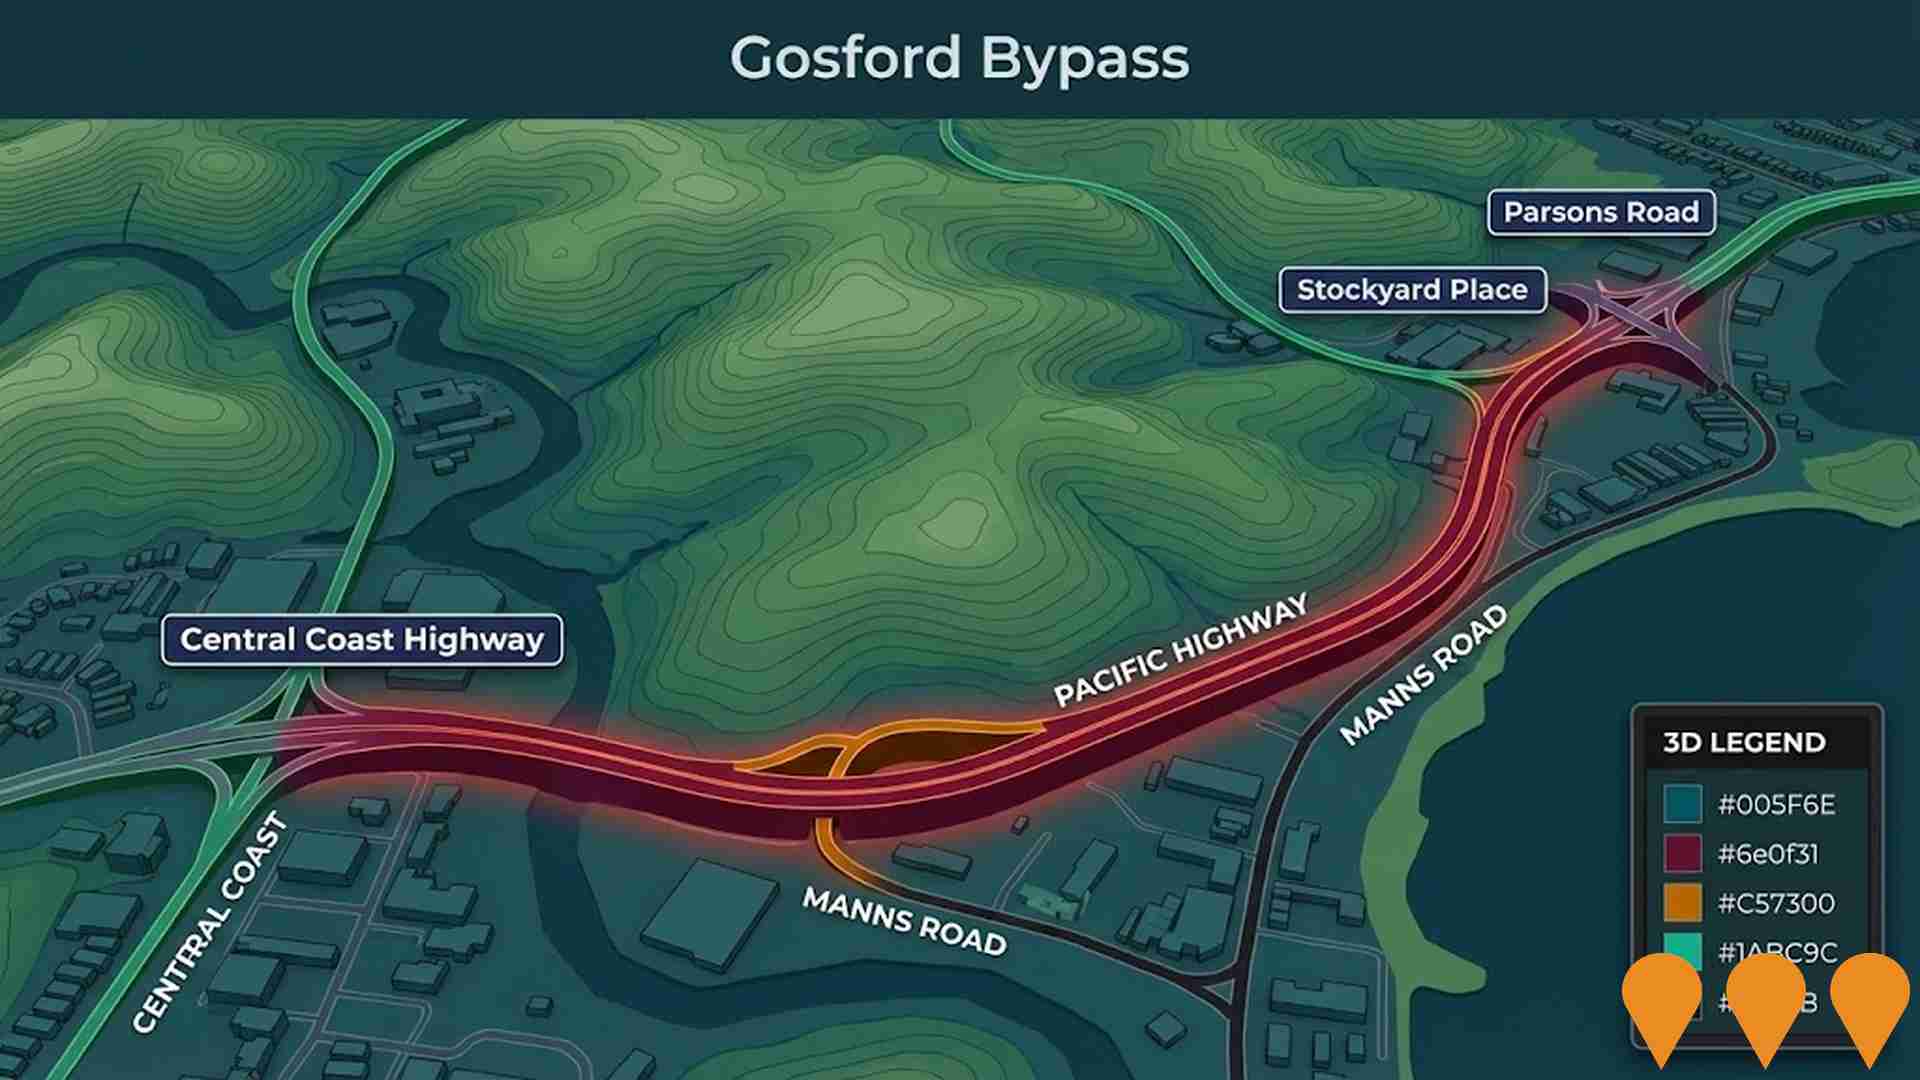
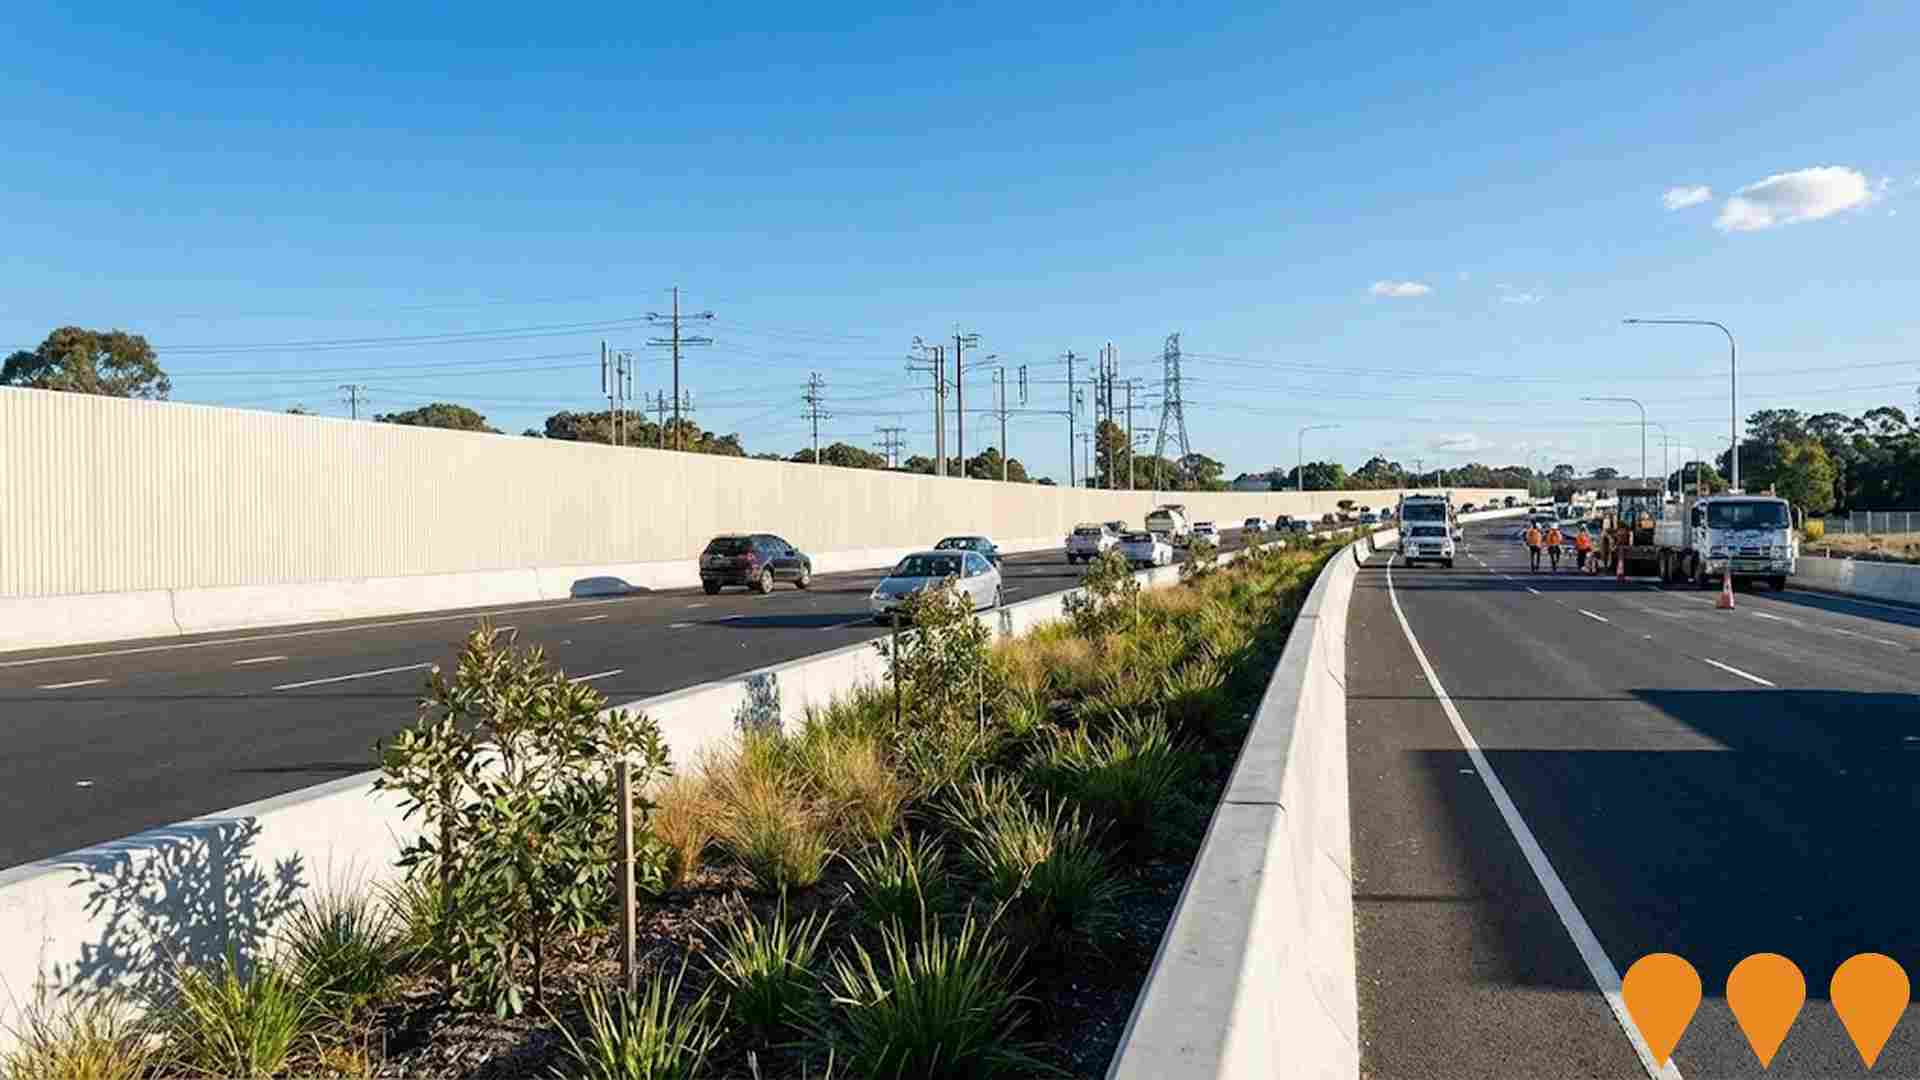
 Denotes AI-based impression for illustrative purposes only, not to be taken as definitive under any circumstances. Please follow links and conduct other investigations from the project's source for actual imagery. Developers and project owners wishing us to use original imagery please Contact Us and we will do so.
Frequently Asked Questions - Infrastructure
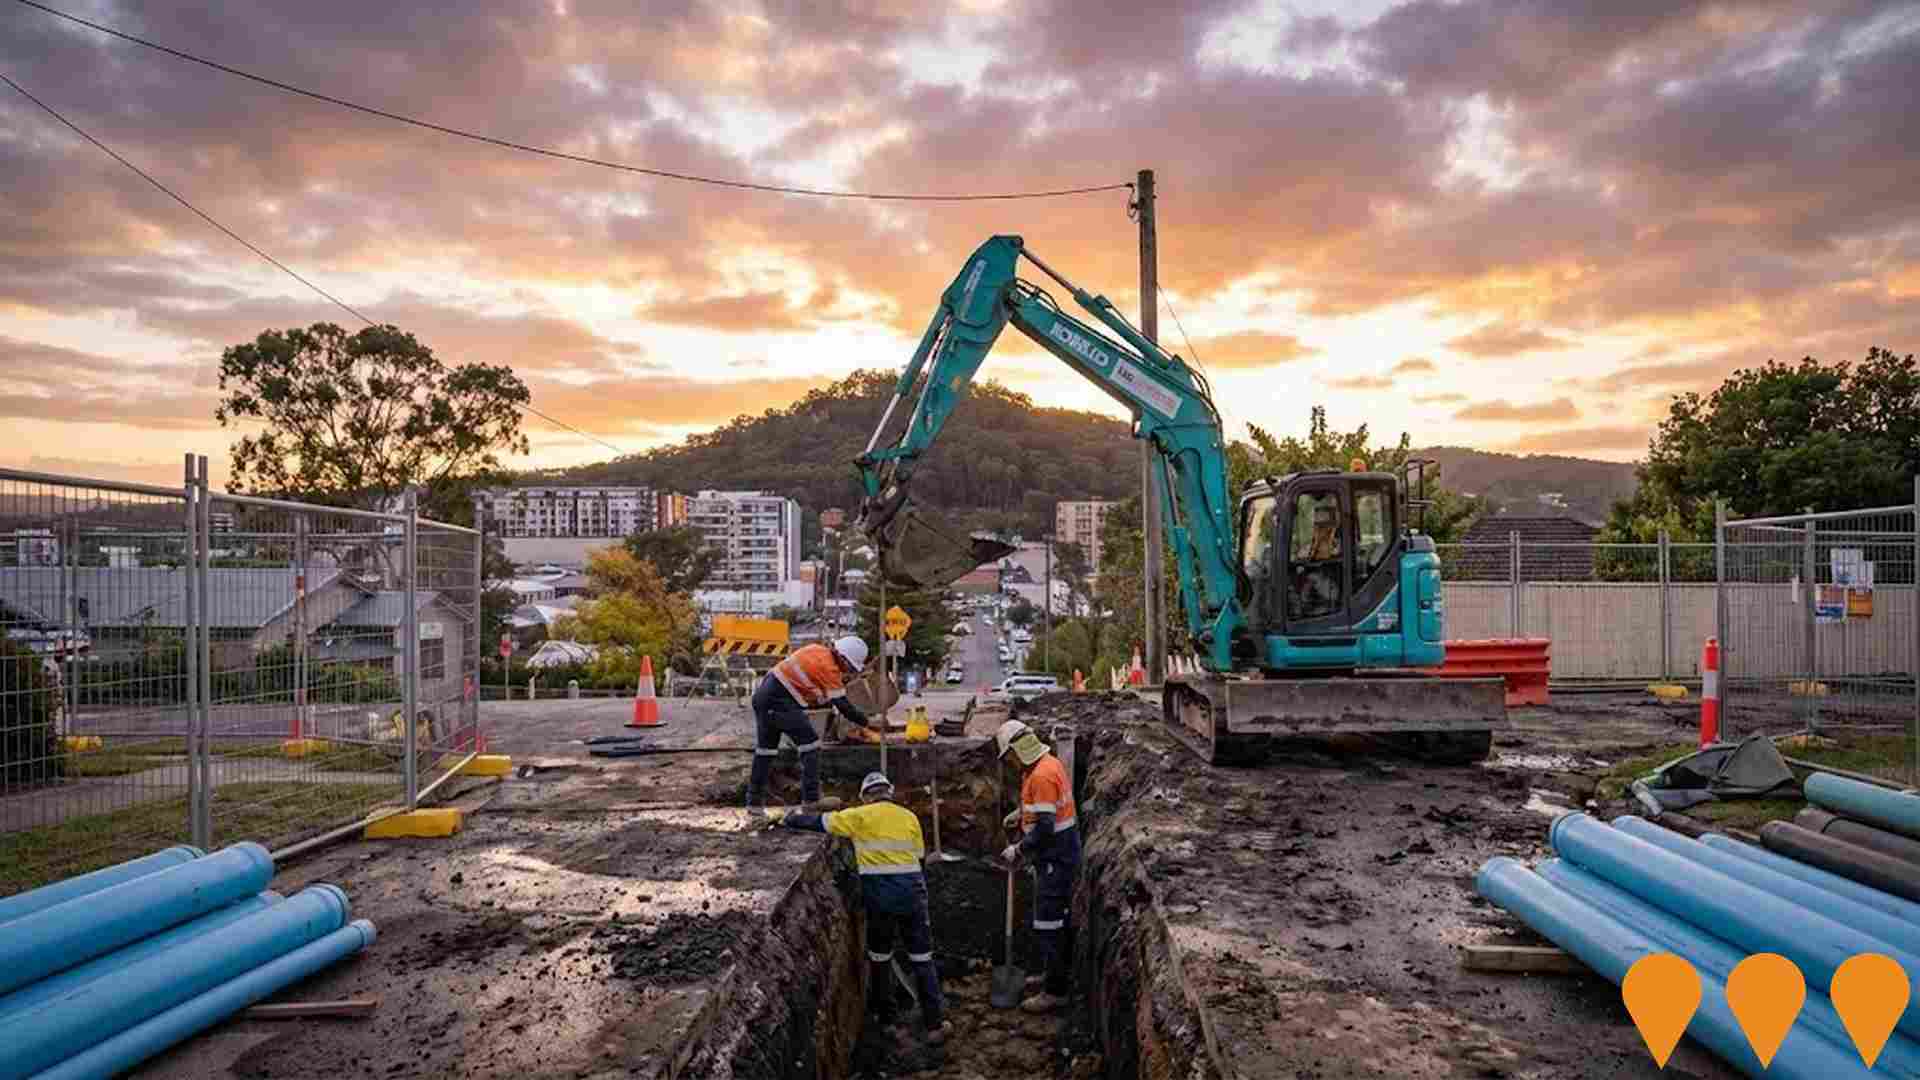
Gosford Hospital Redevelopment
Major $348 million hospital redevelopment featuring new 11-storey clinical services building, new front entrance, expanded emergency department, intensive care unit, birthing suite, maternity ward, rehabilitation unit, and cardiac catheterization labs. Teaching hospital affiliated with University of Newcastle with modern patient accommodation facilities and upgraded operating theatres.

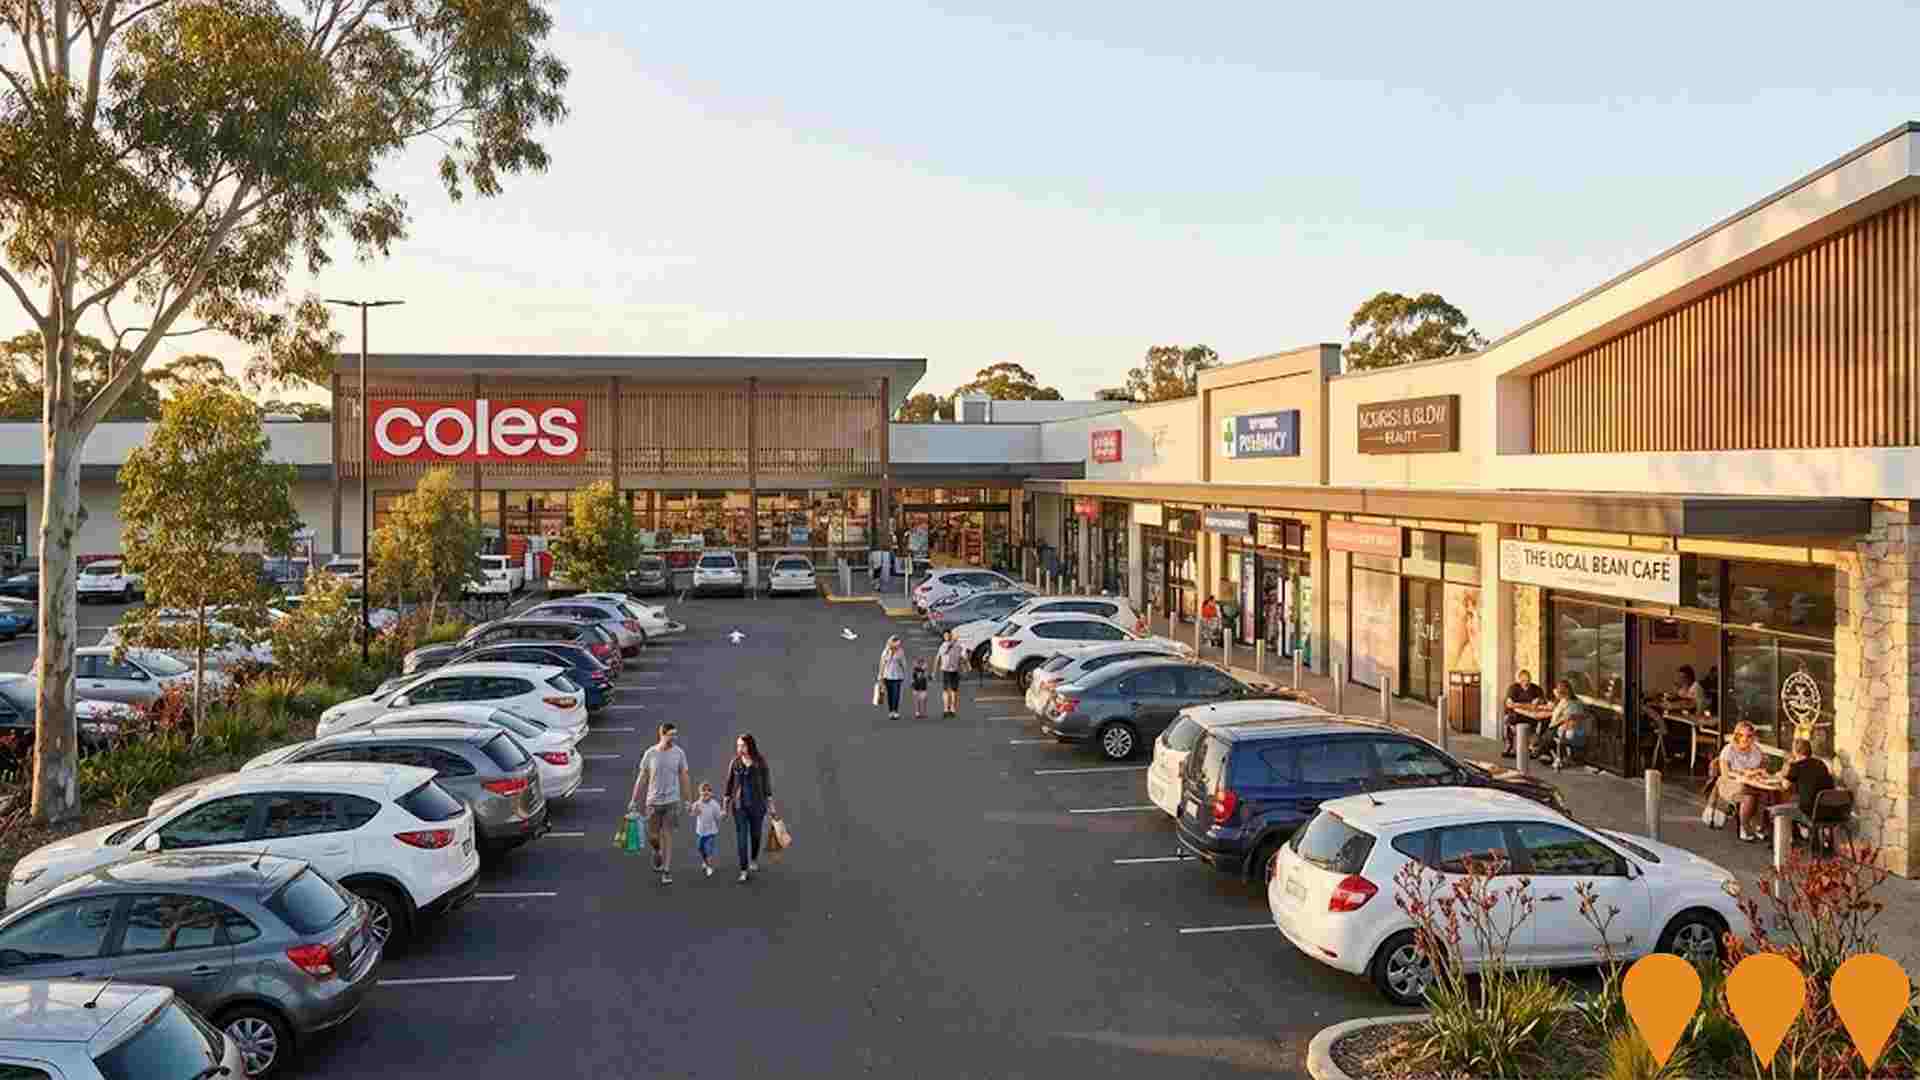
Wyoming Shopping Village Upgrade
Upgrade and enhancement of the neighbourhood shopping centre, anchored by Coles, with a tailored tenancy mix focused on health, beauty, food, and beverage services. Planning is complete for the centre upgrade.
Narara District Master Plan
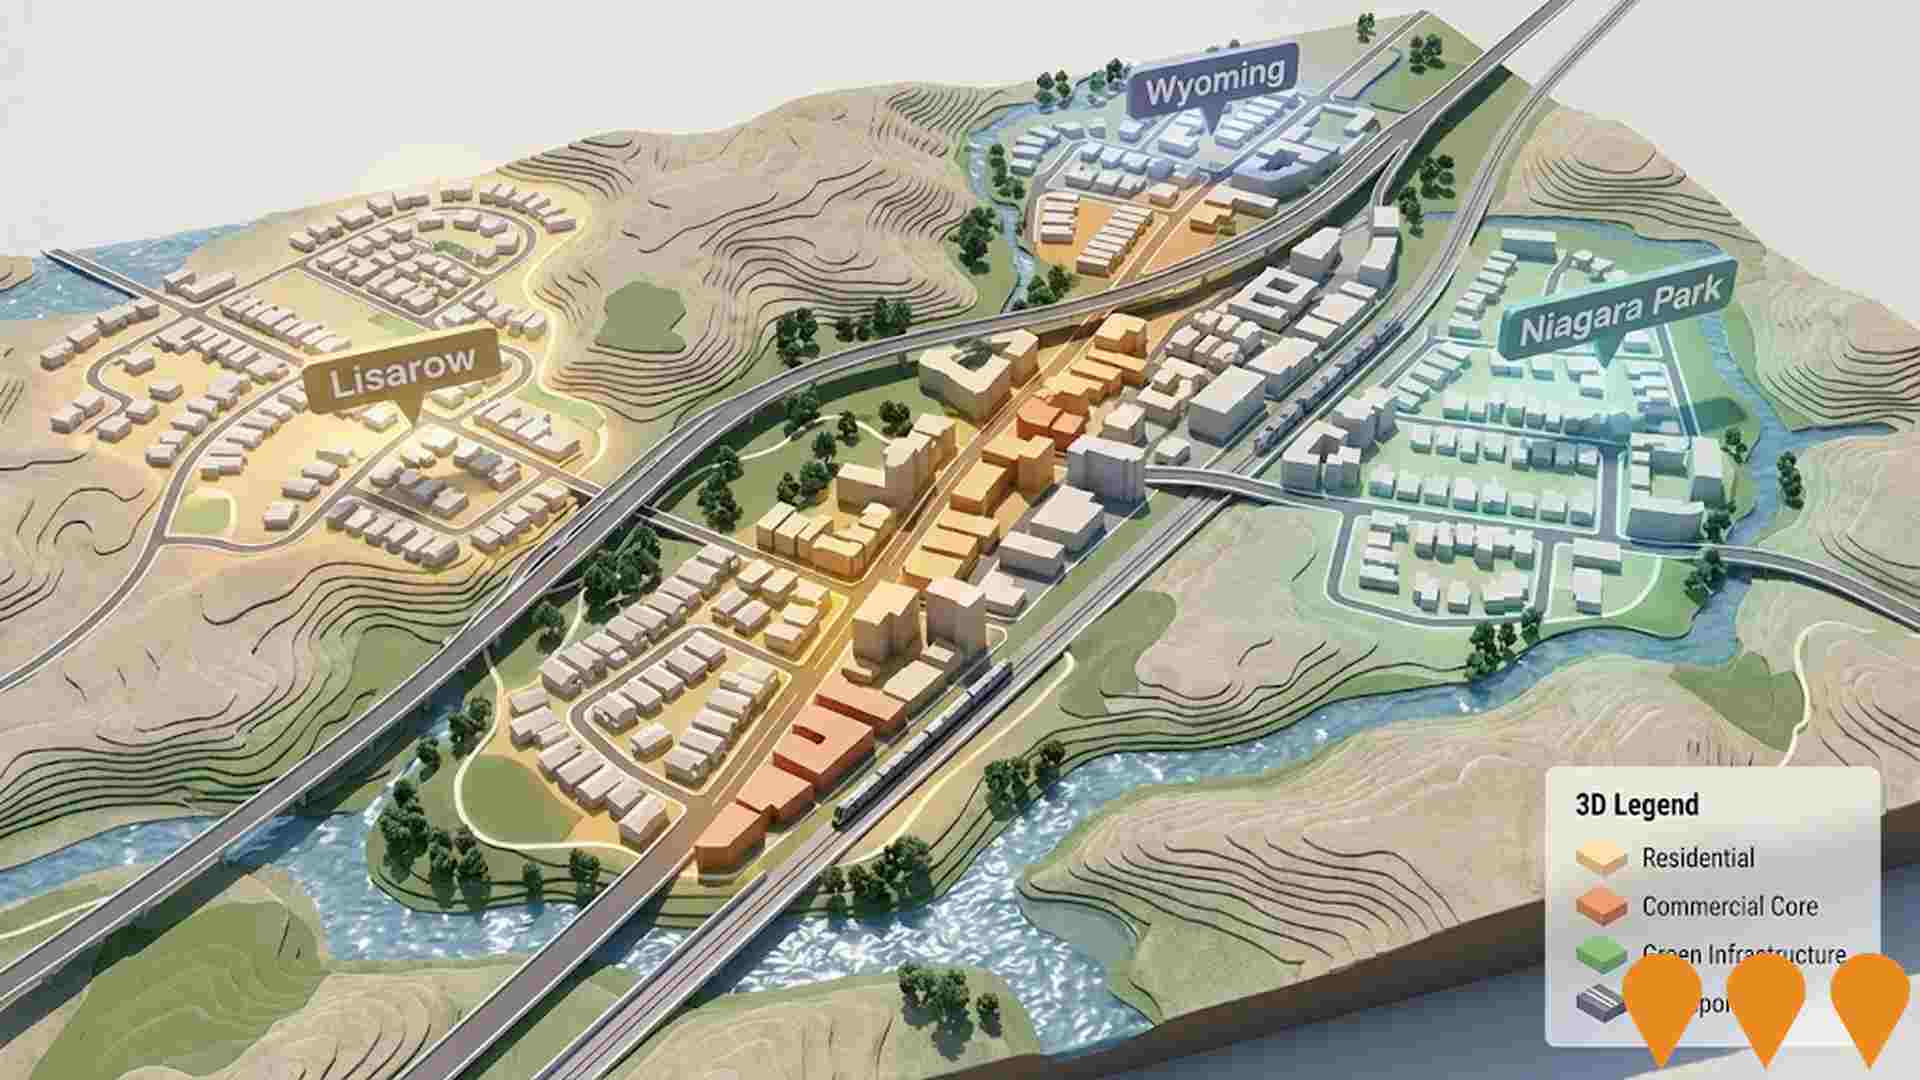
Development and delivery of master plans for the Narara District including Lisarow, Wyoming, and Niagara Park to support housing and urban development. The district is within the Central Coast Council local government area.
Narara Community Centre and Library Redevelopment
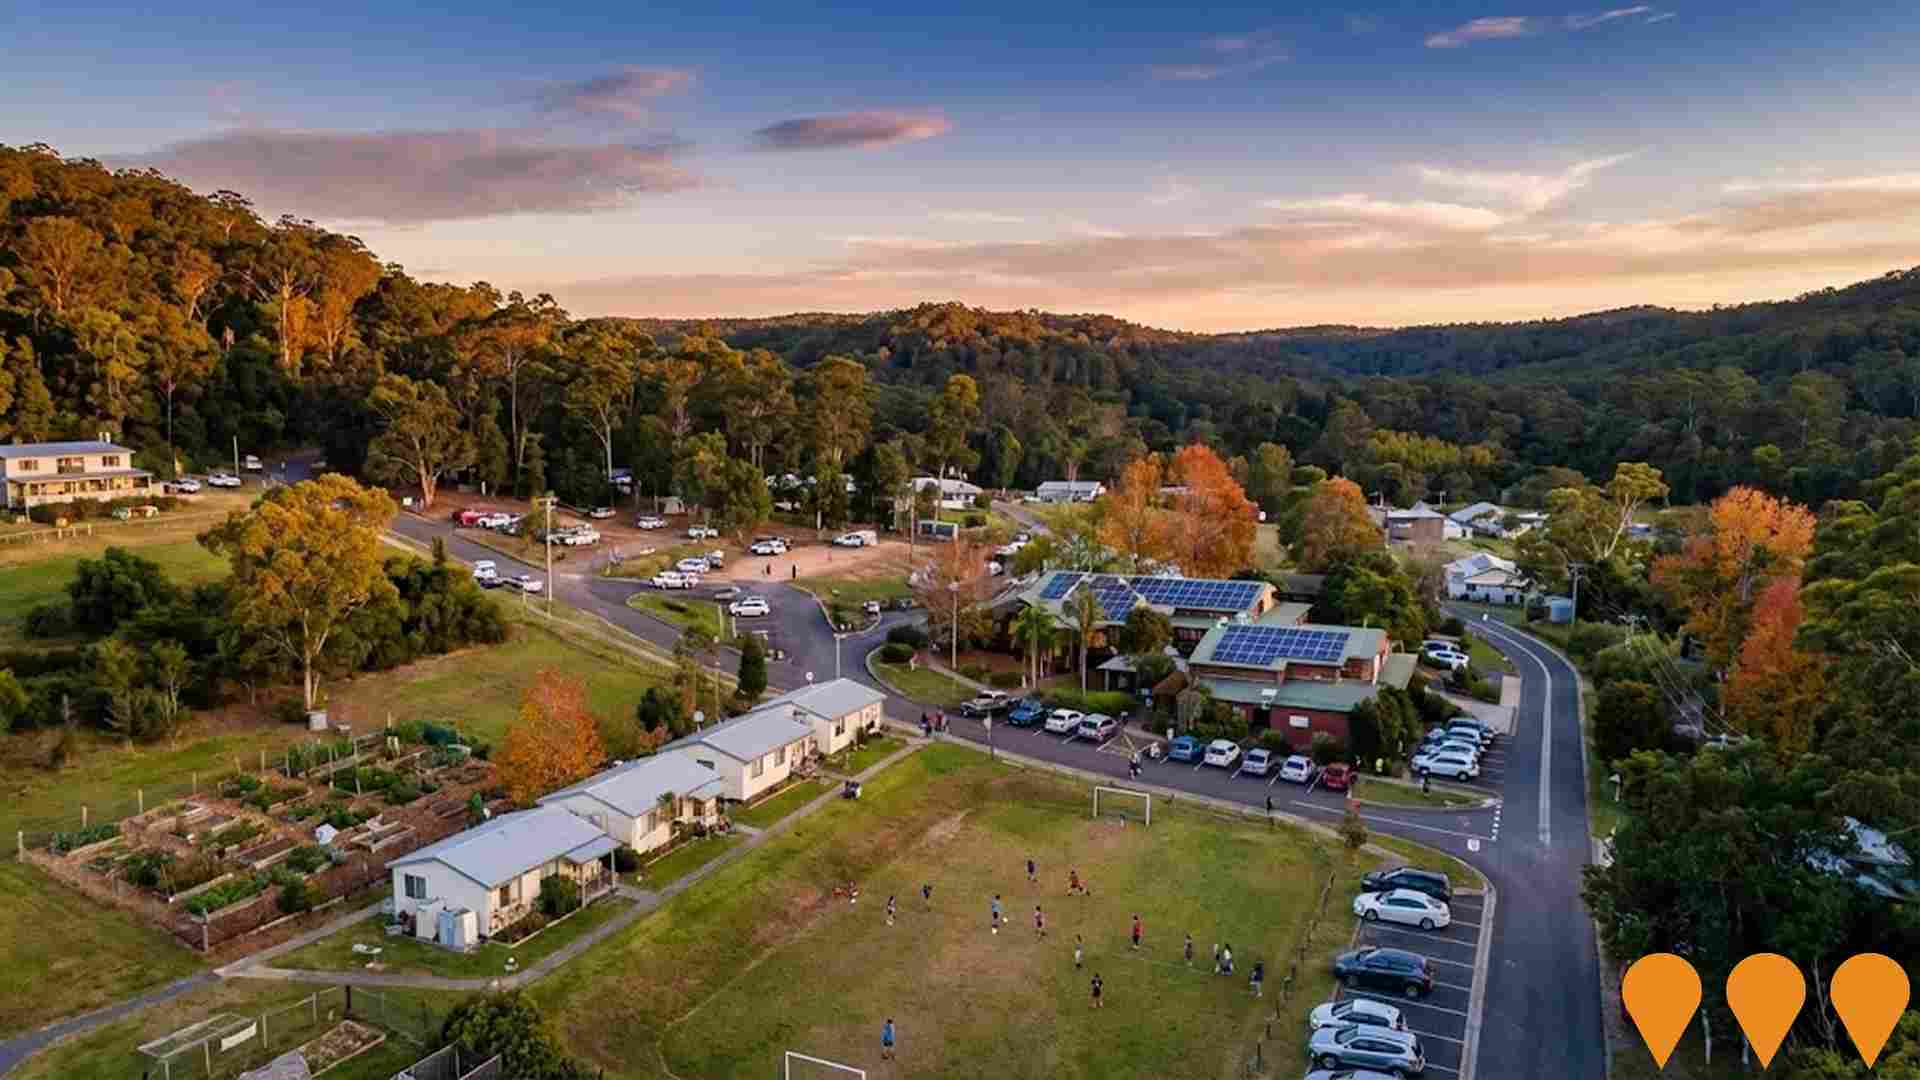
Concept plan by Central Coast Council to upgrade and expand the existing Narara Community Centre, with the potential to integrate a small branch library and co-located community services. The intent is to modernise internal spaces, improve accessibility and flexibility for programs, and strengthen the role of the centre as a local hub for support services, activities and learning. As at late 2025 there is no publicly advertised development application or construction program specific to the building redevelopment, although the site has recently benefited from other investments such as a rooftop solar array and community battery delivered with Ausgrid.
The Outlook Narara
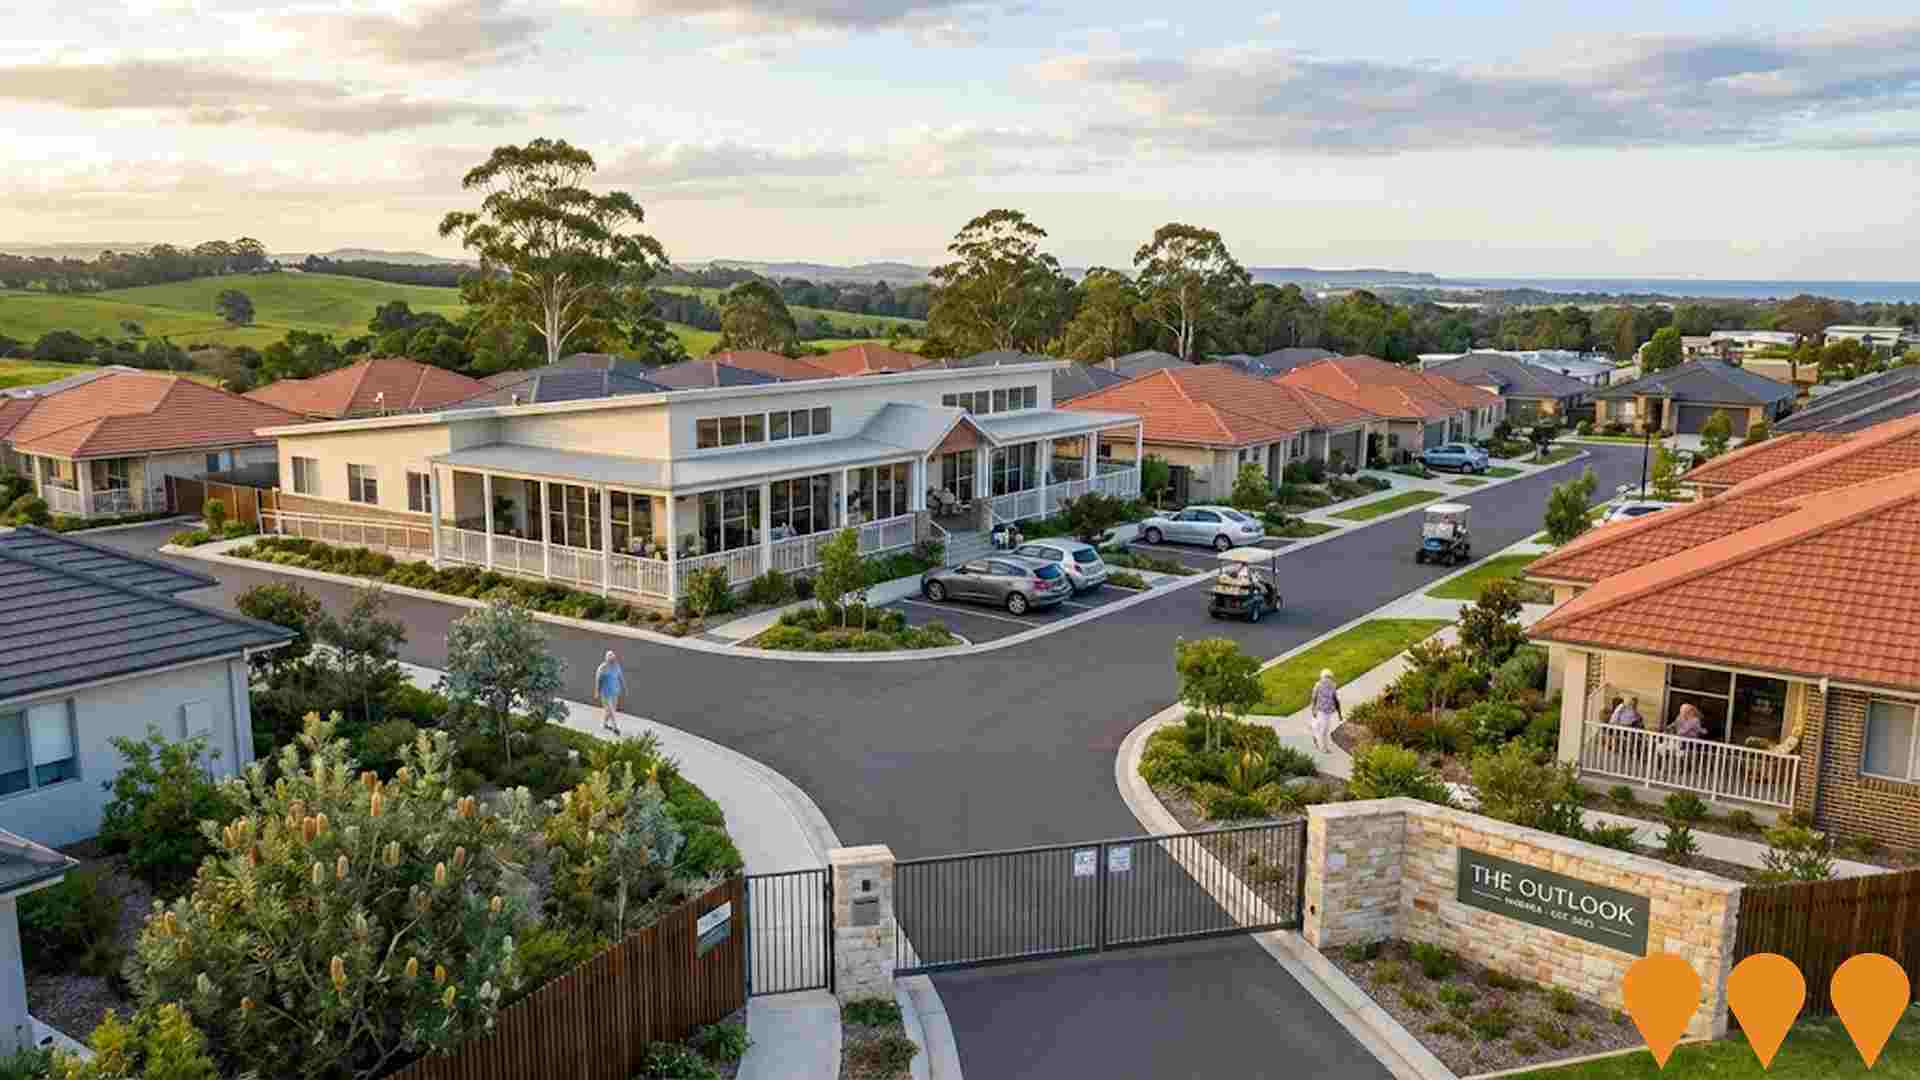
The Outlook Narara is a completed master planned over 55s lifestyle resort on the NSW Central Coast, comprising 178 independent living units delivered in stages between 2020 and 2023. The gated community provides resort style communal facilities and a residents clubhouse, offering low maintenance living for retirees close to Gosford services, shops and public transport. The village is now operating as an established over 55s community with ongoing lifestyle and management services in place.
Narara Ecovillage
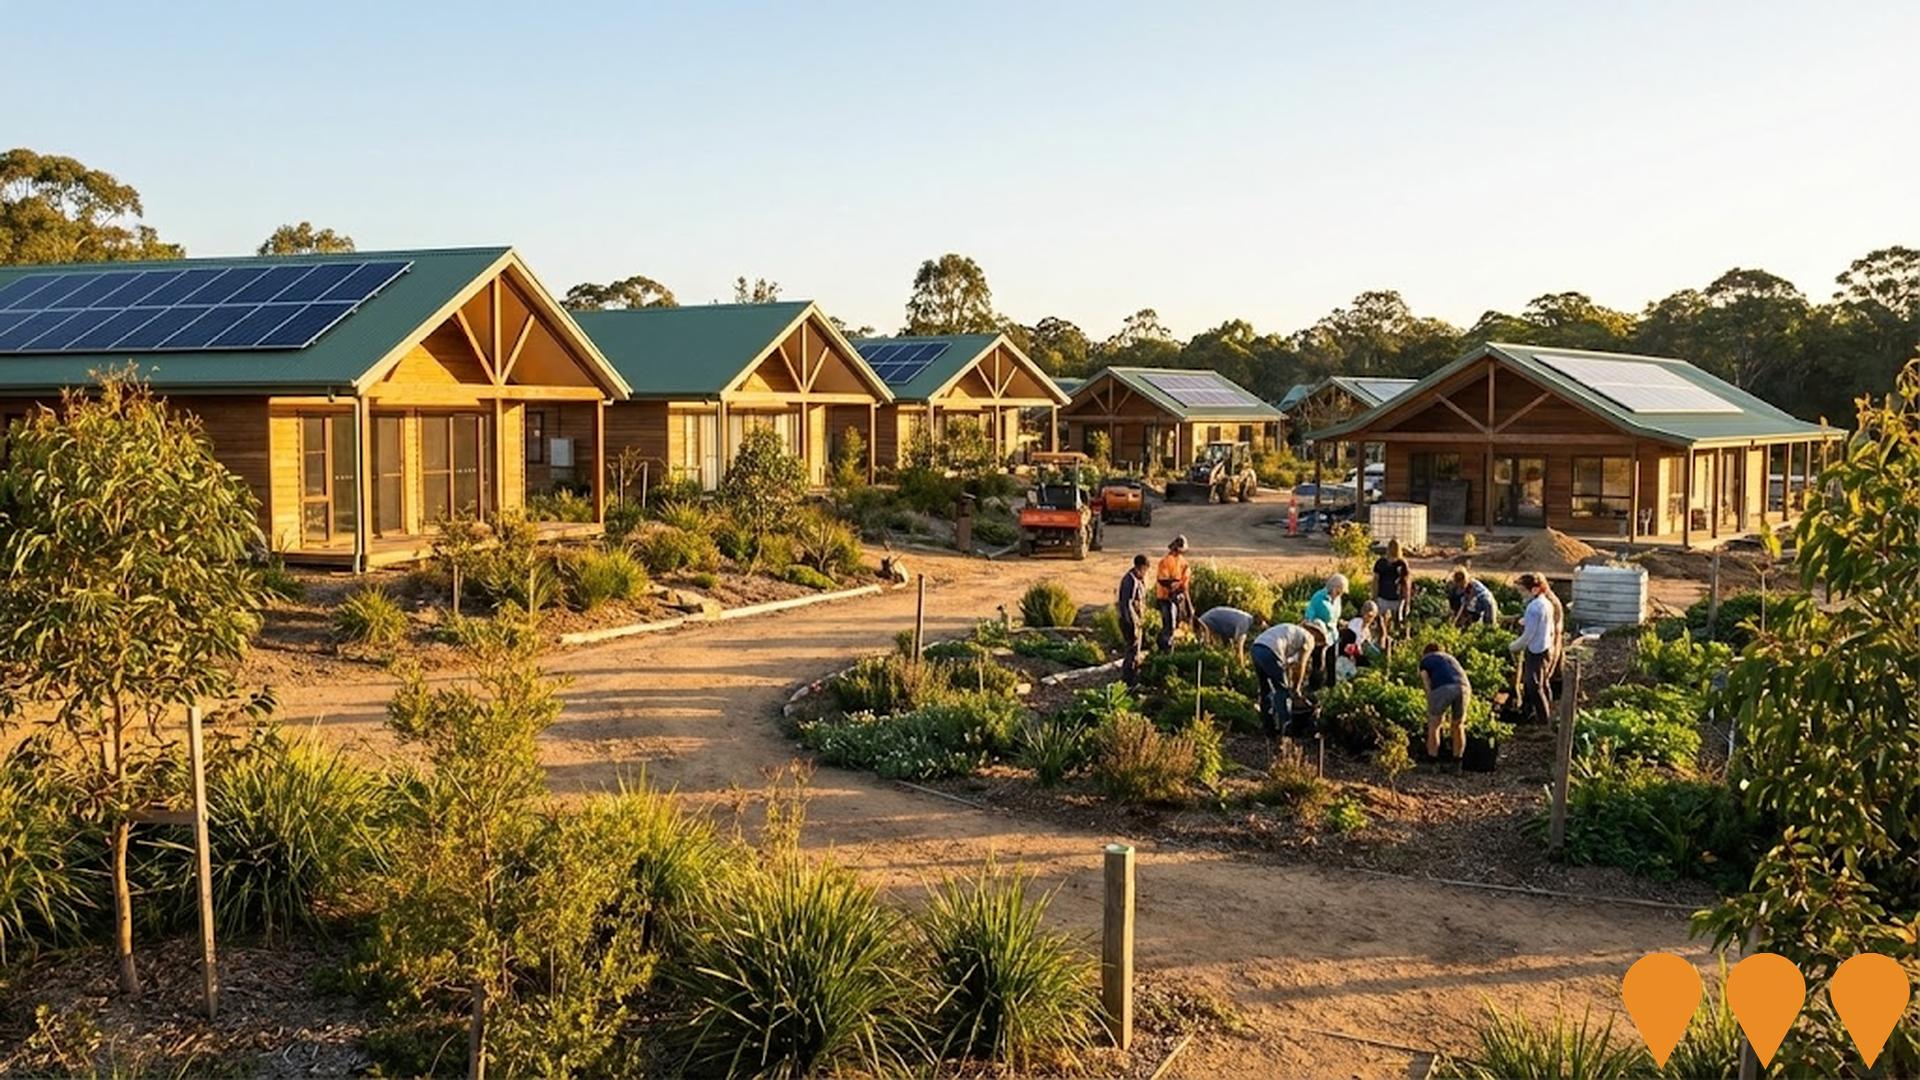
Narara Ecovillage is a 64 hectare community title eco housing development on the former Gosford horticultural research station at Narara, planned for around 150 low impact homes plus shared community facilities, food growing spaces and integrated energy and water infrastructure. Stage 1 is largely complete and occupied, while Stage 2 civil works finished at the end of 2023 with most of the 40 plus new lots sold, owners preparing development applications and a growing number of homes under construction or already occupied; a planning proposal and amended planning agreement are progressing to support a future Stage 3 with more diverse housing types and small scale local services. :contentReference[oaicite:0]{index=0} :contentReference[oaicite:1]{index=1} :contentReference[oaicite:2]{index=2}
Telecommunications Mobile Base Station
Development Application (DA/1244/2025) submitted to Central Coast Council by Amplitel Pty Ltd for the construction of a new telecommunications mobile base station at 172 Glennie St, Wyoming. The project aims to improve network coverage in the area. Written submissions on the application close on 20 October 2025.

M1 Pacific Motorway Kariong to Somersby Widening
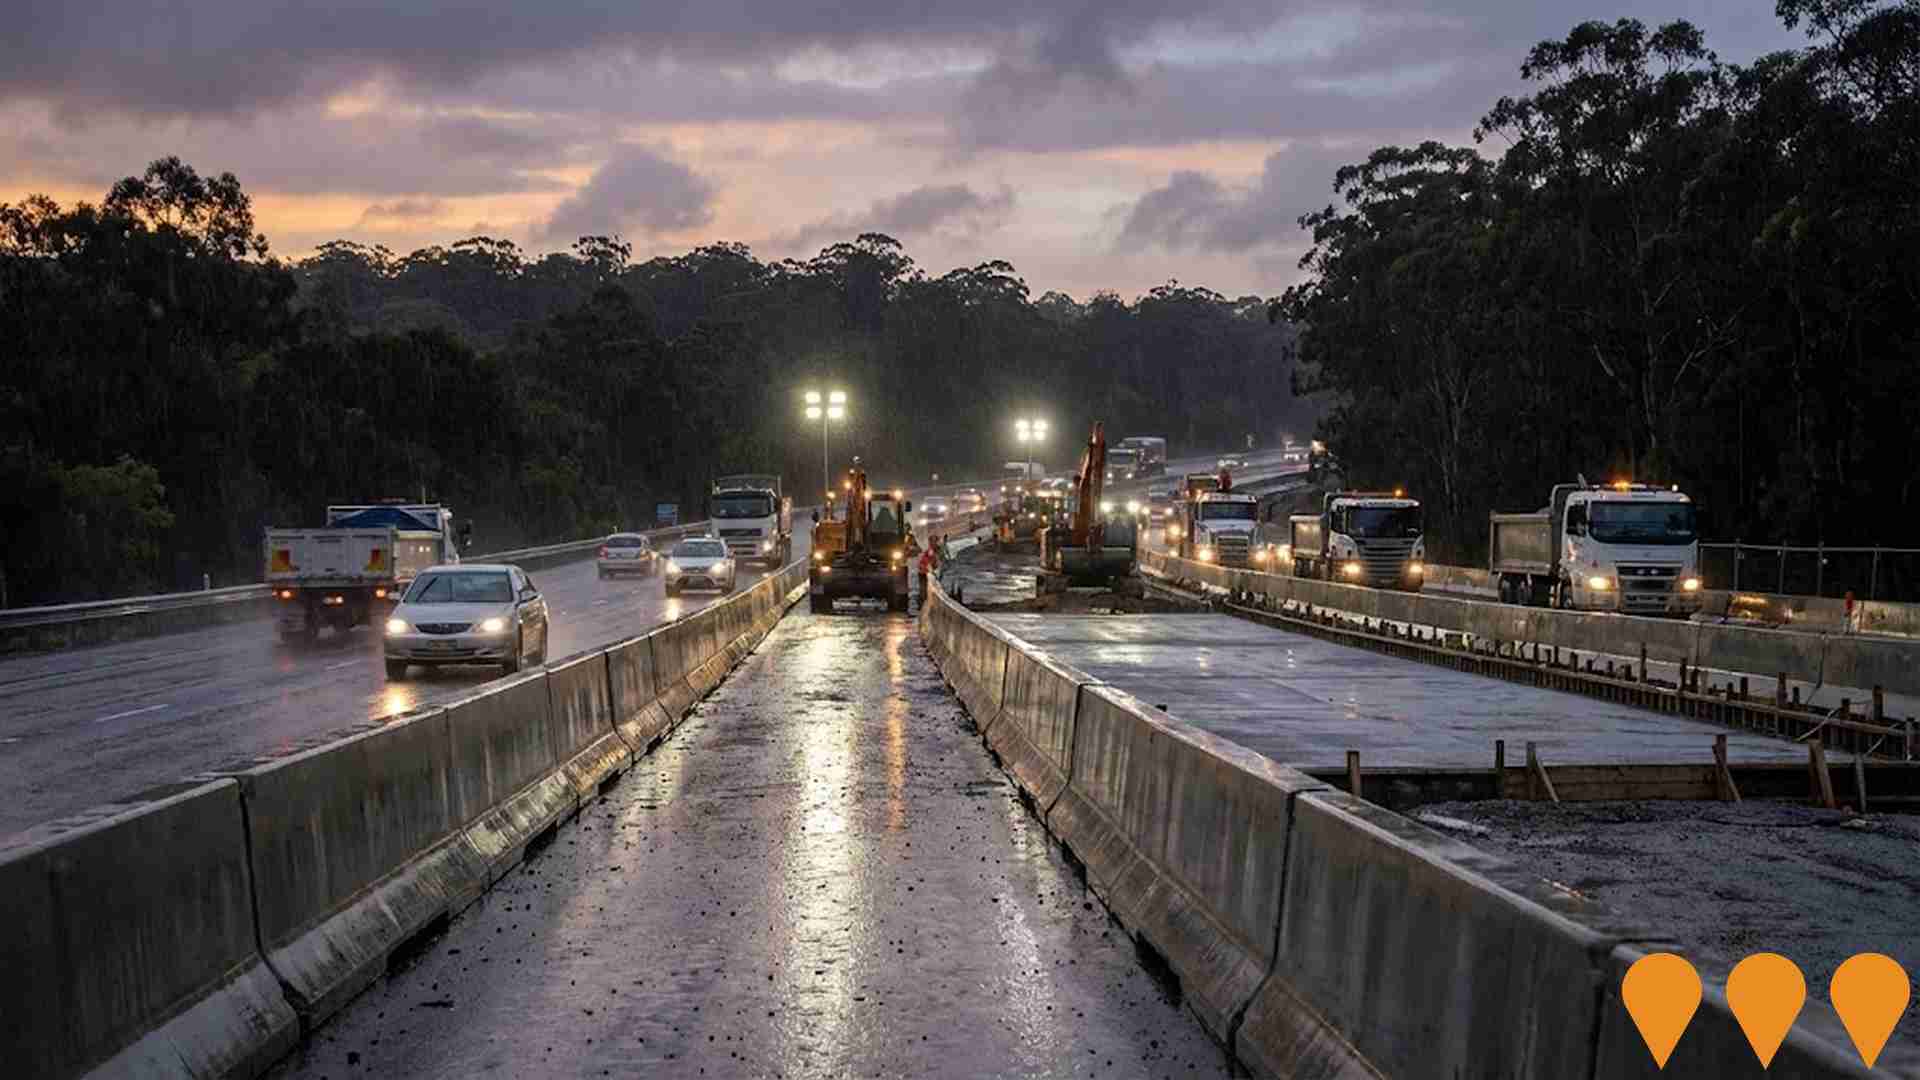
Widening of M1 Pacific Motorway between Kariong and Somersby interchanges to improve traffic flow and reduce congestion on this critical corridor between Sydney and Newcastle.
Employment
The exceptional employment performance in Niagara Park - Lisarow places it among Australia's strongest labour markets
Niagara Park - Lisarow has an unemployment rate of 1.9% with estimated employment growth of 3.2% over the past year as of September 2025. The area's workforce participation is at 63.9%, slightly higher than Greater Sydney's 60.0%.
Key industries include health care & social assistance, retail trade, and construction, with a strong specialization in health care & social assistance (1.3 times the regional level). Professional & technical services have limited presence with 6.9% employment compared to the regional average of 11.5%. Employment opportunities locally appear limited based on Census data comparison between working population and resident population. Over the past year, employment increased by 3.2% alongside labour force growth of 3.2%, keeping unemployment broadly flat.
In contrast, Greater Sydney recorded employment growth of 2.1% with unemployment rising slightly to 4.2%. State-wide in NSW as of 25-Nov, employment contracted by 0.03% while the unemployment rate was at 3.9%. Nationally, the unemployment rate stood at 4.3%. Jobs and Skills Australia's national employment forecasts from May-25 project a 6.6% increase over five years and 13.7% over ten years for all industries combined. Applying these projections to Niagara Park - Lisarow's industry mix suggests local employment should increase by approximately 6.6% over five years and 13.8% over ten years, assuming no change in population projections.
Frequently Asked Questions - Employment
Income
The economic profile demonstrates above-average performance, with income metrics exceeding national benchmarks based on AreaSearch comparative assessment
AreaSearch's latest postcode level ATO data for financial year 2022 shows Niagara Park - Lisarow SA2 had a median income of $51,783 and an average income of $66,919 among taxpayers. This is slightly above the national average. Greater Sydney, for comparison, had a median income of $56,994 and an average income of $80,856 in the same period. Based on Wage Price Index growth of 12.61% since financial year 2022, estimated incomes as of September 2025 would be approximately $58,313 (median) and $75,357 (average). Census data indicates that incomes in Niagara Park - Lisarow cluster around the 56th percentile nationally. Income analysis reveals that 33.7% of locals (2,788 people) fall into the $1,500 - 2,999 income category, similar to the surrounding region where 30.9% occupy this range. High housing costs consume 15.3% of income. Despite this, disposable income ranks at the 65th percentile nationally, and the area's SEIFA income ranking places it in the 6th decile.
Frequently Asked Questions - Income
Housing
Niagara Park - Lisarow is characterized by a predominantly suburban housing profile, with ownership patterns similar to the broader region
Niagara Park - Lisarow dwelling structure in the latest Census showed 84.5% houses and 15.4% other dwellings (semi-detached, apartments, 'other' dwellings). In comparison, Sydney metro had 74.2% houses and 25.9% other dwellings. Home ownership in Niagara Park - Lisarow was 32.8%, with mortgaged dwellings at 49.3% and rented ones at 18.0%. The median monthly mortgage repayment was $2,000, lower than Sydney metro's $2,150. Median weekly rent in Niagara Park - Lisarow was $425, compared to Sydney metro's $400. Nationally, Niagara Park - Lisarow mortgage repayments were higher at $2,000 versus Australia's average of $1,863. Rents were also substantially higher at $425 compared to the national figure of $375.
Frequently Asked Questions - Housing
Household Composition
Niagara Park - Lisarow features high concentrations of family households, with a higher-than-average median household size
Family households account for 79.2% of all households, including 40.5% couples with children, 25.1% couples without children, and 12.9% single parent families. Non-family households make up the remaining 20.8%, with lone person households at 18.5% and group households comprising 2.2%. The median household size is 2.8 people, larger than the Greater Sydney average of 2.5.
Frequently Asked Questions - Households
Local Schools & Education
Niagara Park - Lisarow performs slightly above the national average for education, showing competitive qualification levels and steady academic outcomes
The area's university qualification rate is 23.4%, significantly lower than Greater Sydney's average of 38.0%. Bachelor degrees are the most common at 16.4%, followed by postgraduate qualifications (4.8%) and graduate diplomas (2.2%). Vocational credentials are prominent, with 40.0% of residents aged 15+ holding them - advanced diplomas (11.9%) and certificates (28.1%). Educational participation is high at 30.5%, including 10.3% in primary education, 9.2% in secondary education, and 4.5% pursuing tertiary education.
Educational participation is notably high, with 30.5% of residents currently enrolled in formal education. This includes 10.3% in primary education, 9.2% in secondary education, and 4.5% pursuing tertiary education.
Frequently Asked Questions - Education
Schools Detail
Nearby Services & Amenities
Transport
Transport servicing is moderate compared to other areas nationally based on assessment of service frequency, route connectivity and accessibility
Niagara Park - Lisarow has 54 active public transport stops. These comprise a mix of train and bus services. There are 48 individual routes operating in total, facilitating 1,390 weekly passenger trips.
Transport accessibility is rated as good, with residents located an average of 281 meters from the nearest stop. Service frequency averages 198 trips per day across all routes, equating to approximately 25 weekly trips per stop.
Frequently Asked Questions - Transport
Transport Stops Detail
Health
Health performance in Niagara Park - Lisarow is lower than average with common health conditions somewhat prevalent across the board, though to a slightly higher degree among older age cohorts
Niagara Park - Lisarow faces significant health challenges with common health conditions somewhat prevalent across all age groups, but slightly higher among older cohorts. Approximately 52% of its total population (~4335 people) has private health cover, compared to Greater Sydney's 54.7%.
Mental health issues and asthma are the most common medical conditions in the area, affecting 9.7% and 8.6% of residents respectively. About 65.9% of residents report having no medical ailments, compared to 64.8% across Greater Sydney. The area has 17.1% of residents aged 65 and over (1413 people), lower than the 24.5% in Greater Sydney. Health outcomes among seniors require more attention due to these challenges.
Frequently Asked Questions - Health
Cultural Diversity
Niagara Park - Lisarow ranks below the Australian average when compared to other local markets across a number of language and cultural background related metrics
Niagara Park-Lisarow showed lower cultural diversity, with 82.9% born in Australia, 92.6% being citizens, and 92.8% speaking English only at home. Christianity was the dominant religion at 53.1%. Judaism was overrepresented at 0.2%, compared to 0.2% regionally.
Top ancestral groups were English (31.5%), Australian (29.2%), and Irish (8.4%). Notable divergences included Welsh at 0.7% (vs 0.7% regionally), Korean at 0.4% (vs 0.3%), and South African at 0.5% (vs 0.5%).
Frequently Asked Questions - Diversity
Age
Niagara Park - Lisarow's population is slightly older than the national pattern
Niagara Park - Lisarow has a median age of 40, which is higher than Greater Sydney's figure of 37 and Australia's figure of 38. The 5-14 cohort is over-represented at 14.3% compared to the Greater Sydney average, while the 25-34 cohort is under-represented at 9.6%. Between 2021 and present, the 15-24 age group has increased from 12.7% to 14.0%, and the 75-84 cohort has increased from 4.5% to 5.8%. Conversely, the 25-34 cohort has declined from 10.7% to 9.6%. By 2041, demographic modeling suggests Niagara Park - Lisarow's age profile will change significantly. The 75-84 age cohort is projected to increase by 179 people (38%), from 477 to 657. Notably, the combined 65+ age groups are expected to account for 74% of total population growth, reflecting the area's aging demographic profile. Meanwhile, the 65-74 and 15-24 cohorts are expected to experience population declines.
