Chart Color Schemes
This analysis uses ABS Statistical Areas Level 2 (SA2) boundaries, which can materially differ from Suburbs and Localities (SAL) even when sharing similar names.
SA2 boundaries are defined by the Australian Bureau of Statistics and are designed to represent communities for statistical reporting (e.g., census and ERP).
Suburbs and Localities (SAL) represent commonly-used suburb/locality names (postal-style areas) and may use different geographic boundaries. For comprehensive analysis, consider reviewing both boundary types if available.
est. as @ -- *
ABS ERP | -- people | --
2021 Census | -- people
Sales Activity
Curious about local property values? Filter the chart to assess the volume and appreciation (including resales) trends and regional comparisons, or scroll to the map below view this information at an individual property level.
Find a Recent Sale
Sales Detail
Population
Population growth drivers in Cairnlea are slightly above average based on AreaSearch's ranking of recent, and medium term trends
Cairnlea's population was 10,038 as of the 2021 Census. By Nov 2025, it is estimated to be around 10,042, reflecting an increase of 4 people since the Census. This change is inferred from the ABS estimated resident population of 10,045 in June 2024 and address validation since the Census date. The population density as of Nov 2025 is around 2,277 persons per square kilometer. Over the past decade ending in Nov 2025, Cairnlea has shown a compound annual growth rate of 0.2%, outpacing its SA3 area. Overseas migration contributed approximately 66.1% of overall population gains during this period.
AreaSearch projects that the area will increase by 1793 persons to reach a total of 11,825 by 2041 based on latest annual ERP population numbers, reflecting an increase of 17.9% over the 17-year period from Nov 2025 to Dec 2041.
Frequently Asked Questions - Population
Development
The level of residential development activity in Cairnlea is very low in comparison to the average area assessed nationally by AreaSearch
Cairnlea has averaged approximately 11 new dwelling approvals per year over the past five financial years, totalling 57 homes. In the current financial year of FY26, 7 approvals have been recorded so far. The population has declined in recent years, suggesting that new supply has likely been meeting demand, providing good options for buyers. New properties are constructed at an average expected cost value of $452,000, which is somewhat higher than regional norms, reflecting quality-focused development.
This financial year has seen $19.6 million in commercial approvals, indicating moderate levels of commercial development. Compared to Greater Melbourne, Cairnlea records significantly lower building activity, at 63.0% below the regional average per person. This limited new supply generally supports stronger demand and values for established properties. This level is also below the national average, suggesting the area's maturity and possible planning constraints. Recent development has been entirely comprised of standalone homes, maintaining Cairnlea's traditional suburban character with a focus on family homes appealing to those seeking space.
With approximately 1559 people per approval, Cairnlea shows characteristics of a mature, established area. According to the latest AreaSearch quarterly estimate, Cairnlea is expected to grow by 1,796 residents through to 2041. If current development rates continue, housing supply may not keep pace with population growth, potentially increasing competition among buyers and supporting stronger price growth.
Frequently Asked Questions - Development
Infrastructure
Cairnlea has moderate levels of nearby infrastructure activity, ranking in the 40thth percentile nationally
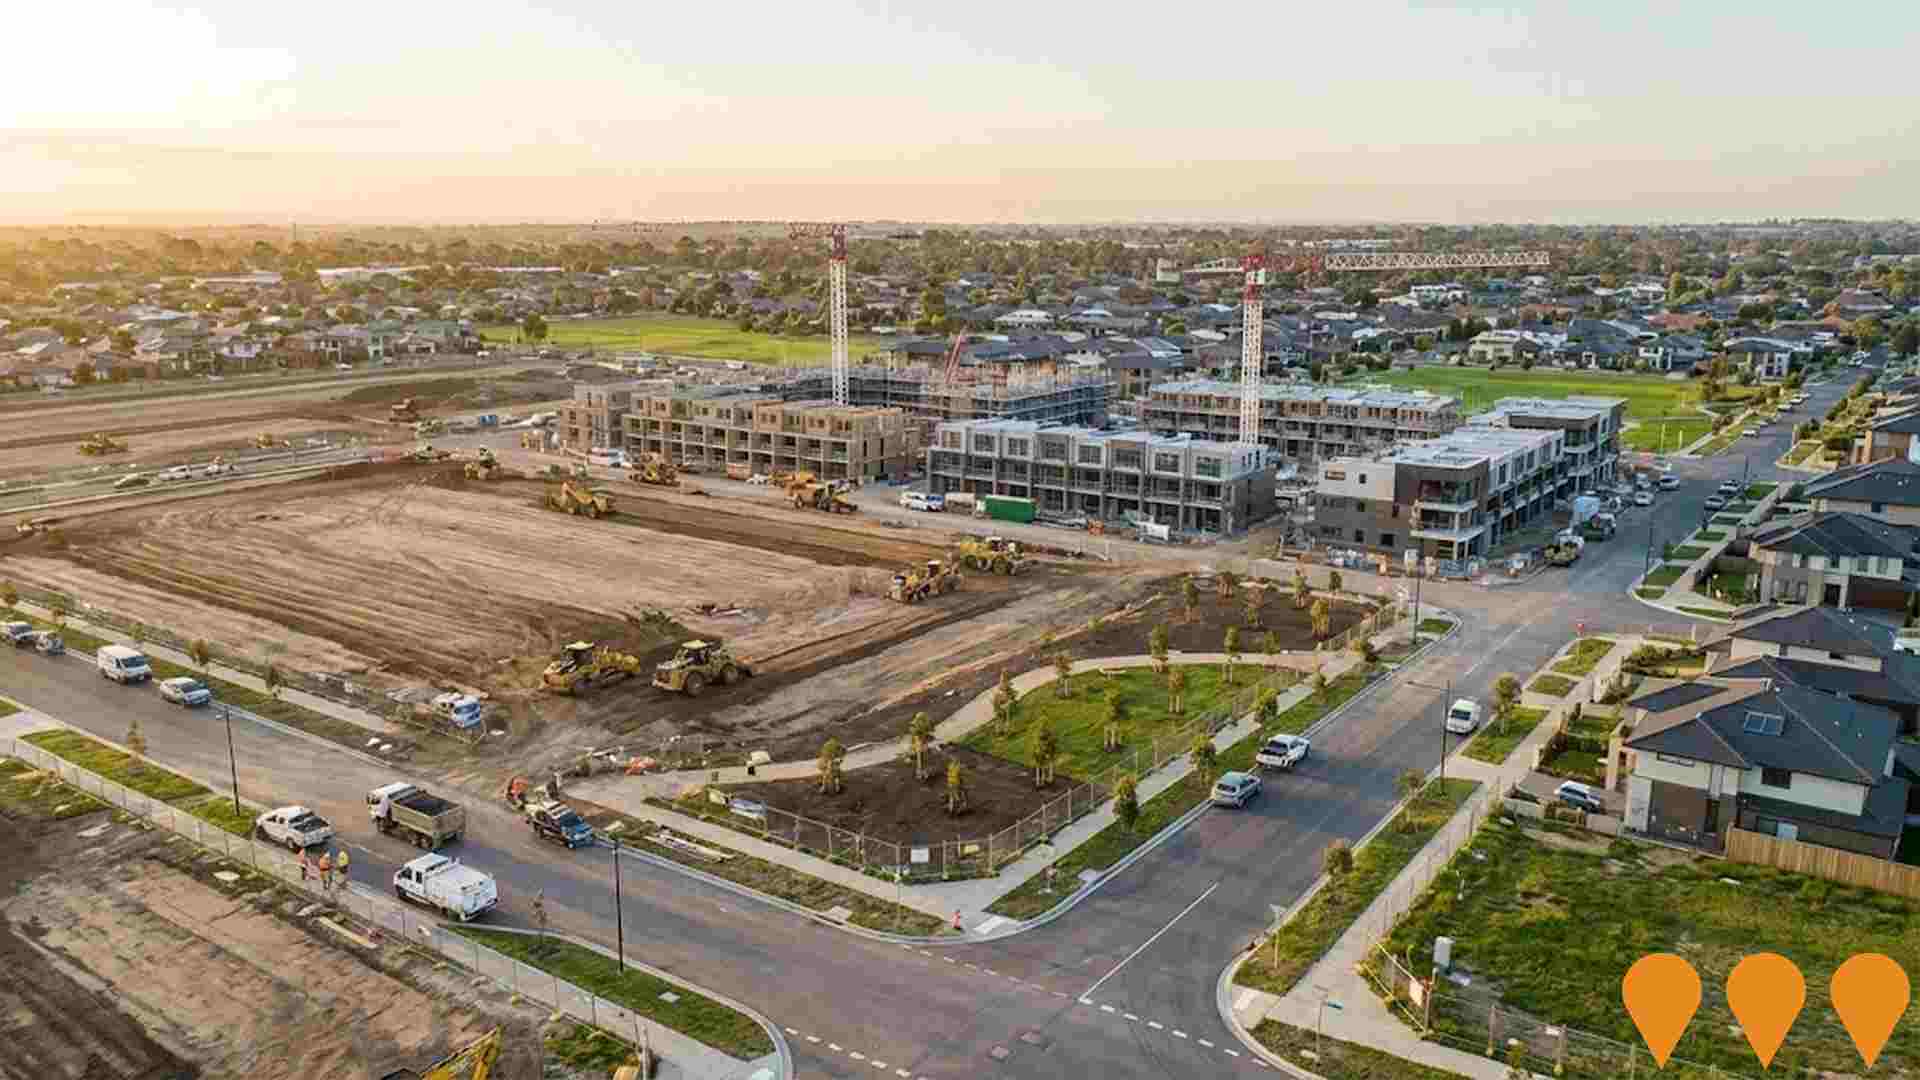
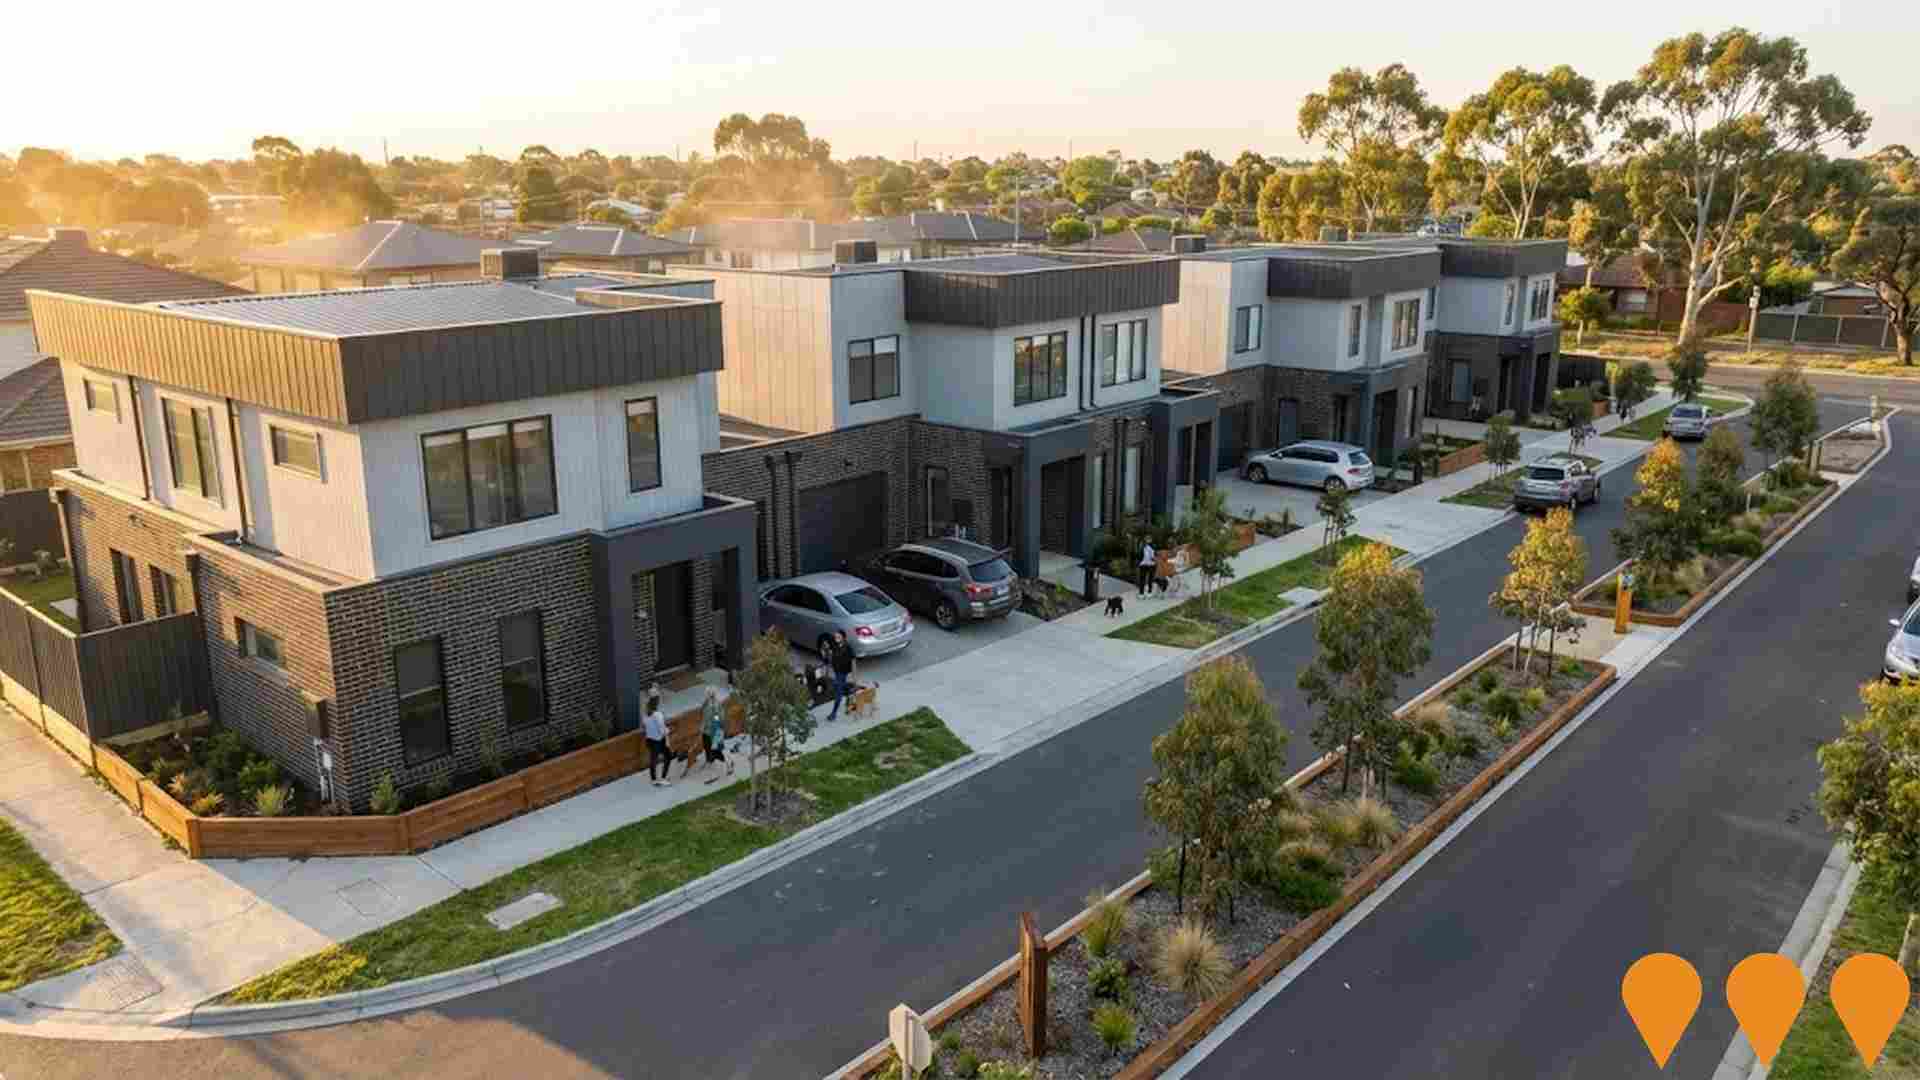
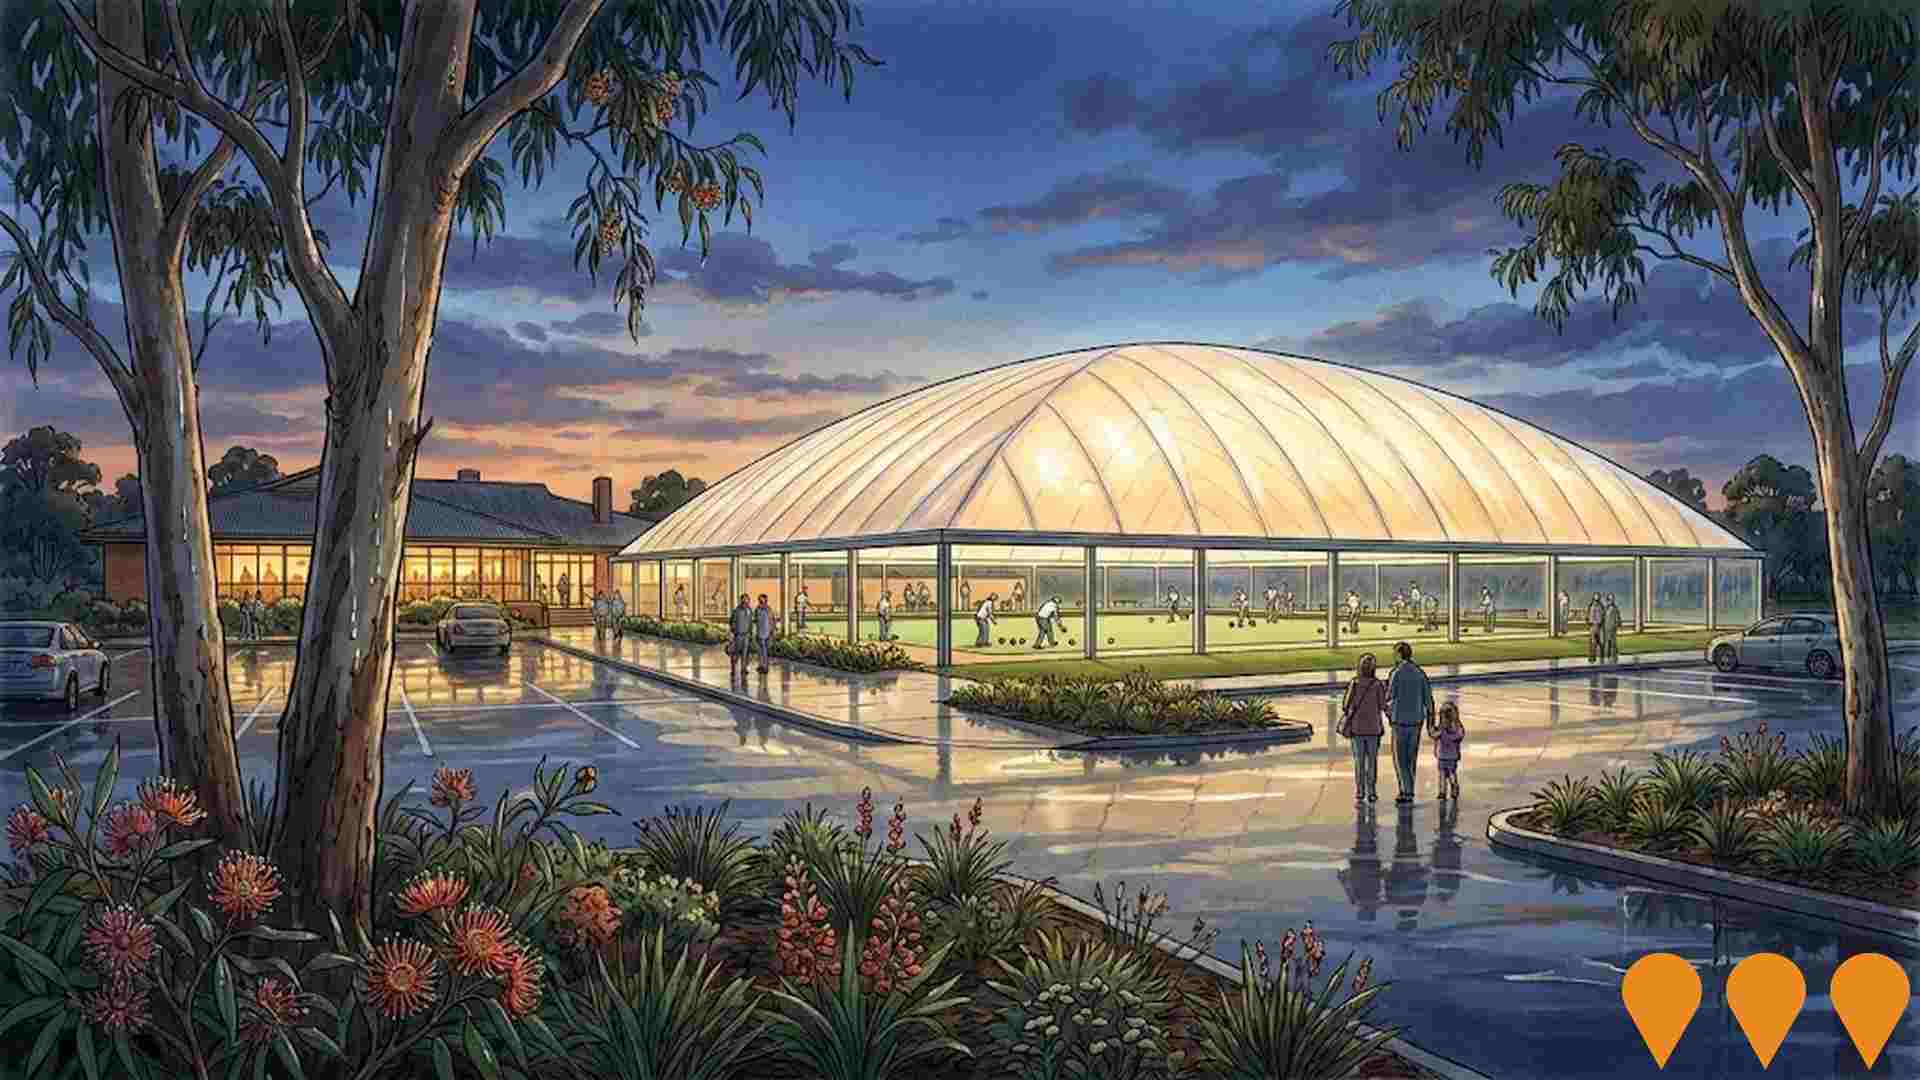
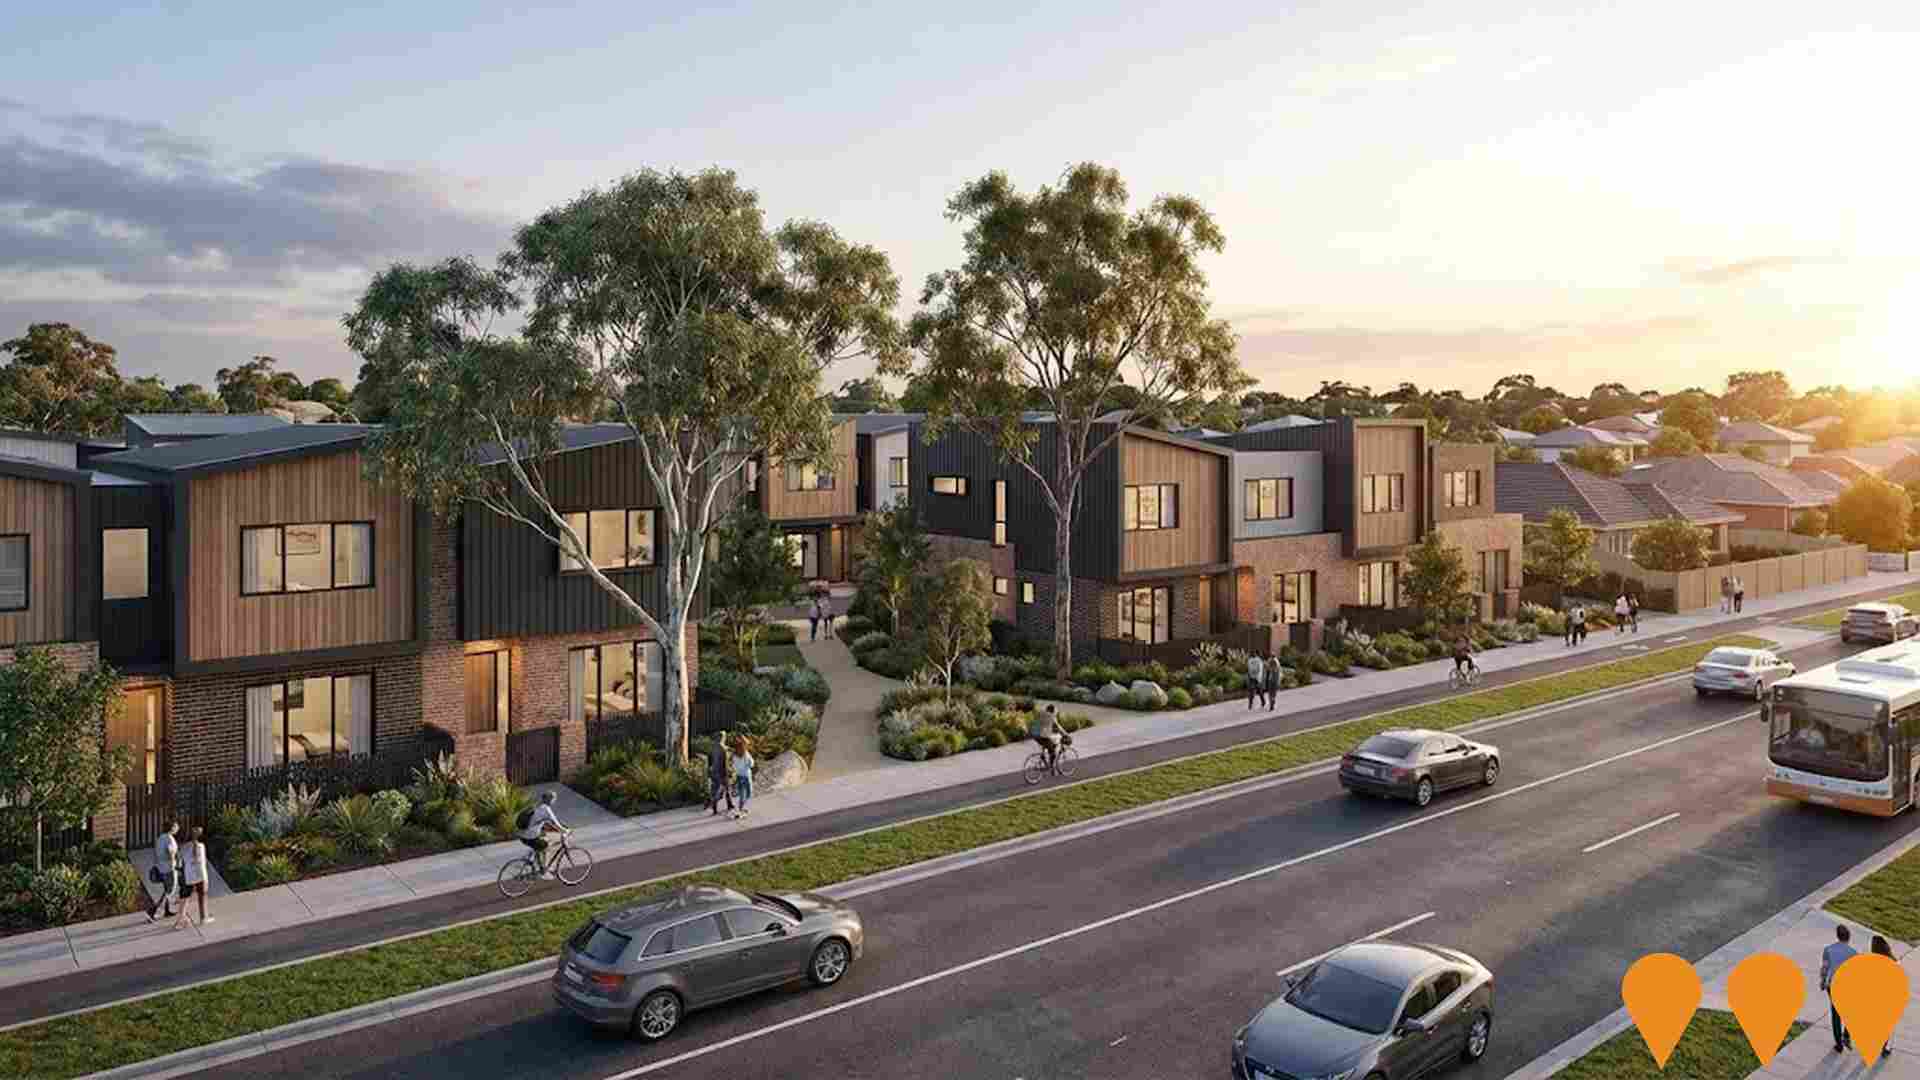
Changes to local infrastructure significantly impact an area's performance. AreaSearch has identified 21 projects that could affect this region. Notable ones include Cairnlea Estate Final Stage, Deer Park Dome Redevelopment, Avondale Heights - Former TAFE Campus Redevelopment, and Deer Park Estate. The following list details those most likely to be relevant.
Professional plan users can use the search below to filter and access additional projects.
INFRASTRUCTURE SEARCH
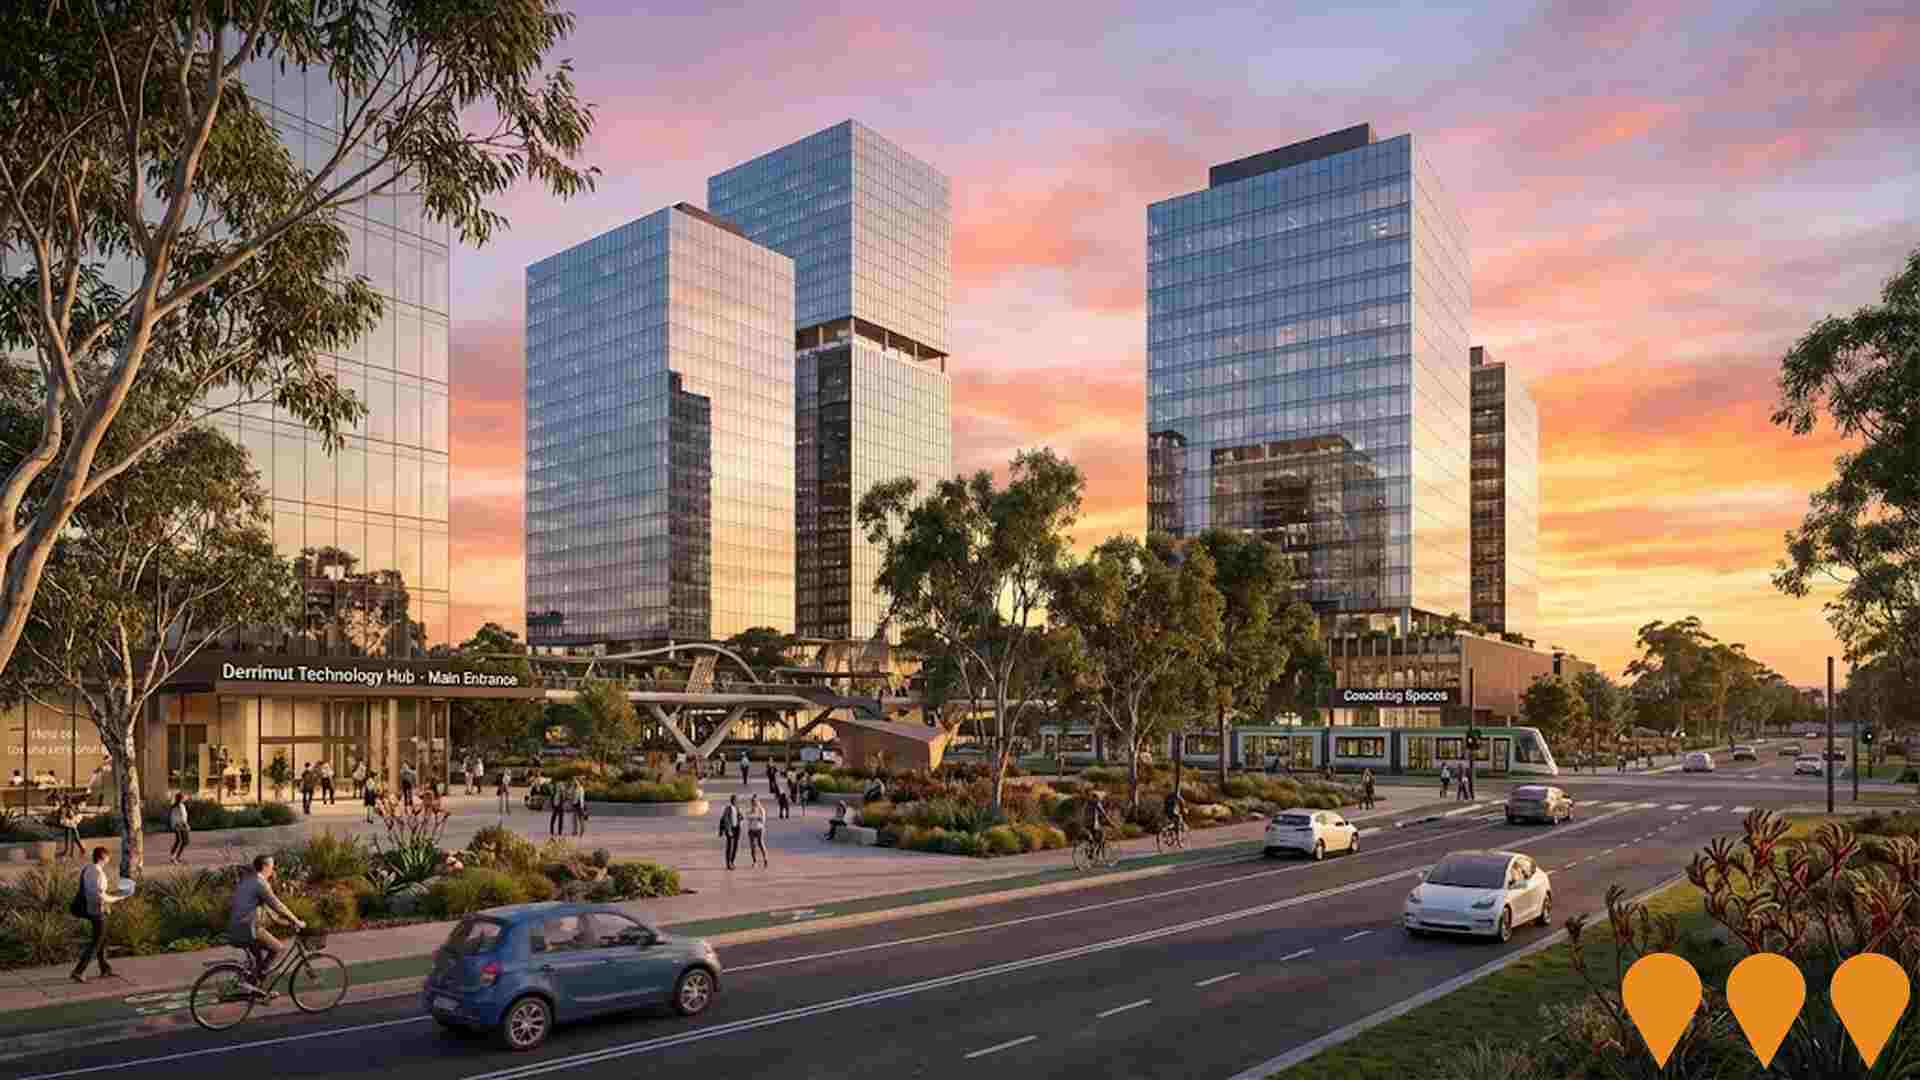
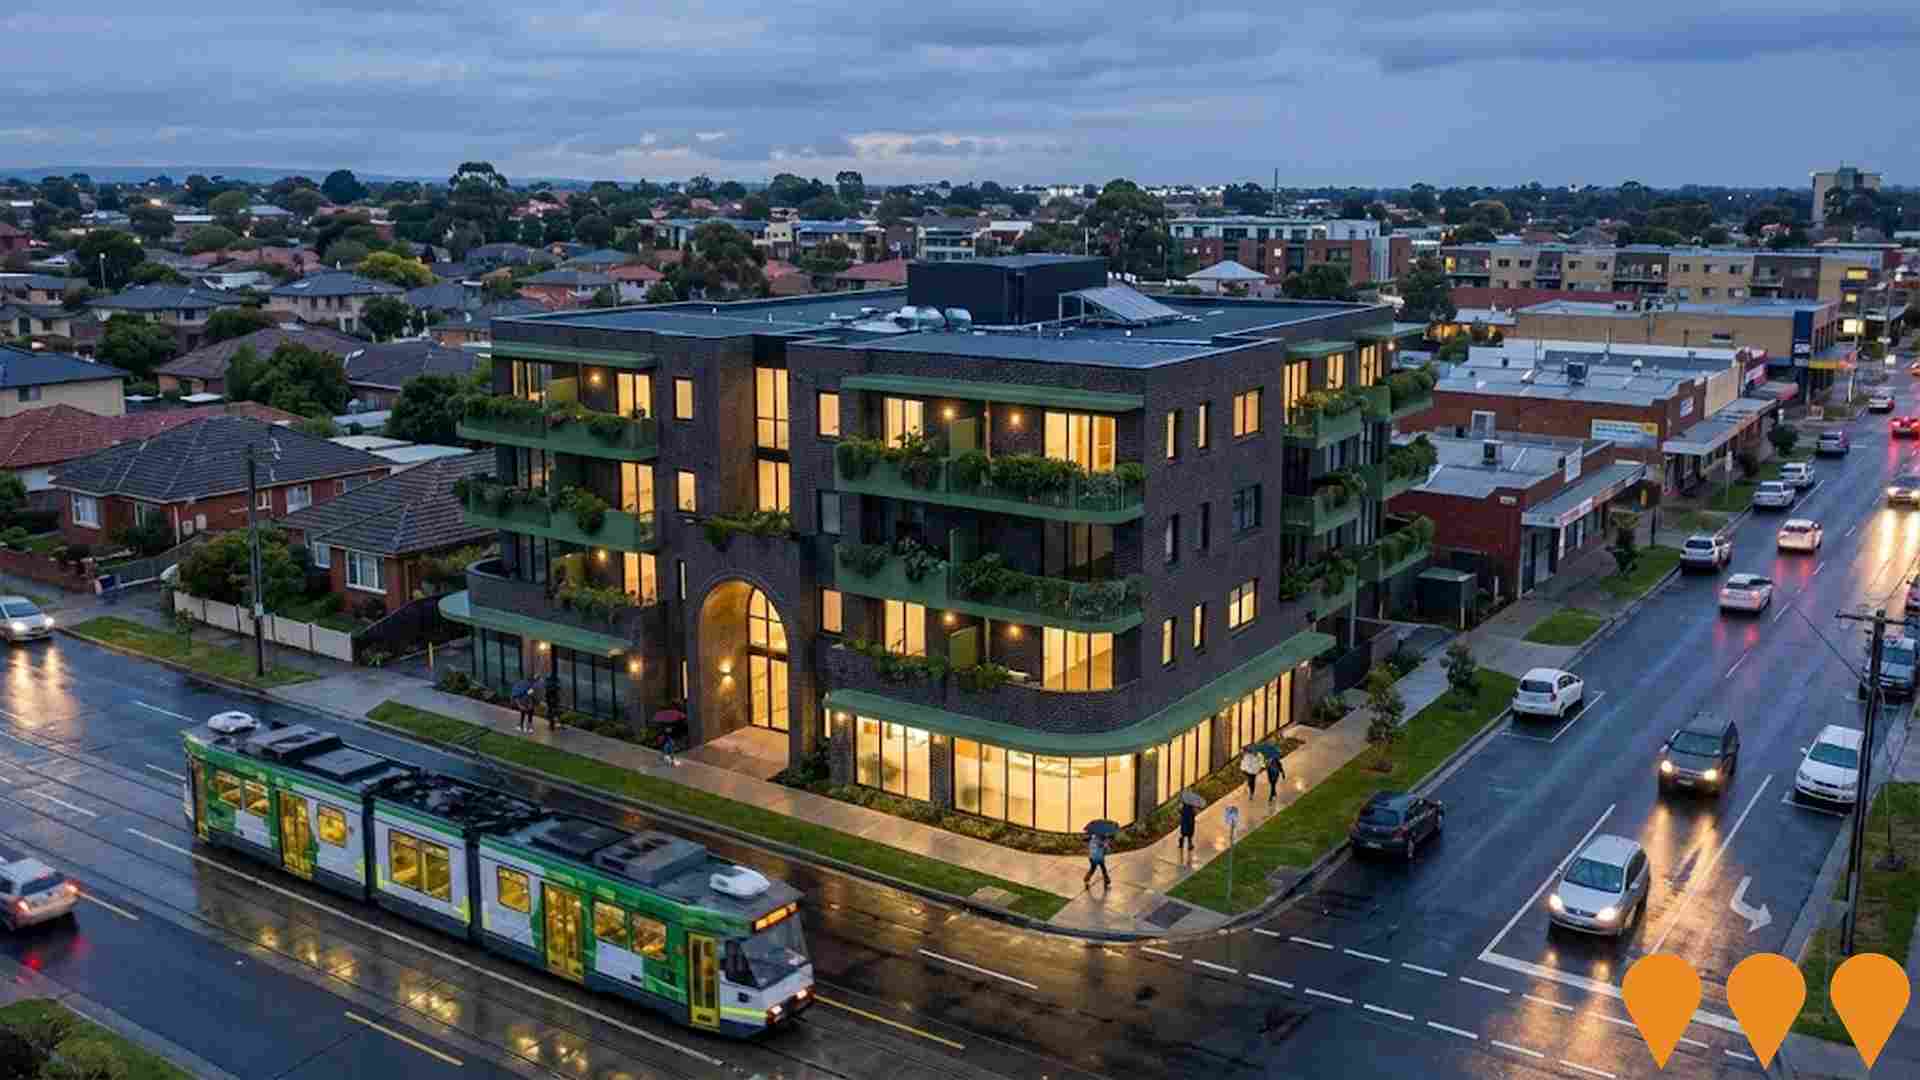
 Denotes AI-based impression for illustrative purposes only, not to be taken as definitive under any circumstances. Please follow links and conduct other investigations from the project's source for actual imagery. Developers and project owners wishing us to use original imagery please Contact Us and we will do so.
Frequently Asked Questions - Infrastructure
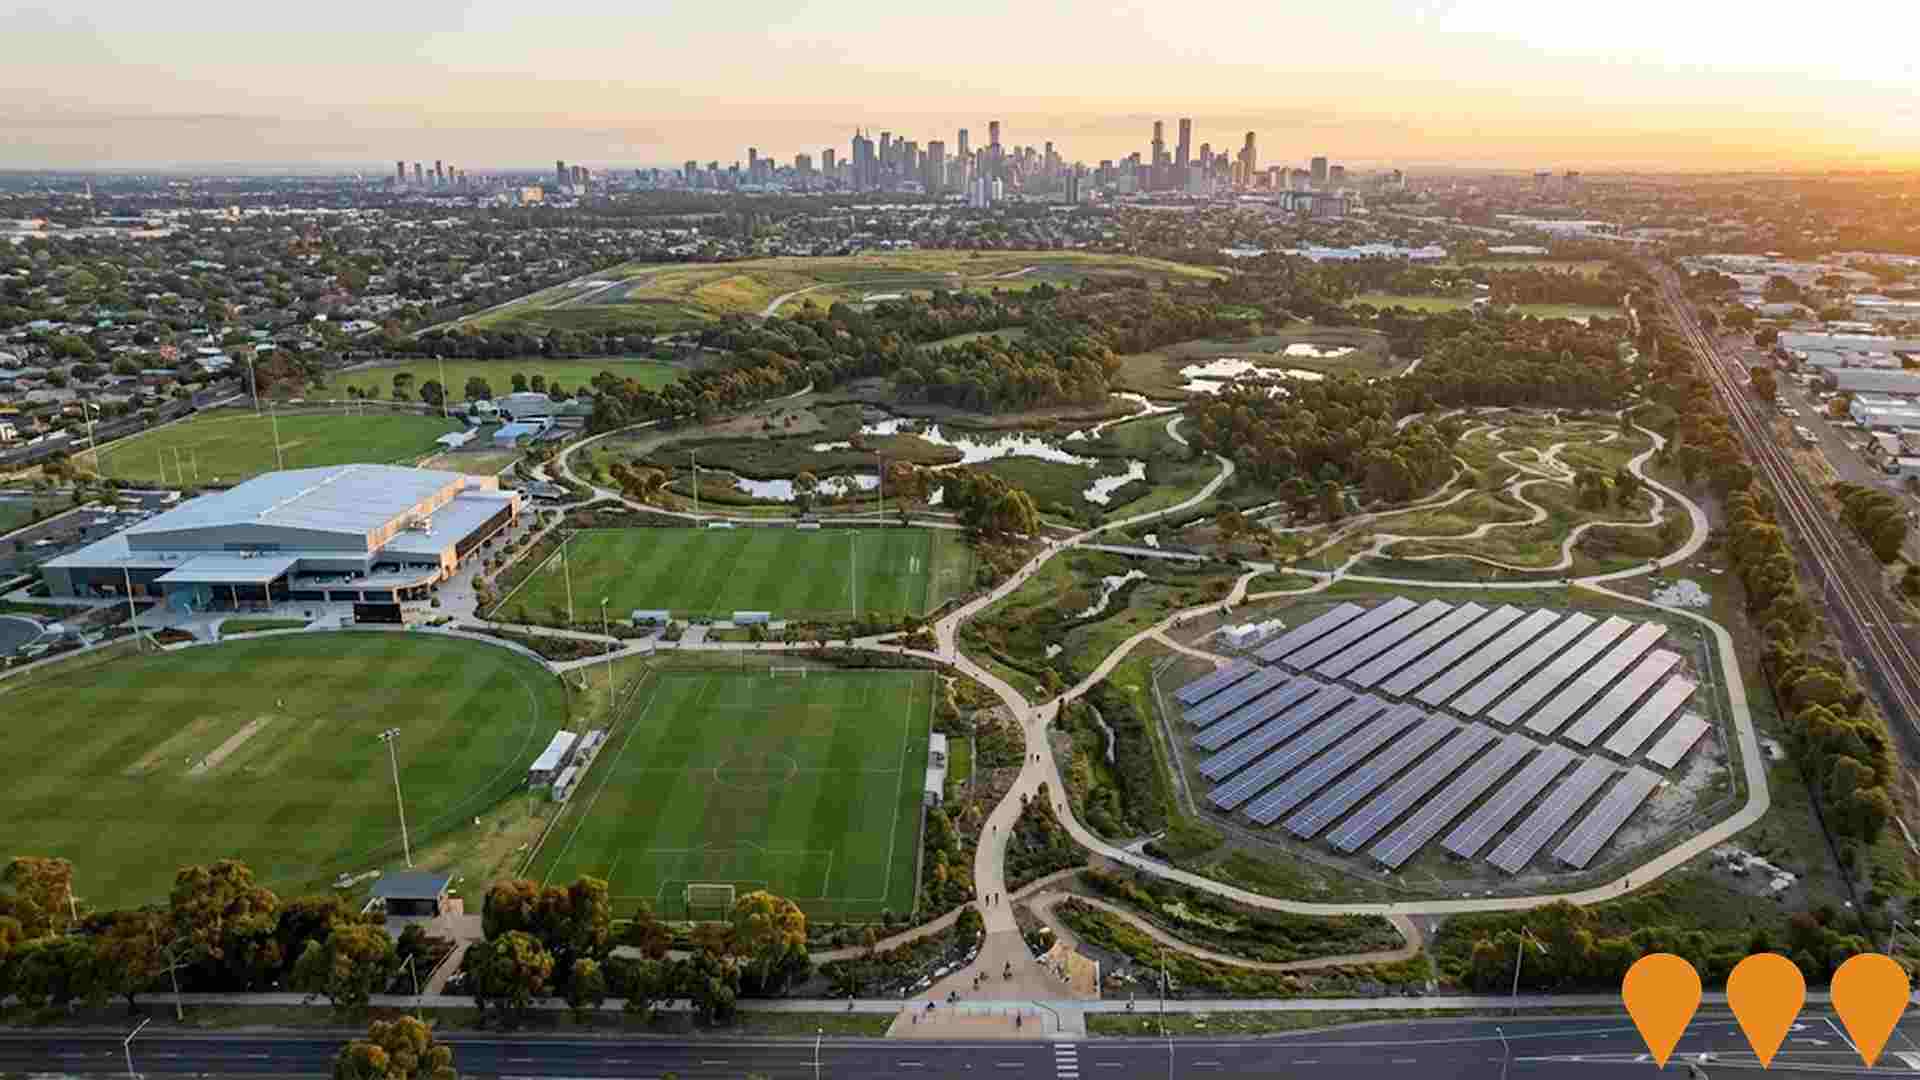
Sunshine Energy Park
74-hectare urban regeneration of the former Sunshine Landfill into Melbourne's largest urban park in the west. Features 8 interconnected precincts including a large solar farm, extensive tree planting, mountain bike trails, wetlands, hilltop lookout, walking/cycling paths, sustainability hub, sports fields, state-significant indoor stadium, playgrounds and urban forest. Adopted Vision Plan (May 2024) with $500,000 State Government funding for detailed feasibility and master planning. Long-term 30-year delivery horizon.
Melbourne Grid Battery
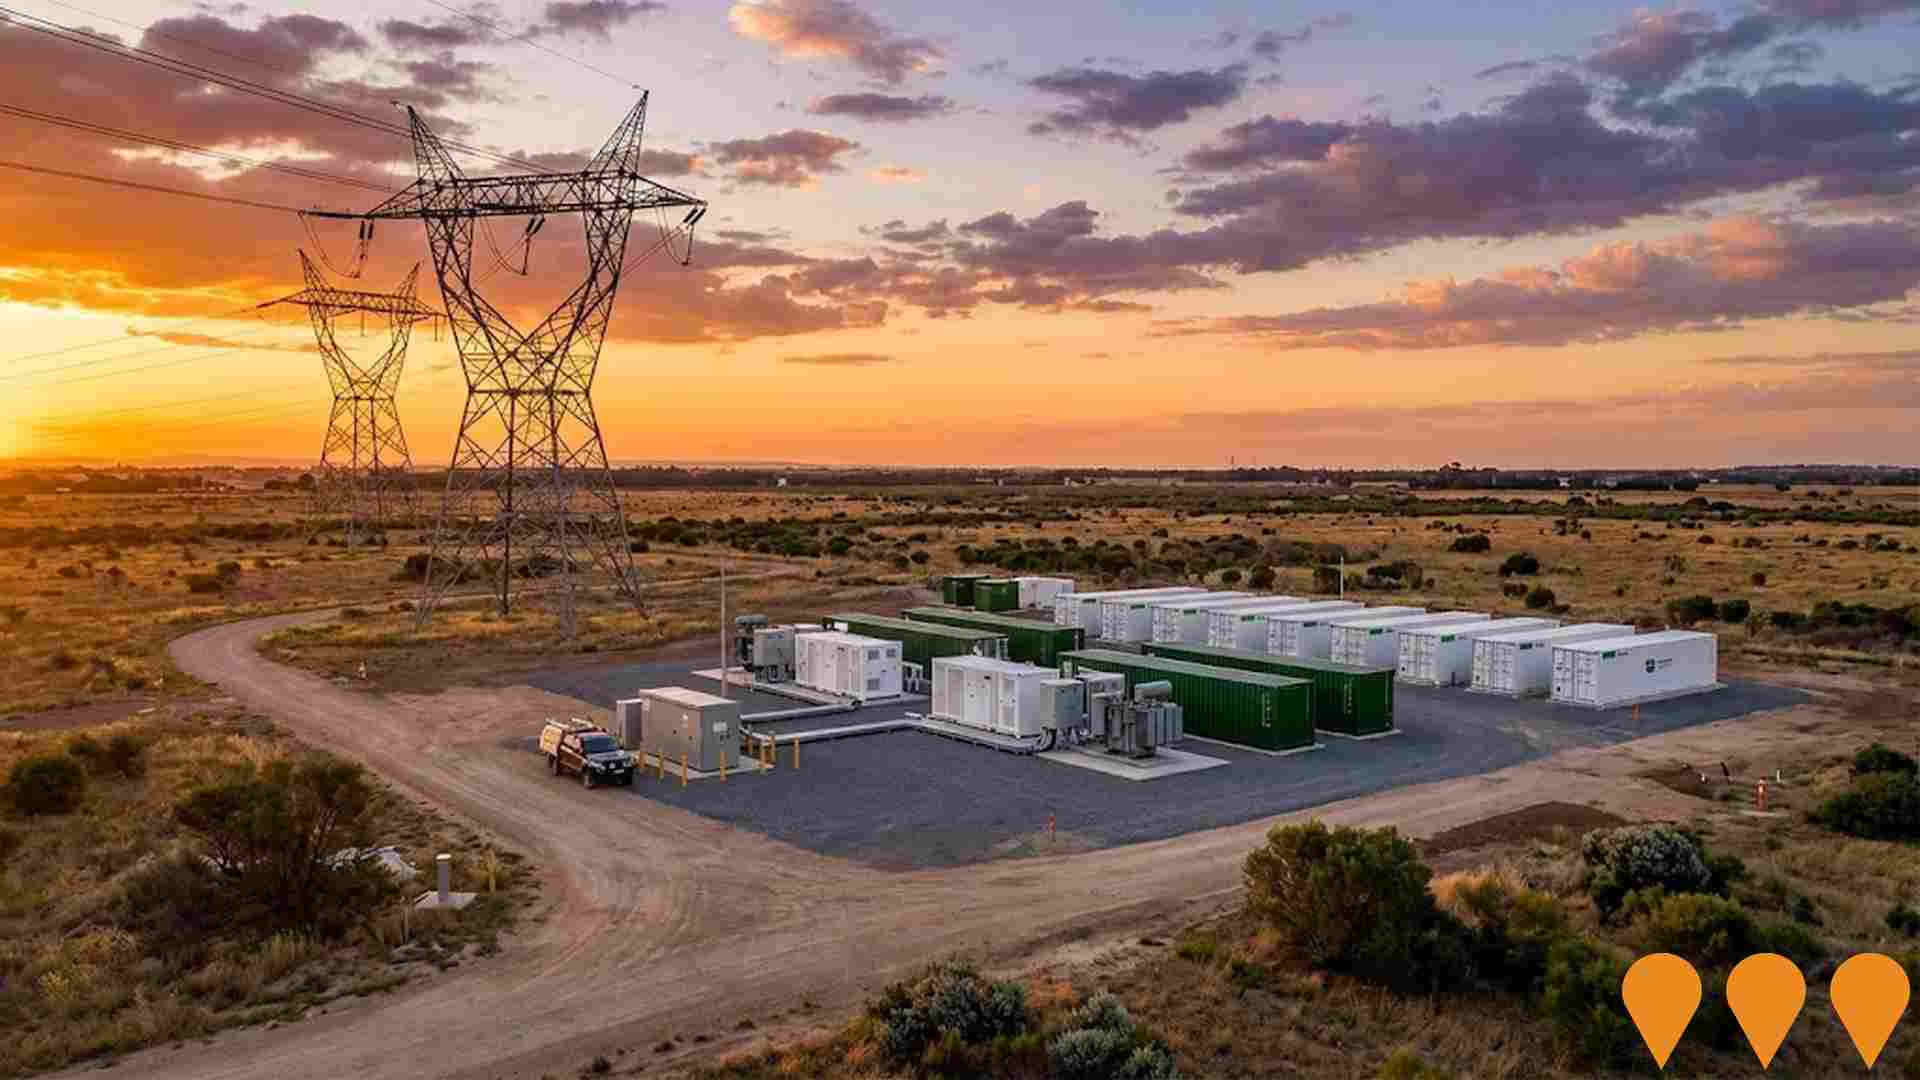
A market-facing grid battery connected to existing transmission infrastructure, located at the Deer Park Energy Hub 20km west of Melbourne's CBD. It provides 280MW/560MWh capacity to optimize renewable energy use, supply energy when needed, and support grid reliability.
Deer Park Station Redevelopment and Level Crossing Removal
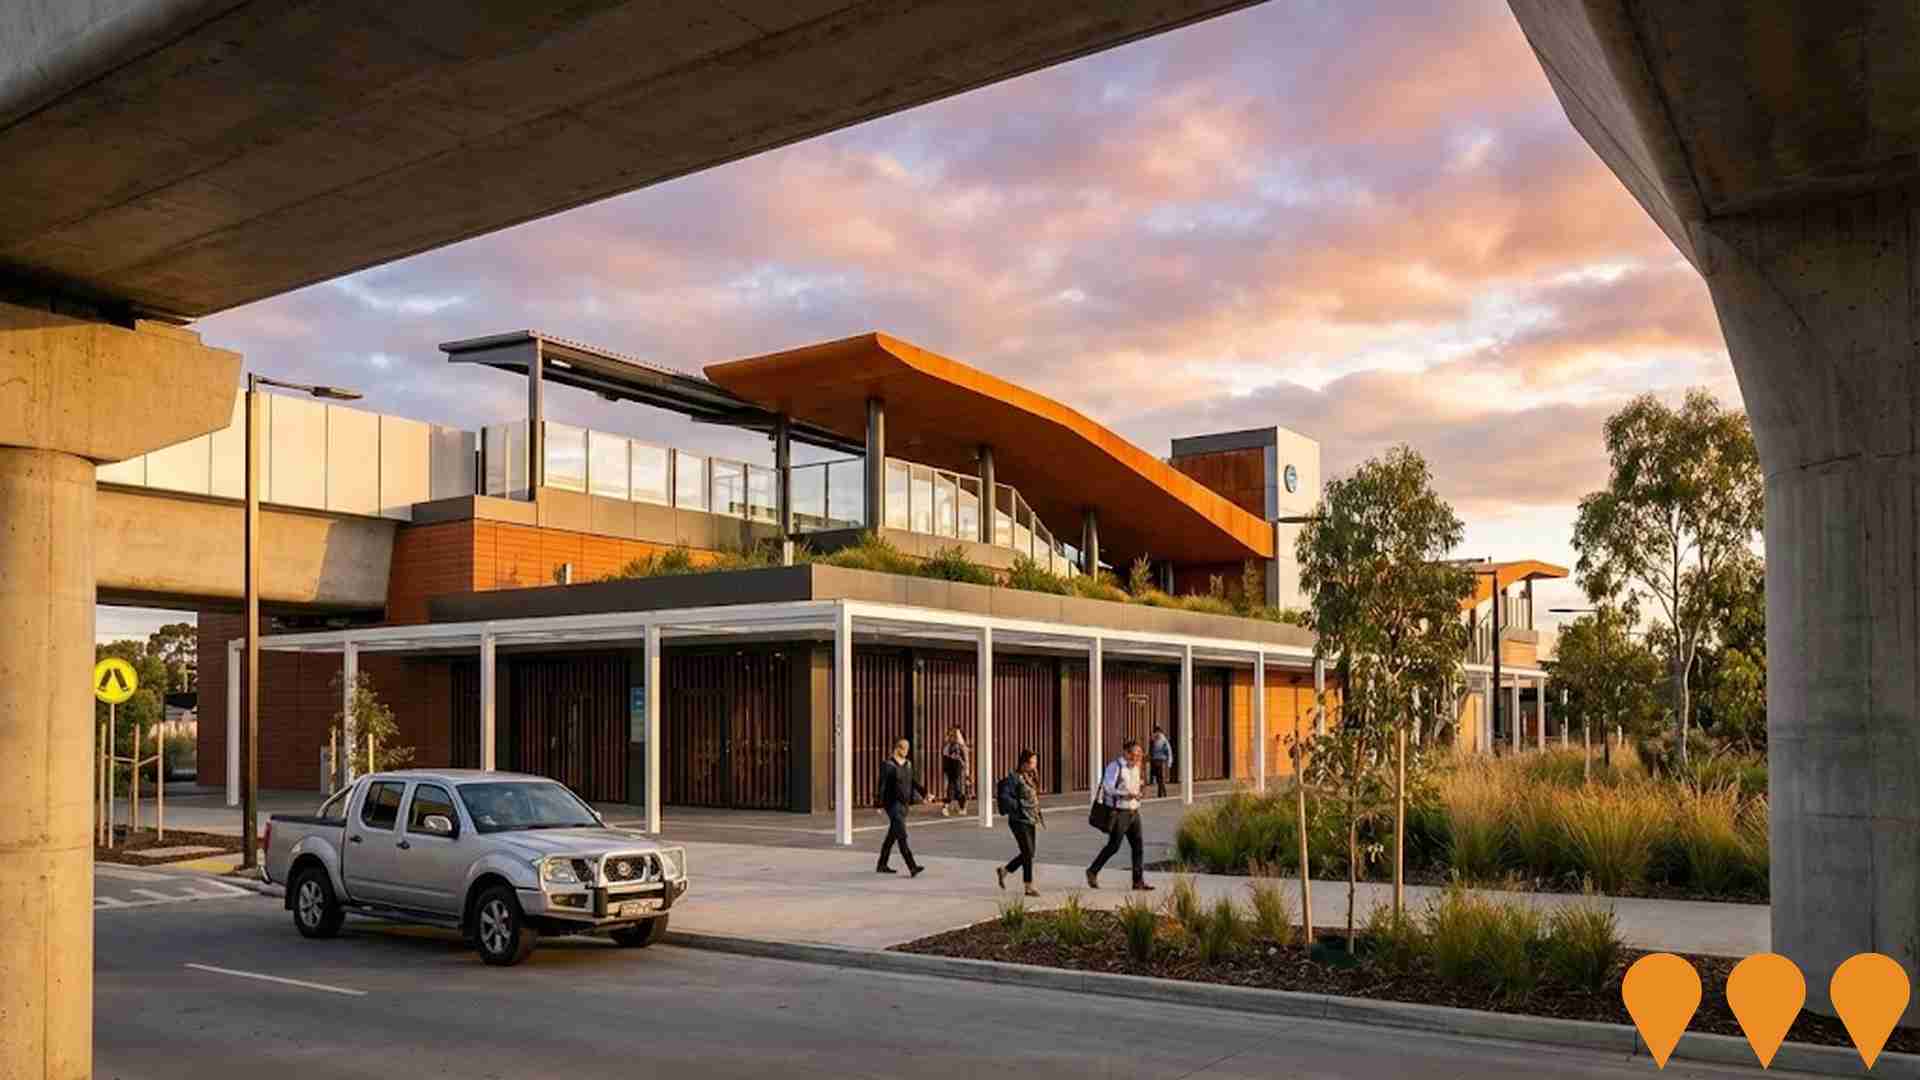
Major infrastructure project involving the removal of Mt Derrimut Road level crossing, construction of a 1.2km elevated rail bridge, and a new elevated Deer Park Station with rooftop garden - Victoria's first station with this feature. Includes 150 new car parks bringing total to 487 spaces, bus interchange, and sustainable features including recycled plastic concrete. Project completed in 2023.
Deer Park Estate
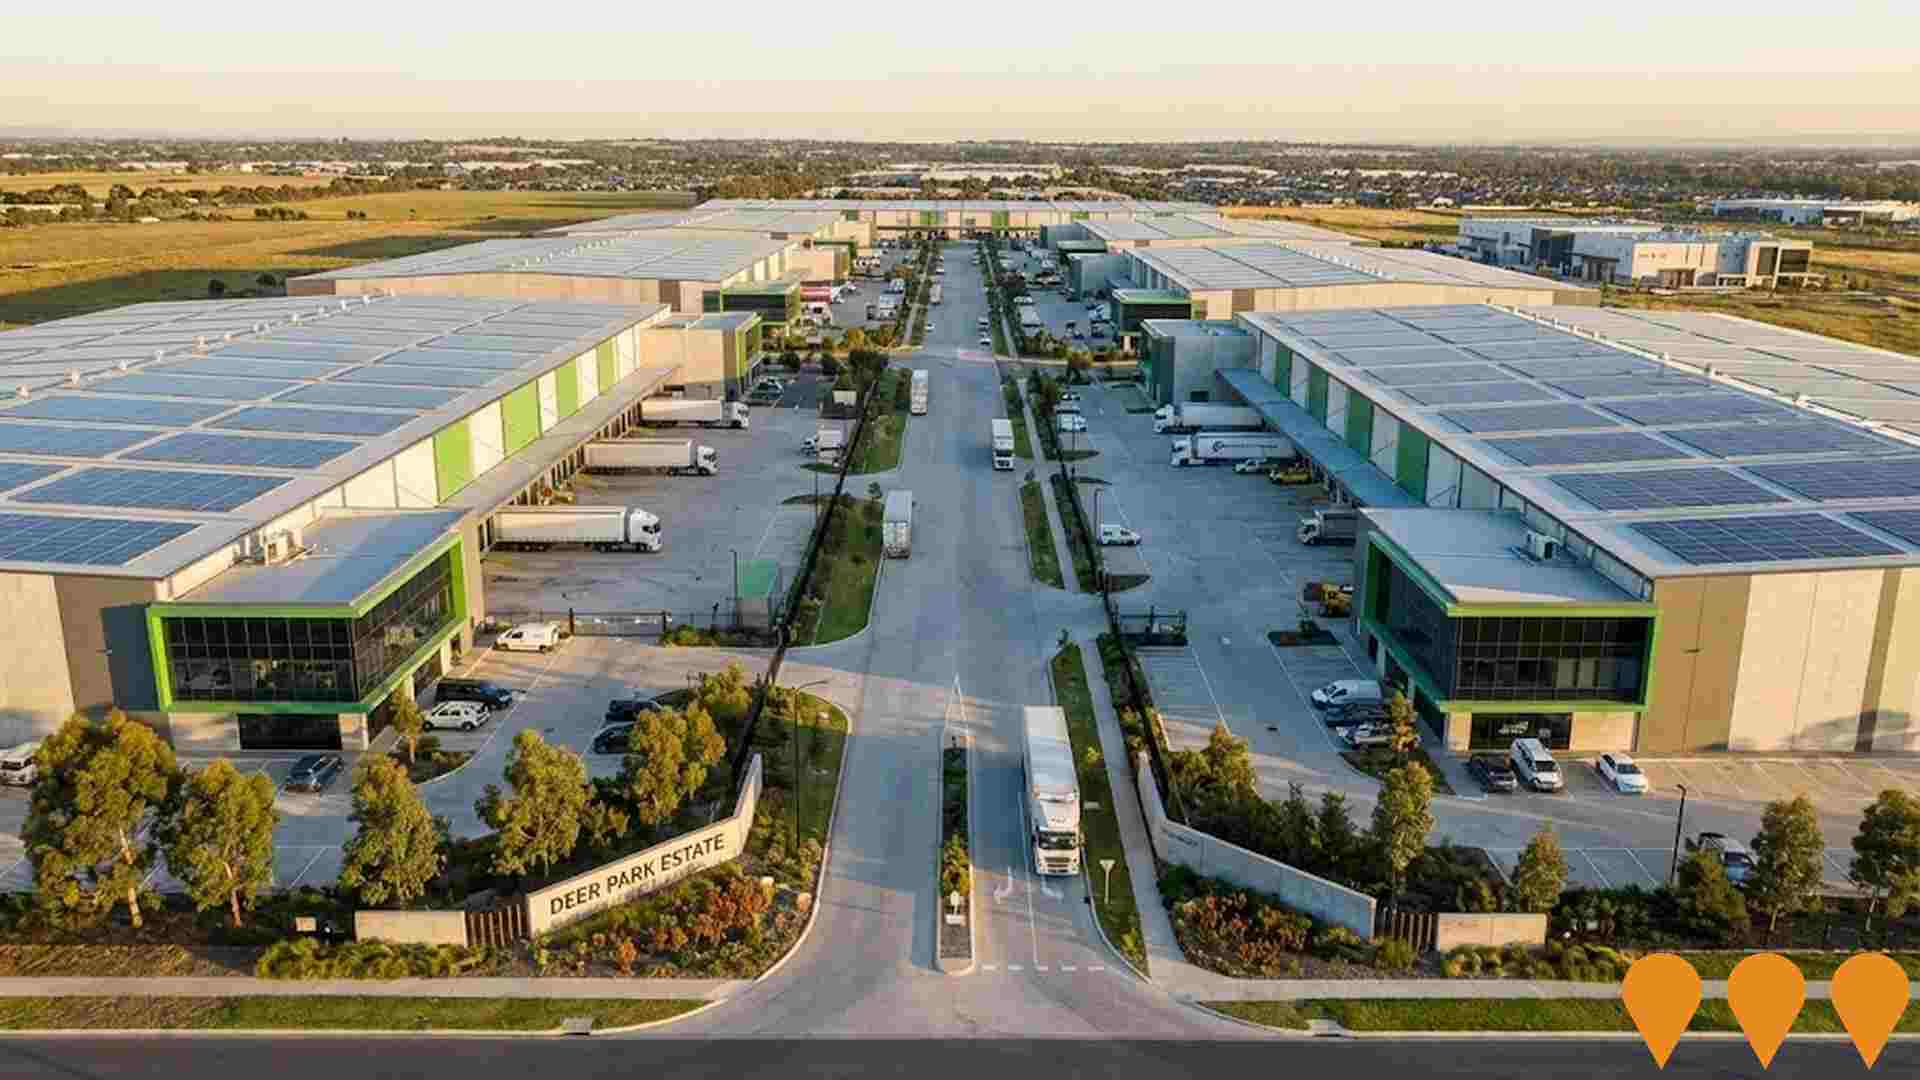
A 66ha industrial estate planned to deliver 330,000-340,000sqm of logistics and highbay warehousing with potential data centre and restricted retail uses. Development Plan approved by Brimbank City Council; estate is now leasing with HB+B Property acting as development manager for UniSuper with GPT. ESG features targeted across the precinct.
St Albans Activity Centre Precinct Structure Plan
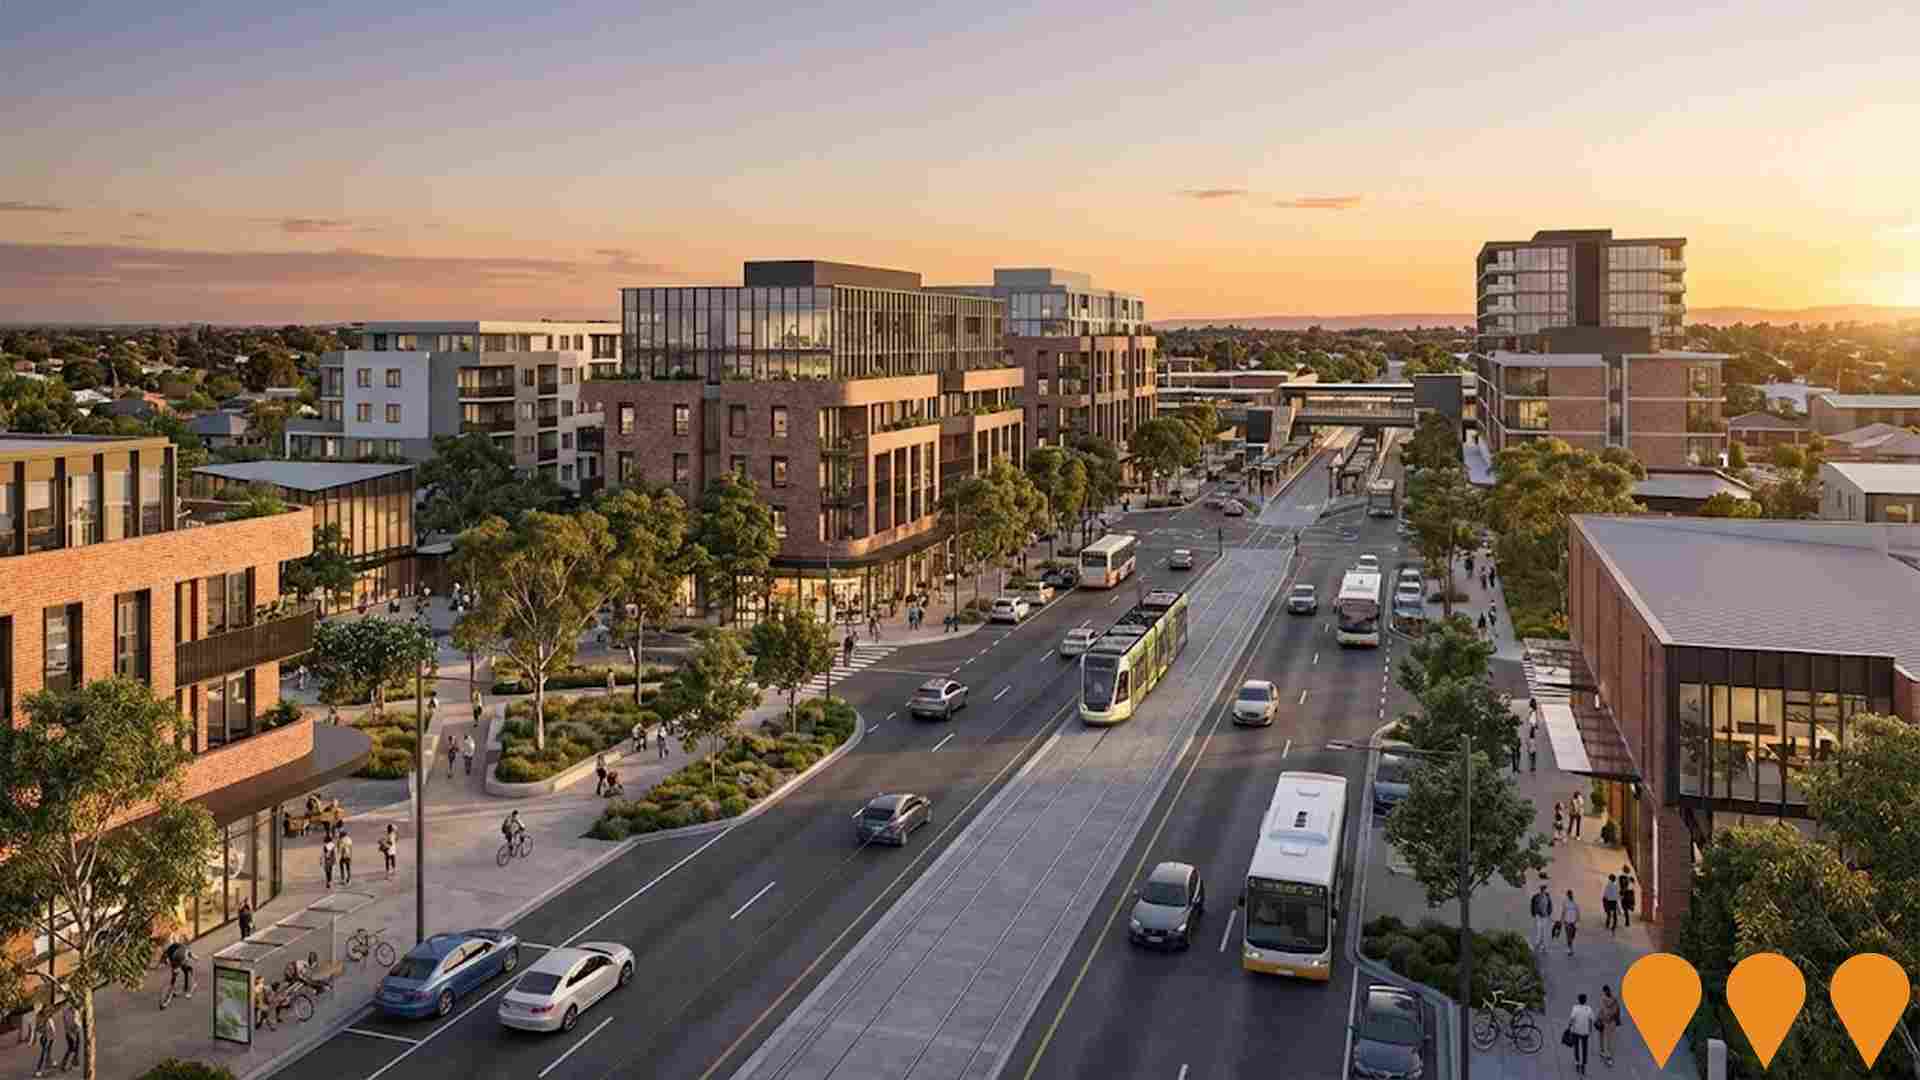
The St Albans Activity Centre Precinct Structure Plan provides a strategic and integrated plan for the future development of the St Albans Activity Centre. It informs decision-making on development proposals, strategic planning policies, public realm improvements, and development facilitation. It also influences resource allocation for business development, community facilities, and arts and cultural activities.
Ballarat Road Development Site
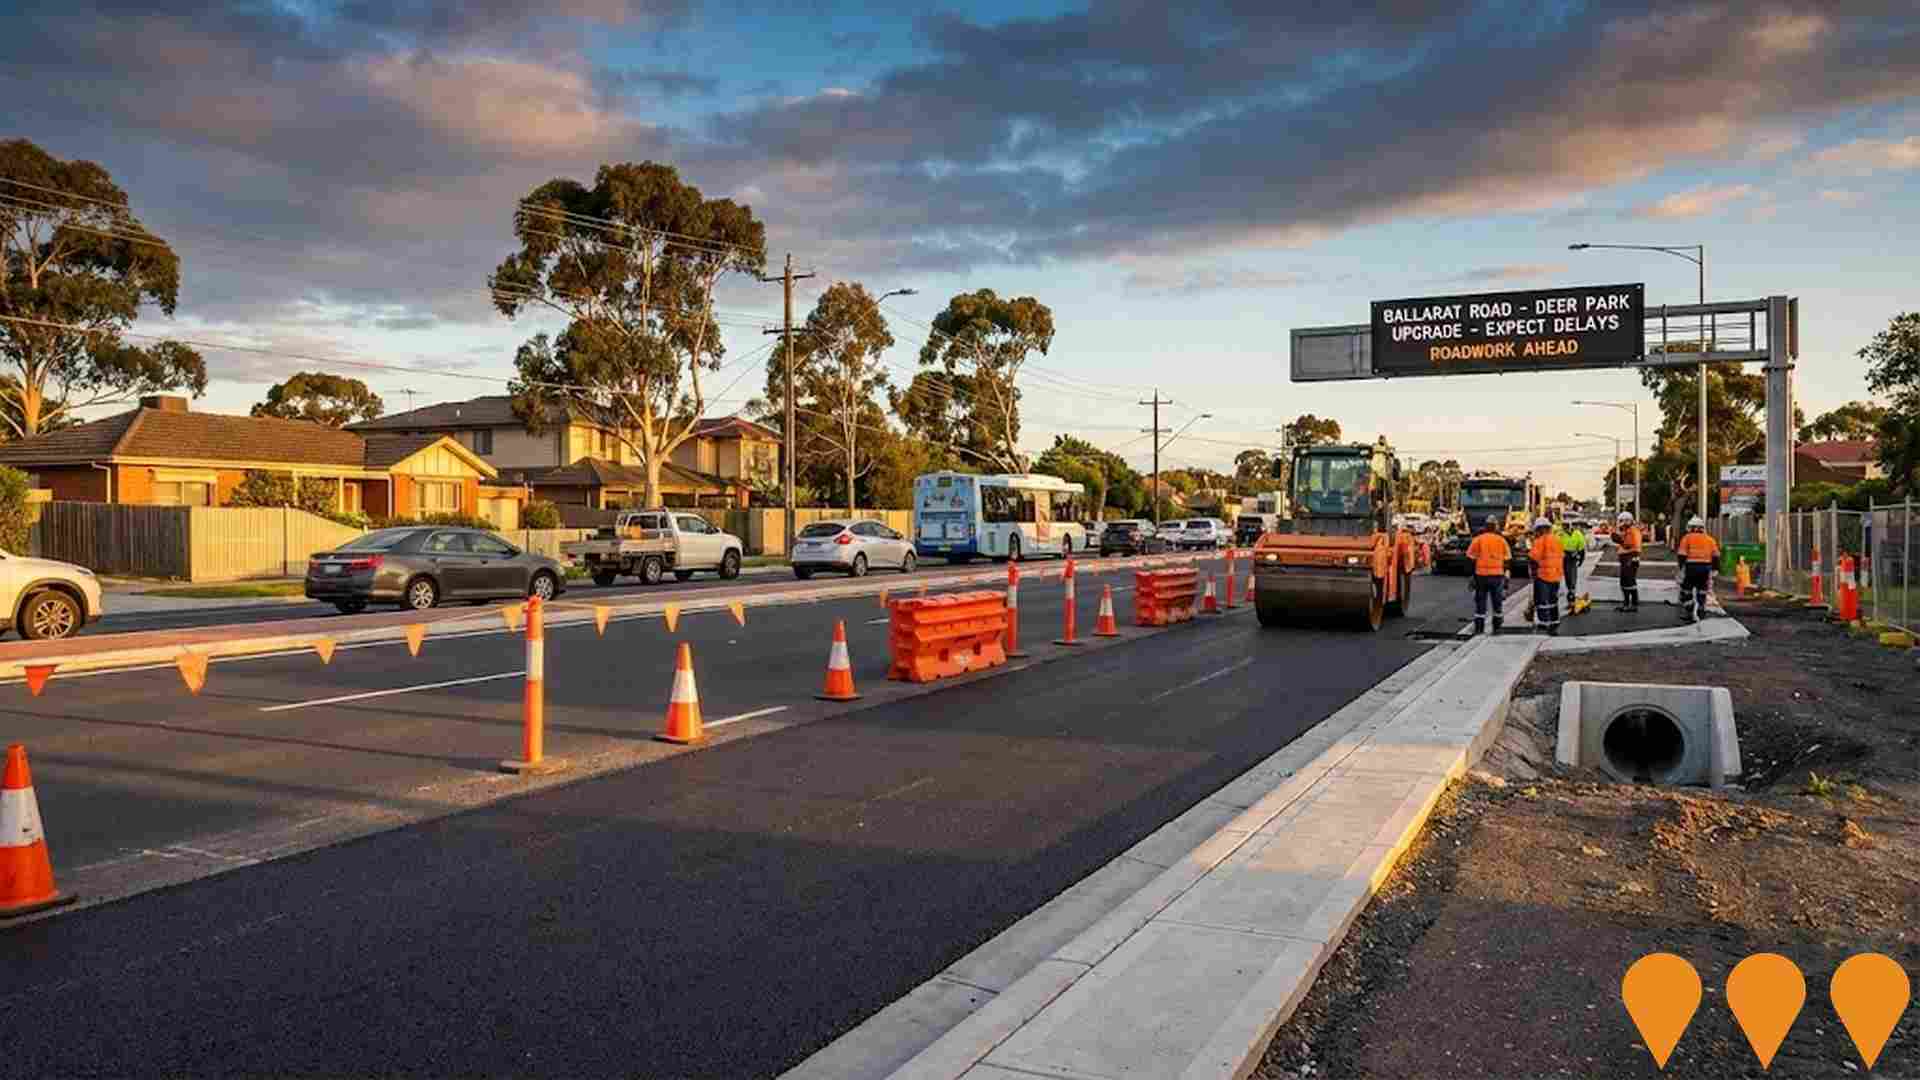
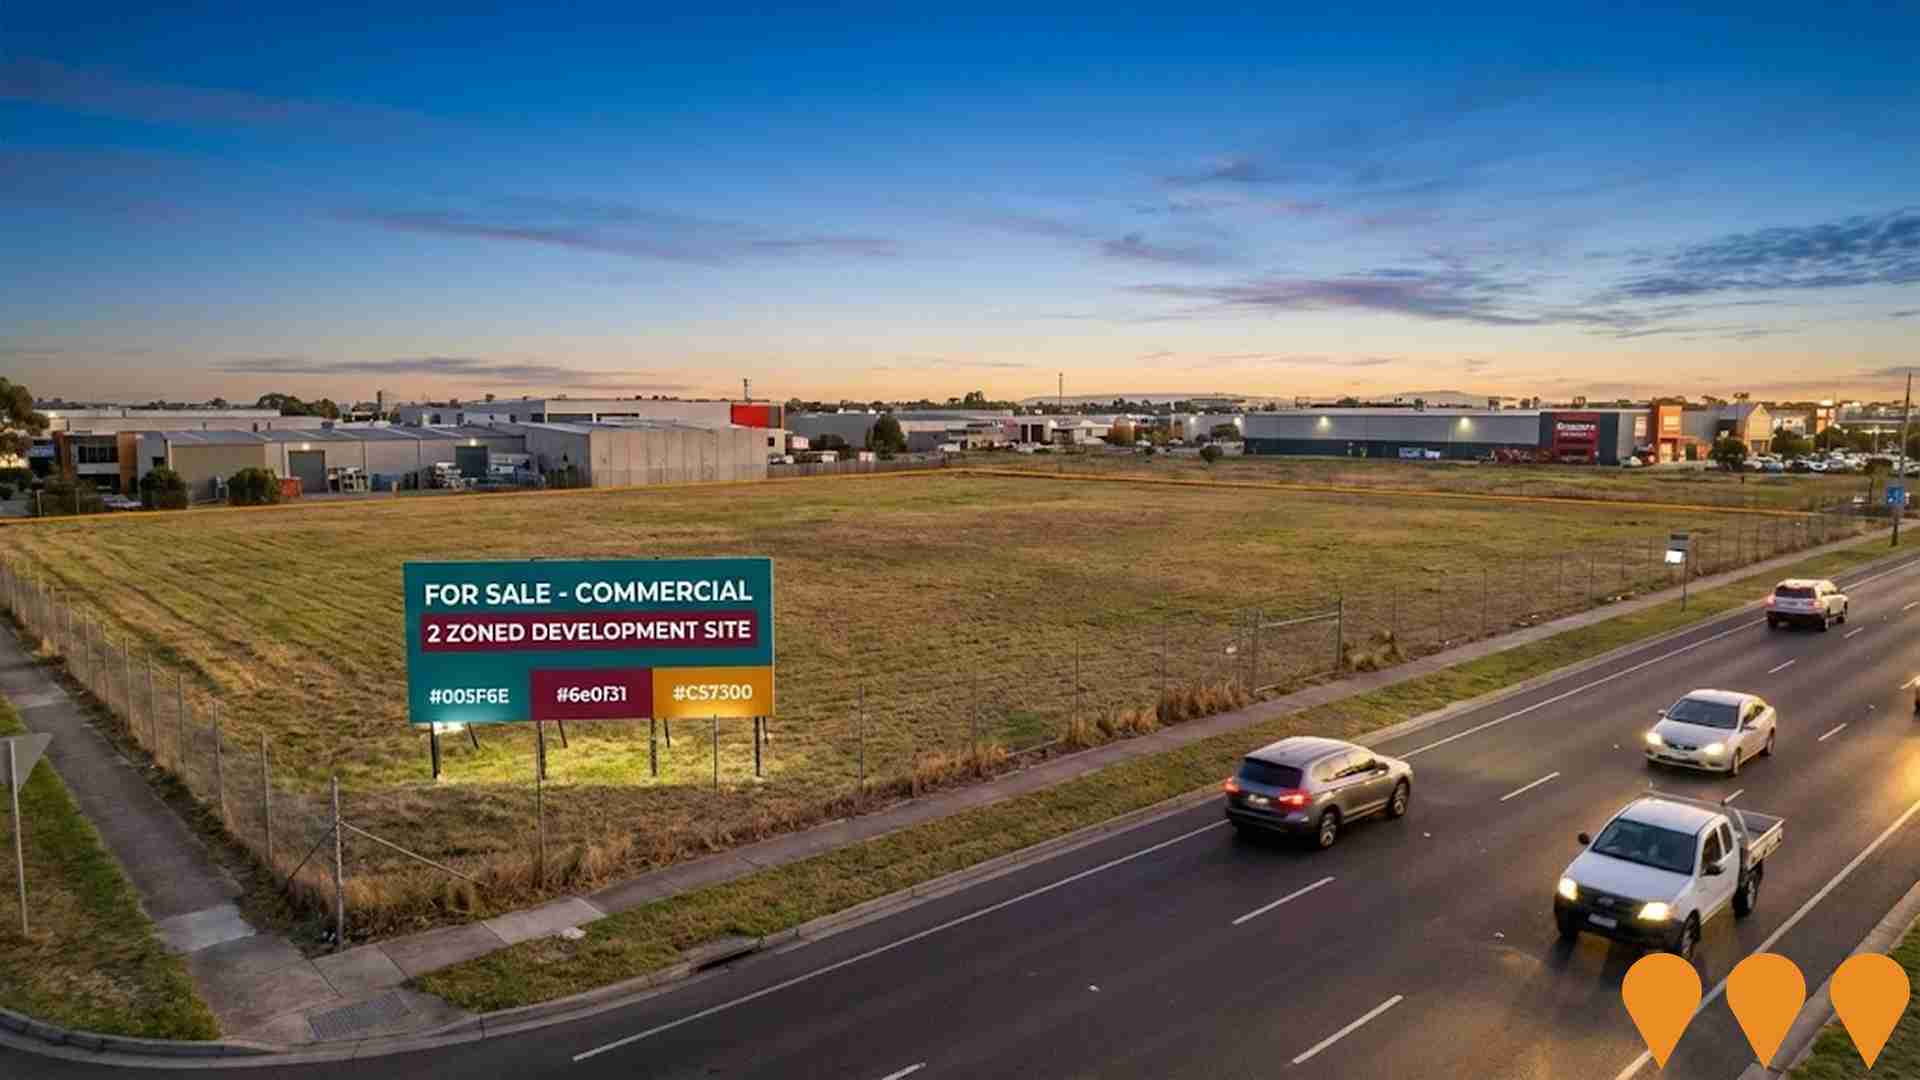
A momentous development opportunity comprising a sprawling 28,039 sqm landholding across four titles with over 420m of main road frontage to Ballarat Road. Zoned Commercial 2, the site offers flexibility for large-scale Quick Service Retail (QSR), Large Format Retail (LFR), industrial, or commercial developments (STCA). Positioned in a high-exposure location with over 61,000 vehicles passing daily, near major retailers like Costco and Bunnings, and excellent connectivity to transport links.
Derrimut Technology Hub
Proposed technology and innovation hub featuring modern office spaces, co-working facilities, meeting rooms, and high-speed internet infrastructure. The development aims to attract technology companies and startups to the western suburbs corridor.
St Albans SDA Housing
A site-responsive, four-storey mixed-use development providing Specialist Disability Accommodation (SDA) and allied-health facilities to central St Albans. The development includes 10 SDA apartments (2 x two bedroom and 8 x one bedroom) and 1 carers apartment with 24-hour health and safety monitoring. Features 292 sq.m. of publicly accessible allied-health facilities at street level, designed to NDIS High Physical Support standards with sustainable features including solar array, double-glazed windows and water tanks.
Employment
The employment landscape in Cairnlea shows performance that lags behind national averages across key labour market indicators
Cairnlea has a skilled workforce with diverse sector representation. Its unemployment rate was 4.6% in September 2025.
Employment growth over the past year was estimated at 4.9%. As of that date, 5,578 residents were employed, with an unemployment rate similar to Greater Melbourne's 4.7%, and workforce participation broadly similar at 64.1%. Employment is concentrated in retail trade, health care & social assistance, and manufacturing. The area has strong specialization in transport, postal & warehousing, with an employment share of 2.0 times the regional level.
However, professional & technical services show lower representation at 5.9% compared to the regional average of 10.1%. Over the 12 months to September 2025, employment increased by 4.9%, while labour force increased by 5.3%, leading to a rise in unemployment rate by 0.3 percentage points. Greater Melbourne recorded employment growth of 3.0% during this period. State-level data from 25-Nov shows Victoria's employment grew by 1.13% year-on-year, adding 41,950 jobs, with the state unemployment rate at 4.7%. National employment forecasts from May-25 suggest national employment will expand by 6.6% over five years and 13.7% over ten years. Applying these projections to Cairnlea's employment mix suggests local employment should increase by 5.9% over five years and 12.5% over ten years.
Frequently Asked Questions - Employment
Income
The area's income profile falls below national averages based on AreaSearch analysis
The Cairnlea SA2 has a median taxpayer income of $44,529 and an average income of $52,300 according to the latest postcode level ATO data aggregated by AreaSearch for financial year 2022. This is lower than national averages, contrasting with Greater Melbourne's median income of $54,892 and average income of $73,761. Based on Wage Price Index growth of 12.16% from financial year 2022 to September 2025, current estimates would be approximately $49,944 (median) and $58,660 (average). Census data reveals individual incomes lag at the 20th percentile ($658 weekly), while household income performs better at the 69th percentile. The data shows that 37.6% of individuals fall within the $1,500 - 2,999 earnings band (3,775 individuals). Housing accounts for 13.7% of income, placing residents in the 73rd percentile for disposable income.
Frequently Asked Questions - Income
Housing
Cairnlea is characterized by a predominantly suburban housing profile, with ownership patterns similar to the broader region
Cairnlea's dwelling structures, as per the latest Census, consisted of 88.6% houses and 11.4% other dwellings (semi-detached, apartments, 'other' dwellings), compared to Melbourne metro's 81.3% houses and 18.7% other dwellings. Home ownership in Cairnlea was at 33.7%, with mortgaged dwellings at 50.8% and rented ones at 15.5%. The median monthly mortgage repayment was $1,883, higher than Melbourne metro's $1,700. Median weekly rent in Cairnlea was $400, compared to Melbourne metro's $346. Nationally, Cairnlea's mortgage repayments exceeded the Australian average of $1,863, while rents were above the national figure of $375.
Frequently Asked Questions - Housing
Household Composition
Cairnlea features high concentrations of family households, with a higher-than-average median household size
Family households comprise 87.1% of all households, including 52.7% couples with children, 17.8% couples without children, and 15.3% single parent families. Non-family households account for the remaining 12.9%, with lone person households at 10.7% and group households making up 2.1%. The median household size is 3.4 people, which is larger than the Greater Melbourne average of 2.9.
Frequently Asked Questions - Households
Local Schools & Education
Educational attainment in Cairnlea aligns closely with national averages, showing typical qualification patterns and performance metrics
The area's university qualification rate is 26.3%, significantly lower than Greater Melbourne's average of 37.0%. Bachelor degrees are the most common at 20.7%, followed by postgraduate qualifications (4.0%) and graduate diplomas (1.6%). Vocational pathways account for 24.0% of qualifications among those aged 15 and above, with advanced diplomas at 9.4% and certificates at 14.6%. Educational participation is high, with 32.9% of residents currently enrolled in formal education.
This includes 10.3% in primary education, 10.3% in secondary education, and 6.7% pursuing tertiary education.
Frequently Asked Questions - Education
Schools Detail
Nearby Services & Amenities
Transport
Transport servicing is moderate compared to other areas nationally based on assessment of service frequency, route connectivity and accessibility
Cairnlea has 15 active public transport stops, all of which are bus stops. These stops are served by four different routes that together facilitate 1,936 weekly passenger trips. The accessibility of transport in Cairnlea is deemed good, with residents on average being located 360 meters from the nearest stop.
On a daily basis, there are an average of 276 trips across all routes, which equates to around 129 weekly trips per individual stop.
Frequently Asked Questions - Transport
Transport Stops Detail
Health
Cairnlea's residents boast exceedingly positive health performance metrics with younger cohorts in particular seeing very low prevalence of common health conditions
Cairnlea's health outcomes show excellent results, with younger age groups having very low prevalence of common health conditions. Approximately 46% (~4,639 people) have private health cover, lower than the national average of 55.3%.
The most prevalent medical conditions are asthma (7.4%) and diabetes (5.7%). 77.5% of residents report being free from medical ailments, higher than Greater Melbourne's 73.5%. Cairnlea has 13.9% (1,395 people) aged 65 and over, lower than Greater Melbourne's 17.9%. Despite this, seniors' health outcomes are above average and require more attention compared to the broader population.
Frequently Asked Questions - Health
Cultural Diversity
Cairnlea is among the most culturally diverse areas in the country based on AreaSearch assessment of a range of language and cultural background related metrics
Cairnlea has a population where 53.2% were born overseas, with 71.8% speaking a language other than English at home. Christianity is the main religion in Cairnlea, comprising 42.3% of its population, higher than Buddhism's Greater Melbourne average of 12.5%. Notably, Buddhism makes up 20.5% of Cairnlea's population.
In terms of ancestry, Vietnamese people are most represented at 26.7%, followed by Other (18.9%) and Chinese (11.0%). Some ethnic groups have notable differences: Filipino (6.2% vs regional average of 3.7%), Maltese (3.8% vs 4.6%), and Macedonian (2.9% vs 2.5%) are overrepresented in Cairnlea compared to the Greater Melbourne averages.
Frequently Asked Questions - Diversity
Age
Cairnlea's population is slightly younger than the national pattern
Cairnlea's median age is nearly 36 years, closely matching Greater Melbourne's average of 37 years, which is slightly below Australia's median age of 38 years. Compared to Greater Melbourne, Cairnlea has a higher proportion of residents aged 15-24 (16.2%) but fewer residents aged 25-34 (13.0%). Between the 2021 Census and now, the population aged 65-74 has grown from 7.2% to 9.0%, while those aged 75-84 have increased from 2.2% to 3.7%. Conversely, the proportion of residents aged 35-44 has decreased from 14.3% to 12.4%, and those aged 5-14 have dropped from 14.2% to 12.7%. By 2041, demographic modeling suggests Cairnlea's age profile will change significantly. The 55-64 cohort is projected to grow by 42%, adding 522 residents to reach a total of 1,779. Residents aged 65 and above are expected to drive 54% of population growth, reflecting demographic aging trends. Meanwhile, the 0-4 and 35-44 age cohorts are projected to experience population declines.
