Chart Color Schemes
This analysis uses ABS Statistical Areas Level 2 (SA2) boundaries, which can materially differ from Suburbs and Localities (SAL) even when sharing similar names.
SA2 boundaries are defined by the Australian Bureau of Statistics and are designed to represent communities for statistical reporting (e.g., census and ERP).
Suburbs and Localities (SAL) represent commonly-used suburb/locality names (postal-style areas) and may use different geographic boundaries. For comprehensive analysis, consider reviewing both boundary types if available.
est. as @ -- *
ABS ERP | -- people | --
2021 Census | -- people
Sales Activity
Curious about local property values? Filter the chart to assess the volume and appreciation (including resales) trends and regional comparisons, or scroll to the map below view this information at an individual property level.
Find a Recent Sale
Sales Detail
Population
An assessment of population growth drivers in Woy Woy - Blackwall reveals an overall ranking slightly below national averages considering recent, and medium term trends
Woy Woy - Blackwall's population was 14,346 as of the 2021 Census. By Nov 2025, it is around 14,591, an increase of 245 people (1.7%). This growth is inferred from ABS' estimated resident population of 14,554 in June 2024 and additional validated new addresses since the Census date. The population density ratio is 838 persons per square kilometer. Since the 2021 Census, Woy Woy - Blackwall's growth rate of 1.7% is within 0.6 percentage points of its SA3 area (2.3%). Overseas migration was the primary driver of this population growth.
AreaSearch uses ABS/Geoscience Australia projections for each SA2 area released in 2024 with a base year of 2022, and NSW State Government's SA2 level projections for areas not covered by this data, released in 2022 with a base year of 2021. Growth rates by age group are applied to all areas from 2032 to 2041. Based on the latest annual ERP population numbers, Woy Woy - Blackwall is projected to grow by 309 persons by 2041, reflecting a total gain of 1.9% over the 17 years.
Frequently Asked Questions - Population
Development
AreaSearch assessment of residential development drivers sees a low level of activity in Woy Woy - Blackwall, placing the area among the bottom 25% of areas assessed nationally
Woy Woy - Blackwall has recorded approximately 38 residential properties granted approval annually. Over the past five financial years, from FY-21 to FY-25, around 194 homes were approved, with an additional 37 approved so far in FY-26. The average number of new residents per year per dwelling constructed over these five years is approximately 0.4.
This indicates that new construction is meeting or exceeding demand, offering buyers more options and contributing to population growth. The average expected construction cost value for new properties is $249,000, reflecting relatively affordable housing options. In FY-26, commercial approvals have reached $37.6 million, indicating significant commercial development momentum in the area. When compared to Greater Sydney, Woy Woy - Blackwall shows approximately 75% of the construction activity per person, placing it among the 31st percentile nationally.
This suggests more limited choices for buyers and supports demand for existing homes. Recent construction in the area comprises 63.0% standalone homes and 37.0% townhouses or apartments, indicating an expanding range of medium-density options. The estimated population density per dwelling approval is around 538 people, reflecting a quiet, low activity development environment. Looking ahead, Woy Woy - Blackwall is projected to grow by approximately 272 residents by the year 2041, according to the latest AreaSearch quarterly estimate. At current development rates, new housing supply should comfortably meet demand, providing favourable conditions for buyers and potentially supporting growth beyond current population projections.
Frequently Asked Questions - Development
Infrastructure
Woy Woy - Blackwall has moderate levels of nearby infrastructure activity, ranking in the 46thth percentile nationally
Changes to local infrastructure significantly impact an area's performance. AreaSearch has identified 19 projects likely affecting the region. Notable ones include Transport Oriented Development at Woy Woy Station Precinct, Ocean Beach Road/Rawson Road Intersection Upgrade, Blackwall Road Intersection Upgrades, and SDA Customised - 145 Blackwall Road Apartments. The following list details those most relevant.
Professional plan users can use the search below to filter and access additional projects.
INFRASTRUCTURE SEARCH
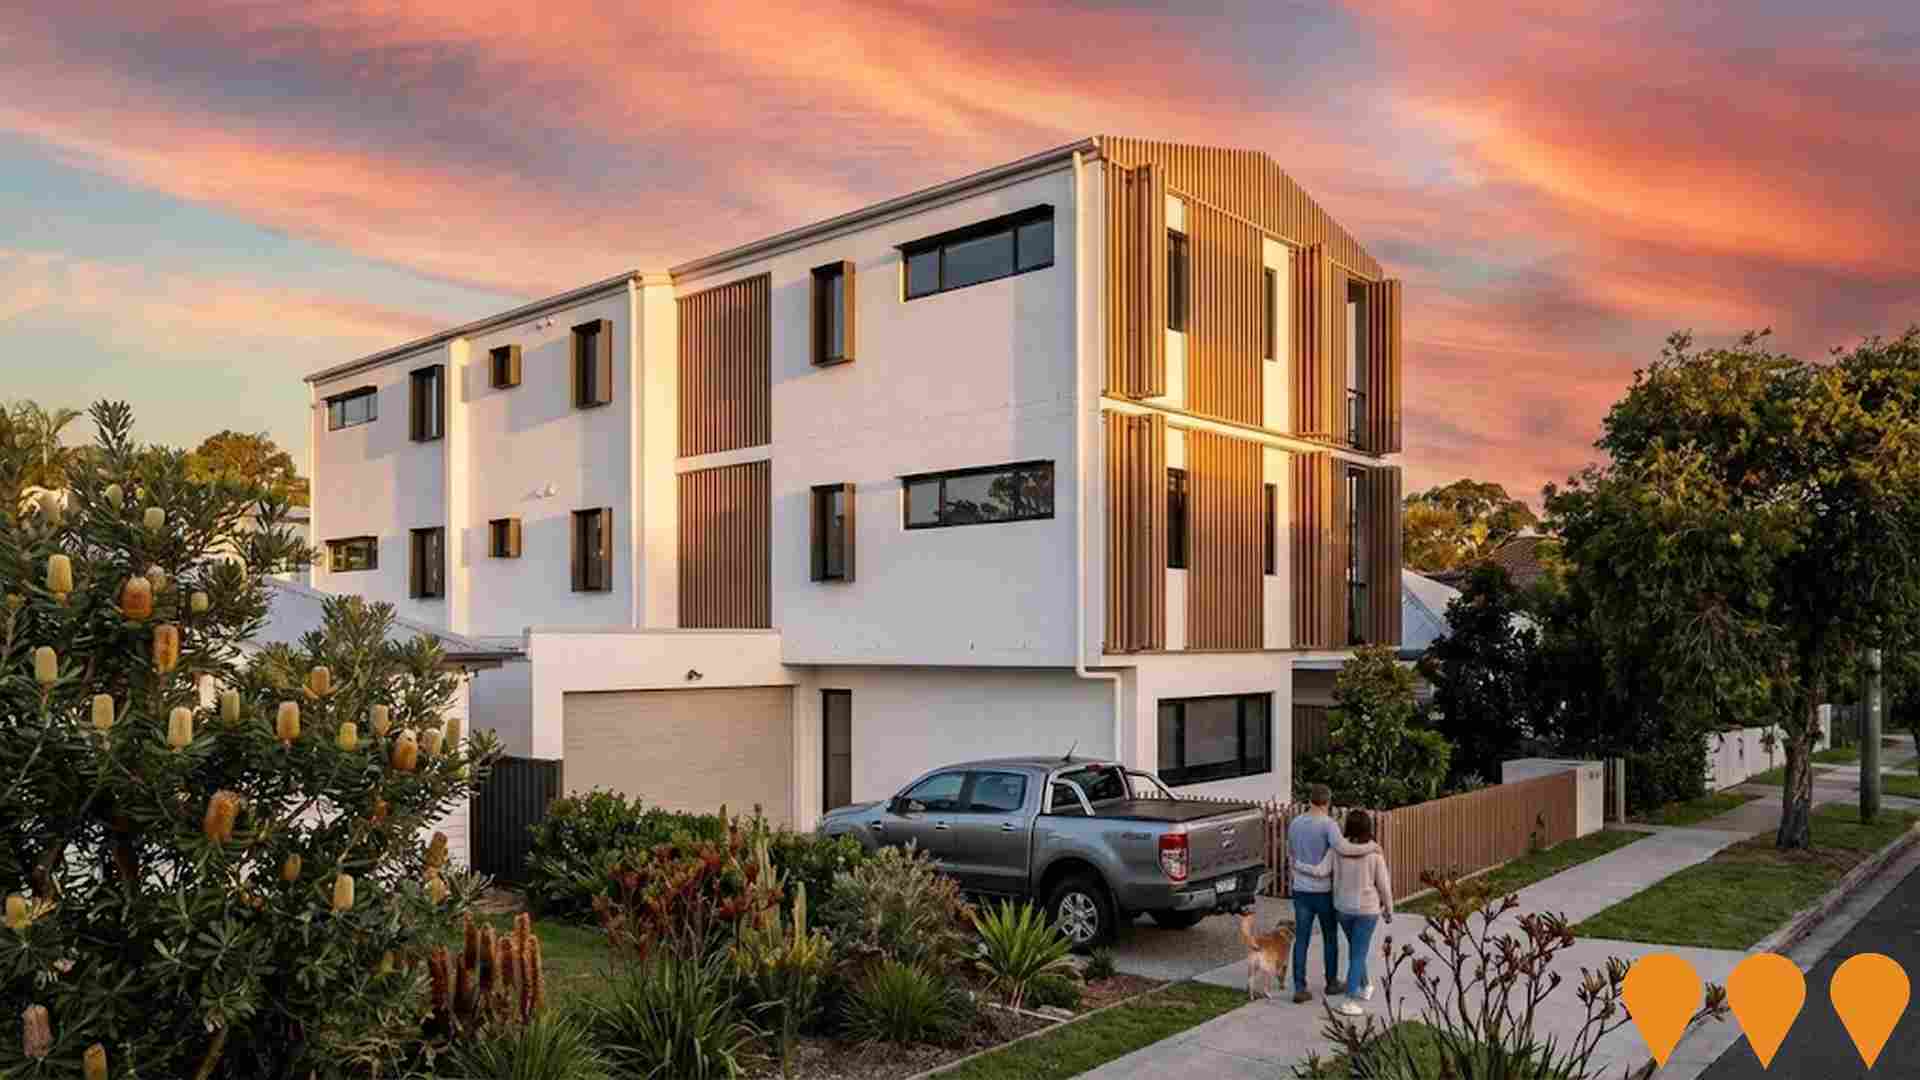
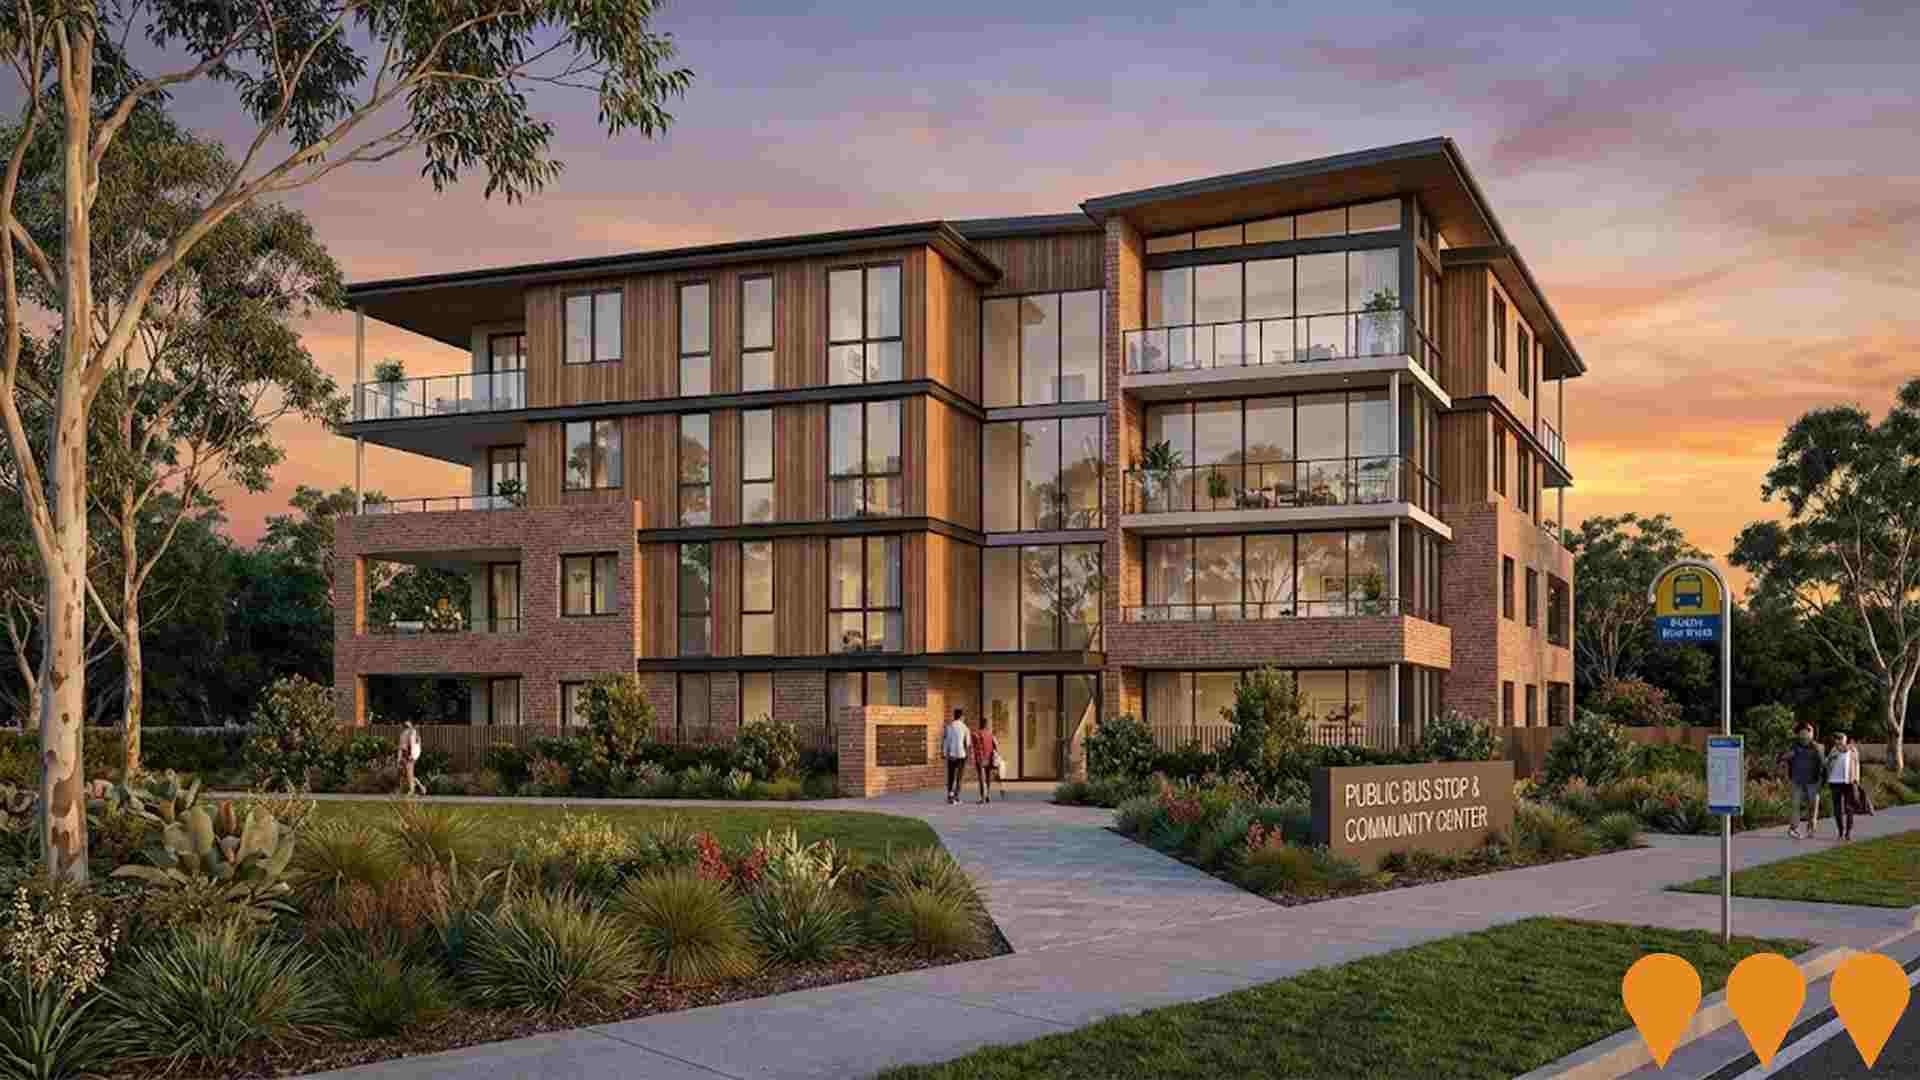
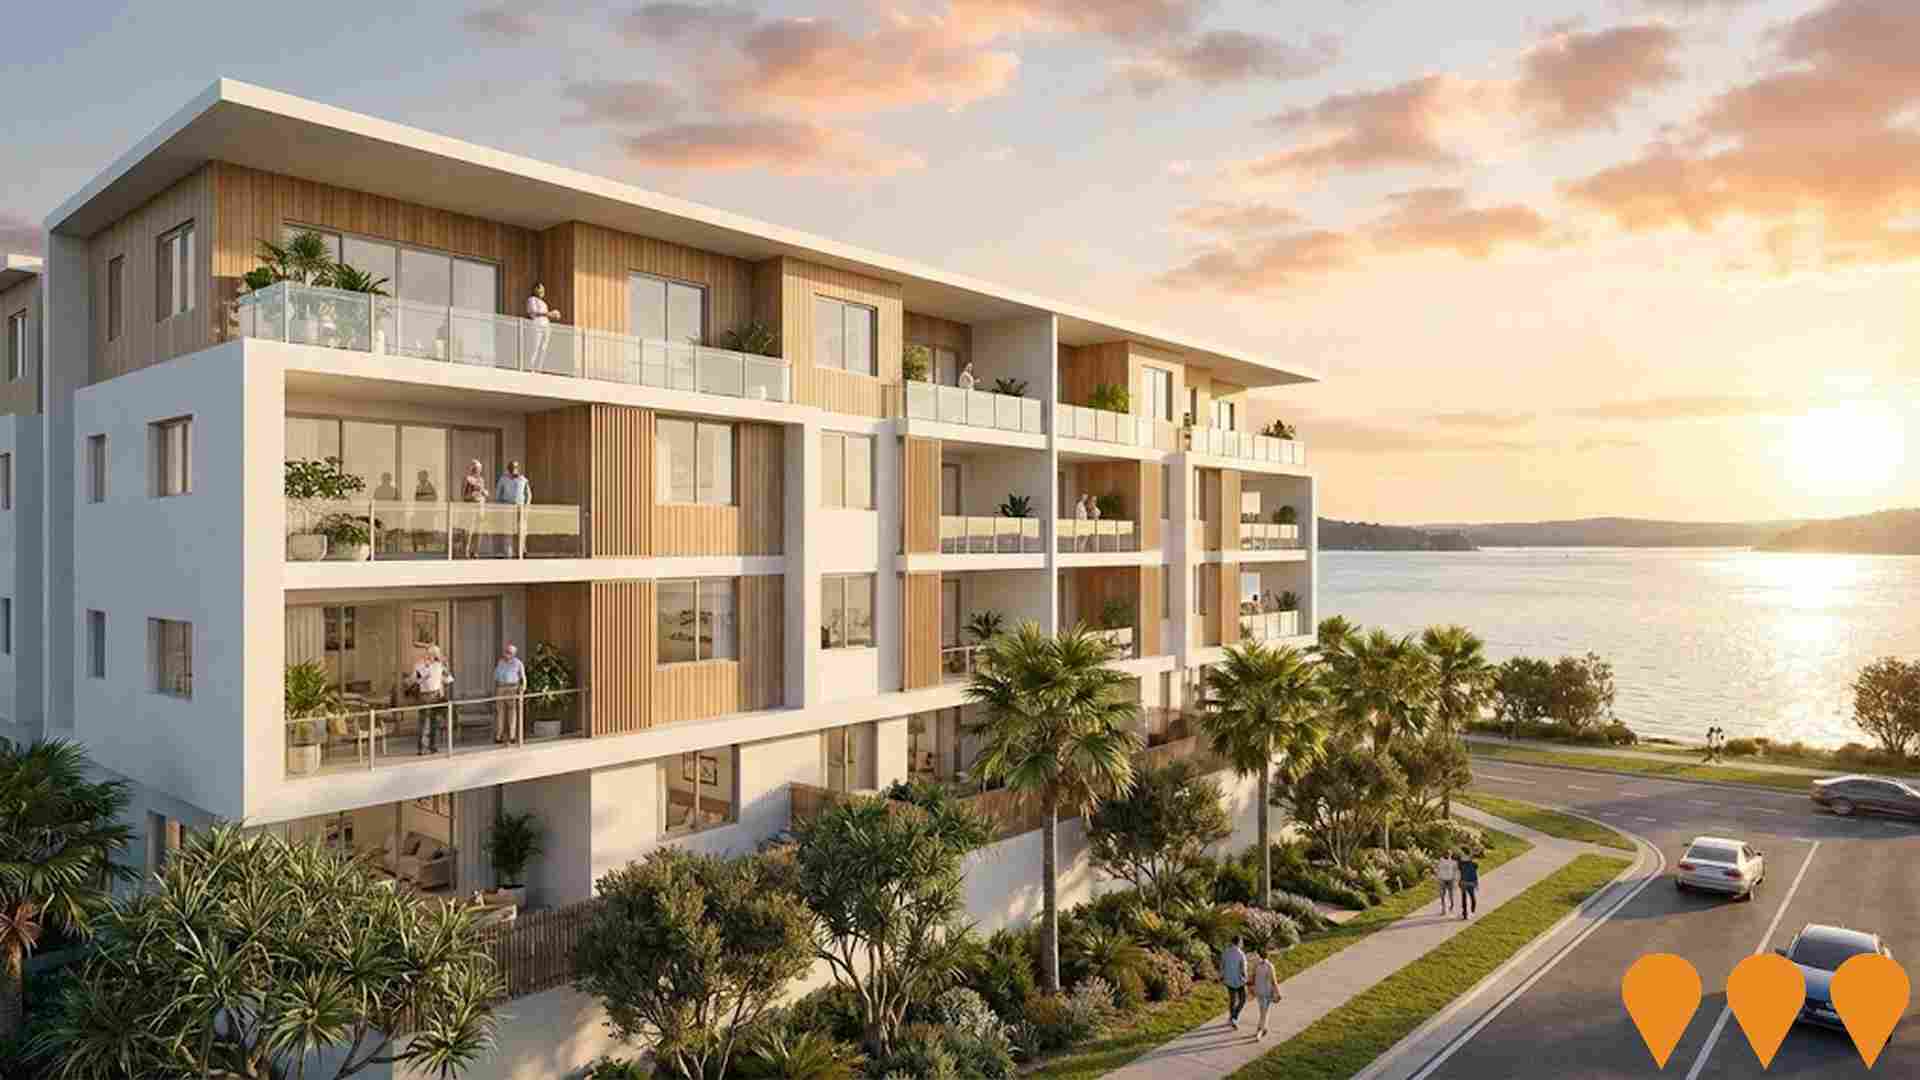
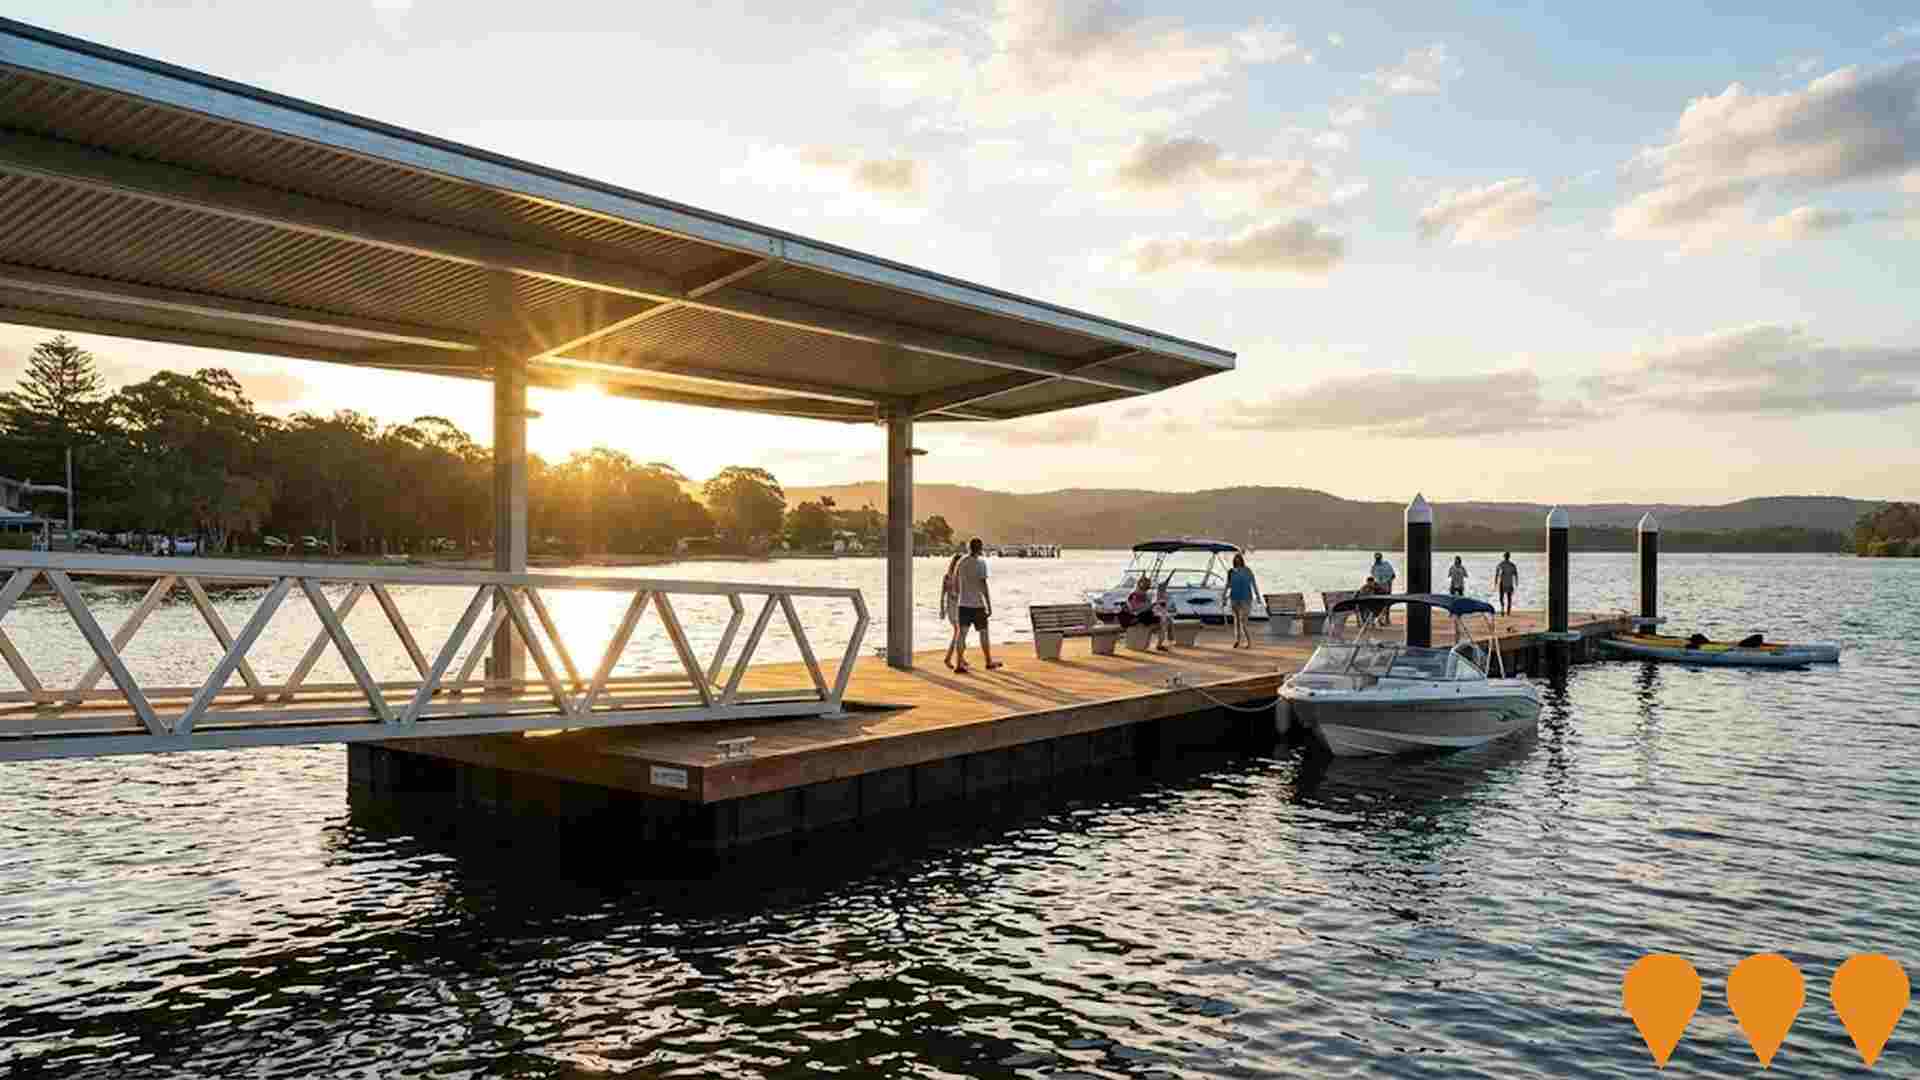
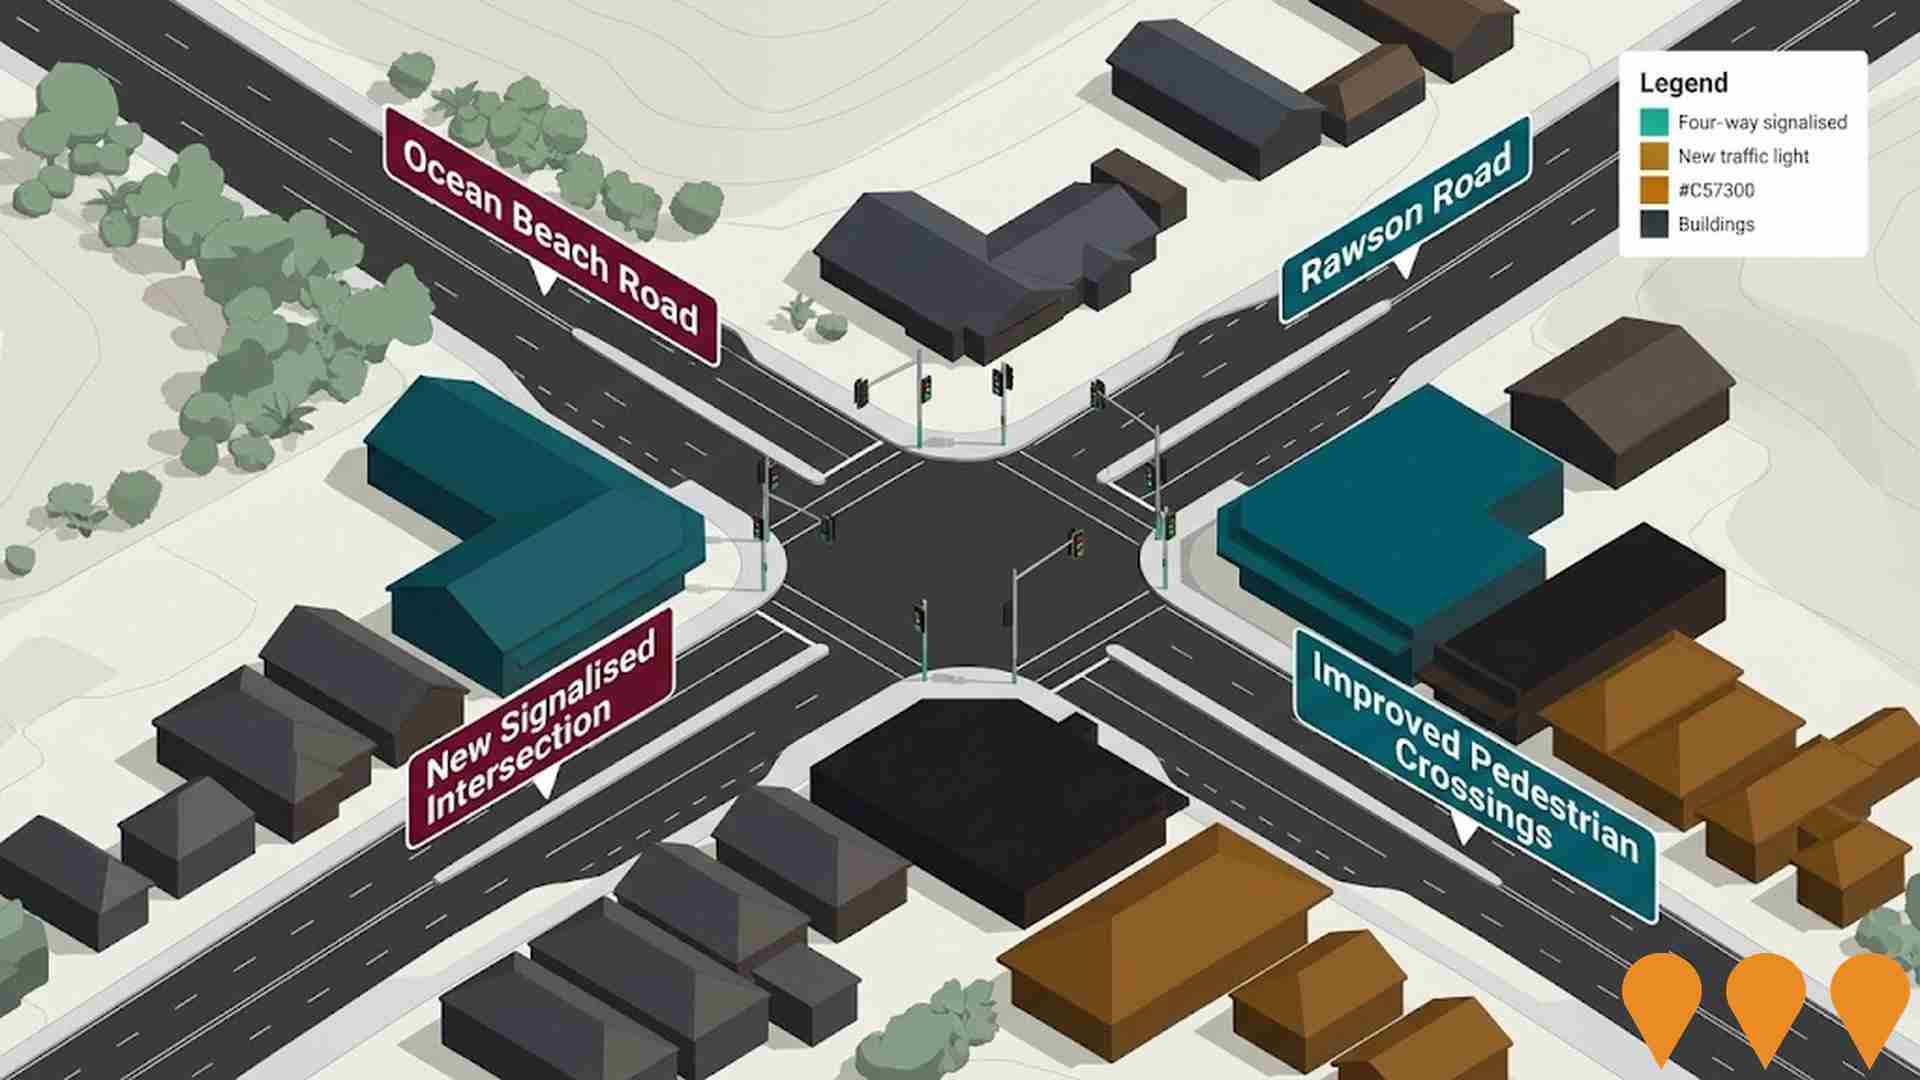
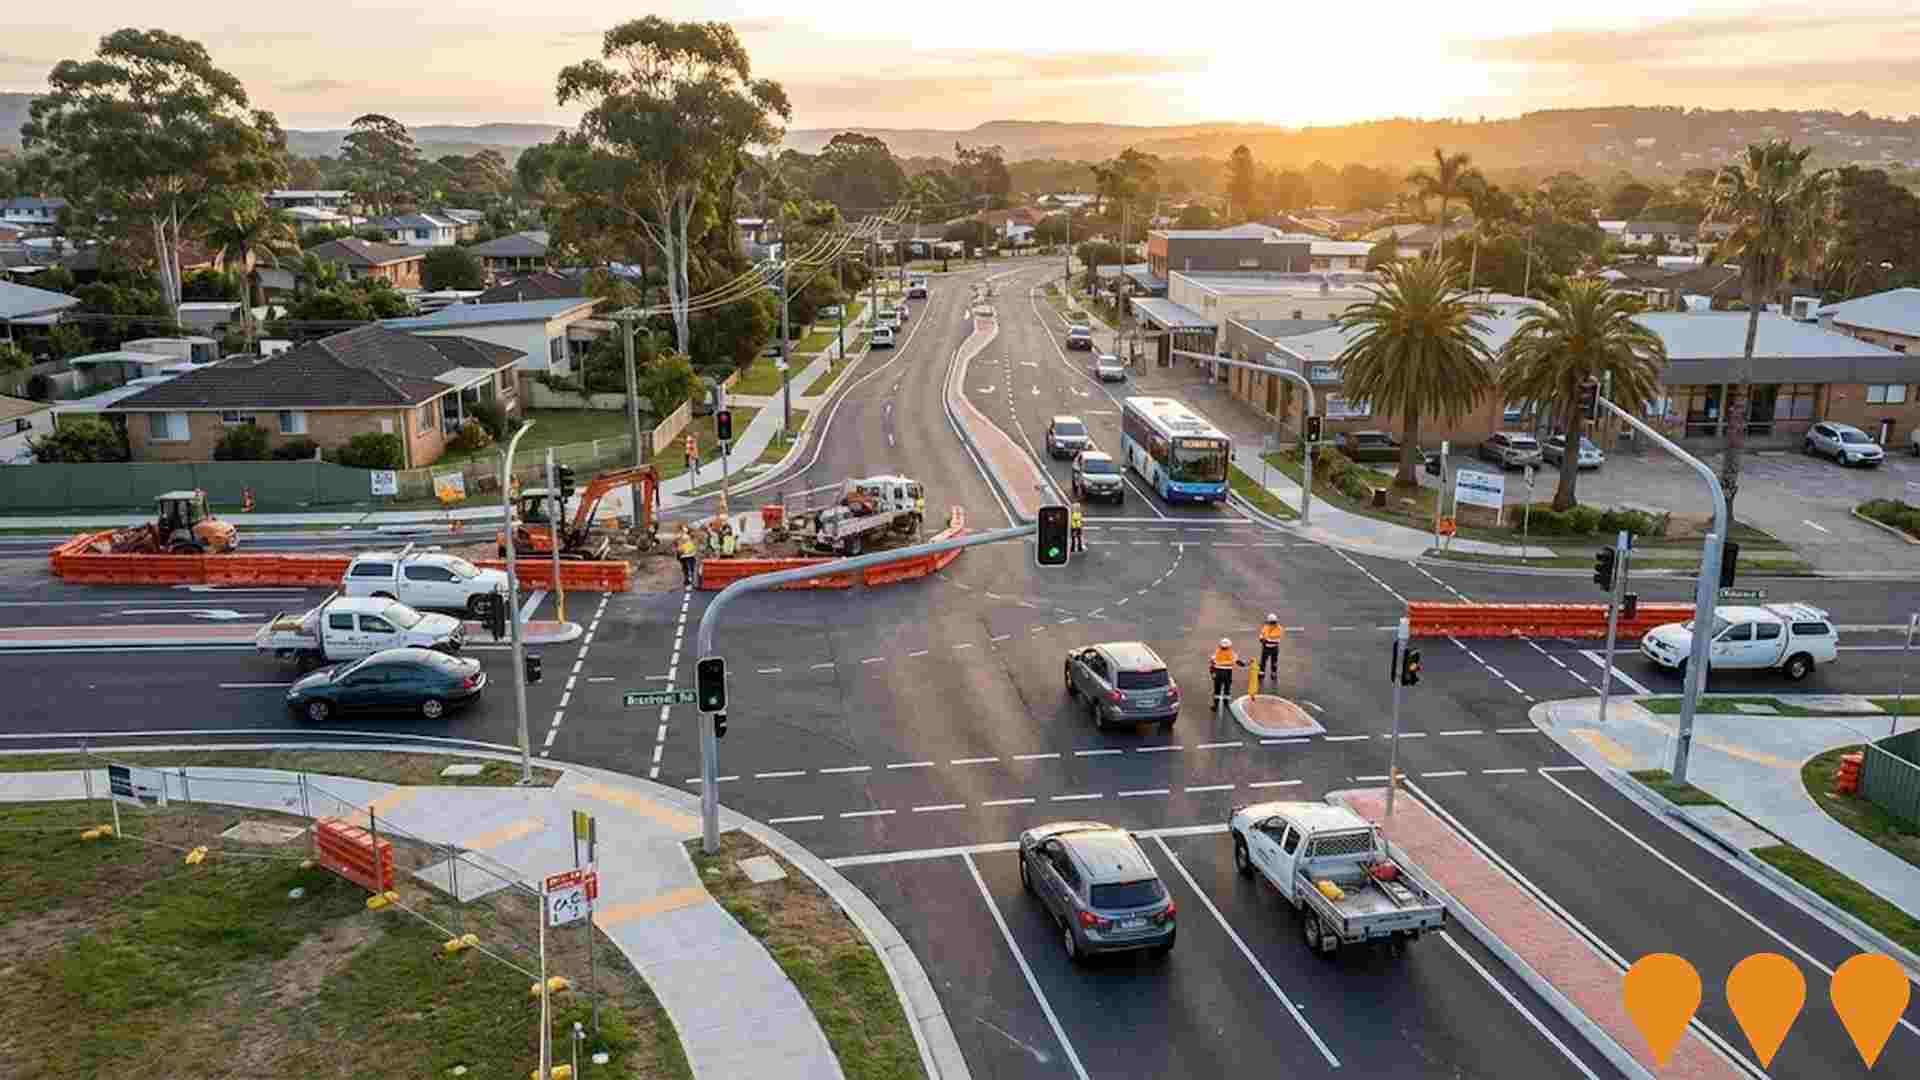
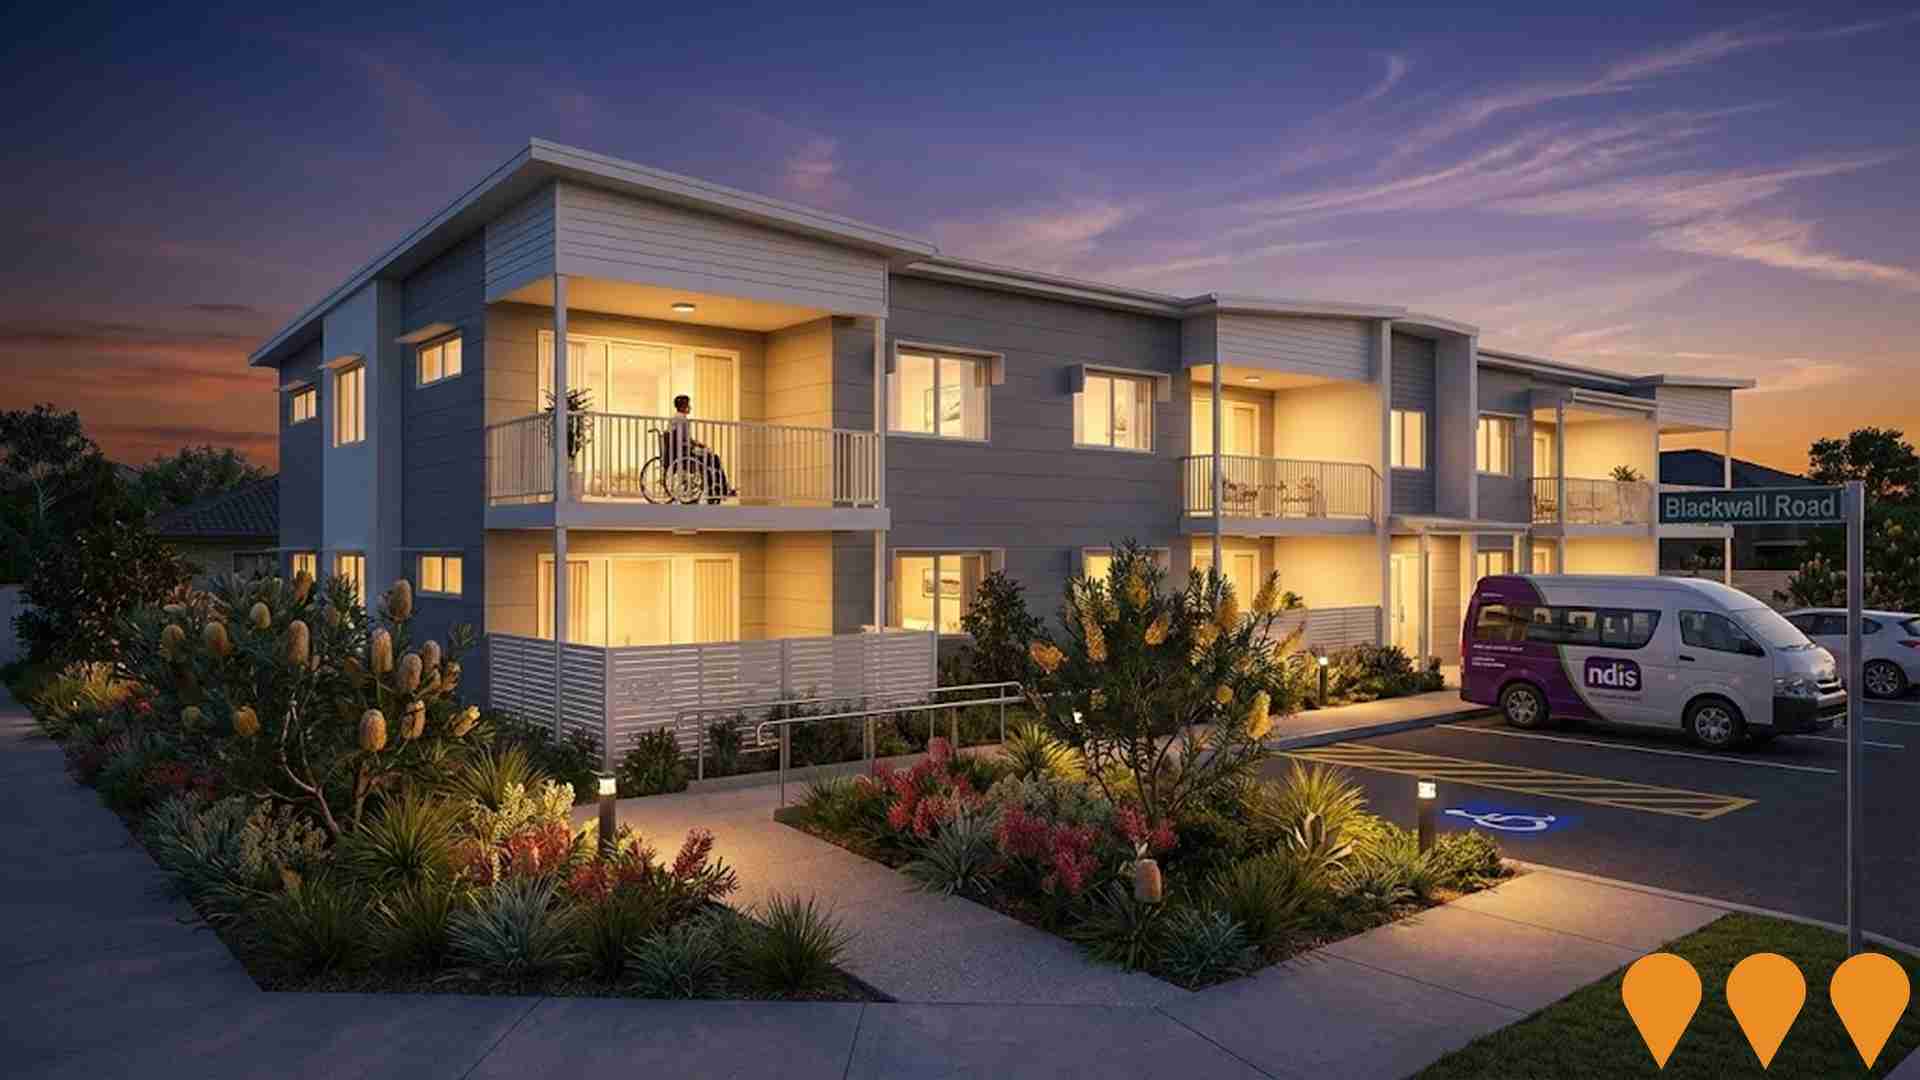
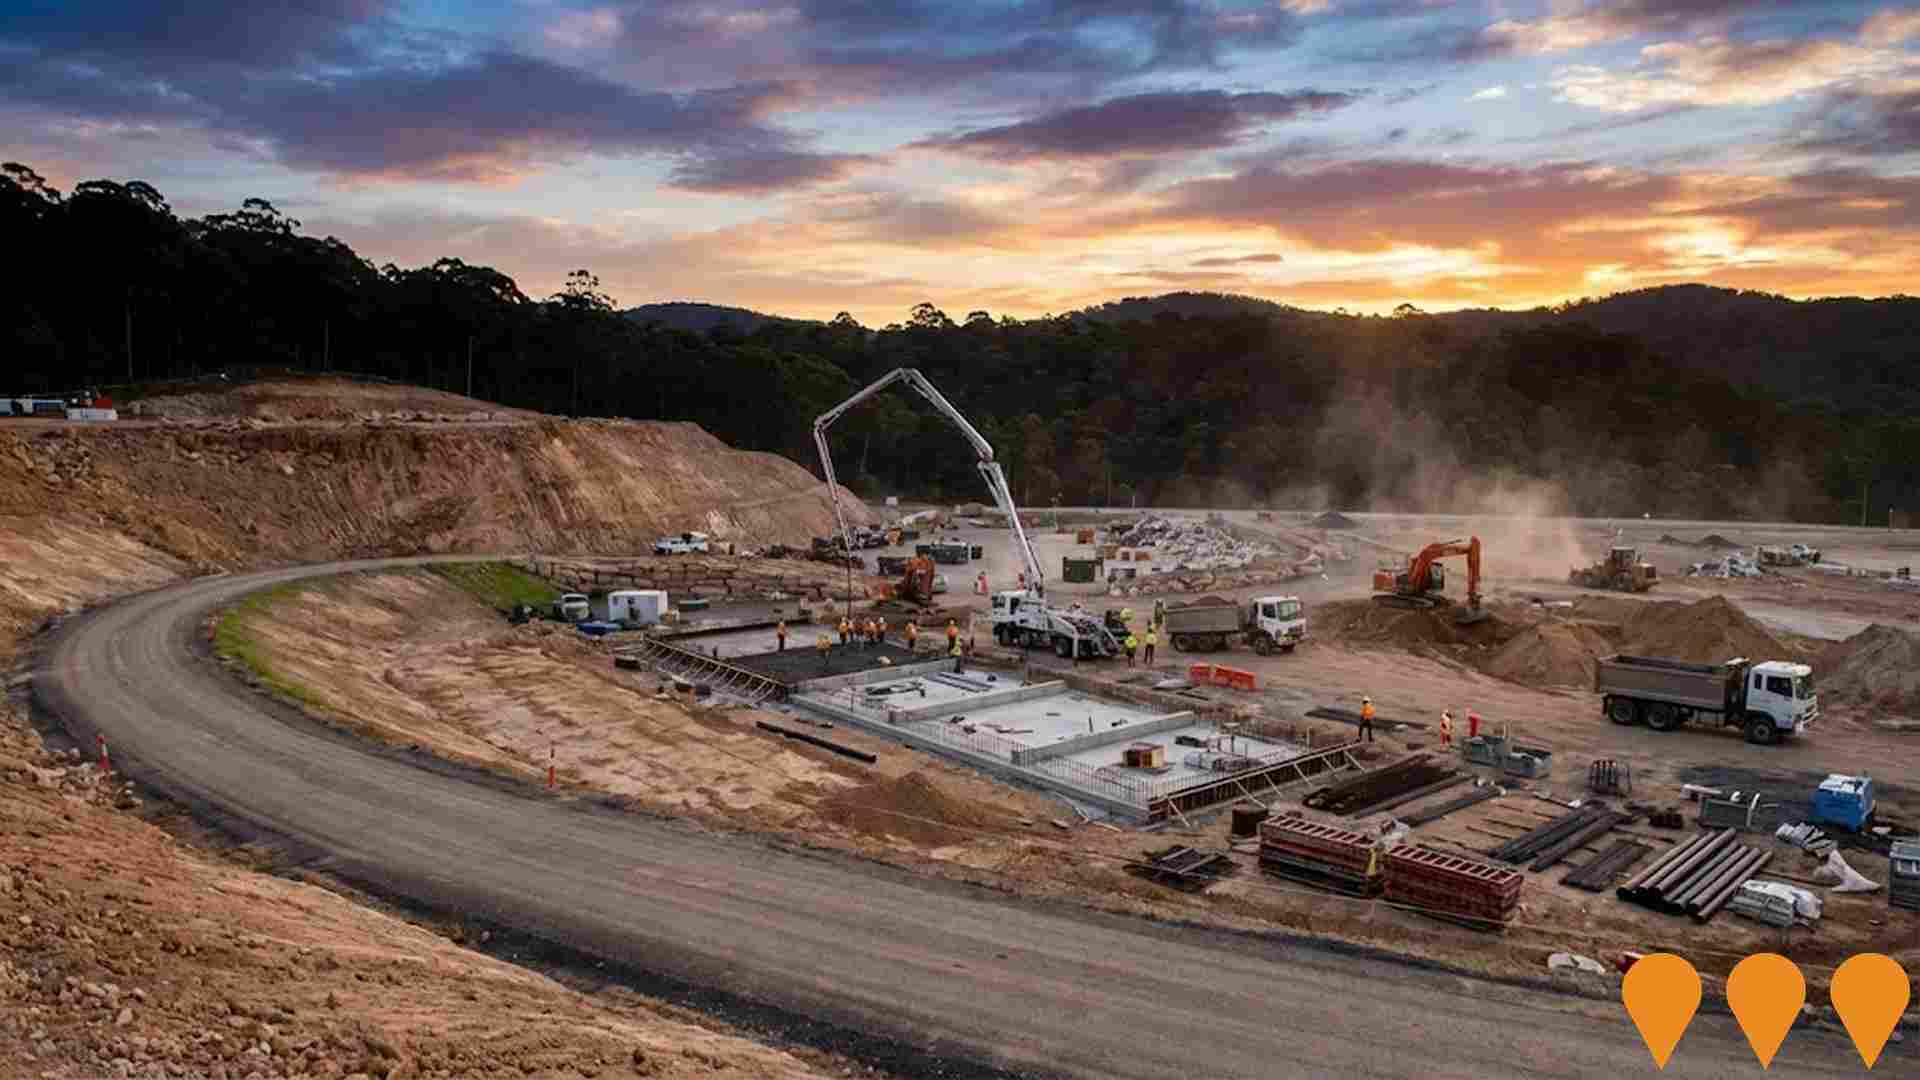
 Denotes AI-based impression for illustrative purposes only, not to be taken as definitive under any circumstances. Please follow links and conduct other investigations from the project's source for actual imagery. Developers and project owners wishing us to use original imagery please Contact Us and we will do so.
Frequently Asked Questions - Infrastructure
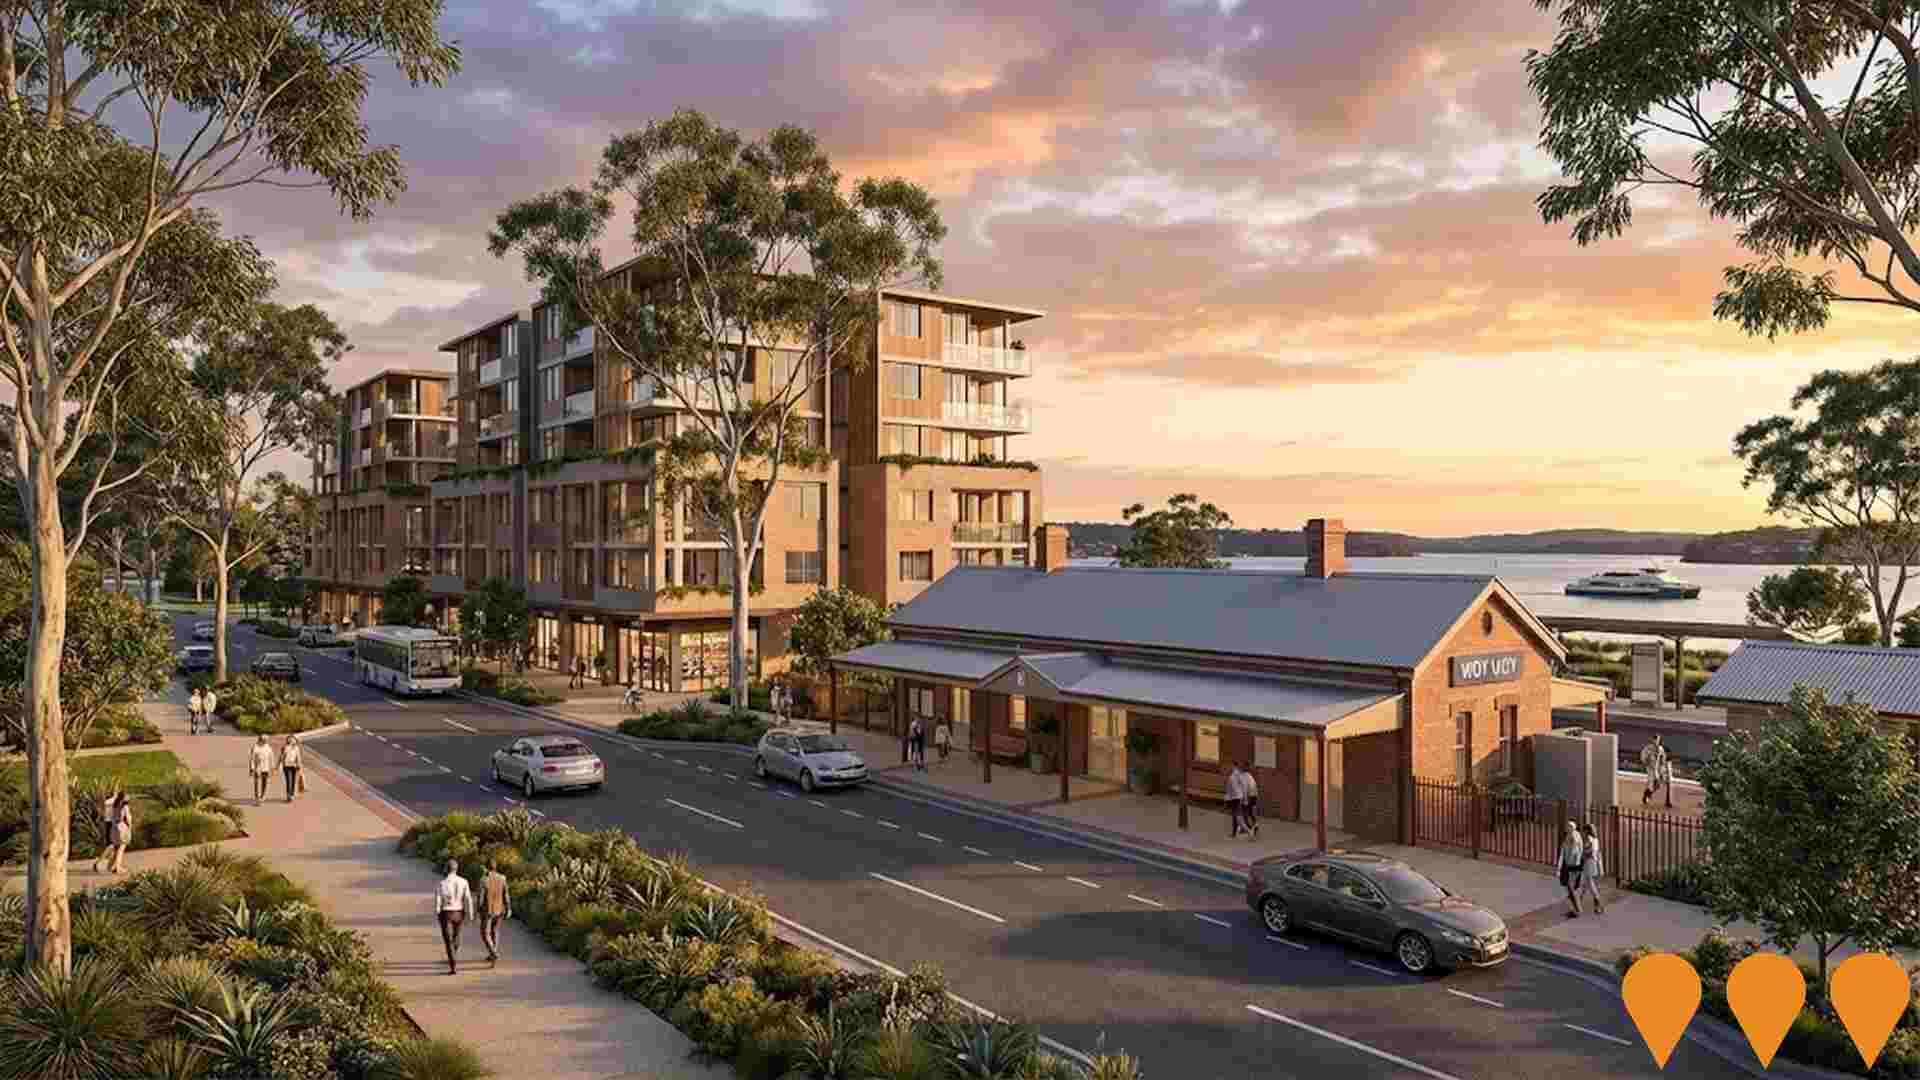
Transport Oriented Development - Woy Woy Station Precinct
State Government Transport Oriented Development (TOD) program targeting Woy Woy Railway Station Precinct for increased housing supply and density up to six storeys within 400m of the train station. The planning controls commenced on 13 May 2024, allowing for residential flat buildings and shop top housing. Encourages sustainable, mixed-use development including residential, commercial, and community facilities to create vibrant, walkable communities with improved connectivity, public spaces, and urban design. Requires infrastructure upgrades including to Woy Woy Road connection to M1. Part of broader NSW TOD SEPP reform and Central Coast development strategy to address housing needs near transport hubs.
Ocean Beach Road/Rawson Road Intersection Upgrade
Major intersection upgrade replacing single lane roundabout with signalised intersection to improve traffic flow, reduce queues by 66%, and enhance safety. Part of $107.3M Central Coast Roads Package with additional funding secured in 2025. Construction recommenced following deferral, with works ongoing.
Communications Facility at 109 McEvoy Avenue
Construction of a communications facility including a new Indara monopole, four 4G panel antennas, eight 5G active antenna units, a four-bay outdoor equipment cabinet, and ancillary equipment within a fenced compound to improve mobile network coverage in Umina Beach.

Blackwall Road Intersection Upgrades
The NSW Government is investing $19 million in upgrades to three key intersections on the Woy Woy Peninsula: Blackwall and McMasters Road, Blackwall, Allfield and Farnell Roads, and Memorial Avenue, Barrenjoey Road and Maitland Bay Drive. The project aims to improve travel times, safety, and traffic flow for the 22,000 vehicles using the Blackwall Road corridor daily. Works commenced in July 2025 and include new traffic lights, pedestrian-activated signals, dual right-turn lanes, and improved pathways. The upgrades will future-proof the Peninsula's critical transport spine as the Central Coast continues to grow.
SDA Customised - 145 Blackwall Road Apartments
Multi-unit apartment development designed for NDIS participants with specialized accessibility features and support infrastructure. The development includes accessible parking, communal facilities, and proximity to essential services including public transport and healthcare facilities. Estimated completion early 2025.
Woy Woy Waste Management Facility Expansion
Expansion of the existing waste management facility to improve recycling capabilities, increase processing capacity, and implement advanced waste sorting technologies to better serve the growing Peninsula population and improve environmental outcomes.
Woy Woy Waterfront Masterplan
A comprehensive masterplan for the revitalization of Woy Woy's waterfront area, including public spaces, commercial development, and improved connectivity. The plan focuses on creating a vibrant waterfront destination that celebrates the town's maritime heritage while providing modern amenities and recreational opportunities.
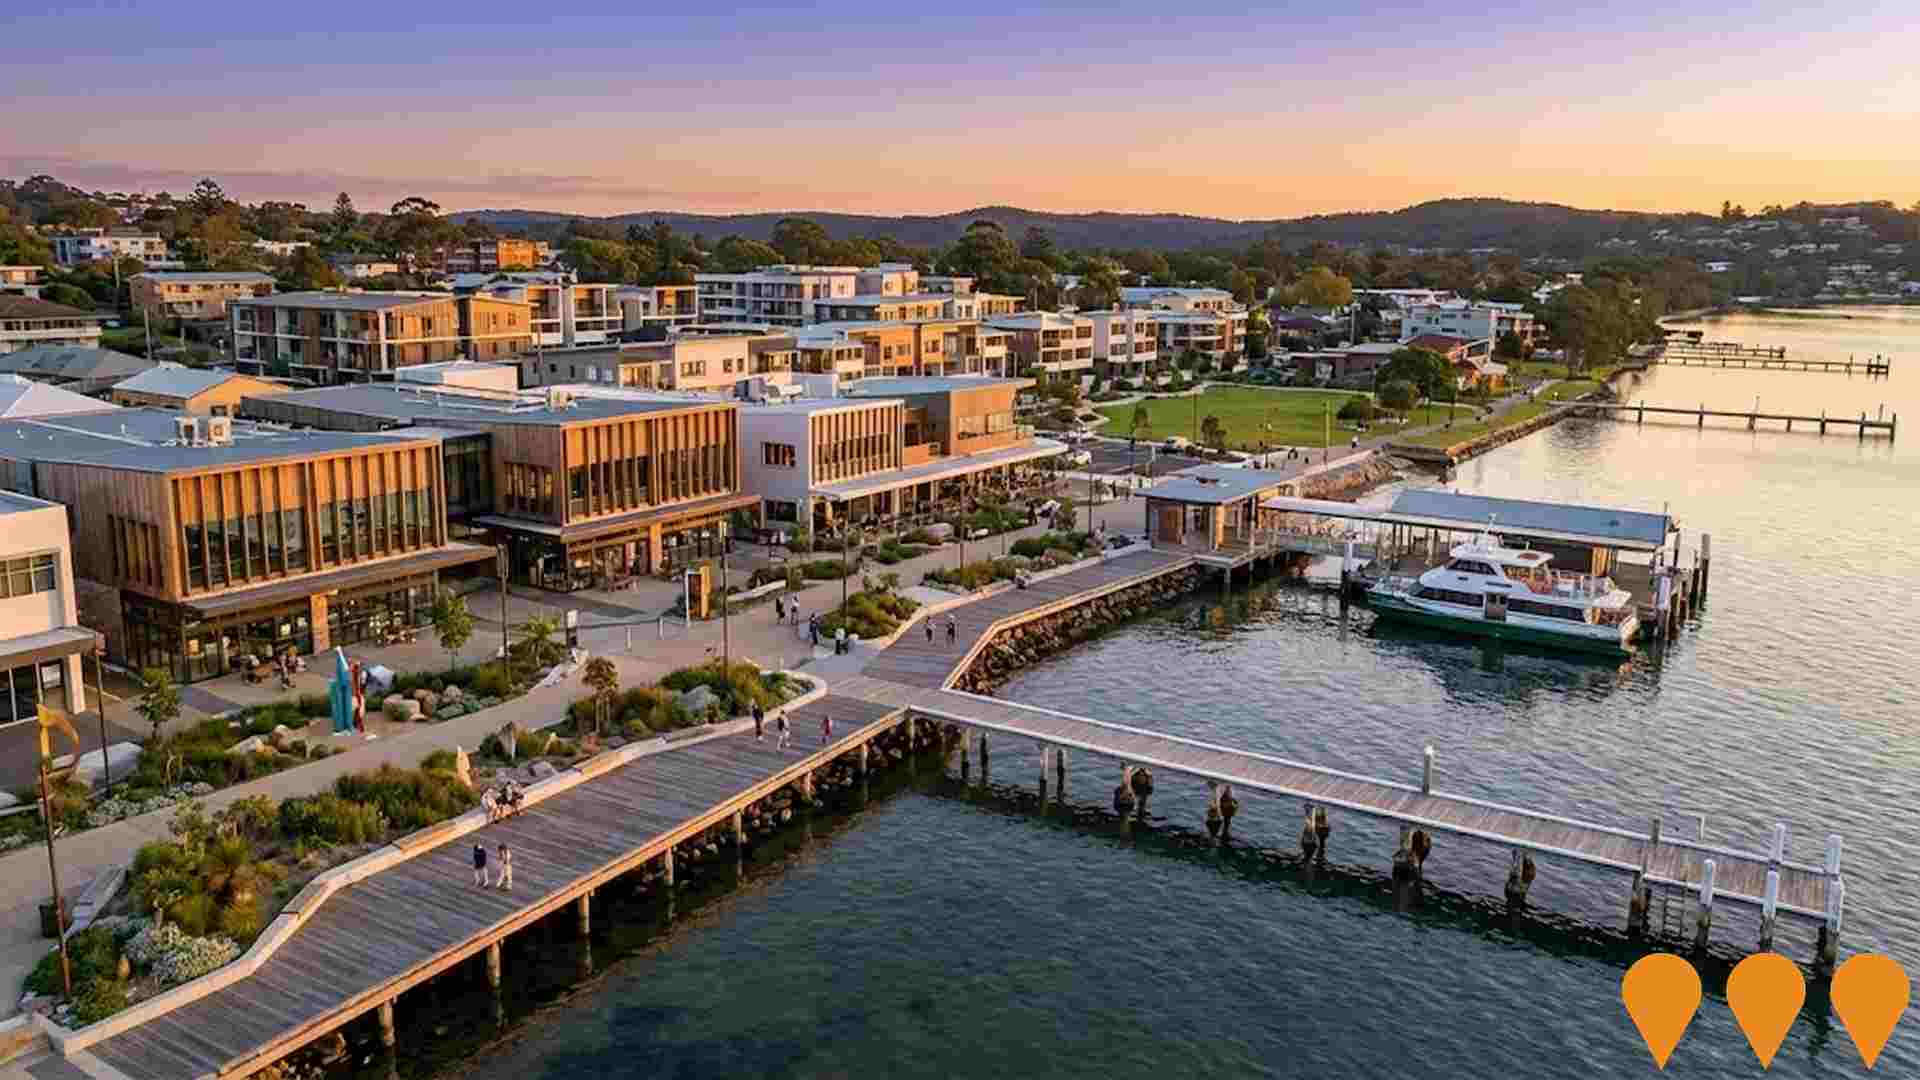
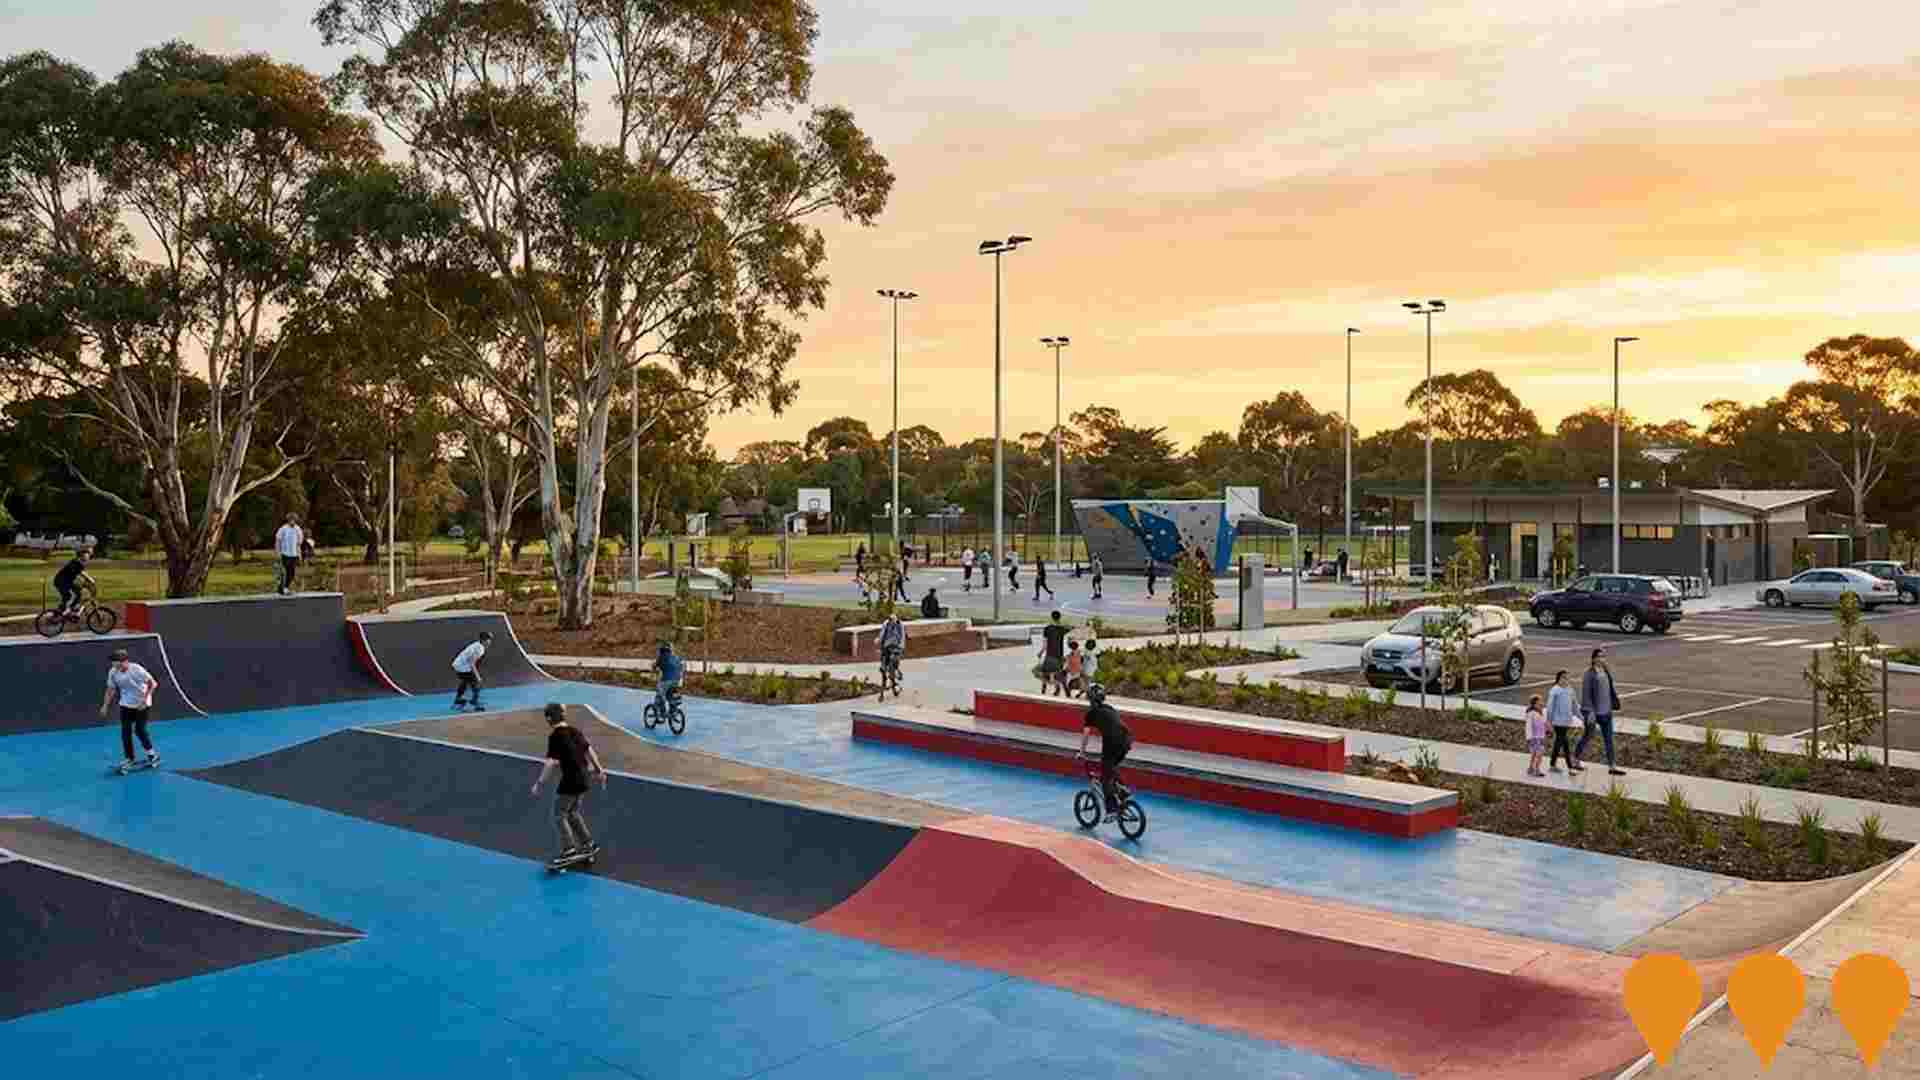
Woy Woy Lions Park Playspace Upgrade
Upgrade of the existing playground and recreational facilities at Lions Park including new play equipment for different age groups, improved accessibility features, shade structures, seating areas, and landscaping improvements to create a more inclusive and engaging community space.

Employment
Woy Woy - Blackwall shows employment indicators that trail behind approximately 70% of regions assessed across Australia
Woy Woy - Blackwall has a skilled workforce with significant representation in essential services sectors. The unemployment rate in the area was 5.4% as of September 2021, with an estimated employment growth of 2.4% over the past year.
As of September 2025, there are 6,337 residents employed, and the unemployment rate is 6.6%, which is 1.2% higher than Greater Sydney's rate of 4.2%. Workforce participation in Woy Woy - Blackwall lags behind Greater Sydney at 49.2% compared to 60.0%. The employment concentration in health care & social assistance is notable, with levels at 1.3 times the regional average. However, professional & technical services have lower representation at 7.7% versus the regional average of 11.5%.
The area appears to offer limited local employment opportunities based on Census data. Over the 12 months to September 2025, employment increased by 2.4%, while labour force increased by 3.2%, causing the unemployment rate to rise by 0.8 percentage points in Woy Woy - Blackwall. In comparison, Greater Sydney saw employment grow by 2.1% and unemployment rise by 0.2 percentage points. State-level data from NSW as of 25-Nov-25 shows employment contracted by 0.03%, with the state unemployment rate at 3.9%. This compares favourably to the national unemployment rate of 4.3%. National employment forecasts from Jobs and Skills Australia, published in May-25, project a growth of 6.6% over five years and 13.7% over ten years nationally. Applying these projections to Woy Woy - Blackwall's employment mix suggests local employment should increase by 6.8% over five years and 14.0% over ten years.
Frequently Asked Questions - Employment
Income
Income figures position the area below 75% of locations analysed nationally by AreaSearch
According to AreaSearch's aggregation of the latest postcode level ATO data released for financial year 2022, Woy Woy - Blackwall SA2 had a median income among taxpayers of $46,950. The average income stood at $63,125. This was slightly lower than the national average and compared to levels of $56,994 and $80,856 across Greater Sydney respectively. Based on Wage Price Index growth of 12.61% since financial year 2022, current estimates would be approximately $52,870 (median) and $71,085 (average) as of September 2025. From the 2021 Census, household, family and personal incomes in Woy Woy - Blackwall all fell between the 17th and 18th percentiles nationally. Income analysis revealed that 27.1% of the population (3,954 individuals) fell within the $1,500 - 2,999 income range, mirroring the region where 30.9% occupied this bracket. Housing affordability pressures were severe, with only 78.8% of income remaining, ranking at the 13th percentile.
Frequently Asked Questions - Income
Housing
Woy Woy - Blackwall displays a diverse mix of dwelling types, with a higher proportion of rental properties than the broader region
In Woy Woy-Blackwall, as per the latest Census, 66.3% of dwellings were houses, with the remaining 33.6% consisting of semi-detached homes, apartments, and other types. This differs from Sydney metro's dwelling structure, which was 74.2% houses and 25.9% other dwellings. Home ownership in Woy Woy-Blackwall stood at 35.7%, similar to Sydney metro's rate. The median monthly mortgage repayment in the area was $2,000, lower than Sydney metro's average of $2,150. Weekly rent in Woy Woy-Blackwall was $380, compared to Sydney metro's $400. Nationally, mortgage repayments in Woy Woy-Blackwall were higher at $2,000 versus Australia's average of $1,863, while rents were also higher at $380 compared to the national figure of $375.
Frequently Asked Questions - Housing
Household Composition
Woy Woy - Blackwall features high concentrations of lone person households, with a lower-than-average median household size
Family households account for 61.4% of all households, including 21.1% couples with children, 25.3% couples without children, and 13.7% single parent families. Non-family households constitute the remaining 38.6%, with lone person households at 35.1% and group households comprising 3.5%. The median household size is 2.2 people, which is smaller than the Greater Sydney average of 2.5.
Frequently Asked Questions - Households
Local Schools & Education
Woy Woy - Blackwall shows below-average educational performance compared to national benchmarks, though pockets of achievement exist
The area's university qualification rate is 20.5%, significantly lower than Greater Sydney's average of 38.0%. Bachelor degrees are the most common at 13.6%, followed by postgraduate qualifications (4.9%) and graduate diplomas (2.0%). Vocational credentials are prevalent, with 38.1% of residents aged 15+ holding them - advanced diplomas at 10.9% and certificates at 27.2%. Currently, 24.6% of the population is actively engaged in formal education, including 8.9% in primary, 6.2% in secondary, and 3.3% in tertiary education.
A substantial 24.6% of the population actively pursues formal education. This includes 8.9% in primary education, 6.2% in secondary education, and 3.3% pursuing tertiary education.
Frequently Asked Questions - Education
Schools Detail
Nearby Services & Amenities
Transport
Transport servicing is high compared to other areas nationally based on assessment of service frequency, route connectivity and accessibility
The analysis shows 174 active transport stops in Woy Woy - Blackwall, offering a mix of ferry, train, and bus services. These stops are served by 60 individual routes, collectively facilitating 4,113 weekly passenger trips. Transport accessibility is rated excellent, with residents typically located 130 meters from the nearest stop.
Service frequency averages 587 trips per day across all routes, equating to approximately 23 weekly trips per individual stop.
Frequently Asked Questions - Transport
Transport Stops Detail
Health
Health performance in Woy Woy - Blackwall is a key challenge with a range of health conditions having marked impacts on both younger and older age cohorts
Health challenges are notable across Woy Woy - Blackwall, with various conditions affecting both younger and older residents. Approximately 51% of the total population (~7,470 people) have private health cover, slightly lower than Greater Sydney's 54.7%.
The most prevalent medical conditions are arthritis (10.3%) and mental health issues (10.1%). Conversely, 59.5% report no medical ailments, compared to 64.8% in Greater Sydney. The area has a higher proportion of seniors aged 65 and over at 27.9% (4,066 people), compared to Greater Sydney's 24.5%. Despite this, health outcomes among seniors are generally positive.
Frequently Asked Questions - Health
Cultural Diversity
In terms of cultural diversity, Woy Woy - Blackwall records figures broadly comparable to the national average, as found in AreaSearch's assessment of a number of language and cultural background related metrics
Woy Woy-Blackwall, as per the 2016 Census, had a cultural diversity profile similar to its wider region. The Australian-born population was 79.9%, with 88.3% being citizens and 90.7% speaking English only at home. Christianity was the predominant religion, accounting for 52.5%.
This figure is slightly lower than Greater Sydney's 53.4%. Regarding ancestry, the top three groups were English (31.0%), Australian (28.0%), and Irish (9.5%). Notably, French (0.6% vs regional 0.5%), Maltese (0.6% vs 0.7%), and Spanish (0.5% vs 0.4%) ethnicities were relatively more represented in Woy Woy-Blackwall compared to the region.
Frequently Asked Questions - Diversity
Age
Woy Woy - Blackwall hosts an older demographic, ranking in the top quartile nationwide
Woy Woy - Blackwall's median age is 47 years, which is considerably higher than Greater Sydney's average of 37 years and exceeds the national average of 38 years. The 65-74 age group constitutes a strong 13.8% of the population compared to Greater Sydney, while the 25-34 cohort makes up only 9.4%. According to post-2021 Census data, the 75-84 age group has grown from 9.3% to 10.4%, and the 25-34 cohort has declined from 10.7% to 9.4%. By 2041, demographic modeling suggests significant changes in Woy Woy - Blackwall's age profile. The 75-84 cohort is projected to grow by 37%, adding 558 residents to reach 2,079. Residents aged 65 and above will drive 95% of population growth, indicating demographic aging trends. Meanwhile, population declines are projected for the 55-64 and 15-24 age groups.
