Chart Color Schemes
This analysis uses ABS Statistical Areas Level 2 (SA2) boundaries, which can materially differ from Suburbs and Localities (SAL) even when sharing similar names.
SA2 boundaries are defined by the Australian Bureau of Statistics and are designed to represent communities for statistical reporting (e.g., census and ERP).
Suburbs and Localities (SAL) represent commonly-used suburb/locality names (postal-style areas) and may use different geographic boundaries. For comprehensive analysis, consider reviewing both boundary types if available.
est. as @ -- *
ABS ERP | -- people | --
2021 Census | -- people
Sales Activity
Curious about local property values? Filter the chart to assess the volume and appreciation (including resales) trends and regional comparisons, or scroll to the map below view this information at an individual property level.
Find a Recent Sale
Sales Detail
Population
An assessment of population growth drivers in Ferntree Gully (South) - Upper Ferntree Gully reveals an overall ranking slightly below national averages considering recent, and medium term trends
Ferntree Gully (South) - Upper Ferntree Gully's population was 15,897 as of November 2025. This figure shows an increase of 563 people, a 3.7% rise from the 2021 Census count of 15,334 residents. The growth is inferred from the estimated resident population of 15,698 in June 2024 and an additional 118 validated new addresses since the Census date. This results in a population density of 1,737 persons per square kilometer, higher than the average across national locations assessed by AreaSearch. The area's growth rate of 3.7% since the census is within 0.3 percentage points of the SA4 region's 4.0%, indicating strong growth fundamentals. Overseas migration contributed approximately 54.2% of overall population gains during recent periods.
AreaSearch uses ABS/Geoscience Australia projections for each SA2 area, released in 2024 with a base year of 2022. For areas not covered by this data, AreaSearch employs the VIC State Government's Regional/LGA projections from 2023, adjusting using weighted aggregation methods to SA2 levels. Growth rates by age group are applied across all areas for years 2032 to 2041. Based on demographic trends and latest annual ERP population numbers, Ferntree Gully (South) - Upper Ferntree Gully is expected to grow by 510 persons by 2041, reflecting a total gain of 1.3% over the 17 years.
Frequently Asked Questions - Population
Development
AreaSearch assessment of residential development drivers sees a low level of activity in Ferntree Gully (South) - Upper Ferntree Gully, placing the area among the bottom 25% of areas assessed nationally
Ferntree Gully South - Upper Ferntree Gully has seen approximately 41 new homes approved annually. From FY21 to FY25, around 207 homes were approved, with an additional 25 approved in FY26 so far. Over these five years, the average population growth per dwelling was 0.3 people.
This suggests that new supply is meeting or exceeding demand, providing ample buyer choice and room for population growth beyond current forecasts. The average construction cost of new properties is $300,000, consistent with regional patterns. In FY26, commercial approvals totalled $45.3 million, indicating strong local business investment. Compared to Greater Melbourne, Ferntree Gully South - Upper Ferntree Gully has around two-thirds the rate of new dwelling approvals per person and ranks in the 32nd percentile nationally. This results in relatively constrained buyer choice, supporting interest in existing dwellings.
New building activity consists of 67.0% detached houses and 33.0% medium to high-density housing, offering a mix of opportunities across price brackets. With around 522 people per dwelling approval, the area shows a developed market. Population forecasts indicate Ferntree Gully South - Upper Ferntree Gully will gain approximately 213 residents by 2041. Based on current development patterns, new housing supply should readily meet demand, offering good conditions for buyers and potentially facilitating population growth beyond current projections.
Frequently Asked Questions - Development
Infrastructure
Ferntree Gully (South) - Upper Ferntree Gully has moderate levels of nearby infrastructure activity, ranking in the 48thth percentile nationally
Changes to local infrastructure significantly impact an area's performance. AreaSearch has identified 16 projects likely affecting the region. Notable initiatives include Angliss Hospital Expansion, 13 Mountain Gate Drive Townhouses, Knoxfield Development Victoria Project, and Kings Park Masterplan. The following list details those expected to have most relevance.
Professional plan users can use the search below to filter and access additional projects.
INFRASTRUCTURE SEARCH
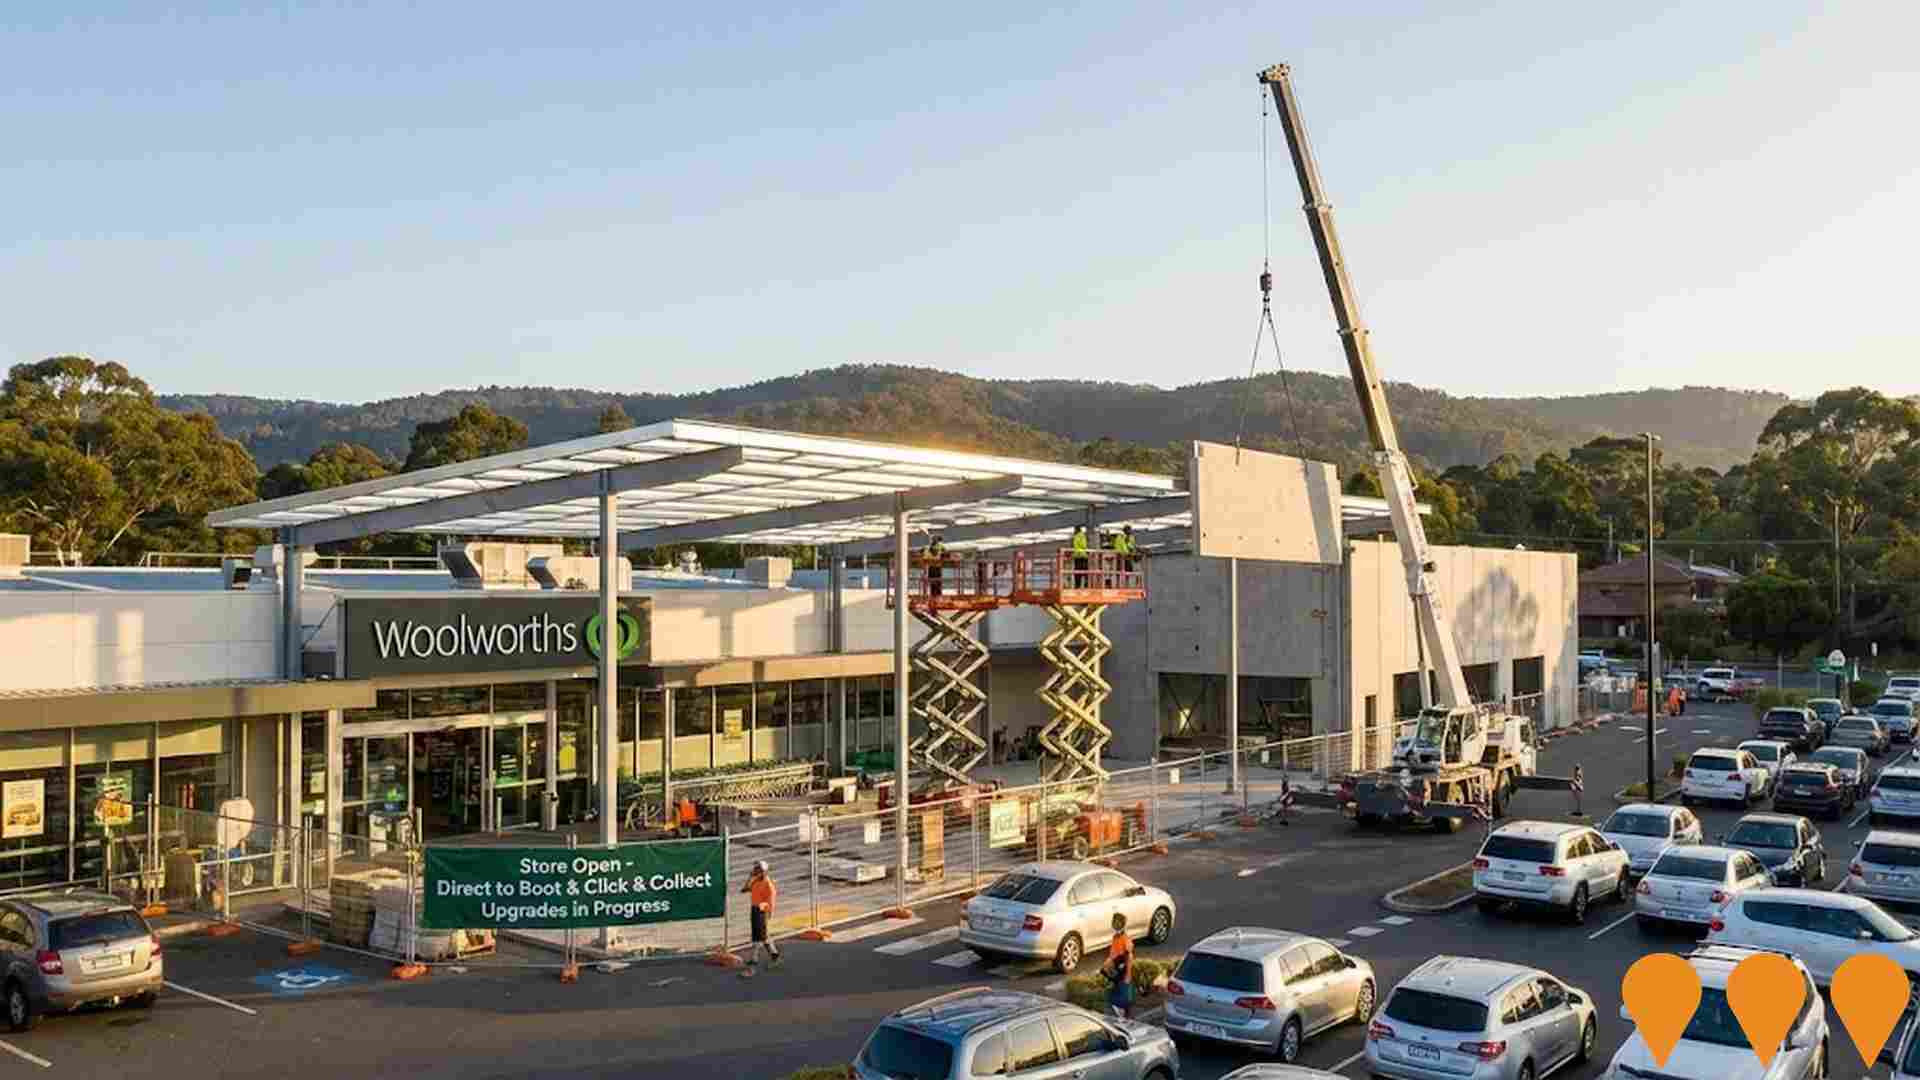
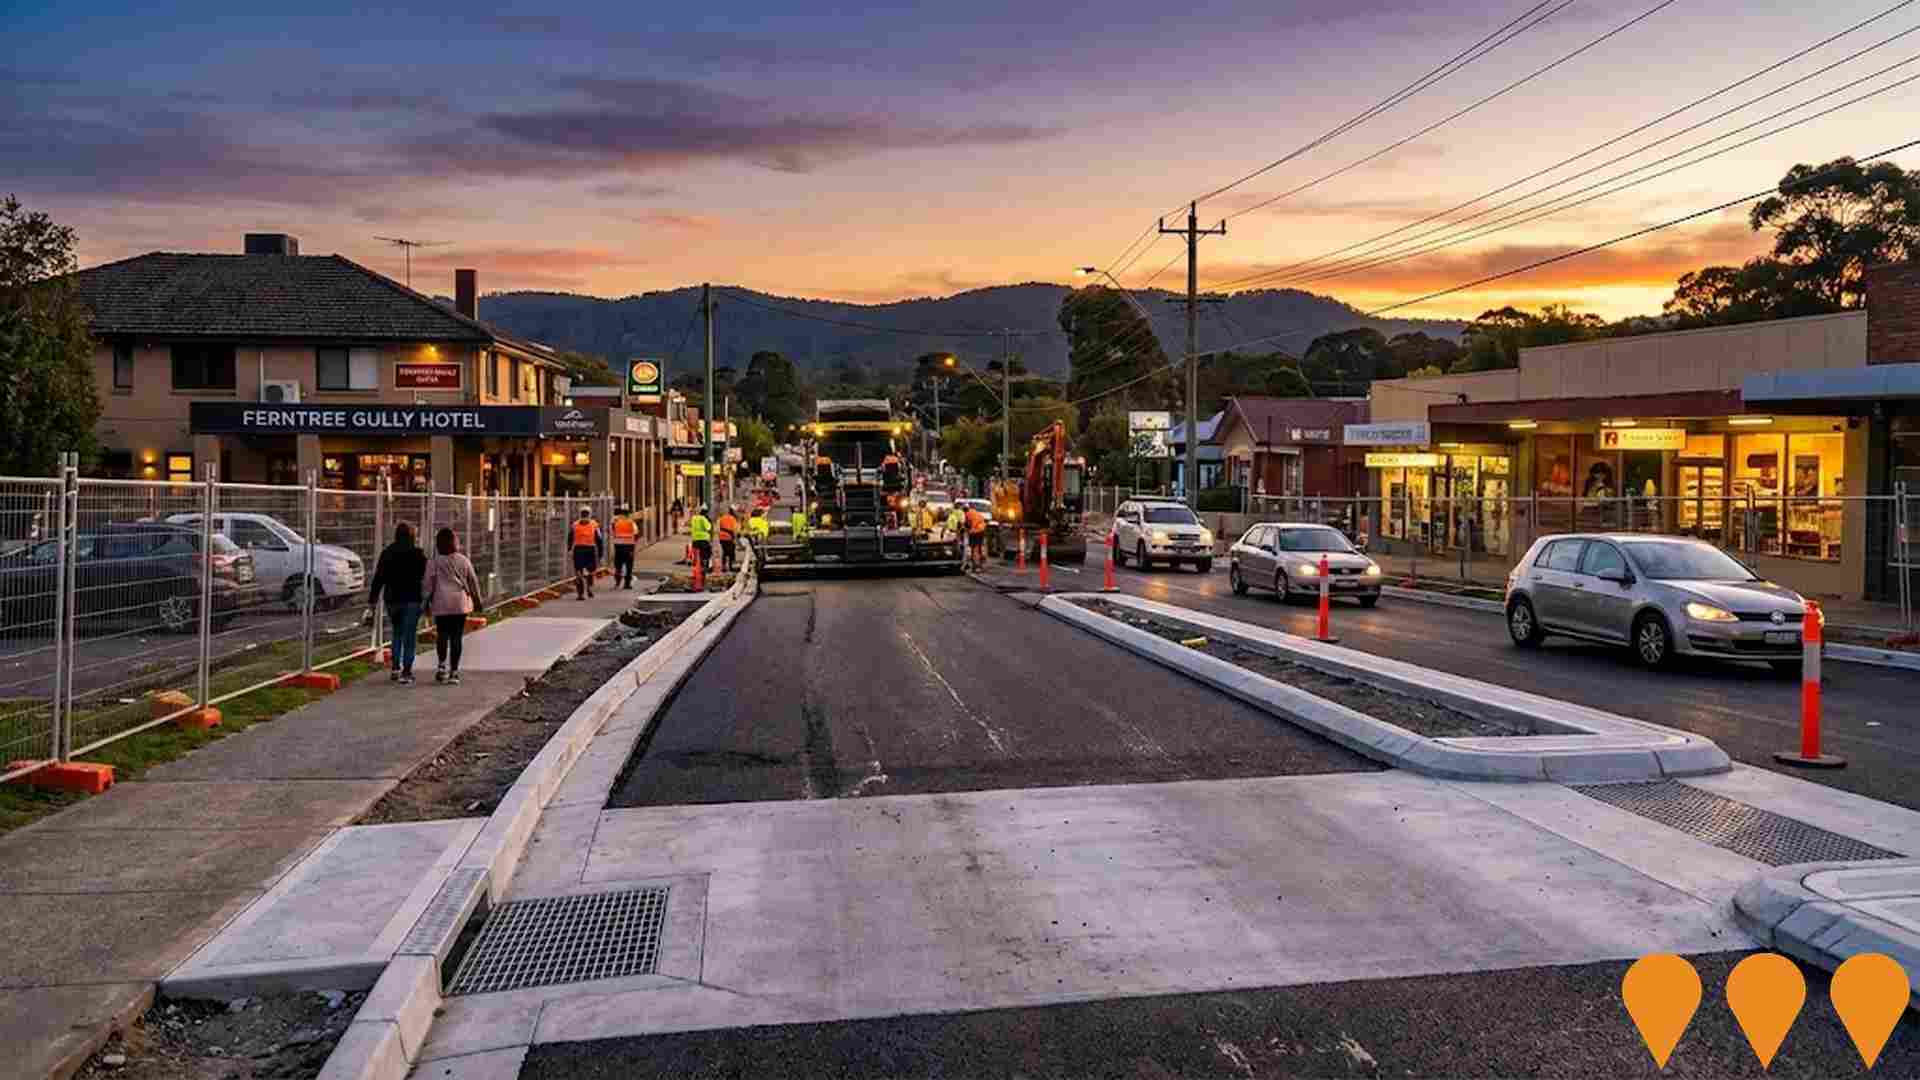
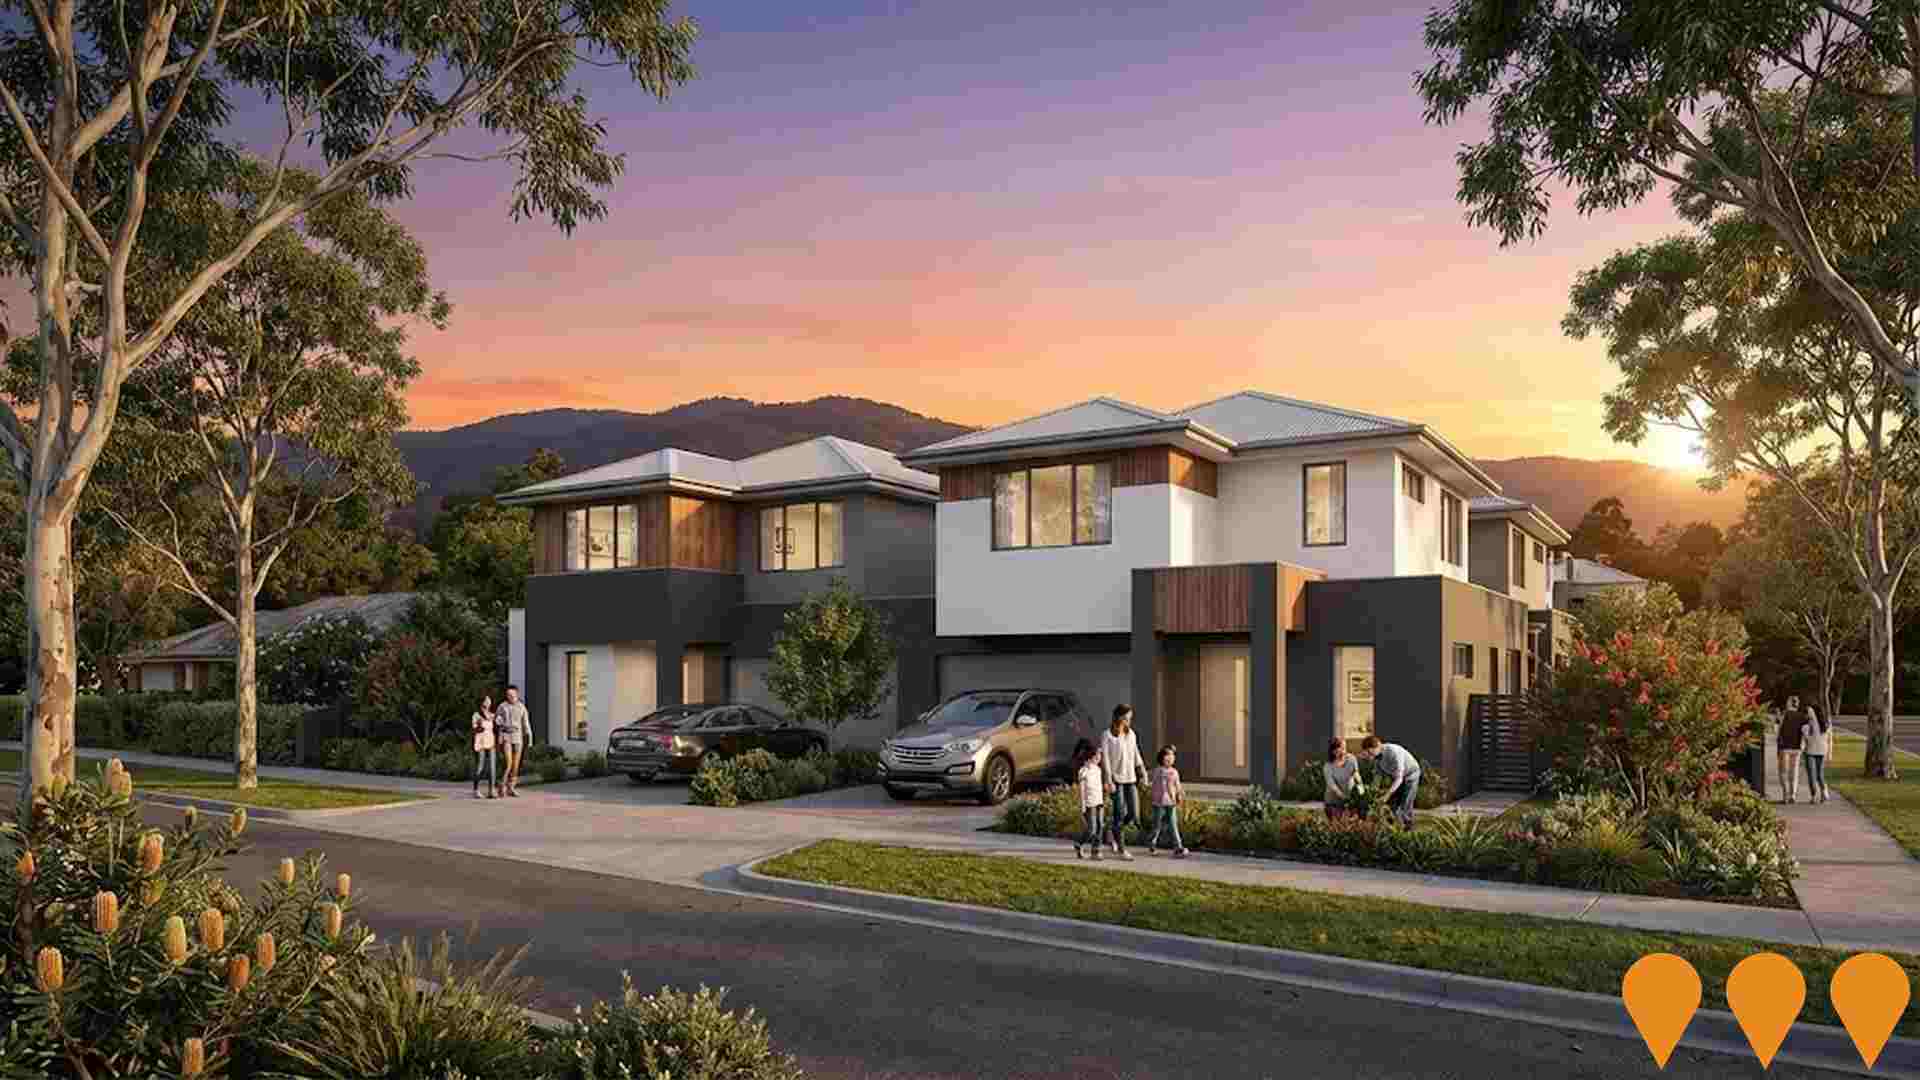
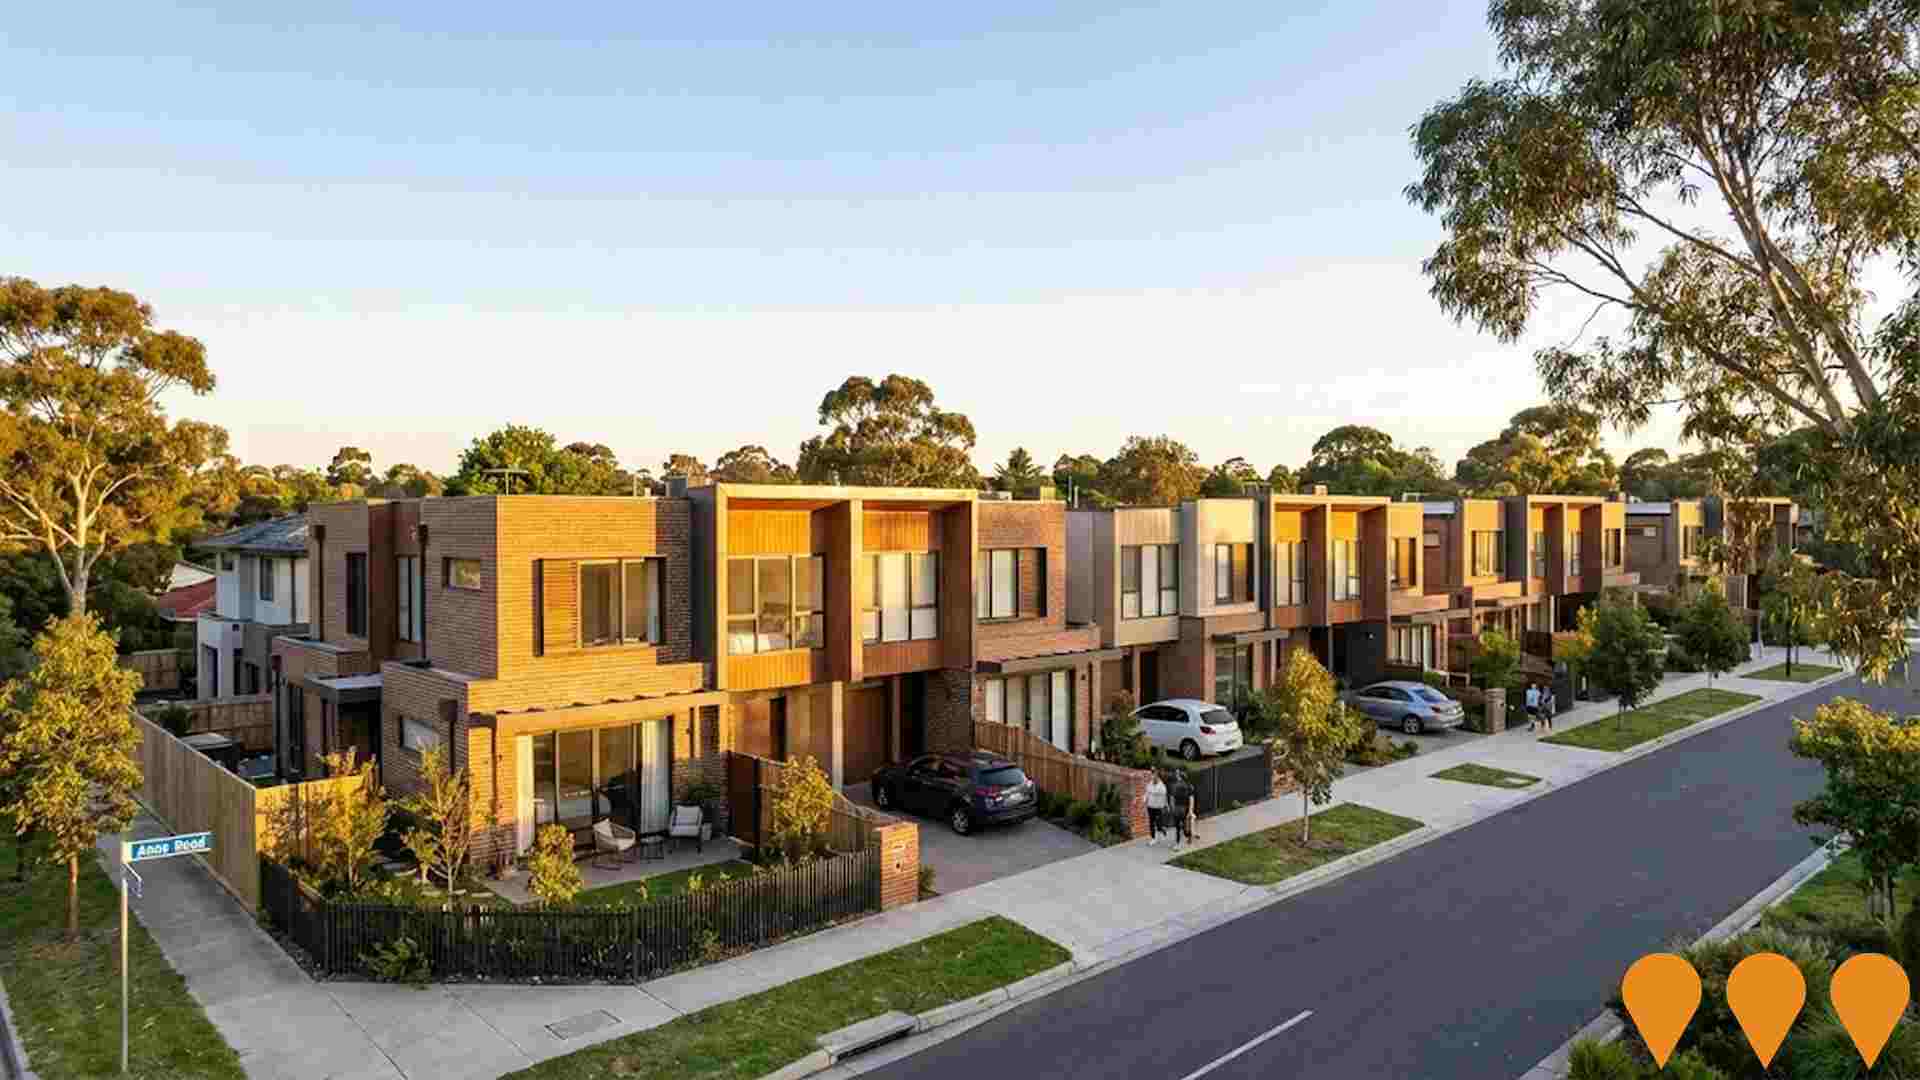
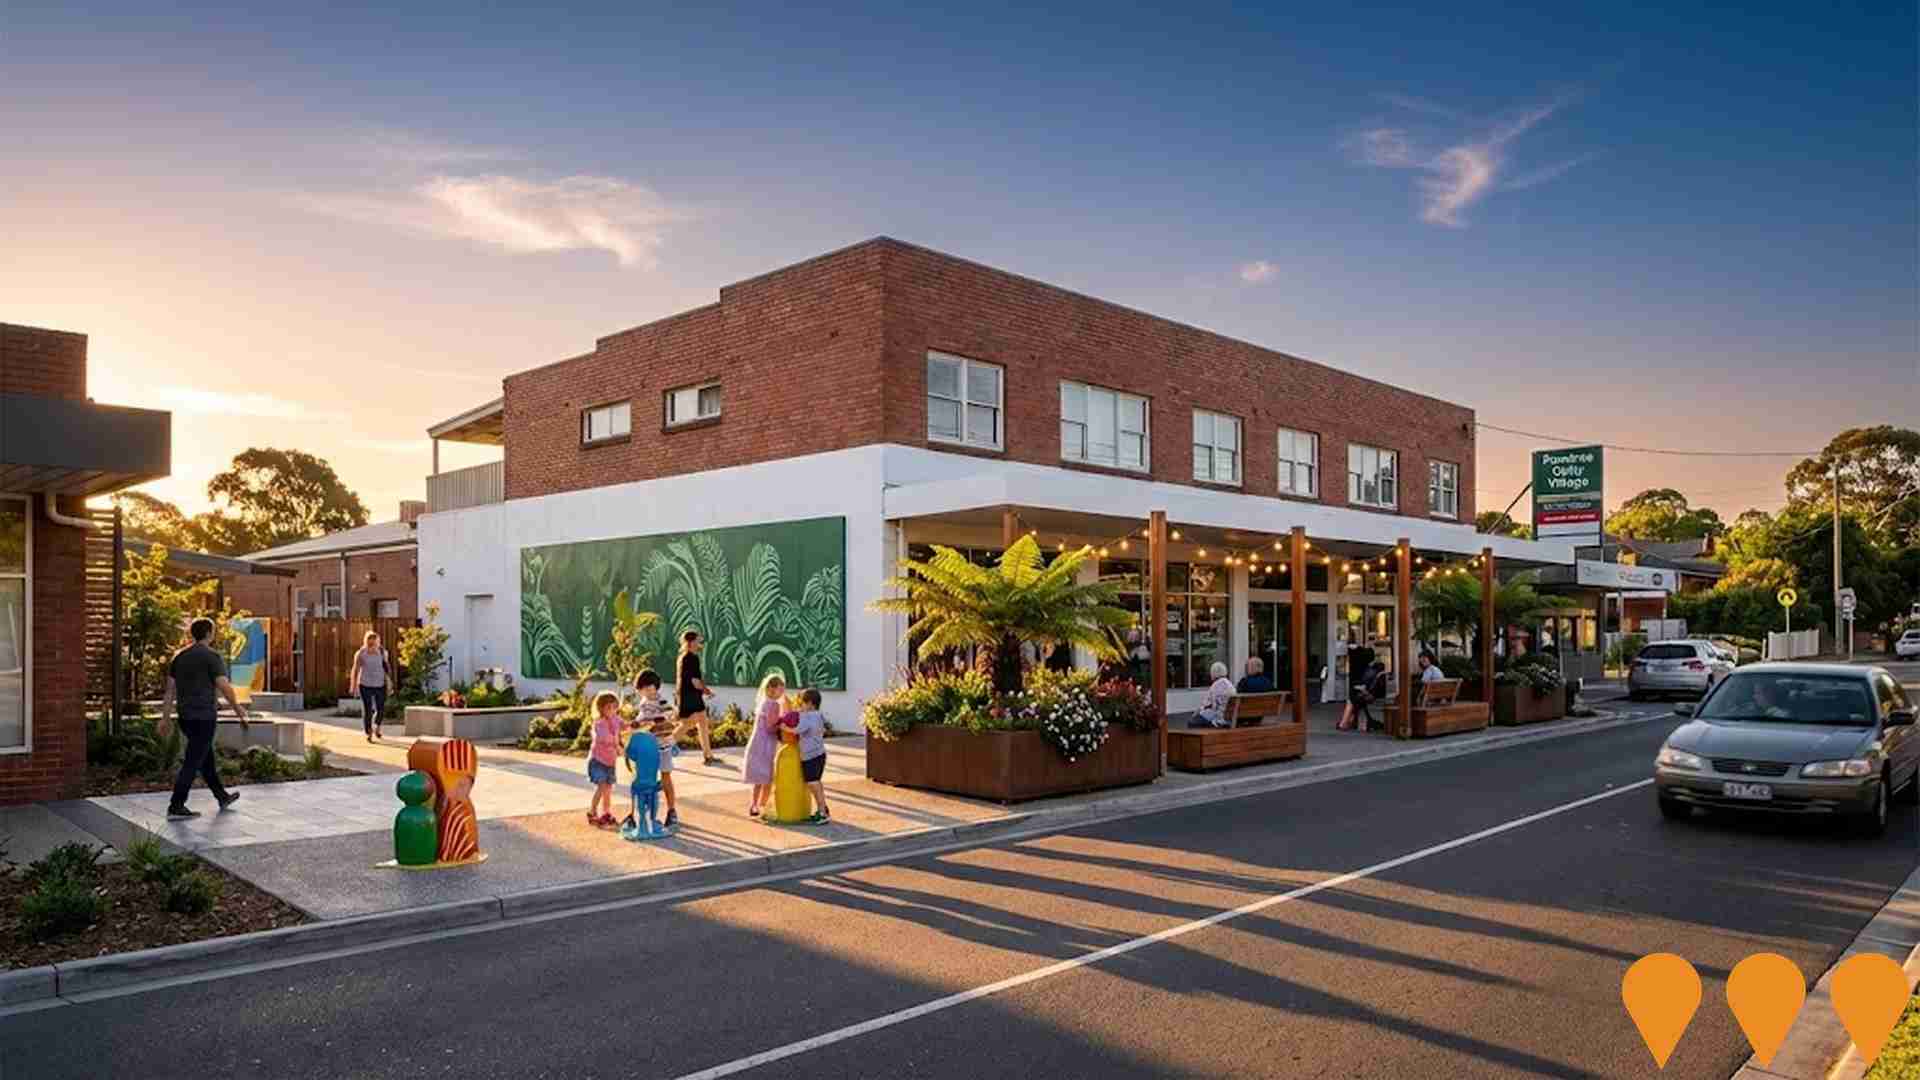
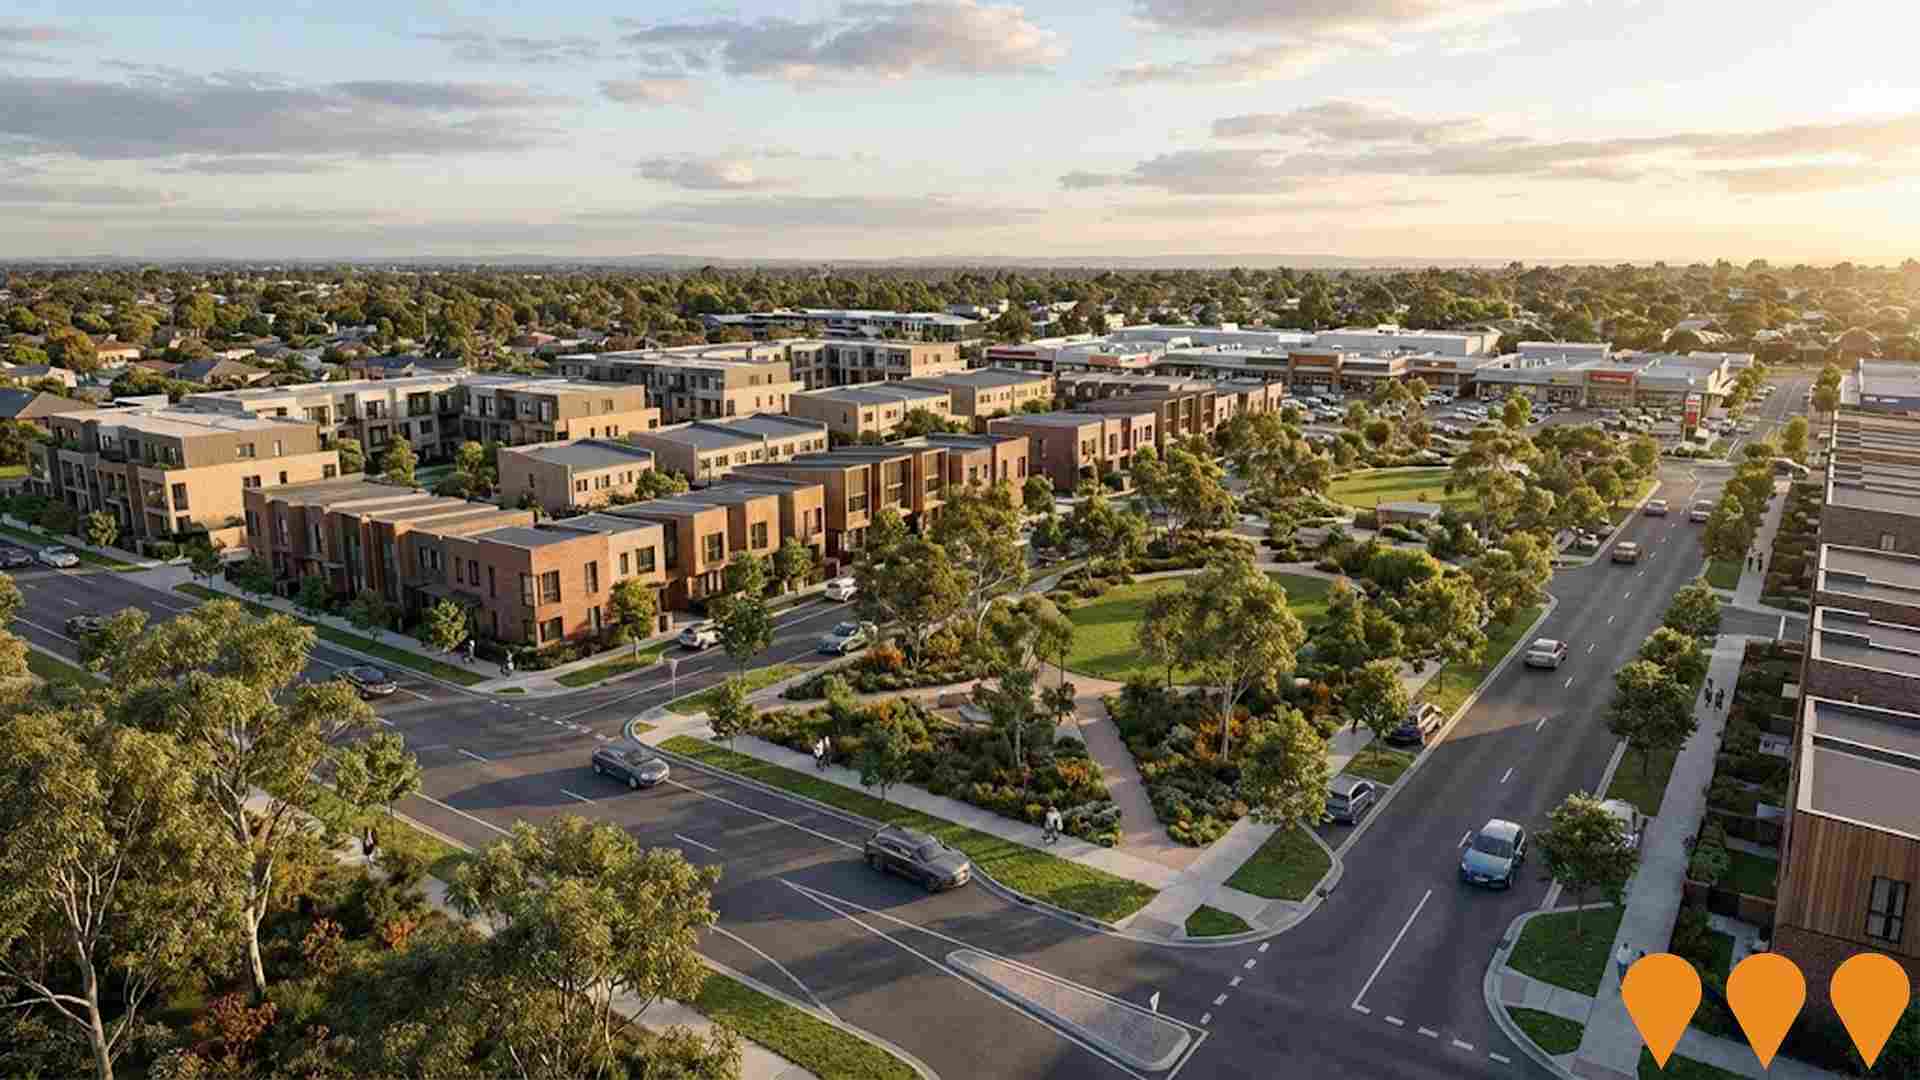
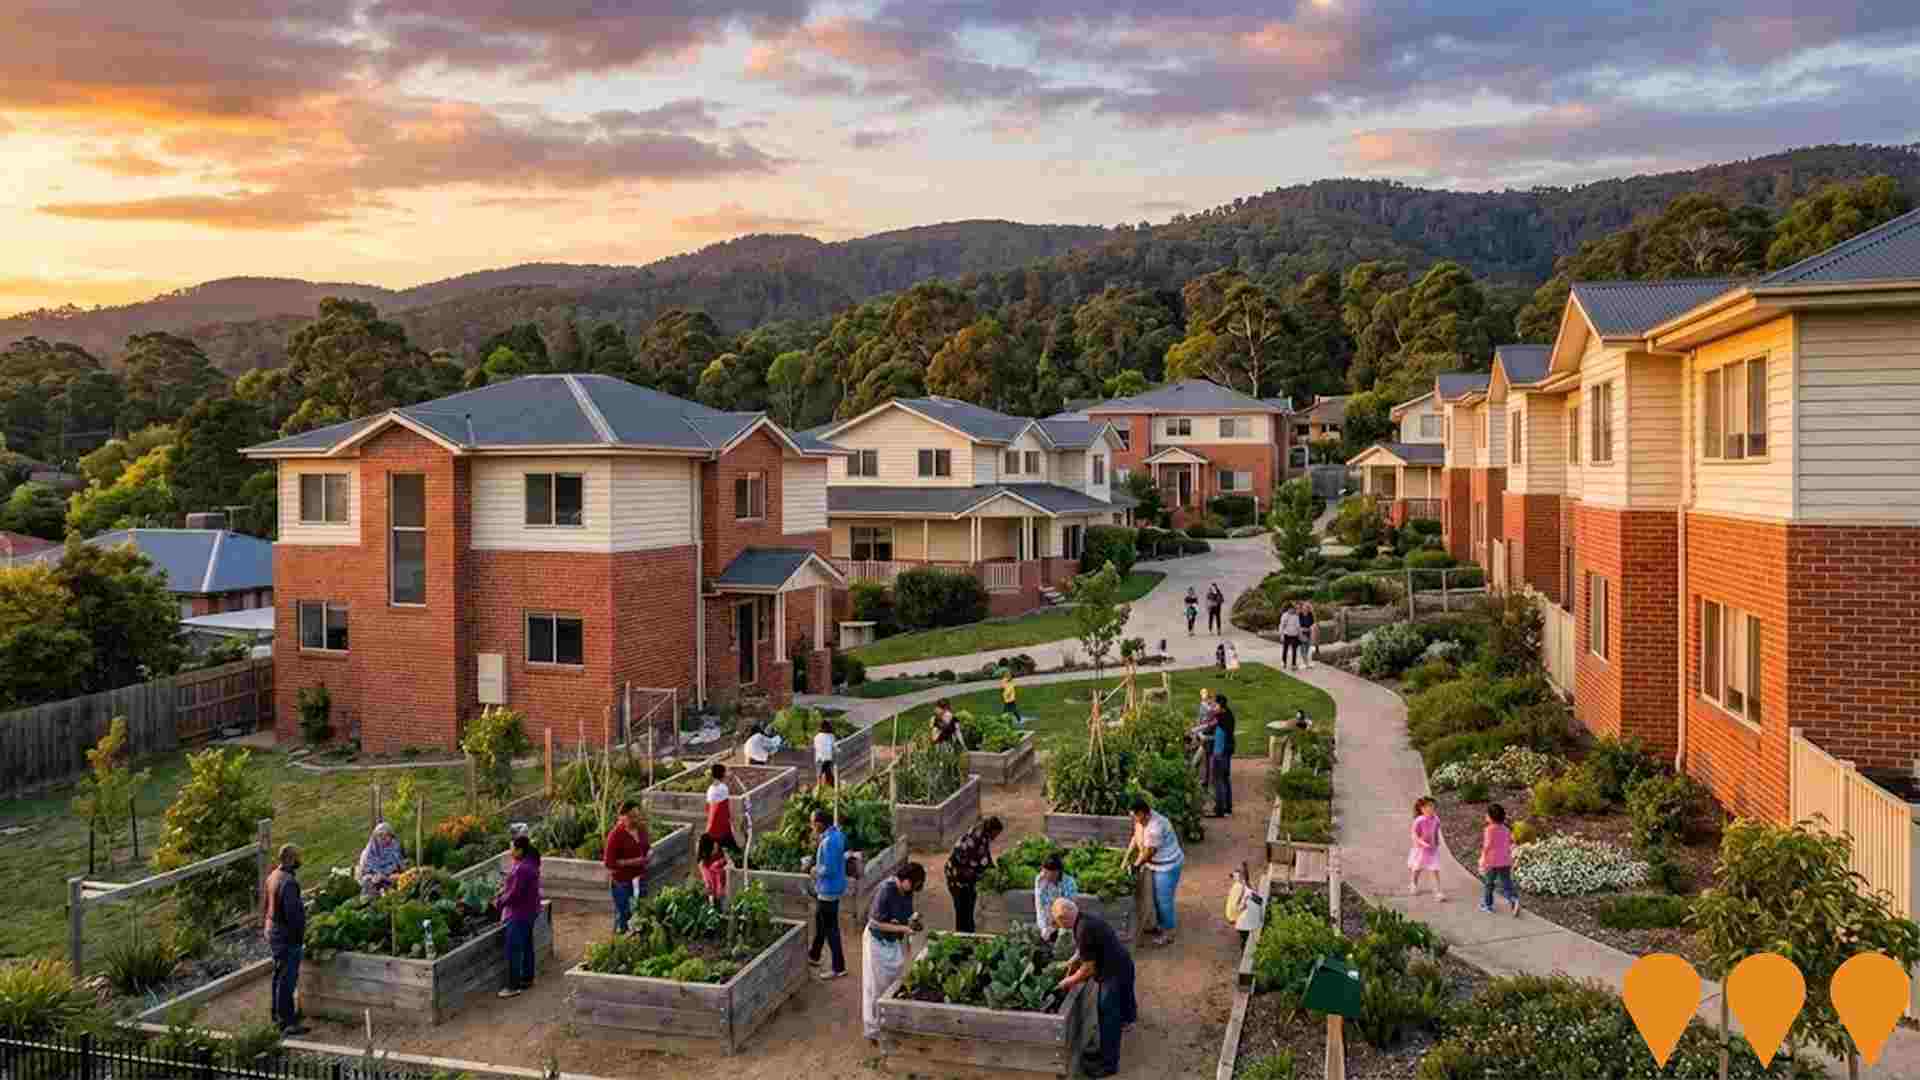
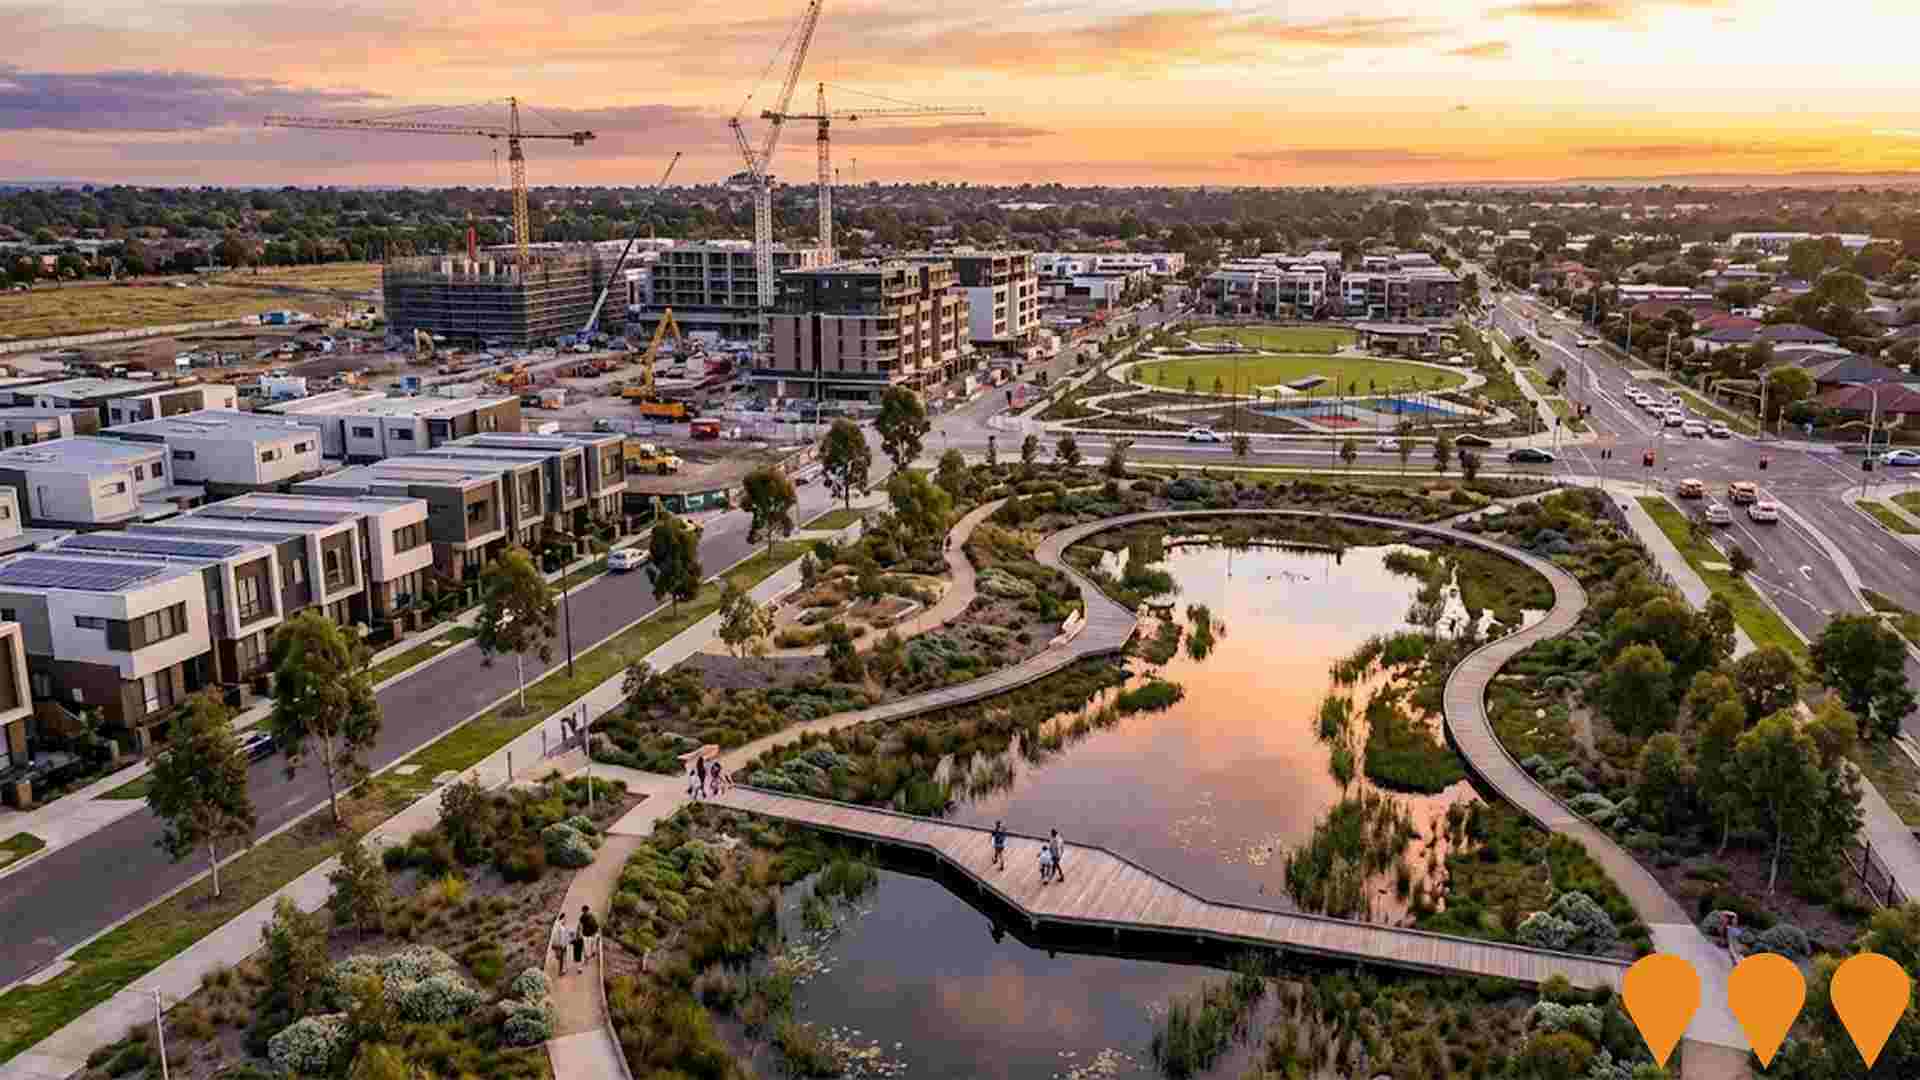
 Denotes AI-based impression for illustrative purposes only, not to be taken as definitive under any circumstances. Please follow links and conduct other investigations from the project's source for actual imagery. Developers and project owners wishing us to use original imagery please Contact Us and we will do so.
Frequently Asked Questions - Infrastructure
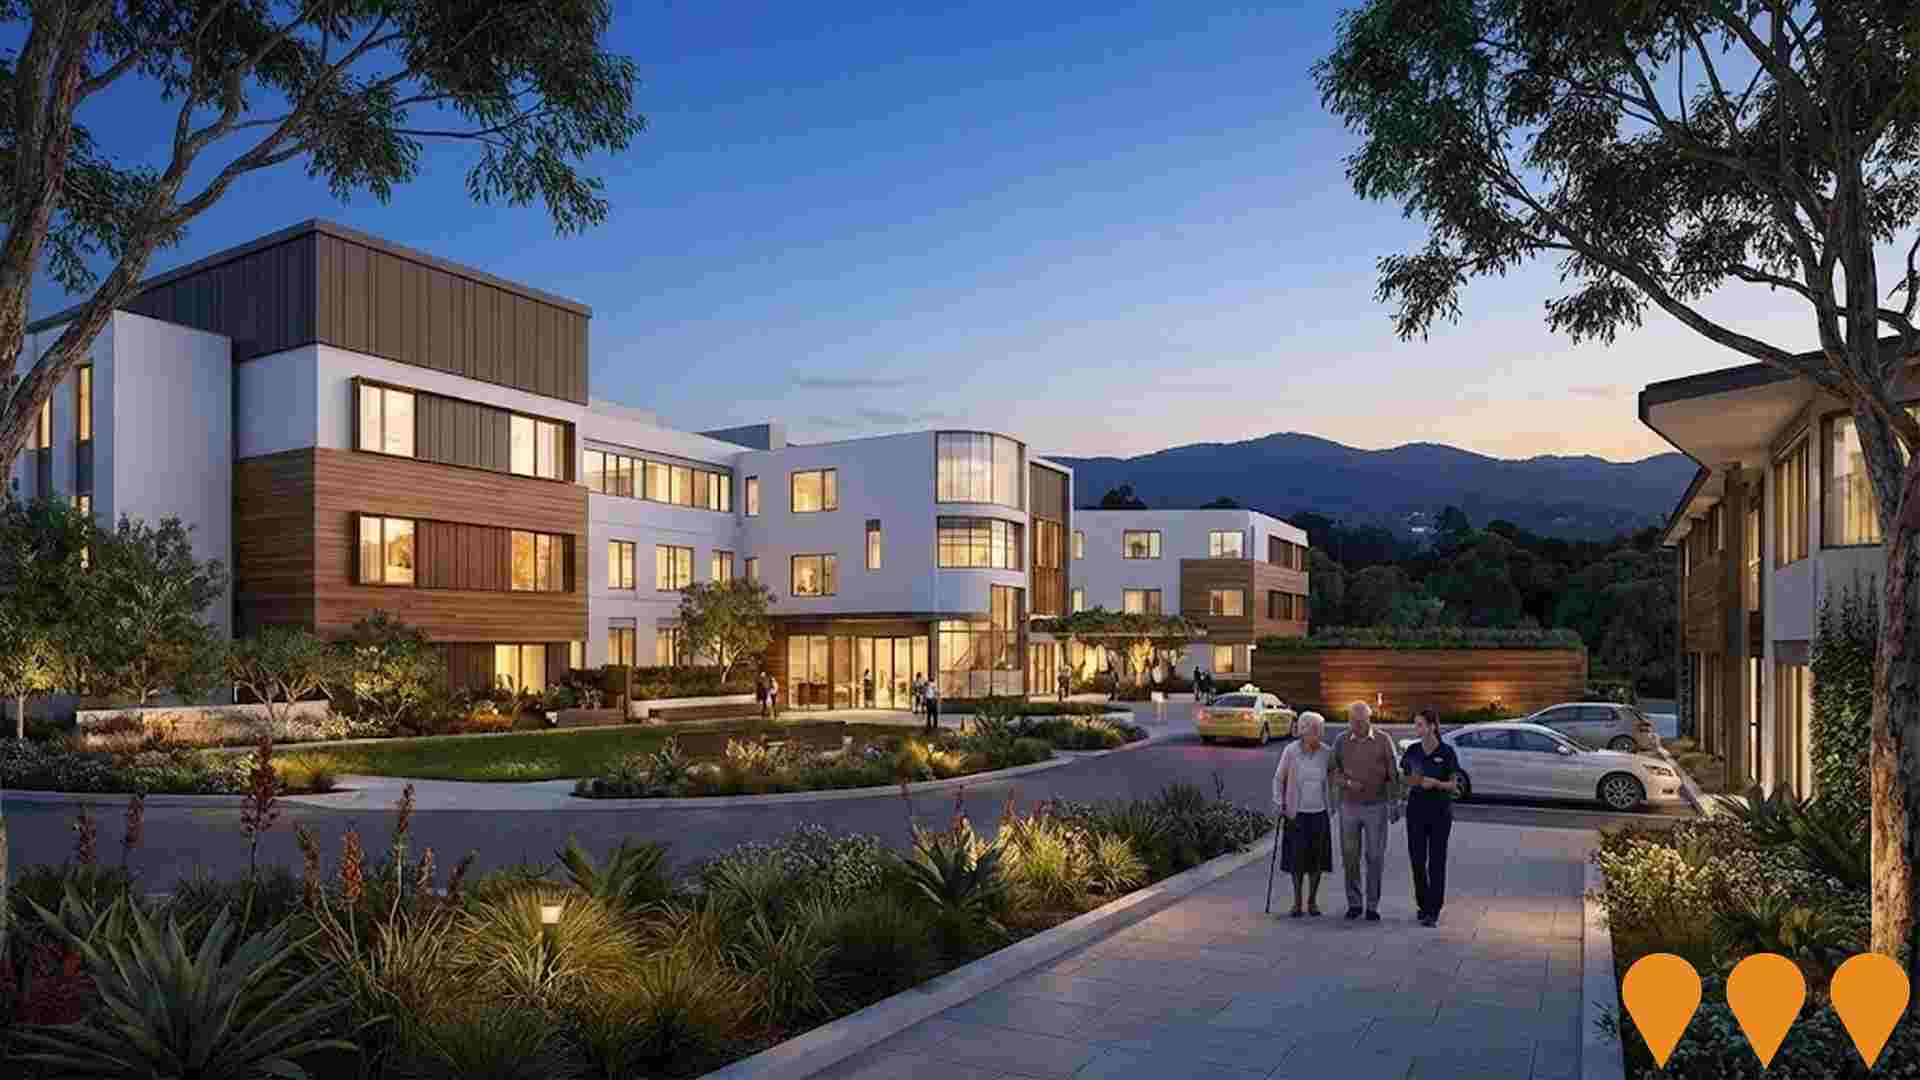
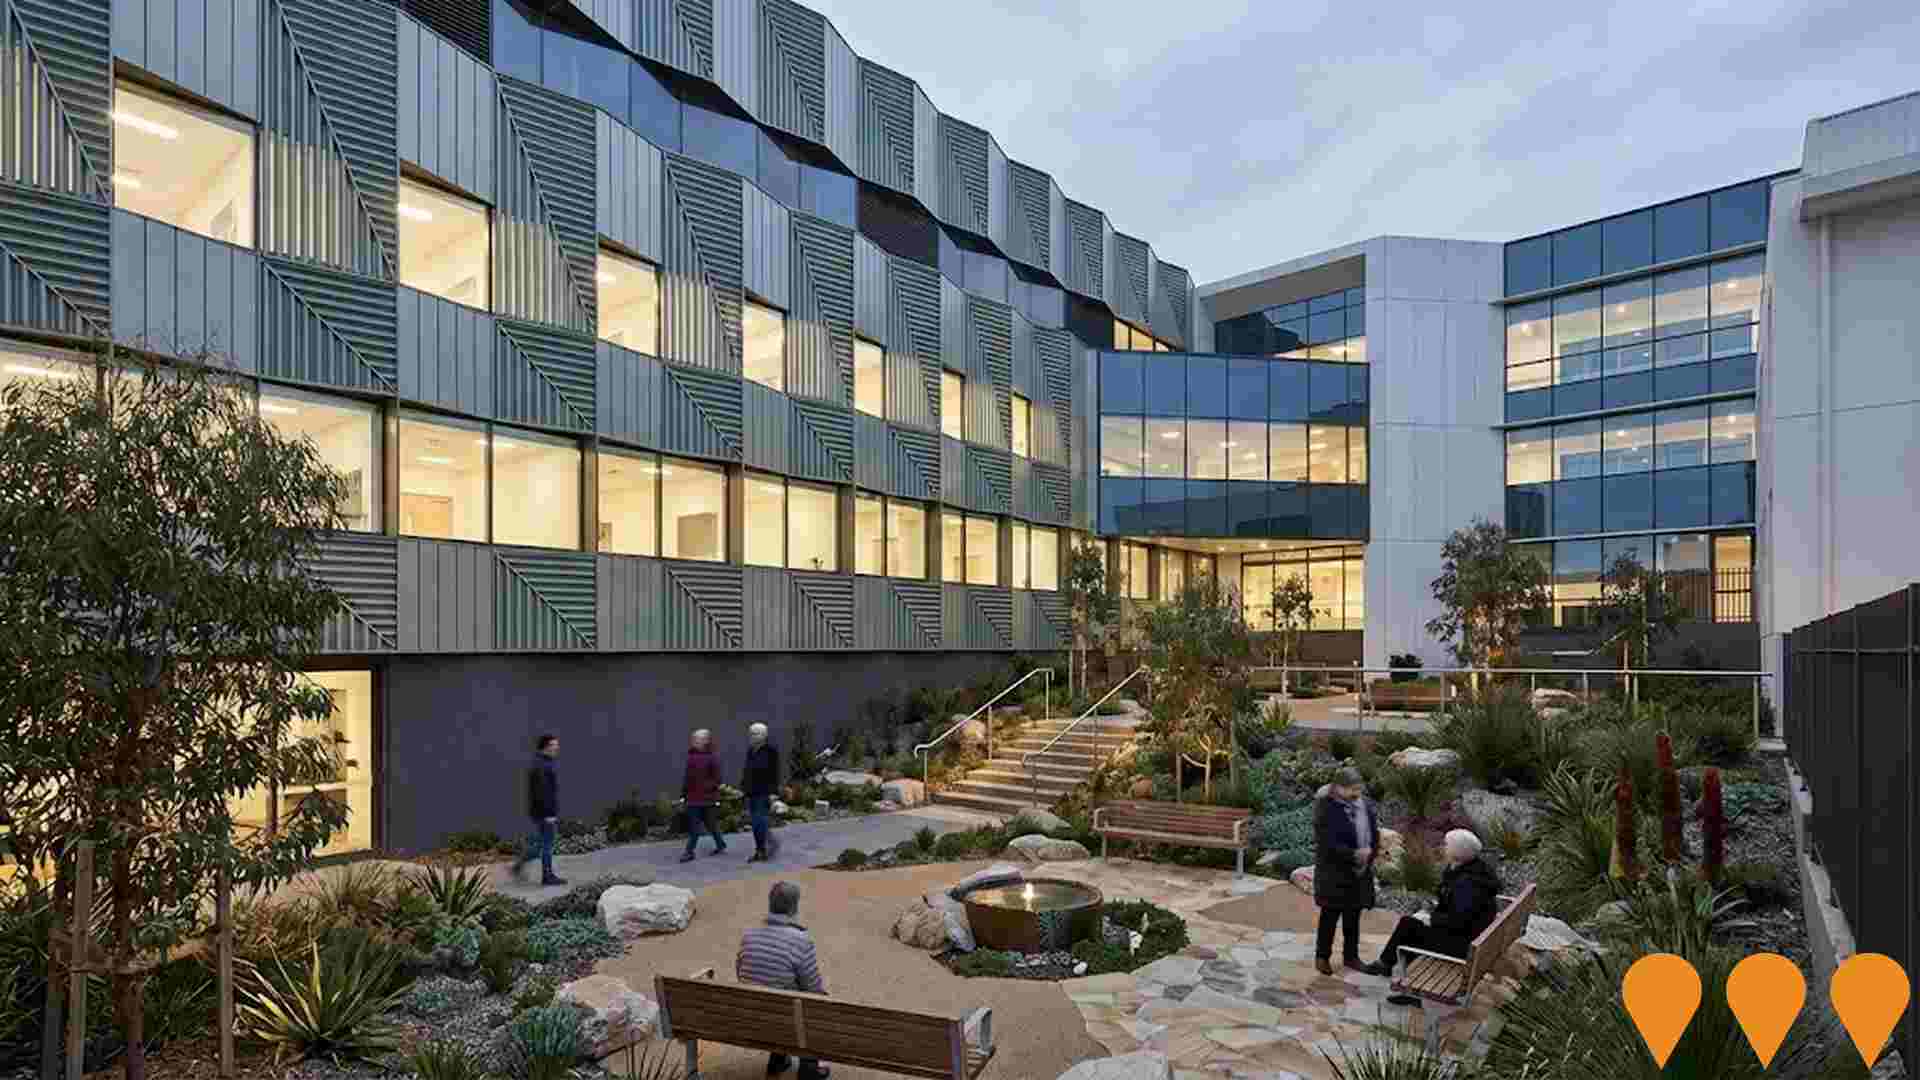
Angliss Hospital Expansion
Major redevelopment of Angliss Hospital including a new four-storey tower with a 32-bed inpatient unit, four new operating theatres, a new central sterile supply department, expanded outpatient services and a new main entrance. The all-electric expansion will increase surgical capacity and support growing healthcare demand in Melbourne's outer east.
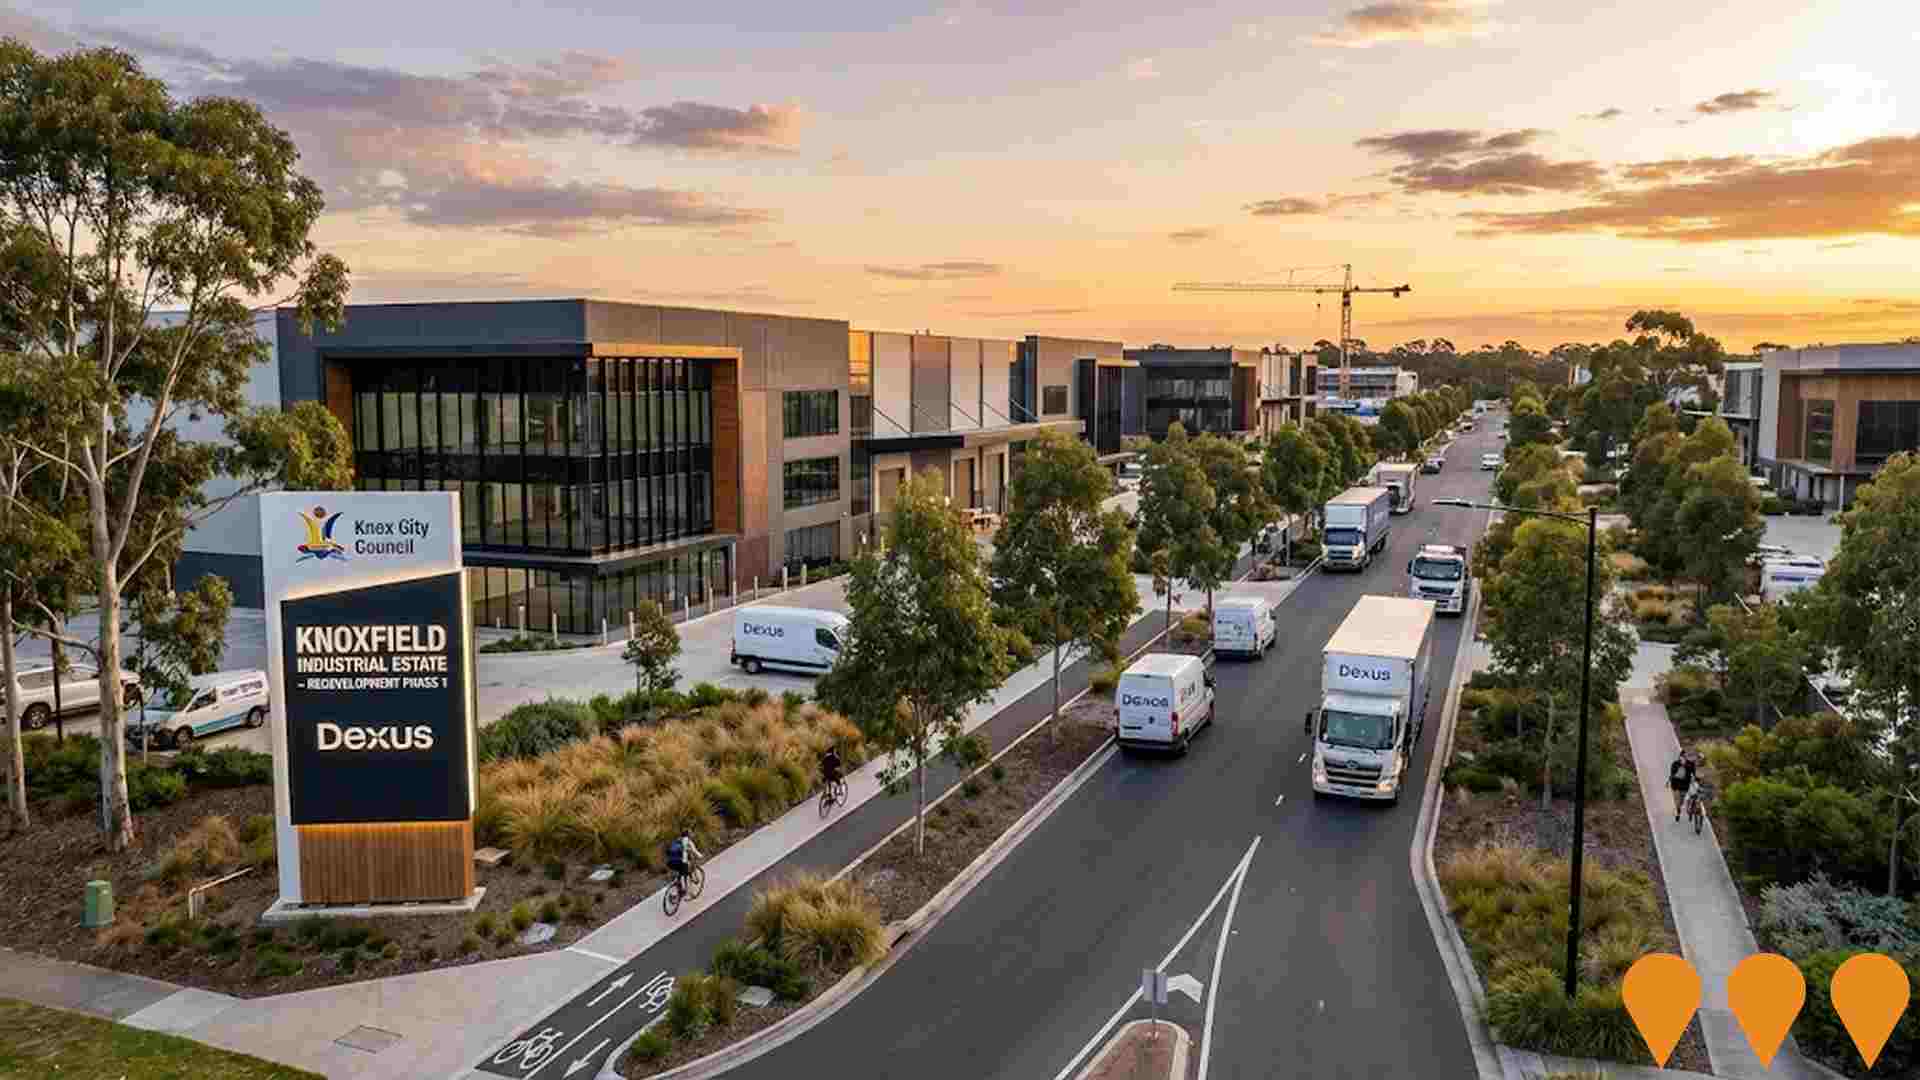
Knoxfield Industrial Estate Redevelopment
Strategic long term plan to reposition the existing Knoxfield Industrial Estate at 20 Henderson Road into a higher amenity industrial and logistics precinct, with upgraded road access, internal circulation and infrastructure. The estate currently operates as a large distribution focused industrial park while Knox City Council and private sector partners progress planning and staging options for future redevelopment.
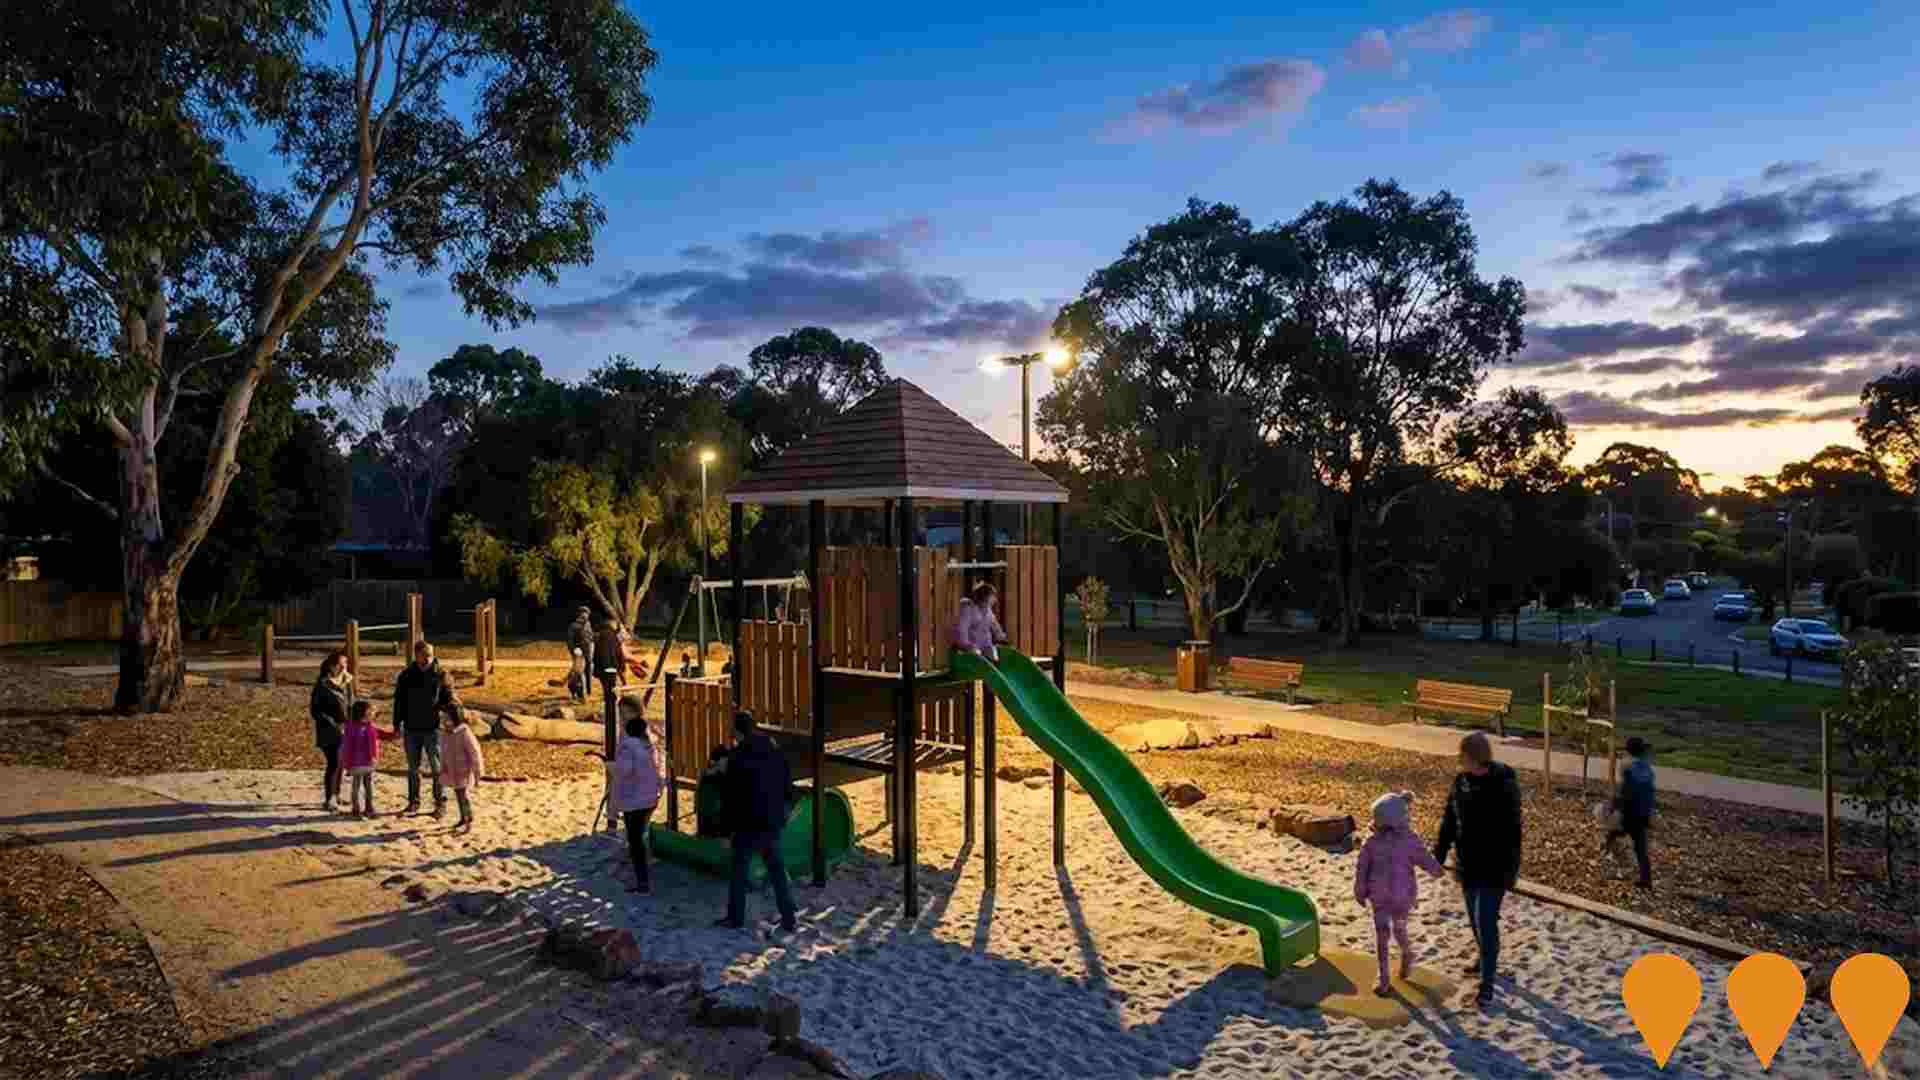
Ferntree Gully Village Creative Placemaking Plan
Community-driven arts and cultural development project transforming public spaces in Ferntree Gully Village through murals, sculptures, lightbox galleries, and parklet upgrades to enhance safety, community connection, and local pride.
Scoresby Village Residential Estate
Large master planned residential community in Scoresby delivering more than 450 new dwellings in a mix of townhouses and apartments, with internal streets, pocket parks and integrated community open space directly adjoining the Knoxfield activity area and Scoresby Village shopping precinct.
Ferntree Gully Community Housing
A 79-unit medium density development consisting of 41 one-bedroom units, 38 two-bedroom units, and 6 three-bedroom units, located on the site of the old Ferntree Gully Primary School. Part of the Nation Building and Economic Stimulus Project, jointly funded by Federal and State Governments. Residents are involved in a community vegetable garden and linked with local community activities through partnerships with Mountain District Learning Centre.
Knoxfield Development Victoria Project
Development Victoria project delivering approximately 400 homes across 2-4 bedroom dwellings in Knoxfield on former DELWP horticultural research facility site. Features vibrant new neighbourhood with diverse housing, enhanced wetland area replacing structurally unsound existing dam, public open spaces, recreational facilities and mixed-use precinct. Up to 10% affordable housing commitment. Targets Green Star Communities rating with world-class sustainability practices. Construction commenced mid-2025 with housing sales beginning late 2025, signalized intersection at Scoresby Road planned.
Burwood Highway-McMahons Road Intersection Upgrade
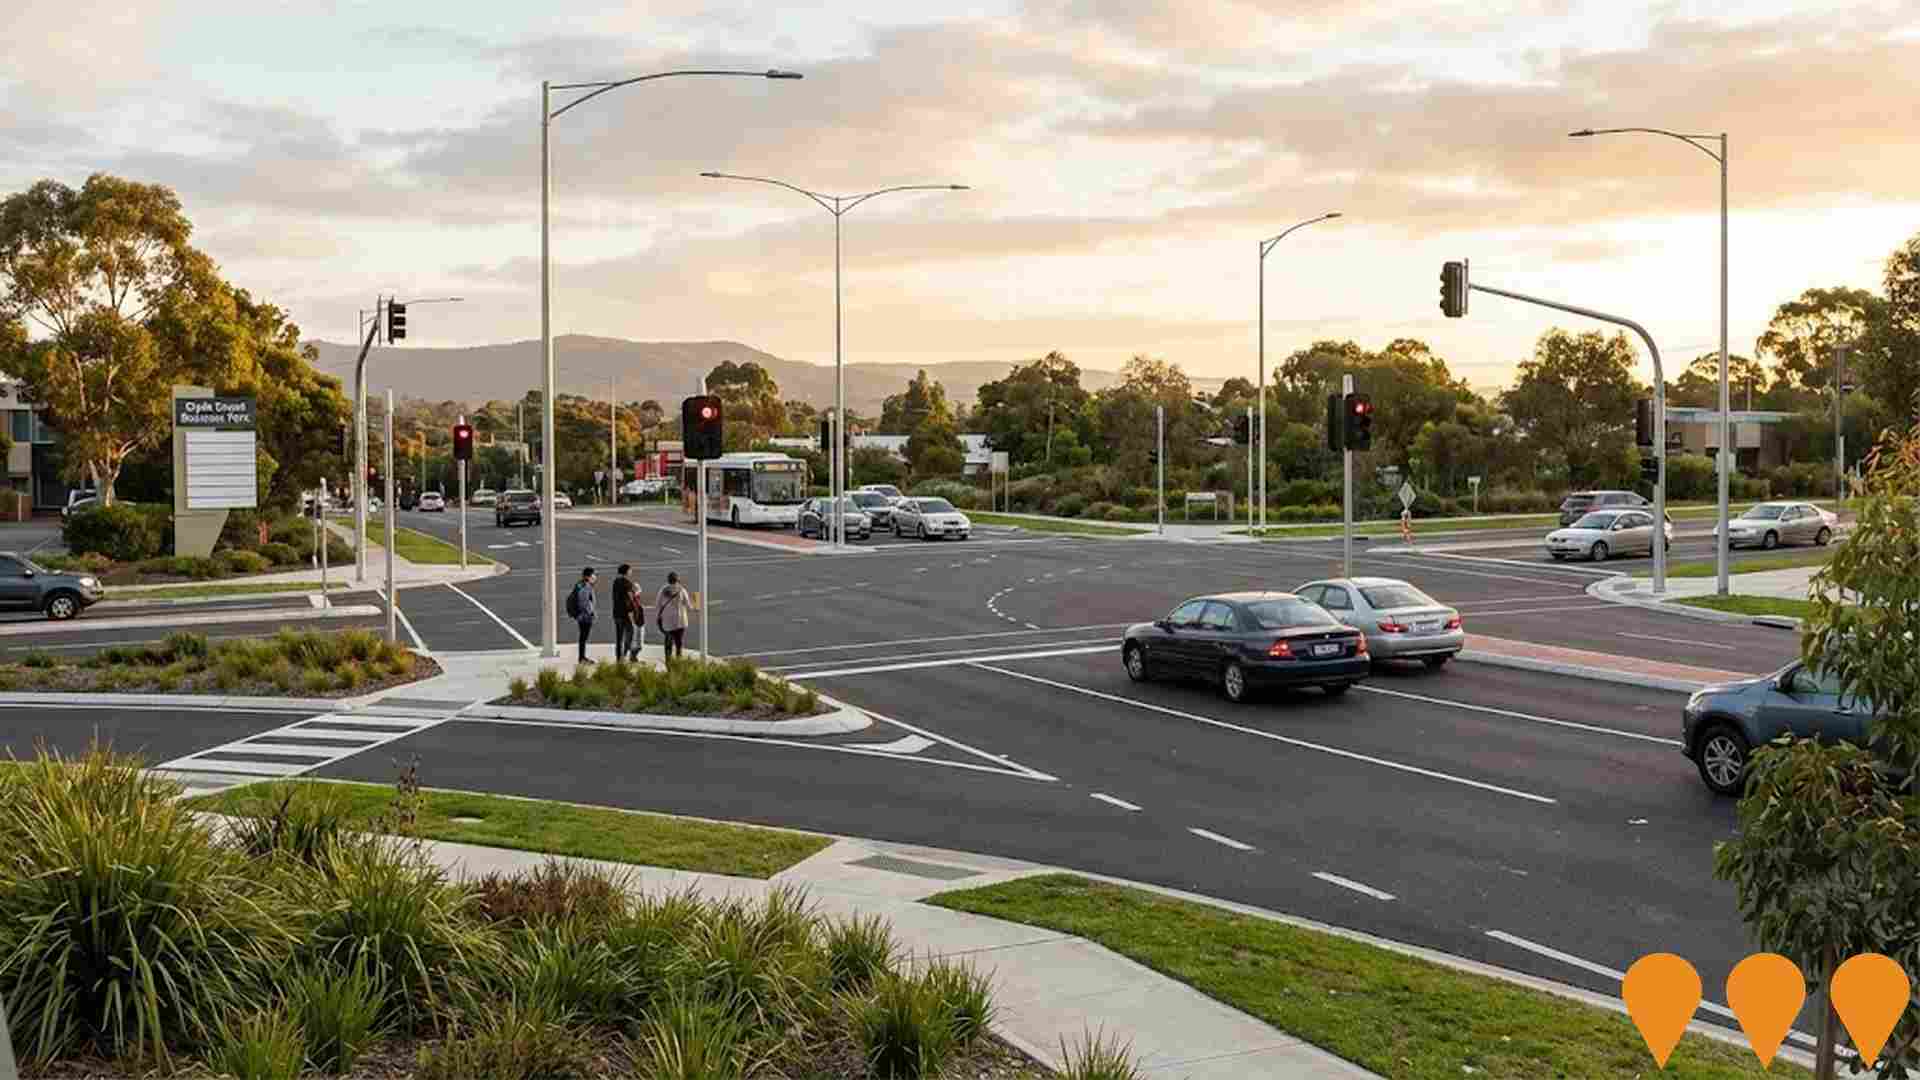
Upgraded intersection at Burwood Highway, McMahons Road and Clyde Street in Ferntree Gully completed in 2024. Includes extra lanes in each direction on Burwood Highway, new traffic lights with dedicated pedestrian crossings, more street lights, dedicated right turn lanes, shared left turn and through lanes, and a dedicated left turn lane into Clyde Street with improved business access. Improves safety, reduces crashes, and enhances traffic flow.
Kings Park Masterplan
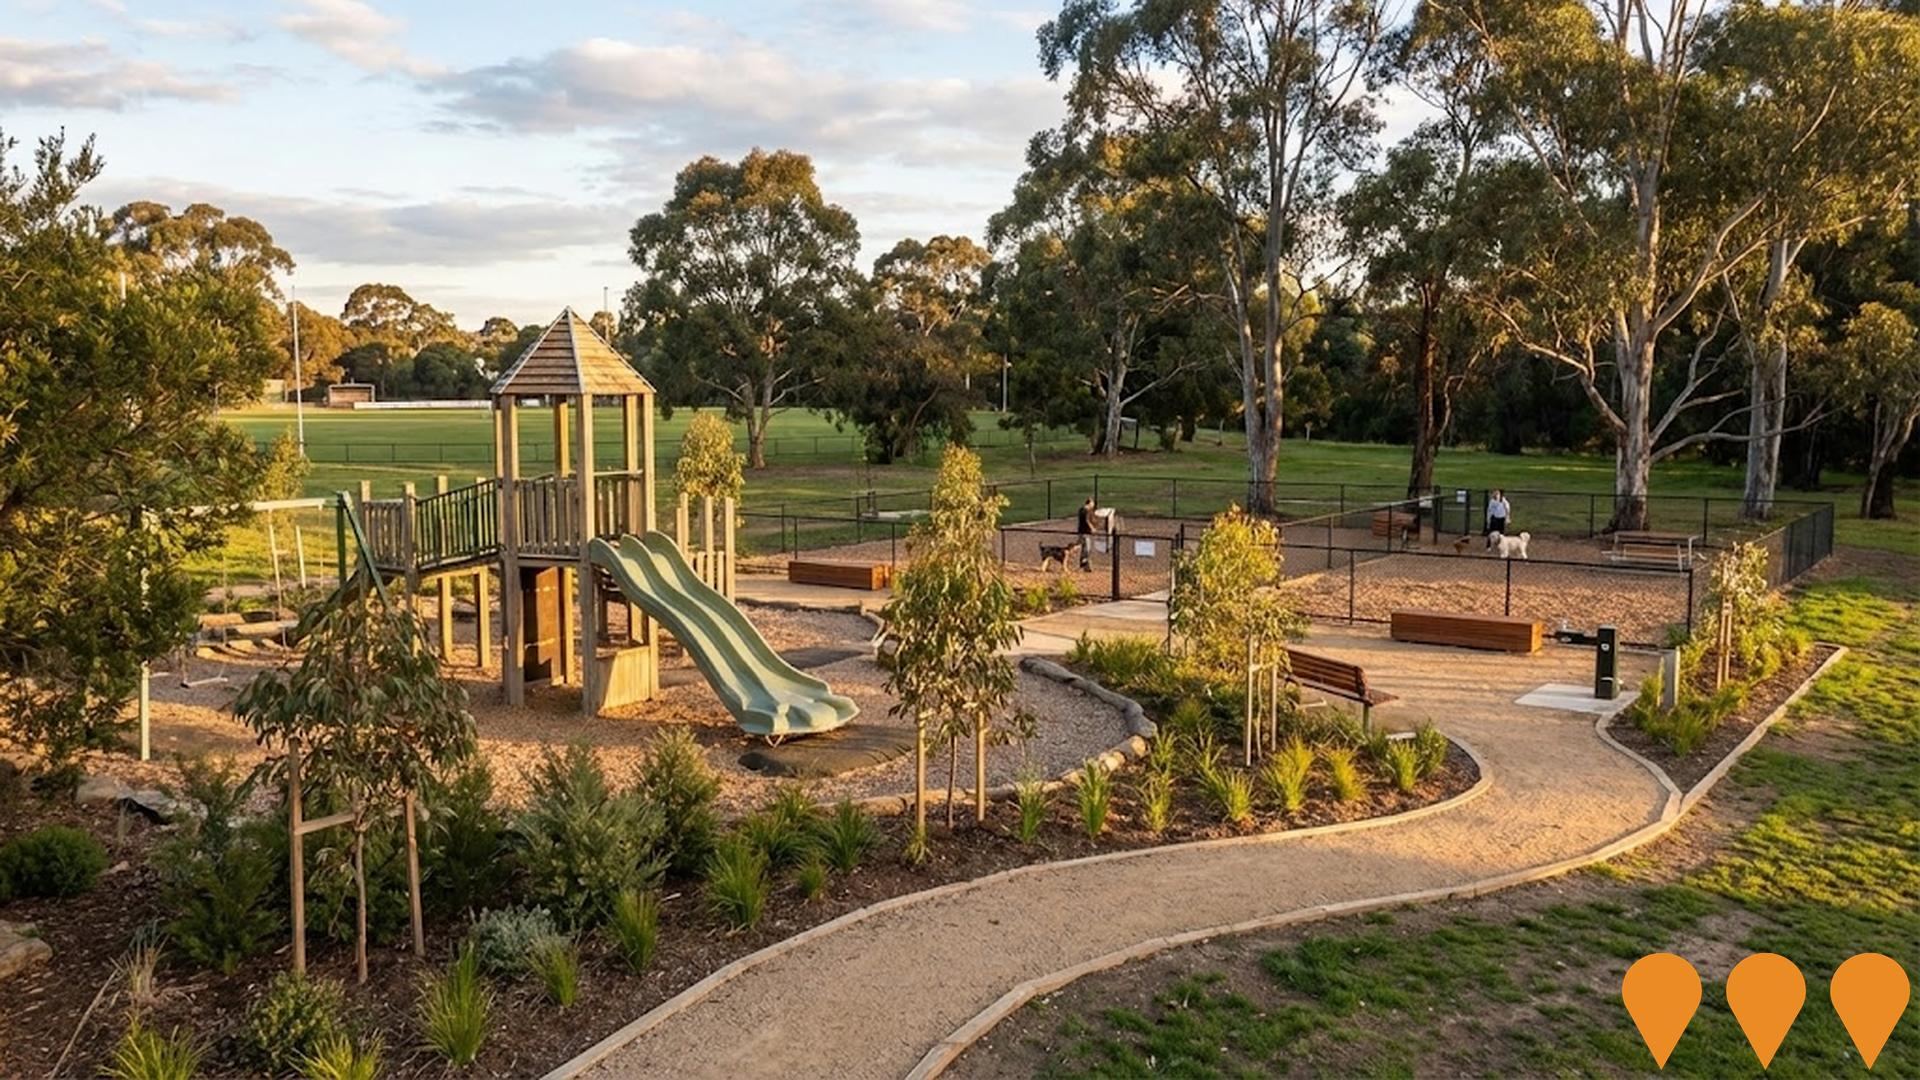
Knox City Councils long term plan to guide upgrades at Kings Park, a major local sports and recreation hub. Stage 1 is a new fenced dog park with two separate off leash areas, path circuits, seating, picnic facilities, drinking fountain and improved drainage. Council indicates construction commenced May 2025 with completion anticipated October 2025. Future projects in the masterplan remain subject to feasibility, community engagement and annual budget processes.
Employment
AreaSearch analysis indicates Ferntree Gully (South) - Upper Ferntree Gully maintains employment conditions that align with national benchmarks
Ferntree Gully (South) - Upper Ferntree Gully has a skilled workforce with notable representation in the construction sector. The unemployment rate was 4.0% as of September 2025, lower than Greater Melbourne's rate of 4.7%.
Employment growth over the past year was estimated at 1.1%. As of September 2025, 8,641 residents were in work, with a workforce participation rate of 66.9%, slightly higher than Greater Melbourne's rate of 64.1%. Leading employment industries among residents include health care & social assistance, construction, and retail trade. The area shows strong specialization in construction, with an employment share 1.3 times the regional level.
However, professional & technical services have lower representation at 7.6% compared to the regional average of 10.1%. Over the 12 months to September 2025, employment increased by 1.1%, while labour force increased by 0.7%, leading to a fall in unemployment by 0.5 percentage points. In comparison, Greater Melbourne recorded employment growth of 3.0% and unemployment rose by 0.3 percentage points. State-level data from 25-Nov shows Victoria's employment grew by 1.13% year-on-year, with the state unemployment rate at 4.7%. National employment forecasts suggest a 6.6% increase over five years and 13.7% over ten years. Applying these projections to Ferntree Gully (South) - Upper Ferntree Gully's employment mix indicates local employment should increase by 6.4% over five years and 13.3% over ten years.
Frequently Asked Questions - Employment
Income
Income analysis reveals strong economic positioning, with the area outperforming 60% of locations assessed nationally by AreaSearch
AreaSearch's latest postcode level ATO data for financial year 2022 shows that income in Ferntree Gully (South) - Upper Ferntree Gully SA2 is slightly above average nationally. The median income is $53,525 and the average income stands at $66,129. This contrasts with Greater Melbourne's figures of a median income of $54,892 and an average income of $73,761. Based on Wage Price Index growth of 12.16% since financial year 2022, current estimates for Ferntree Gully (South) - Upper Ferntree Gully would be approximately $60,034 (median) and $74,170 (average) as of September 2025. Census 2021 income data shows that household, family and personal incomes in Ferntree Gully (South) - Upper Ferntree Gully cluster around the 56th percentile nationally. Income brackets indicate that the $1,500 - 2,999 earnings band captures 36.1% of the community (5,738 individuals), aligning with the metropolitan region where this cohort likewise represents 32.8%. After housing, 85.6% of income remains for other expenses and the area's SEIFA income ranking places it in the 6th decile.
Frequently Asked Questions - Income
Housing
Ferntree Gully (South) - Upper Ferntree Gully is characterized by a predominantly suburban housing profile, with ownership patterns similar to the broader region
Ferntree Gully (South) - Upper Ferntree Gully had 92.4% houses and 7.7% other dwellings in the latest Census, compared to Melbourne metro's 83.4% houses and 16.7% other dwellings. Home ownership was 35.3%, with mortgaged dwellings at 46.6% and rented ones at 18.1%. The median monthly mortgage repayment was $1,950, below Melbourne metro's $2,000. Median weekly rent was $405, compared to Melbourne metro's $400. Nationally, mortgage repayments were higher at $1,863 and rents exceeded the national figure of $375.
Frequently Asked Questions - Housing
Household Composition
Ferntree Gully (South) - Upper Ferntree Gully features high concentrations of family households, with a fairly typical median household size
Family households account for 77.8% of all households, including 38.6% couples with children, 25.6% couples without children, and 12.5% single parent families. Non-family households constitute the remaining 22.2%, with lone person households at 19.6% and group households comprising 2.5% of the total. The median household size is 2.7 people, which aligns with the Greater Melbourne average.
Frequently Asked Questions - Households
Local Schools & Education
The educational profile of Ferntree Gully (South) - Upper Ferntree Gully exceeds national averages, with above-average qualification levels and academic performance metrics
The area's university qualification rate is 26.1%, significantly lower than Greater Melbourne's average of 37.0%. Bachelor degrees are the most common at 17.5%, followed by postgraduate qualifications (5.7%) and graduate diplomas (2.9%). Vocational credentials are prevalent, with 36.1% of residents aged 15+ holding them - advanced diplomas at 12.4% and certificates at 23.7%. Educational participation is high, with 27.3% currently enrolled in formal education: 8.7% in primary, 7.6% in secondary, and 4.8% pursuing tertiary education.
Educational participation is notably high, with 27.3% of residents currently enrolled in formal education. This includes 8.7% in primary education, 7.6% in secondary education, and 4.8% pursuing tertiary education.
Frequently Asked Questions - Education
Schools Detail
Nearby Services & Amenities
Transport
Transport servicing is good compared to other areas nationally based on assessment of service frequency, route connectivity and accessibility
Ferntree Gully (South) - Upper Ferntree Gully has 81 active public transport stops. These are a mix of train and bus services operated by 21 individual routes. Together, these routes provide 4707 weekly passenger trips.
The area's transport accessibility is rated as good, with residents typically located 277 meters from the nearest stop. Service frequency averages 672 trips per day across all routes, equating to approximately 58 weekly trips per individual stop.
Frequently Asked Questions - Transport
Transport Stops Detail
Health
Ferntree Gully (South) - Upper Ferntree Gully's residents are relatively healthy in comparison to broader Australia with common health conditions slightly more prevalent than average across both younger and older age cohorts
Ferntree Gully (South) - Upper Ferntree Gully's health metrics are close to national benchmarks.
Common health conditions are slightly more prevalent than average across both younger and older age cohorts, with a rate of private health cover at approximately 52% of the total population (~8,330 people), leading that of the average SA2 area. The most common medical conditions in the area were mental health issues and asthma, affecting 8.8 and 8.2% of residents respectively. 68.5% of residents declared themselves completely clear of medical ailments, compared to 69.4% across Greater Melbourne. The area has 18.1% of residents aged 65 and over (2,877 people), which is lower than the 19.5% in Greater Melbourne. This aligns broadly with the general population's health profile.
Frequently Asked Questions - Health
Cultural Diversity
The level of cultural diversity witnessed in Ferntree Gully (South) - Upper Ferntree Gully was found to be slightly above average when compared nationally for a number of language and cultural background related metrics
Ferntree Gully (South) - Upper Ferntree Gully had a higher cultural diversity than most local areas, with 26.1% of its population born overseas and 19.1% speaking a language other than English at home. Christianity was the predominant religion in this area, accounting for 43.4% of people. Buddhism, however, was more prevalent here compared to Greater Melbourne, comprising 3.1% versus 4.6%.
The top three ancestry groups were English (26.2%), Australian (24.7%), and Other (7.9%). Notably, Dutch ethnicity was slightly overrepresented at 2.2%, while Sri Lankan was at 1.1% and Hungarian at 0.4%.
Frequently Asked Questions - Diversity
Age
Ferntree Gully (South) - Upper Ferntree Gully's population aligns closely with national norms in age terms
Ferntree Gully (South) - Upper Ferntree Gully has a median age of 39 years, higher than Greater Melbourne's average of 37 years. This is close to the national average of 38 years. The 55-64 age group is notably over-represented locally at 12.9%, while the 25-34 age group is under-represented at 11.0%. Post-2021 Census data shows the 75 to 84 age group grew from 4.8% to 6.0% of the population, and the 25 to 34 cohort declined from 13.0% to 11.0%. Population forecasts for 2041 indicate significant demographic changes. The 75 to 84 age group is expected to grow by 45%, reaching 1,397 people from 960. Residents aged 65 and older will represent 81% of the anticipated growth. Conversely, the 25 to 34 and 15 to 24 age groups are expected to experience population declines.
