Chart Color Schemes
This analysis uses Suburbs and Localities (SAL) boundaries, which can materially differ from Statistical Areas (SA2) even when sharing the same name.
SAL boundaries are defined by Australia Post and the Australian Bureau of Statistics to represent commonly-known suburb names used in postal addresses.
Statistical Areas (SA2) are designed for census data collection and may combine multiple suburbs or use different geographic boundaries. For comprehensive analysis, consider reviewing both boundary types if available.
est. as @ -- *
2021 Census | -- people





Sales Activity


Curious about local property values? Filter the chart to assess the volume and appreciation (including resales) trends and regional comparisons, or scroll to the map below view this information at an individual property level.
Find a Recent Sale

Sales Detail
Population
An assessment of population growth drivers in Humpty Doo reveals an overall ranking slightly below national averages considering recent, and medium term trends
Analysis of ABS demographic updates for the wider region, alongside new addresses validated by AreaSearch since the Census, indicates the population of the suburb of Humpty Doo is estimated to be approximately 4,915 as of May 2026. This represents an addition of 602 people (14.0%) compared to the 2021 Census, which documented a population of 4,313 people. This shift is calculated from the resident population of 4,915, which AreaSearch estimated using the latest ERP data release from the ABS (June 2025) and a further 26 validated new addresses since the Census date. Such a population size results in a density ratio of 68 persons per square kilometer, offering substantial space per individual and potential scope for subsequent growth. The 14.0% growth rate in the suburb of Humpty Doo since the 2021 census outpaced the national average (9.3%) as well as the state, establishing it as a regional growth leader. Population expansion in the area was chiefly fueled by natural growth, which accounted for roughly 63.0% of the total population increase in recent times, though all other contributors, including overseas migration and interstate migration, remained positive.
AreaSearch incorporates ABS/Geoscience Australia projections for each SA2 region, published in 2024 with 2022 as the base year. For any SA2 regions lacking this data, and to project growth across all locations after 2032, AreaSearch uses growth rates by age cohort for each area from the latest Greater Capital Region projections (published by the ABS in 2023, based on 2022 data). Looking at future demographic trends, projections show an above-median population growth among Australian statistical areas, with the suburb of Humpty Doo expected to grow by 658 persons to 2041 based on compiled SA2-level projections, which represents an overall gain of 13.4% across the 16 years.
Frequently Asked Questions - Population
Development
AreaSearch analysis of residential development drivers sees Humpty Doo recording a relatively average level of approval activity when compared to local markets analysed countrywide
AreaSearch analysis of building approvals from the ABS, mapped from statistical area data, shows that Humpty Doo has averaged approximately 34 dwellings receiving development approval each year, culminating in an estimated 174 homes over the last 5 financial years. Thus far in FY-26, 19 approvals have been logged. With an average of 2.2 new residents added for each dwelling constructed over the past 5 financial years (from FY-21 to FY-25), suggesting solid demand that should underpin property values, new homes are being built at an average value of $380,000—slightly higher than the regional average—indicating a focus on quality builds. Furthermore, $4.8 million in commercial approvals have been registered during this financial year, highlighting the area's predominantly residential character.
In comparison to Greater Darwin, Humpty Doo registers 113.0% more development activity per capita, providing greater options for buyers, even though building activity has decelerated in recent times. Meanwhile, new construction has consisted entirely of detached houses, maintaining the area's low-density profile with a focus on detached homes that appeal to buyers seeking space. The estimate of 388 people in the area per dwelling approval highlights its quiet, low-intensity development climate.
Demographic forecasts point to Humpty Doo gaining 658 residents through to 2041 (starting from the latest quarterly estimate from AreaSearch). At current construction rates, the supply of new housing is expected to easily satisfy demand, creating favorable conditions for buyers and potentially underpinning growth beyond current population forecasts.
Frequently Asked Questions - Development
Development applications around Humpty Doo
Loading development applications…
| Lodged | Address | Description | Type | Distance | Status |
|---|
SOURCE: Planning portals and council registers, compiled by AreaSearch. Distance & bearing measured from the suburb midpoint.
Infrastructure
Humpty Doo has limited levels of nearby infrastructure activity, ranking in the 11thth percentile nationally
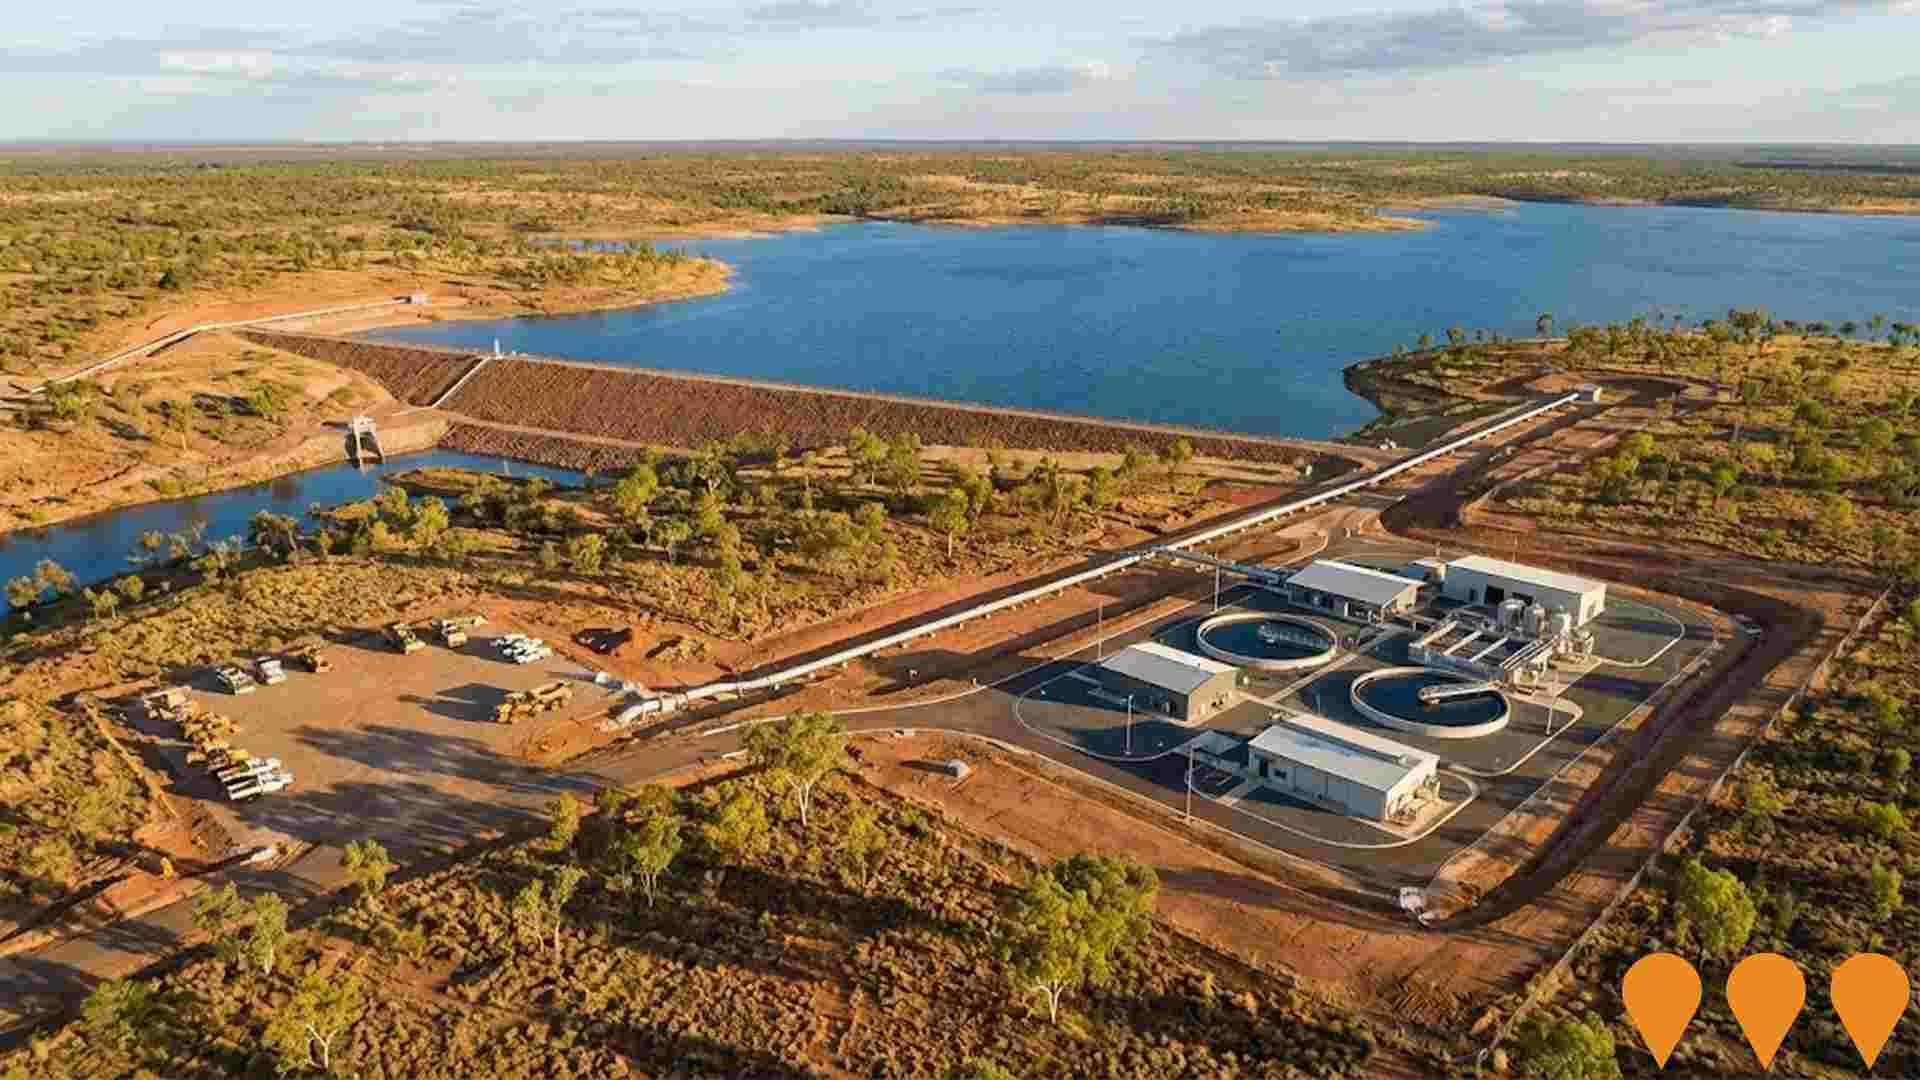
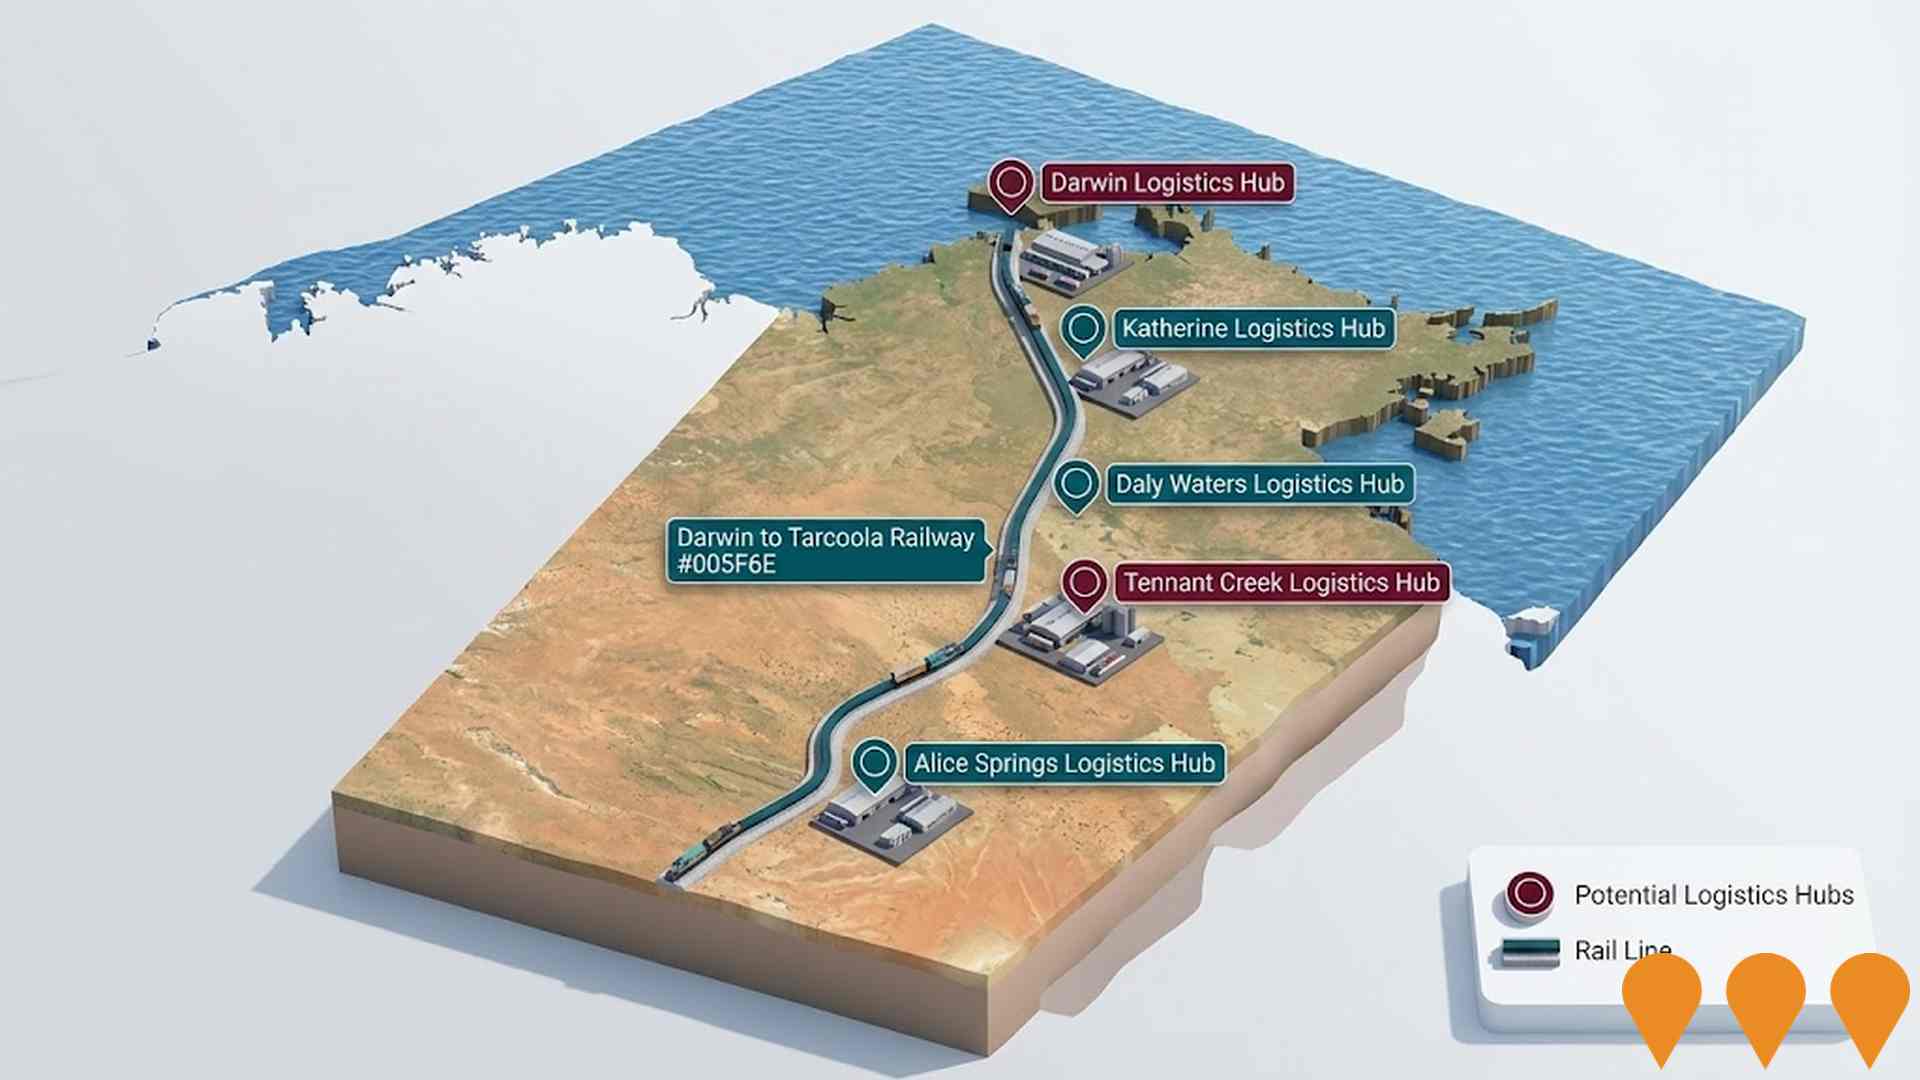
Local infrastructure updates, major projects, and planning changes have a powerful impact on area performance. In total, no projects have been identified by AreaSearch that are expected to influence the locality. Key initiatives include the Darwin Renewable Energy Hub, Darwin Corporate Park, Adelaide River Off-Stream Water Storage, and the Desert Springs Octopus Renewable Energy Program, with the details of those most relevant outlined below.
Professional plan users can use the search below to filter and access additional projects.
INFRASTRUCTURE SEARCH
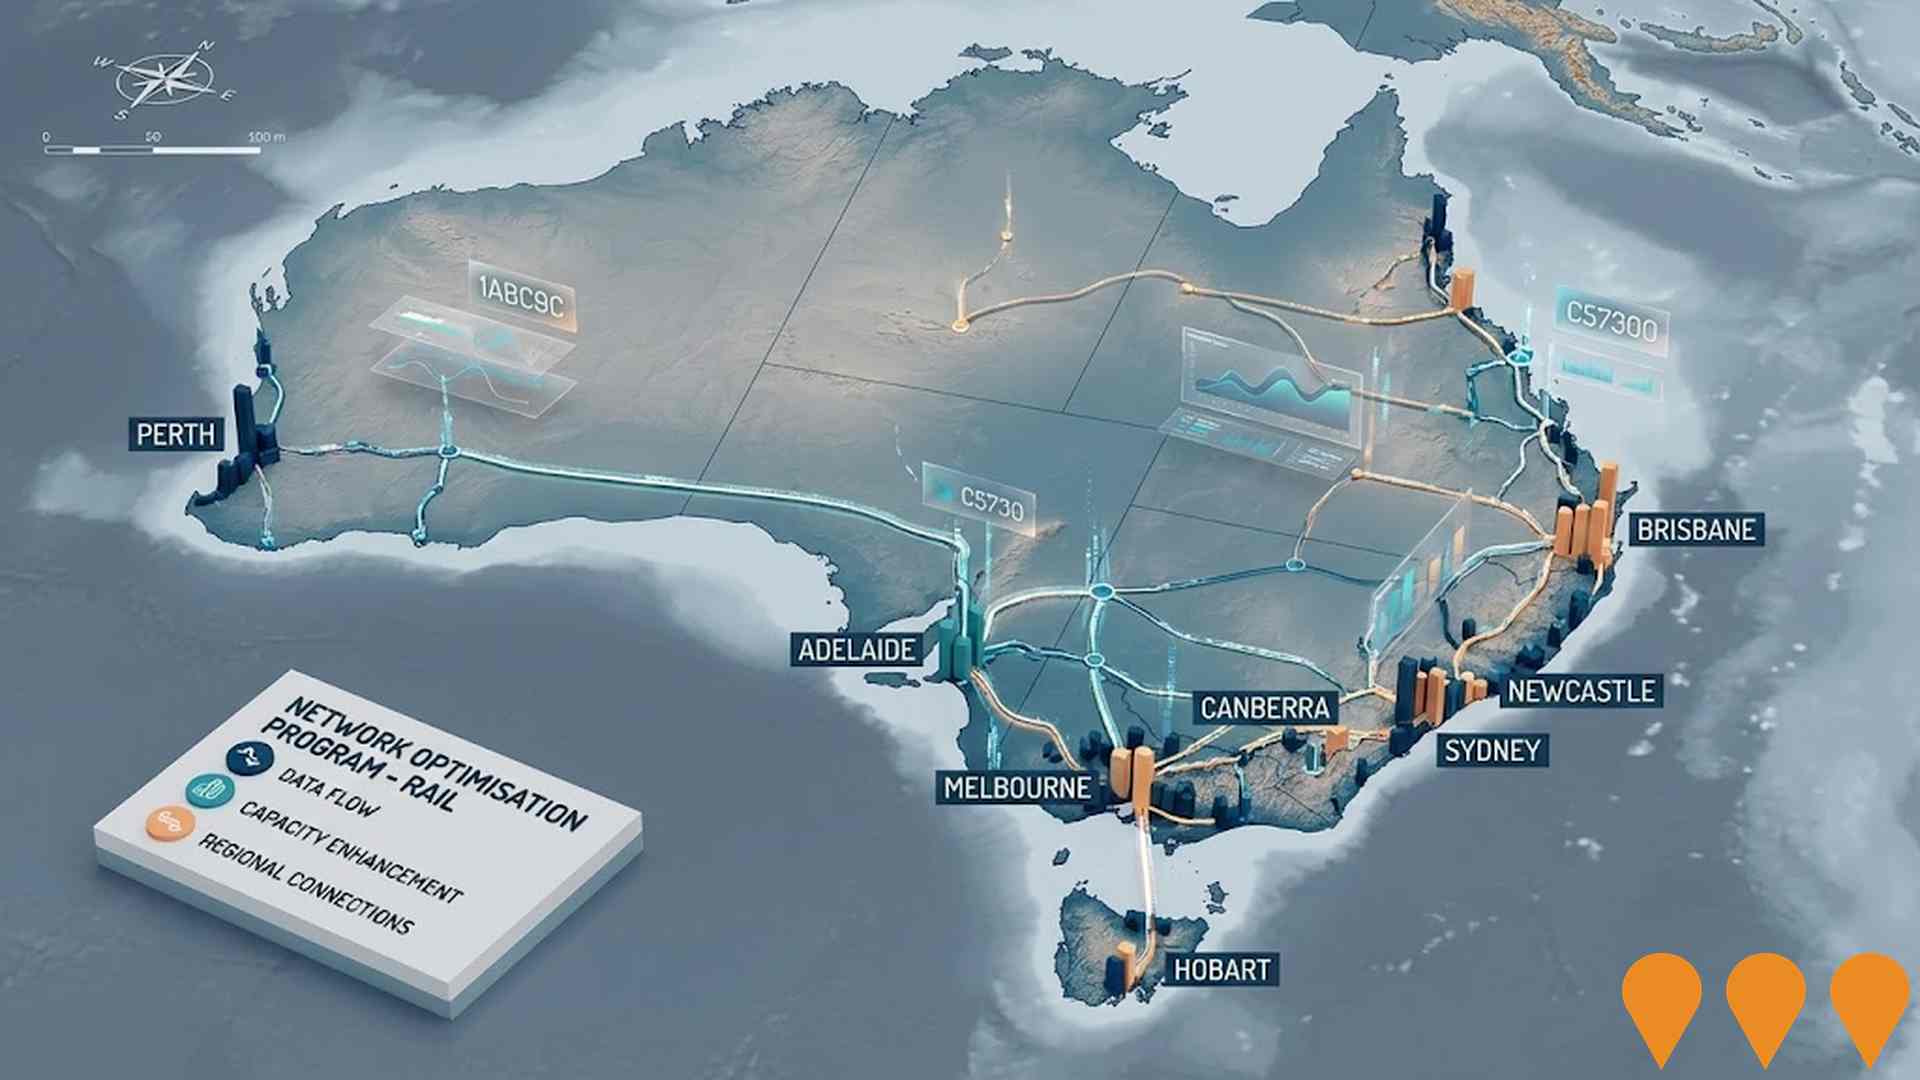
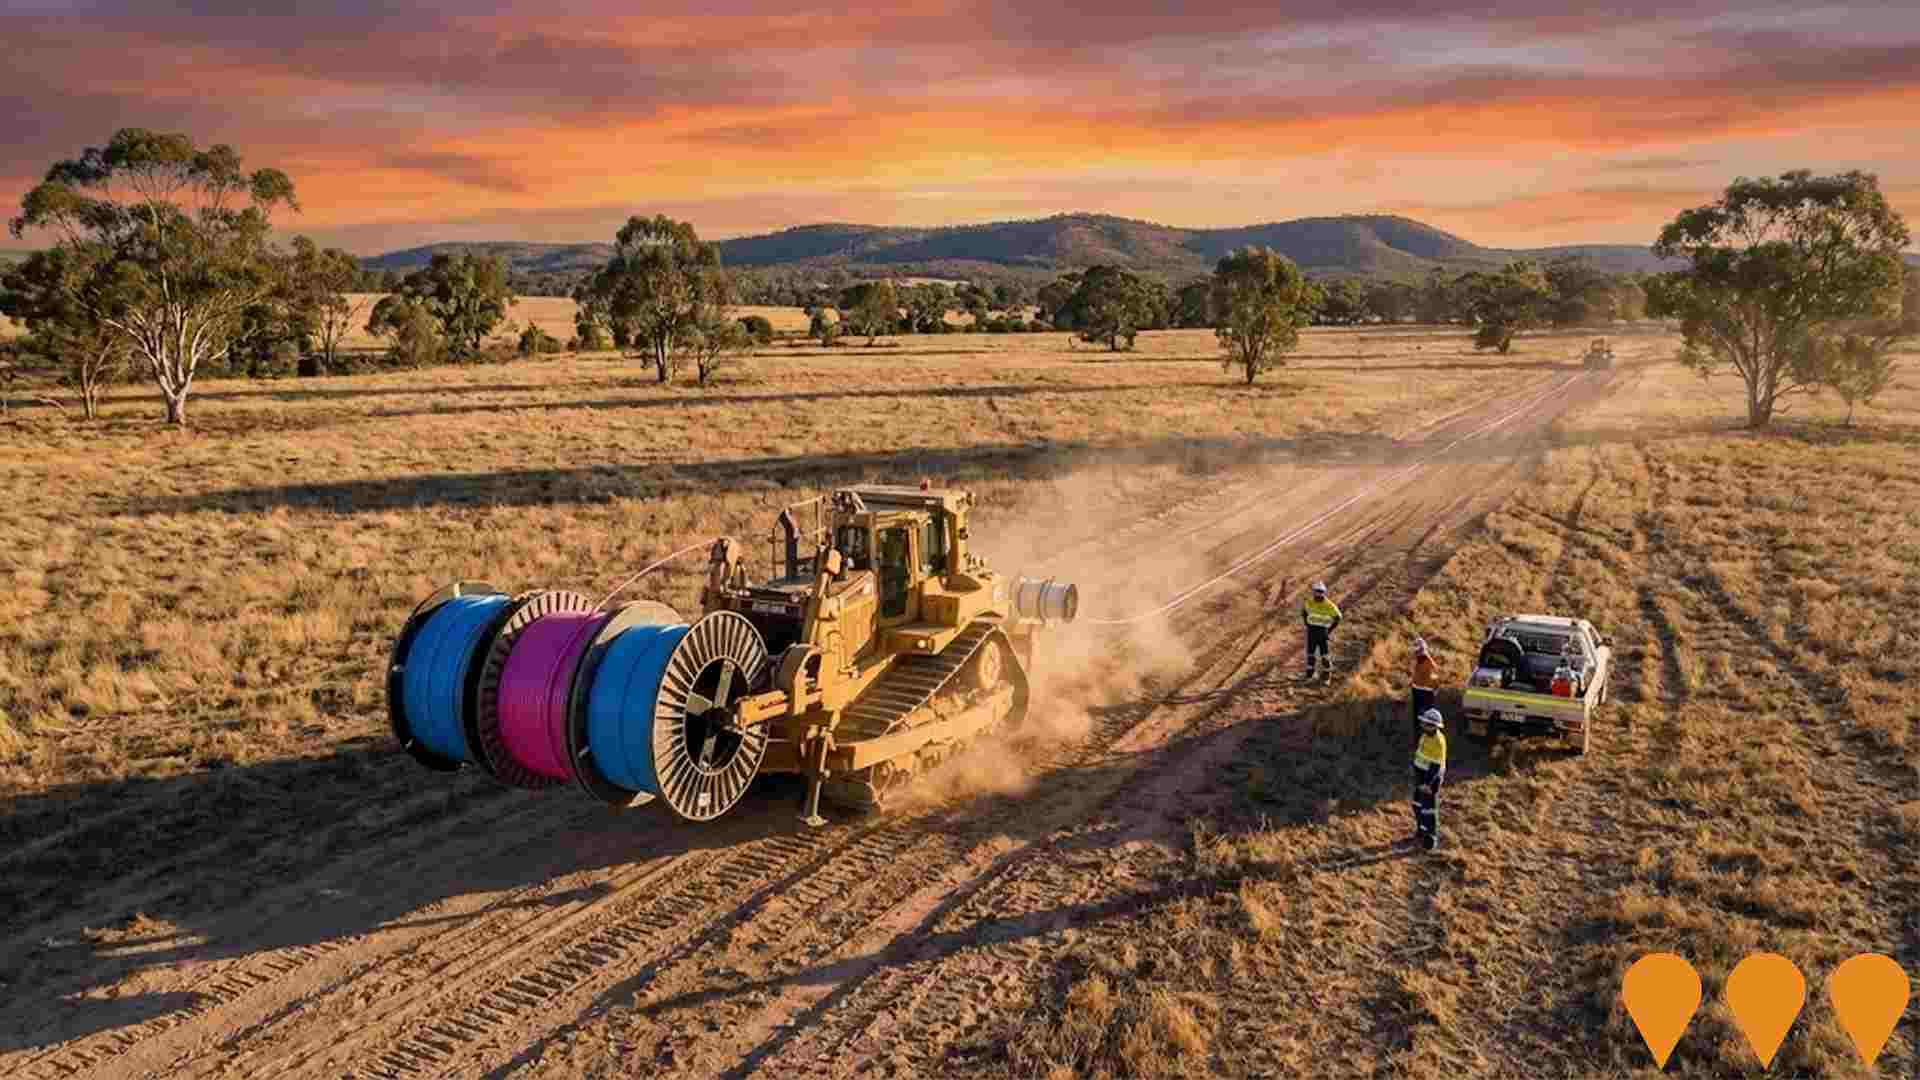
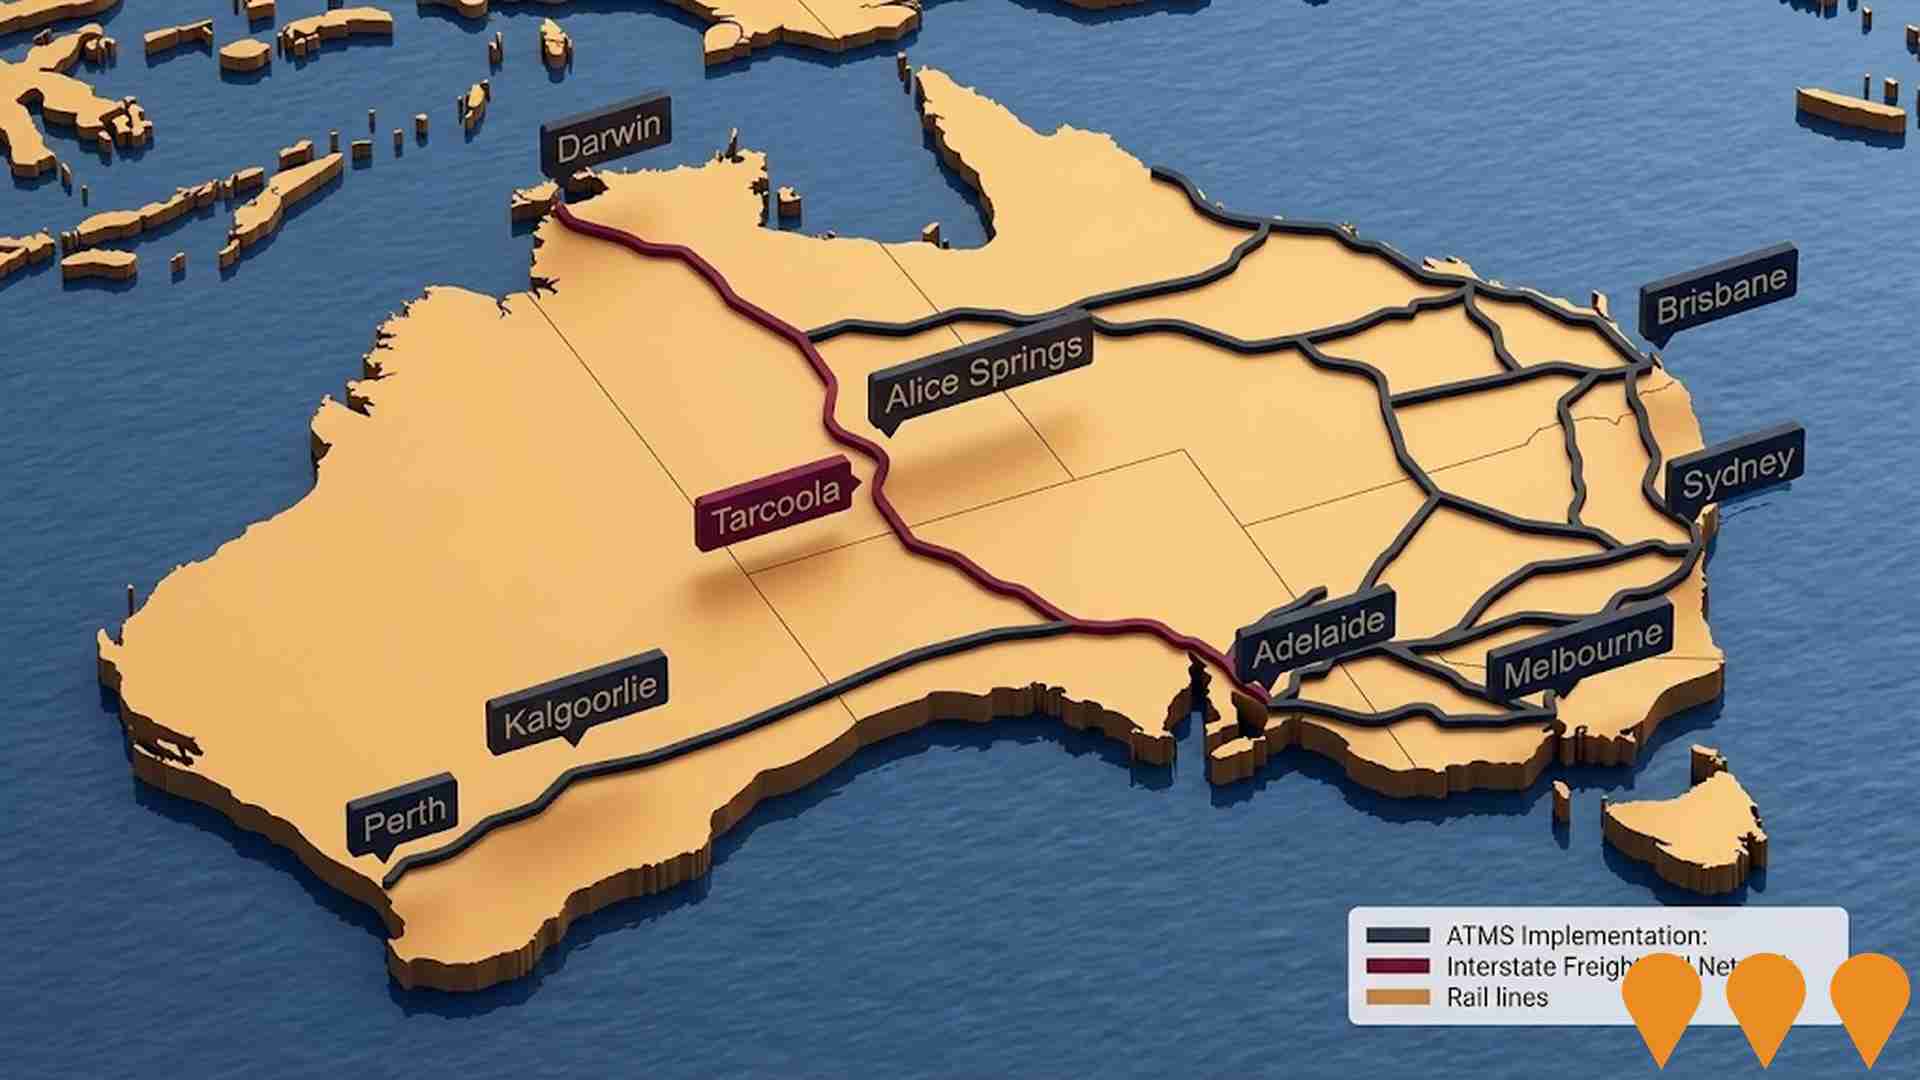
 Denotes AI-based impression for illustrative purposes only, not to be taken as definitive under any circumstances. Please follow links and conduct other investigations from the project's source for actual imagery. Developers and project owners wishing us to use original imagery please Contact Us and we will do so.
Frequently Asked Questions - Infrastructure
Australia-Asia PowerLink (AAPowerLink)
SunCable's AAPowerLink is a large renewable generation, battery storage and HVDC transmission project in the Northern Territory. The project has major environmental approvals from the Northern Territory and Australian governments, conditional Singapore approval to import 1.75 GW from 2035, Indonesian subsea permits, a Singapore-Australia cross-border electricity trade framework and a 70-year Indigenous Land Use Agreement for Powell Creek. It is being staged to supply industrial customers in the Barkly region from the late 2020s, Darwin from the early 2030s, and Southeast Asia from the mid-2030s, with final investment decision targeted for 2027.

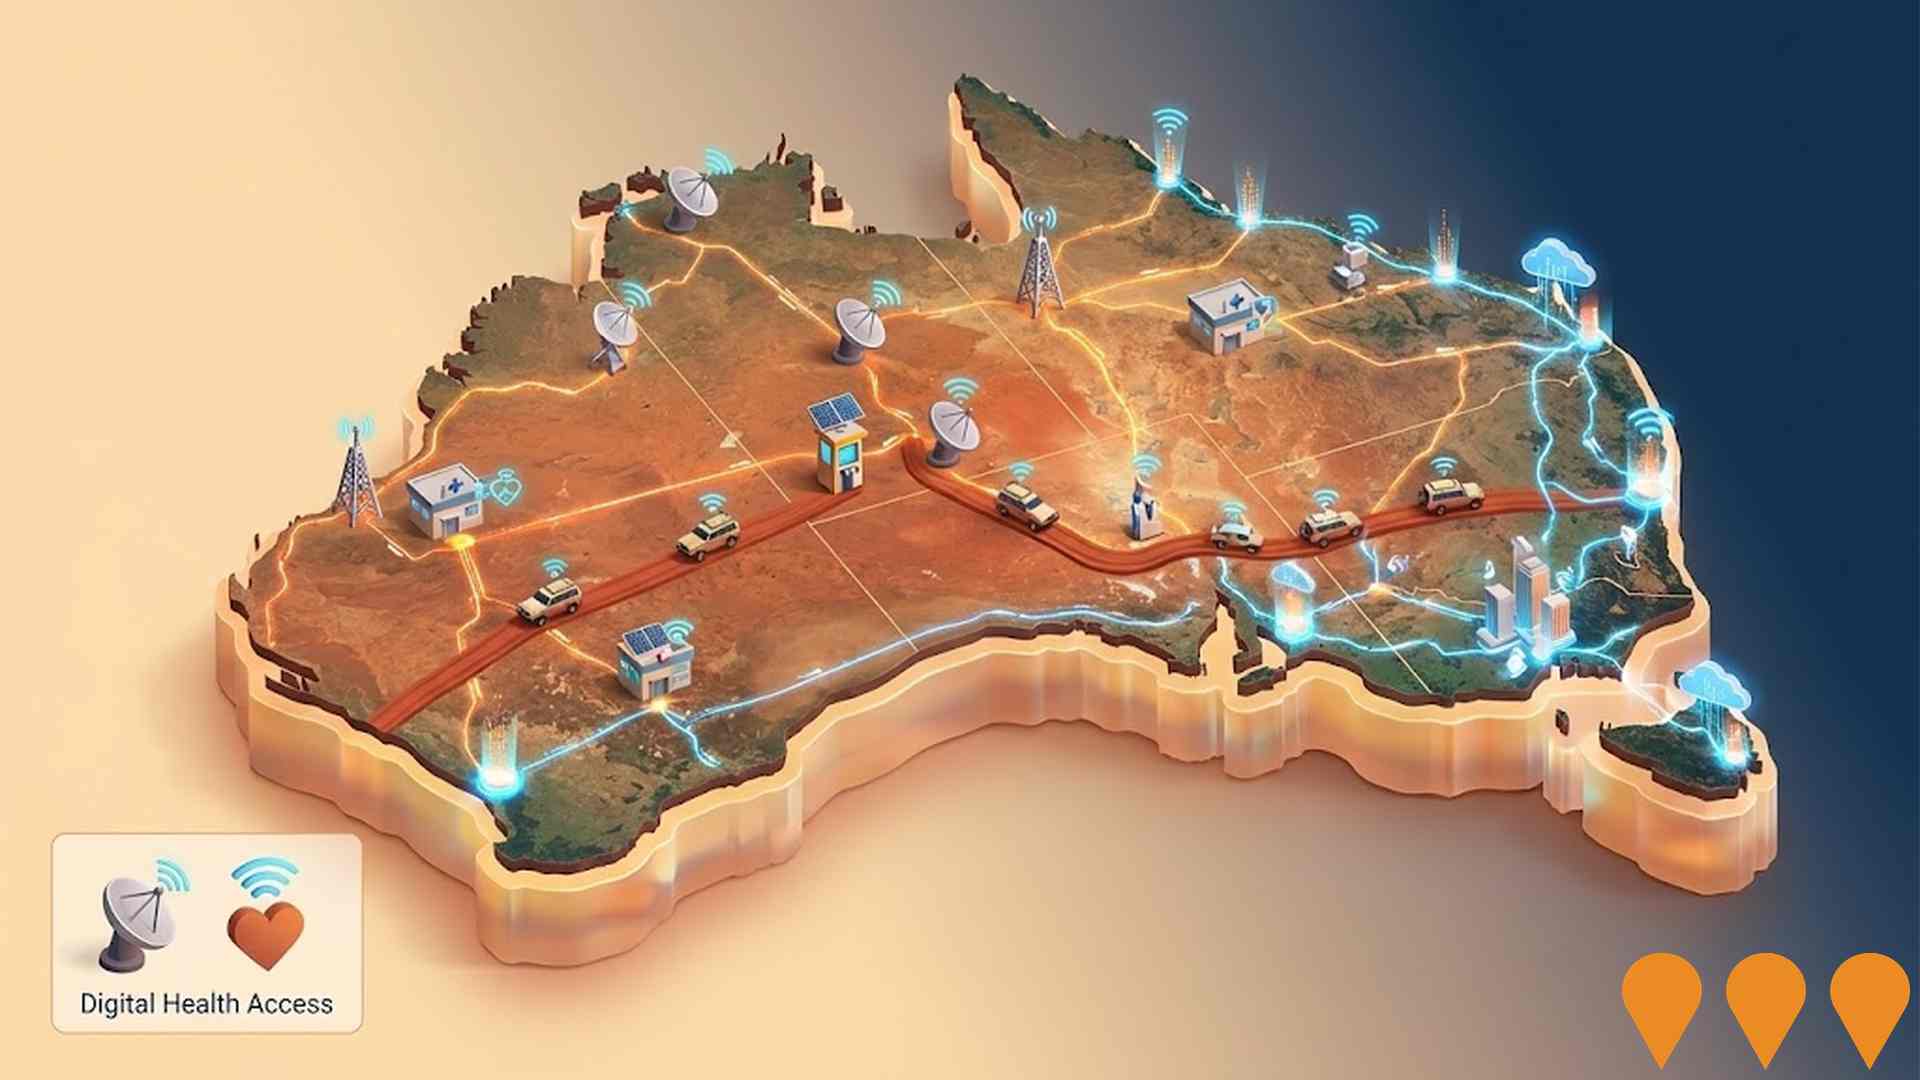
Enabling Digital Health Services for Regional and Remote Australia
A national digital infrastructure program under the Digital Health Blueprint 2023-2033 designed to provide equitable healthcare access for regional and remote Australians. The initiative is currently rolling out the 'Share by Default' legislative framework, which mandates the uploading of pathology and diagnostic imaging reports to My Health Record starting July 2026. Current 2026 milestones include the launch of the Digital Health Implementer Hub to accelerate software conformance and the implementation of the National Allied Health Digital Uplift Plan to integrate allied health practitioners into the national digital ecosystem.
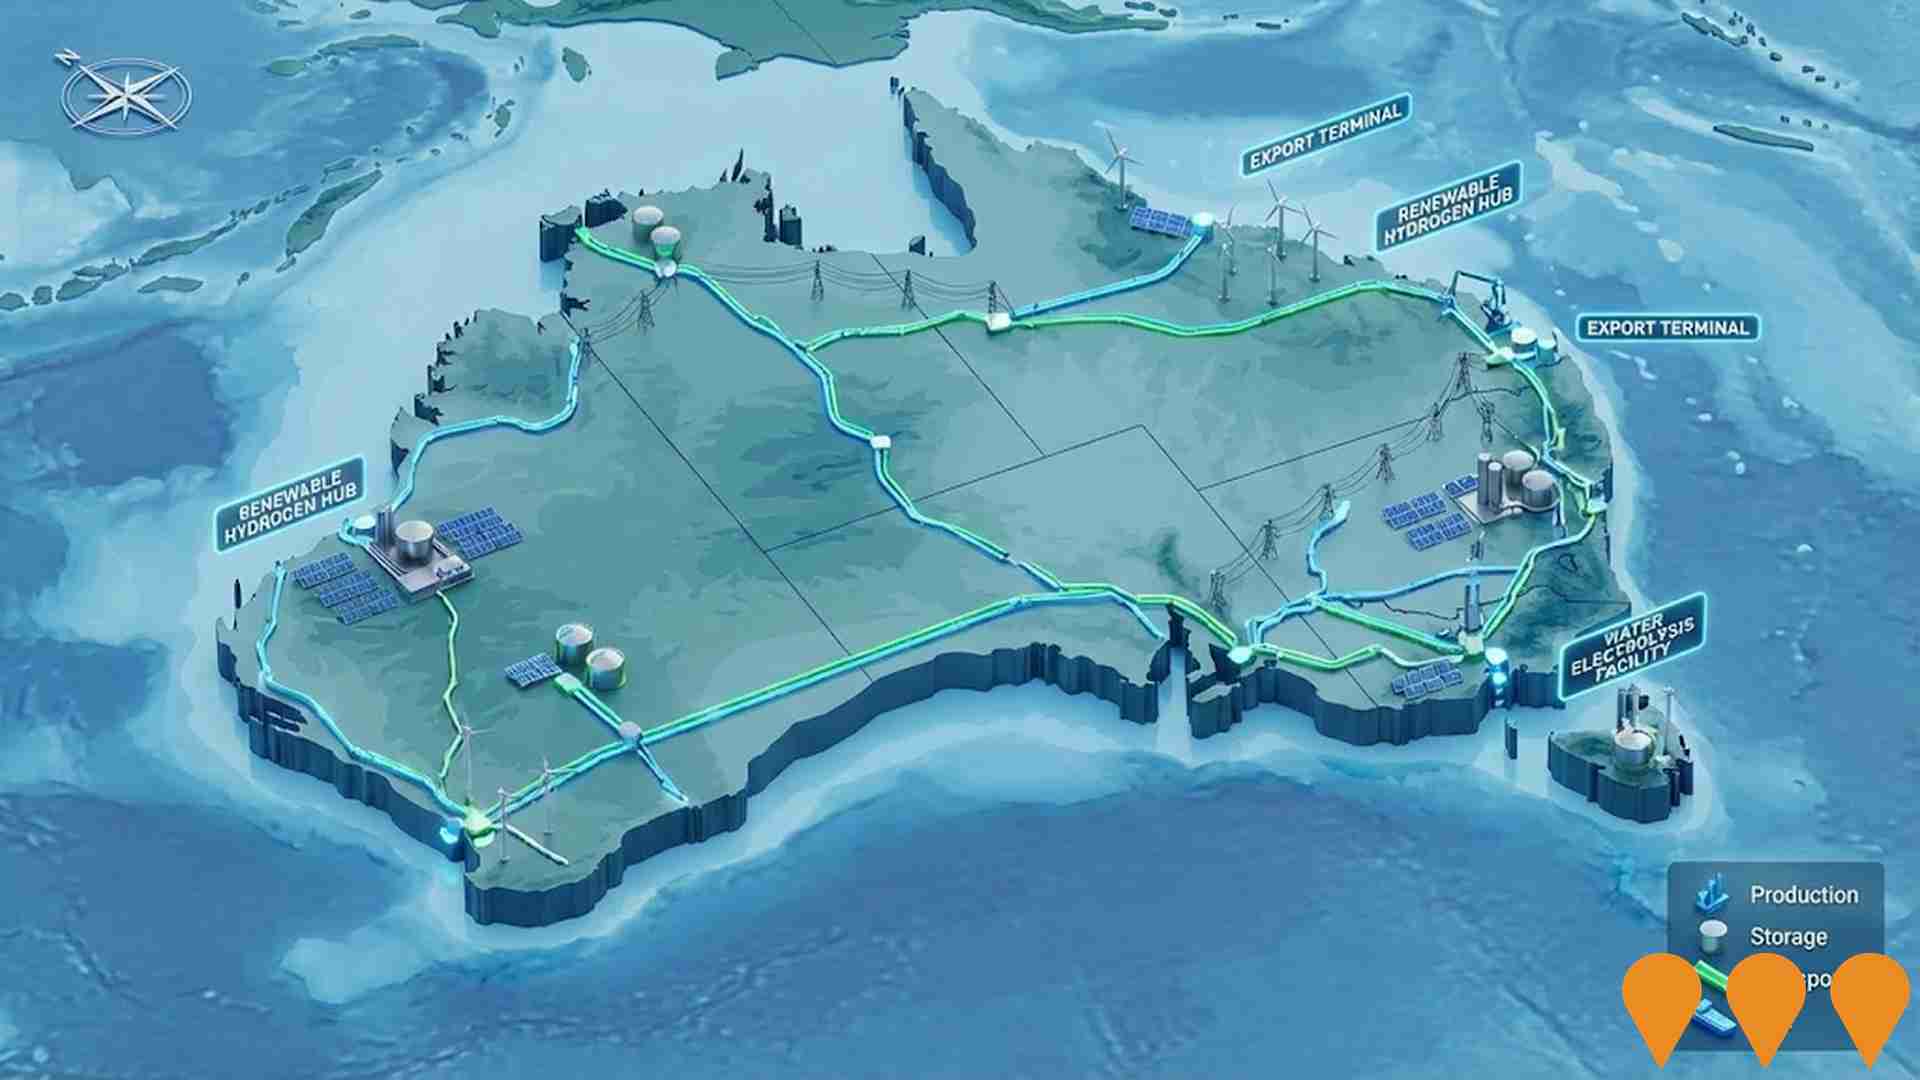
Enabling Infrastructure for Hydrogen Production
A national program to coordinate and deploy the enabling infrastructure required to support large-scale renewable hydrogen production across Australia. Building on the 2024 National Hydrogen Strategy and the National Hydrogen Infrastructure Assessment (NHIA), the program aligns electricity transmission, water supply, transport corridors, port and storage infrastructure with Renewable Energy Zones and prospective hydrogen hubs (Bell Bay, Darwin, Eyre Peninsula, Gladstone, Latrobe Valley, Hunter Valley, Pilbara). Two key federal mechanisms underpin delivery. The Hydrogen Headstart program provides up to 4 billion AUD in long-term revenue support via production credits, with Round 2 (2 billion AUD administered by ARENA) opening for Expressions of Interest in October 2025 with EOIs closing 8 December 2025. The Hydrogen Production Tax Incentive (HPTI), legislated through the Future Made in Australia (Production Tax Credits and Other Measures) Act 2025 which received Royal Assent on 14 February 2025, provides an uncapped refundable tax offset of 2 AUD per kilogram of eligible renewable hydrogen for up to 10 years between 1 July 2027 and 30 June 2040 for projects reaching final investment decision by 2030. The HPTI is jointly administered by the ATO and Clean Energy Regulator and requires certification under the Guarantee of Origin scheme. Round 1 of Hydrogen Headstart shortlisted six projects representing more than 3.5 GW of electrolyser capacity, with 814 million AUD ultimately awarded.
Desert Springs Octopus Renewable Energy Program
Majority Indigenous-owned developer pursuing a near-term pipeline of grid-connected solar and battery projects along the Darwin-Katherine Electricity System, with potential to expand into wind and green hydrogen. Partnership includes Octopus Australia with Larrakia Nation and Jawoyn Association to deliver utility-scale renewable energy and community benefit sharing.

National EV Charging Network (Highway Fast Charging)
Partnership between the Australian Government and NRMA to deliver a backbone EV fast charging network on national highways. Program funds and co-funds 117 DC fast charging sites at roughly 150 km intervals to connect all capital cities and regional routes, reducing range anxiety and supporting EV uptake.

Darwin Renewable Energy Hub
Northern Territory Government proposal to co-locate up to six utility-scale solar farms (total 180-210 MW) with a battery energy storage system on 940 ha of Crown Land west of Finn Road, feeding the Darwin-Katherine grid. Site identified for industry in regional land use plans; consultation held to February 28, 2025 and environmental assessment processes are underway.

Network Optimisation Program - Roads
A national program concept focused on improving congestion and reliability on urban road networks by using low-cost operational measures and technology (e.g., signal timing, intersection treatments, incident management) to optimise existing capacity across major city corridors.

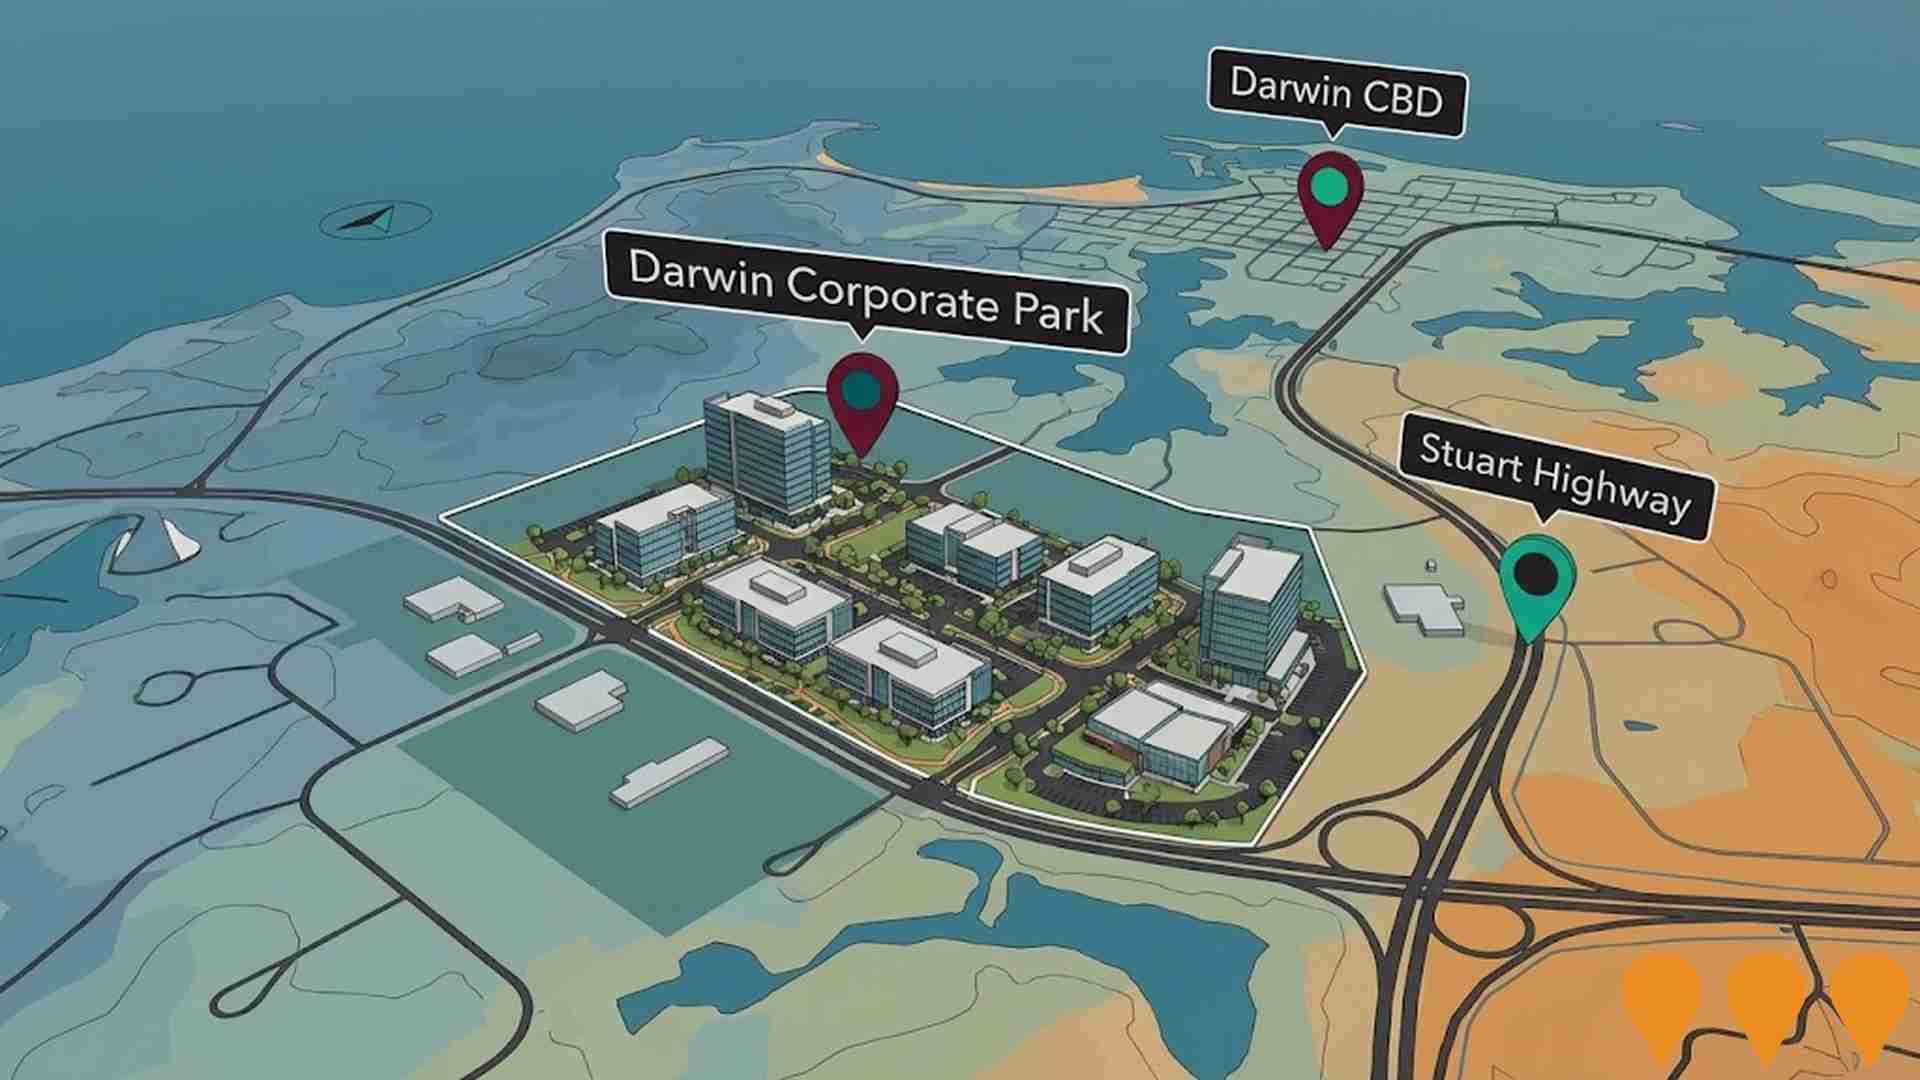
Darwin Corporate Park
Darwin Corporate Park is a premier business park for mixed use commercial office space located in what is now recognised as the centre of greater Darwin.
Employment
AreaSearch analysis places Humpty Doo well above average for employment performance across multiple indicators
Humpty Doo features a balanced workforce distributed across white-collar and blue-collar roles, with a strong presence of essential services sectors, an unemployment rate of just 3.0%, and an estimated employment growth of 0.6% over the past year, based on AreaSearch compilations of statistical area data. As of March 2026, 2,864 residents are employed, while the unemployment rate is 0.5% lower than the rate in Greater Darwin of 3.5%, and labor force participation is largely in line with Greater Darwin's 72.7%. Census records show that a low 6.4% of residents worked from home, although the influence of Covid-19 lockdowns should be kept in mind.
The primary employment industries for local residents are construction, public administration & safety, and education & training. The area displays a clear employment specialization in construction, with an employment share that is 1.7 times the regional level. Conversely, health care & social assistance has a low presence at 8.2% of employment compared to 14.2% regionally. The largely residential locality seems to present limited local employment options, as shown by the comparison of Census working population to resident population.
Based on AreaSearch analysis of SALM and ABS data compiled from broader statistical areas, during the year leading to March 2026, employment levels rose by 0.6% and the labor force expanded by 0.9%, resulting in a 0.2 percentage point increase in the unemployment rate. By comparison, Greater Darwin recorded employment growth of 0.4% and labor force growth of 0.8%, alongside a 0.3 percentage point increase. National employment forecasts from Jobs and Skills Australia dated May-25 can provide additional perspective on prospective future demand in Humpty Doo. These forecasts, spanning five and ten-year intervals, have been aligned with the local employment profile to estimate growth dynamics. Although national employment is projected to grow by 6.6% over five years and 13.7% over ten years, growth rates vary considerably across different industry sectors. Applying these industry-specific forecasts to Humpty Doo's employment profile suggests local employment should rise by 5.7% over five years and 12.0% over ten years (note that this is a basic weighted extrapolation for illustrative purposes and does not incorporate localized population projections).
Frequently Asked Questions - Employment
Income
Income metrics indicate excellent economic conditions, with the area achieving higher performance than 75% of national locations assessed by AreaSearch
According to the latest postcode-level ATO data released by AreaSearch for financial year 2023, the median income of taxpayers in Humpty Doo is $62,087, with an average of $71,346. This sits above the national average, and compares to a median of $66,956 and an average of $77,199 in Greater Darwin. Based on Wage Price Index growth of 9.41% since financial year 2023, current estimates would stand at approximately $67,929 (median) and $78,060 (average) as of March 2026. Census statistics show that household, family, and personal incomes all place highly in Humpty Doo, ranking between the 85th and 87th percentiles nationally. Distribution figures show that 33.2% of the population (1,631 individuals) earn in the $1,500 - 2,999 range, which is comparable to regional patterns where 36.7% fall into this bracket. A notable 38.7% earn more than $3,000 weekly, pointing to pockets of wealth that drive active local economic demand. High housing costs absorb 15.4% of income, yet strong earnings still position disposable income at the 87th percentile, and the area's SEIFA income index places it in the 6th decile.
Frequently Asked Questions - Income
Housing
Humpty Doo is characterized by a predominantly suburban housing profile, with above-average rates of outright home ownership
The mix of dwelling structures in Humpty Doo, measured at the most recent Census, consisted of 96.2% houses and 3.8% other dwelling types (such as semi-detached, apartments, and 'other' structures), compared to 63.5% houses and 36.5% other dwellings in the Darwin metro area. Meanwhile, the level of home ownership in Humpty Doo was far higher than that of Darwin metro, sitting at 23.8%, with the remaining properties being mortgaged (59.6%) or rented (16.6%). The median monthly mortgage payment in the locality was above the Darwin metro average at $2,206, while the median weekly rent stood at $400, compared to Darwin metro's $2,100 and $385. On a national level, mortgage payments in Humpty Doo are notably higher than the Australian average of $1,863, and rents also exceed the national average of $375.
Frequently Asked Questions - Housing
Household Composition
Humpty Doo features high concentrations of family households, with a higher-than-average median household size
Family households make up the large majority at 79.3% of all households, consisting of 38.6% couples with children, 29.0% couples without children, and 10.9% single-parent households. Non-family households account for the remaining 20.7%, with single-person households at 17.7% and group households representing 3.2% of the total. The median household size of 2.9 people is larger than the Greater Darwin average of 2.6.
Frequently Asked Questions - Households
Local Schools & Education
Educational outcomes in Humpty Doo fall within the lower quartile nationally, indicating opportunities for improvement in qualification attainment
The locality displays educational challenges, with university qualification rates (14.6%) falling significantly below the SA4 region average of 31.3%. This presents both an obstacle and a chance for focused educational strategies. Bachelor degrees are the most common at 9.7%, followed by postgraduate qualifications (2.5%) and graduate diplomas (2.4%). Vocational and technical skills are highly prevalent, with 50.2% of residents aged 15+ holding trade credentials, consisting of advanced diplomas (10.2%) and certificates (40.0%).
Enrollment rates are remarkably high, with 32.0% of residents currently participating in formal education. This includes 13.1% in primary school, 9.8% in high school, and 3.8% in higher education.
Frequently Asked Questions - Education
Schools Detail
Nearby Services & Amenities
Transport
Transport servicing is moderate compared to other areas nationally based on assessment of service frequency, route connectivity and accessibility
Public transit analysis indicates 14 active transit stops operate within Humpty Doo, consisting of a mix of bus options. These stops are served by 39 different routes, which combined offer 2,517 passenger journeys weekly. Transit access is classified as limited, with residents on average living 1811 meters from the nearest stop. As a majorly residential locality, most residents travel outwards for work, and driving remains the primary mode of travel at 93%. Vehicle ownership averages 2.2 per household, exceeding the regional average. A relatively low 6.4% of residents work from home (2021 Census; potentially reflecting COVID-19 settings).
Service frequency averages 359 trips daily across all routes, which translates to roughly 179 weekly trips for each individual stop.
Frequently Asked Questions - Transport
Transport Stops Detail
Health
Humpty Doo's residents are extremely healthy with very low prevalence of common health conditions across all age groups
An evaluation of health indicators shows strong performance across Humpty Doo, based on AreaSearch's analysis of mortality rates and chronic condition rates, with a very low presence of common health issues across all age cohorts. Additionally, the rate of private health insurance is very high, covering approximately 55% of the total population (~2,702 people). This compares to 57.8% across Greater Darwin.
The most common medical diagnoses in the locality are arthritis and asthma, affecting 7.0 and 6.3% of residents respectively, while 75.1% reported having no medical conditions at all, compared to 77.1% in Greater Darwin. Working-age residents show notable health levels with a low occurrence of chronic disease. Seniors aged 65 and over make up 14.8% of the population (727 people), which is higher than the 11.0% seen in Greater Darwin. Health outcomes among older residents are especially positive, with national rankings that exceed those of the general local population.
Frequently Asked Questions - Health
Cultural Diversity
Humpty Doo ranks below the Australian average when compared to other local markets across a number of language and cultural background related metrics
Humpty Doo shows lower than average levels of cultural diversity, with citizens making up 87.4% of the population, 85.5% born in Australia, and 94.1% speaking only English at home. Christianity is the dominant religion, accounting for 40.5% of people in Humpty Doo. However, the most distinct overrepresentation is in Buddhism, which represents 1.8% of the population, compared to 3.3% across Greater Darwin.
Regarding ancestry (the country of birth of residents' parents), the three most common backgrounds in Humpty Doo are Australian at 31.9% of the population, which is considerably higher than the regional average of 22.6%, English at 27.6%, which is also much higher than the regional average of 21.7%, and Irish at 8.1%. Furthermore, there are notable differences in the shares of other ethnic backgrounds: Australian Aboriginal is overrepresented at 5.0% of Humpty Doo (versus 7.0% regionally), Maori at 0.7% (versus 0.6%), and German at 3.9% (versus 3.2%).
Frequently Asked Questions - Diversity
Age
Humpty Doo's population aligns closely with national norms in age terms
At 39 years, the median age in the suburb of Humpty Doo is notably higher than the Greater Darwin average of 34, and is very close to the national median of 38. Compared to Greater Darwin, the suburb of Humpty Doo has a higher proportion of residents aged 55 - 64 (15.8%) but fewer individuals aged 25 - 34 (11.4%). Since the 2021 Census, the 65 to 74 age group has expanded from 9.0% to 10.6% of the population, while the 55 to 64 group rose from 14.4% to 15.8%. In contrast, the 45 to 54 cohort decreased from 16.0% to 13.3%, and the 5 to 14 group fell from 14.6% to 12.5%. Demographic projections suggest the age distribution in the suburb of Humpty Doo will change significantly by 2041. The 65 to 74 cohort is expected to grow the most at 31%, adding 159 residents to total 680. Conversely, both the 0 to 4 and 5 to 14 age groups are projected to decrease in size.