Chart Color Schemes
This analysis uses ABS Statistical Areas Level 2 (SA2) boundaries, which can materially differ from Suburbs and Localities (SAL) even when sharing similar names.
SA2 boundaries are defined by the Australian Bureau of Statistics and are designed to represent communities for statistical reporting (e.g., census and ERP).
Suburbs and Localities (SAL) represent commonly-used suburb/locality names (postal-style areas) and may use different geographic boundaries. For comprehensive analysis, consider reviewing both boundary types if available.
est. as @ -- *
ABS ERP | -- people | --
2021 Census | -- people
Sales Activity
Curious about local property values? Filter the chart to assess the volume and appreciation (including resales) trends and regional comparisons, or scroll to the map below view this information at an individual property level.
Find a Recent Sale
Sales Detail
Population
Tingalpa is positioned among the lower quartile of areas assessed nationally for population growth based on AreaSearch's assessment of recent, and medium term trends
Tingalpa's population is approximately 9,394 as of November 2025. This figure represents an increase of 513 people since the 2021 Census, which reported a population of 8,881. The change was inferred from the estimated resident population of 9,311 in June 2024 and an additional 34 validated new addresses after the Census date. This results in a population density ratio of 1,052 persons per square kilometer, comparable to averages across locations assessed by AreaSearch. Tingalpa's growth rate of 5.8% since the census is within 0.6 percentage points of the SA3 area's 6.4%, indicating strong growth fundamentals. Natural growth contributed approximately 55.5% of overall population gains during recent periods.
AreaSearch uses ABS/Geoscience Australia projections for each SA2 area, released in 2024 with a base year of 2022. For areas not covered by this data and years post-2032, Queensland State Government's SA2 area projections are adopted, released in 2023 based on 2021 data. However, these state projections do not provide age category splits, so AreaSearch applies proportional growth weightings aligned with ABS Greater Capital Region projections for each age cohort, released in 2023 using 2022 data as the base year. Future population projections anticipate lower quartile growth for national areas, with Tingalpa expected to grow by 38 persons to 2041 based on the latest annual ERP population numbers, reflecting a reduction of 0.5% in total over the 17 years.
Frequently Asked Questions - Population
Development
Residential development activity is lower than average in Tingalpa according to AreaSearch's national comparison of local real estate markets
Tingalpa has seen approximately 23 new homes approved annually. Over the past five financial years, from FY-21 to FY-25119 homes were approved, with a further 8 approved so far in FY-26. On average, over these five years, 1.7 new residents arrived per year for each new home, indicating balanced supply and demand and stable market conditions. However, recent data shows this ratio has intensified to 6.4 people per dwelling over the past two financial years, suggesting growing popularity and potential undersupply.
New homes are being built at an average expected construction cost of $380,000, which is moderately above regional levels, reflecting an emphasis on quality construction. This year alone, $9.8 million in commercial approvals have been registered, indicating balanced commercial development activity. Compared to Greater Brisbane, Tingalpa has around two-thirds the rate of new dwelling approvals per person and ranks among the 44th percentile nationally, offering more limited choices for buyers and supporting demand for existing dwellings. This lower rate reflects market maturity and potential development constraints.
All new construction in the area has been detached dwellings, preserving Tingalpa's suburban nature and attracting space-seeking buyers. Interestingly, developers are building more traditional houses than the current mix suggests, indicating strong demand for family homes despite density pressures. The location has approximately 388 people per dwelling approval, reflecting an established area with stable or declining population projections, which should reduce housing demand pressures and benefit potential buyers in the future.
Frequently Asked Questions - Development
Infrastructure
Tingalpa has emerging levels of nearby infrastructure activity, ranking in the 29thth percentile nationally
Changes to local infrastructure significantly influence an area's performance. AreaSearch has identified 19 projects likely impacting the area. Notable projects include Rivermakers Precinct, Containerchain Tingalpa Facility Expansion, Tingalpa Industrial Estate, and Multispace Business Park - Tingalpa. The following list details those most relevant.
Professional plan users can use the search below to filter and access additional projects.
INFRASTRUCTURE SEARCH
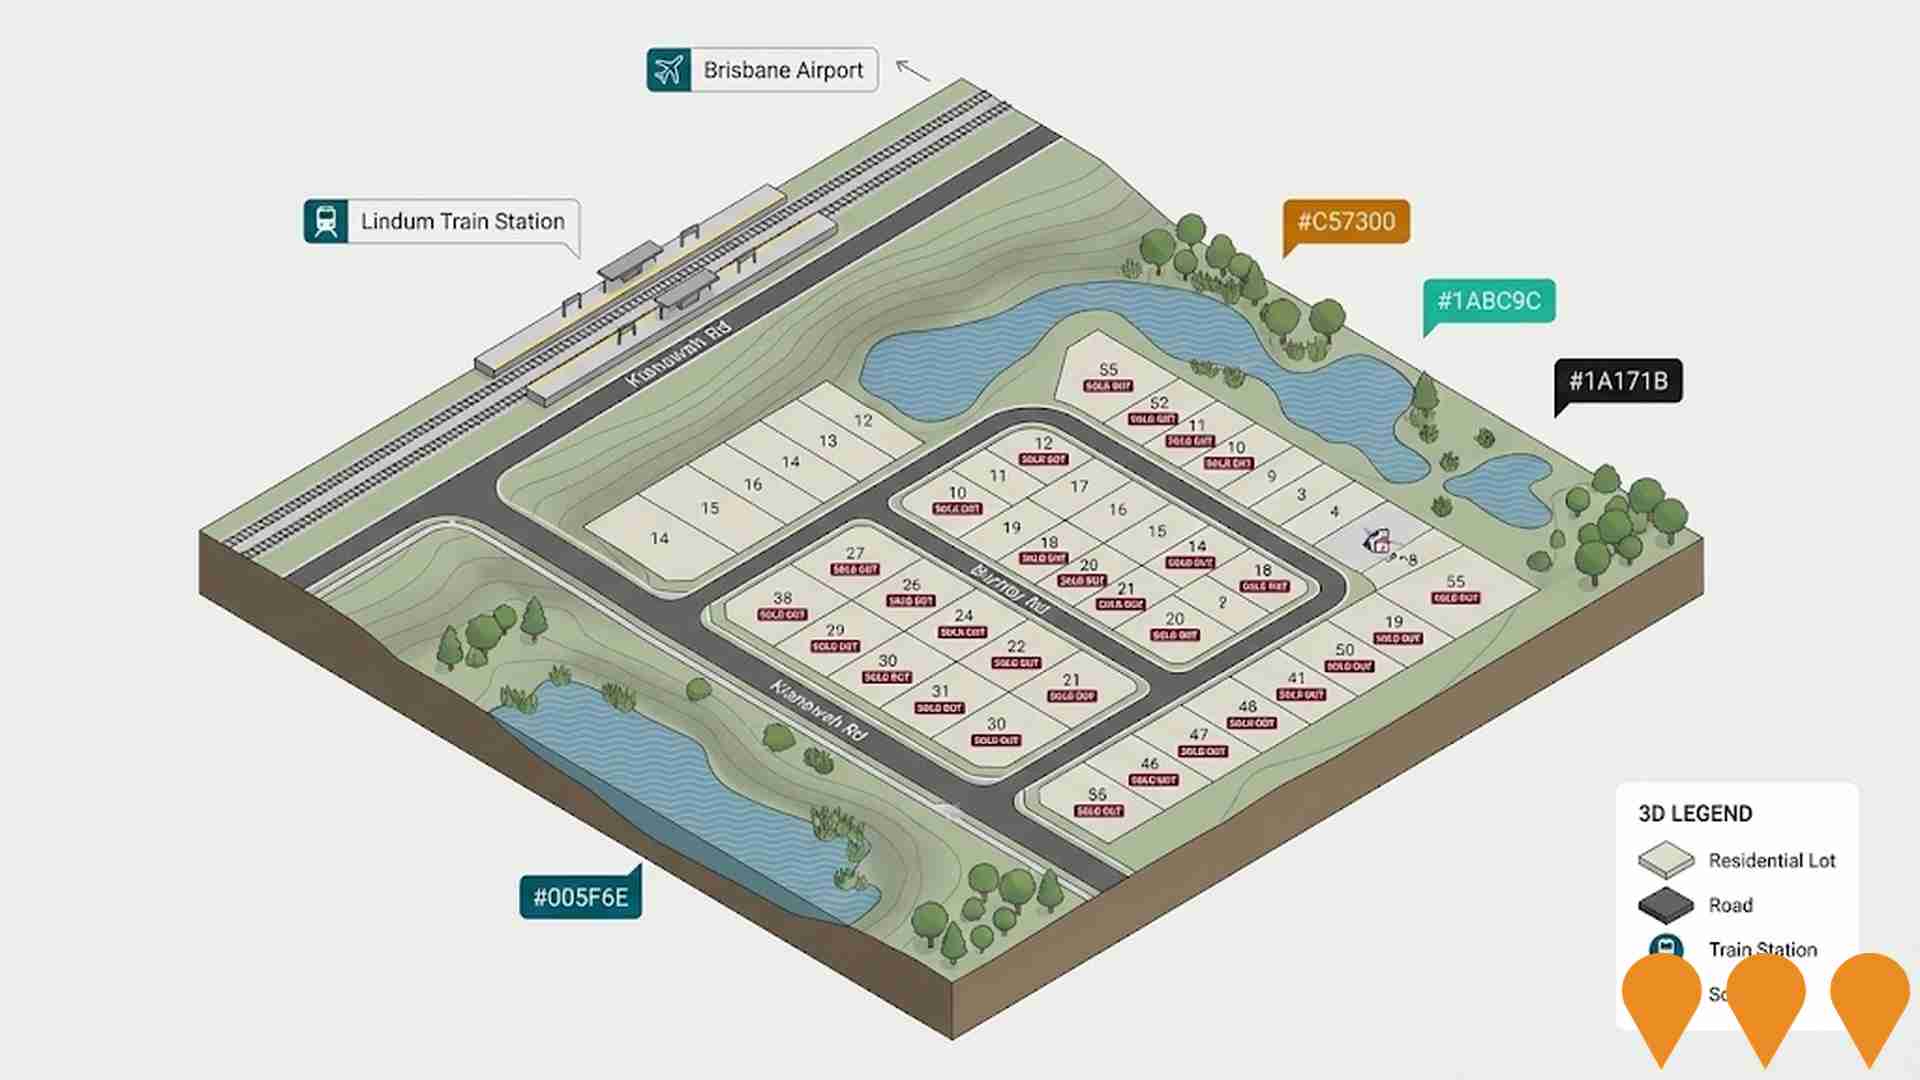
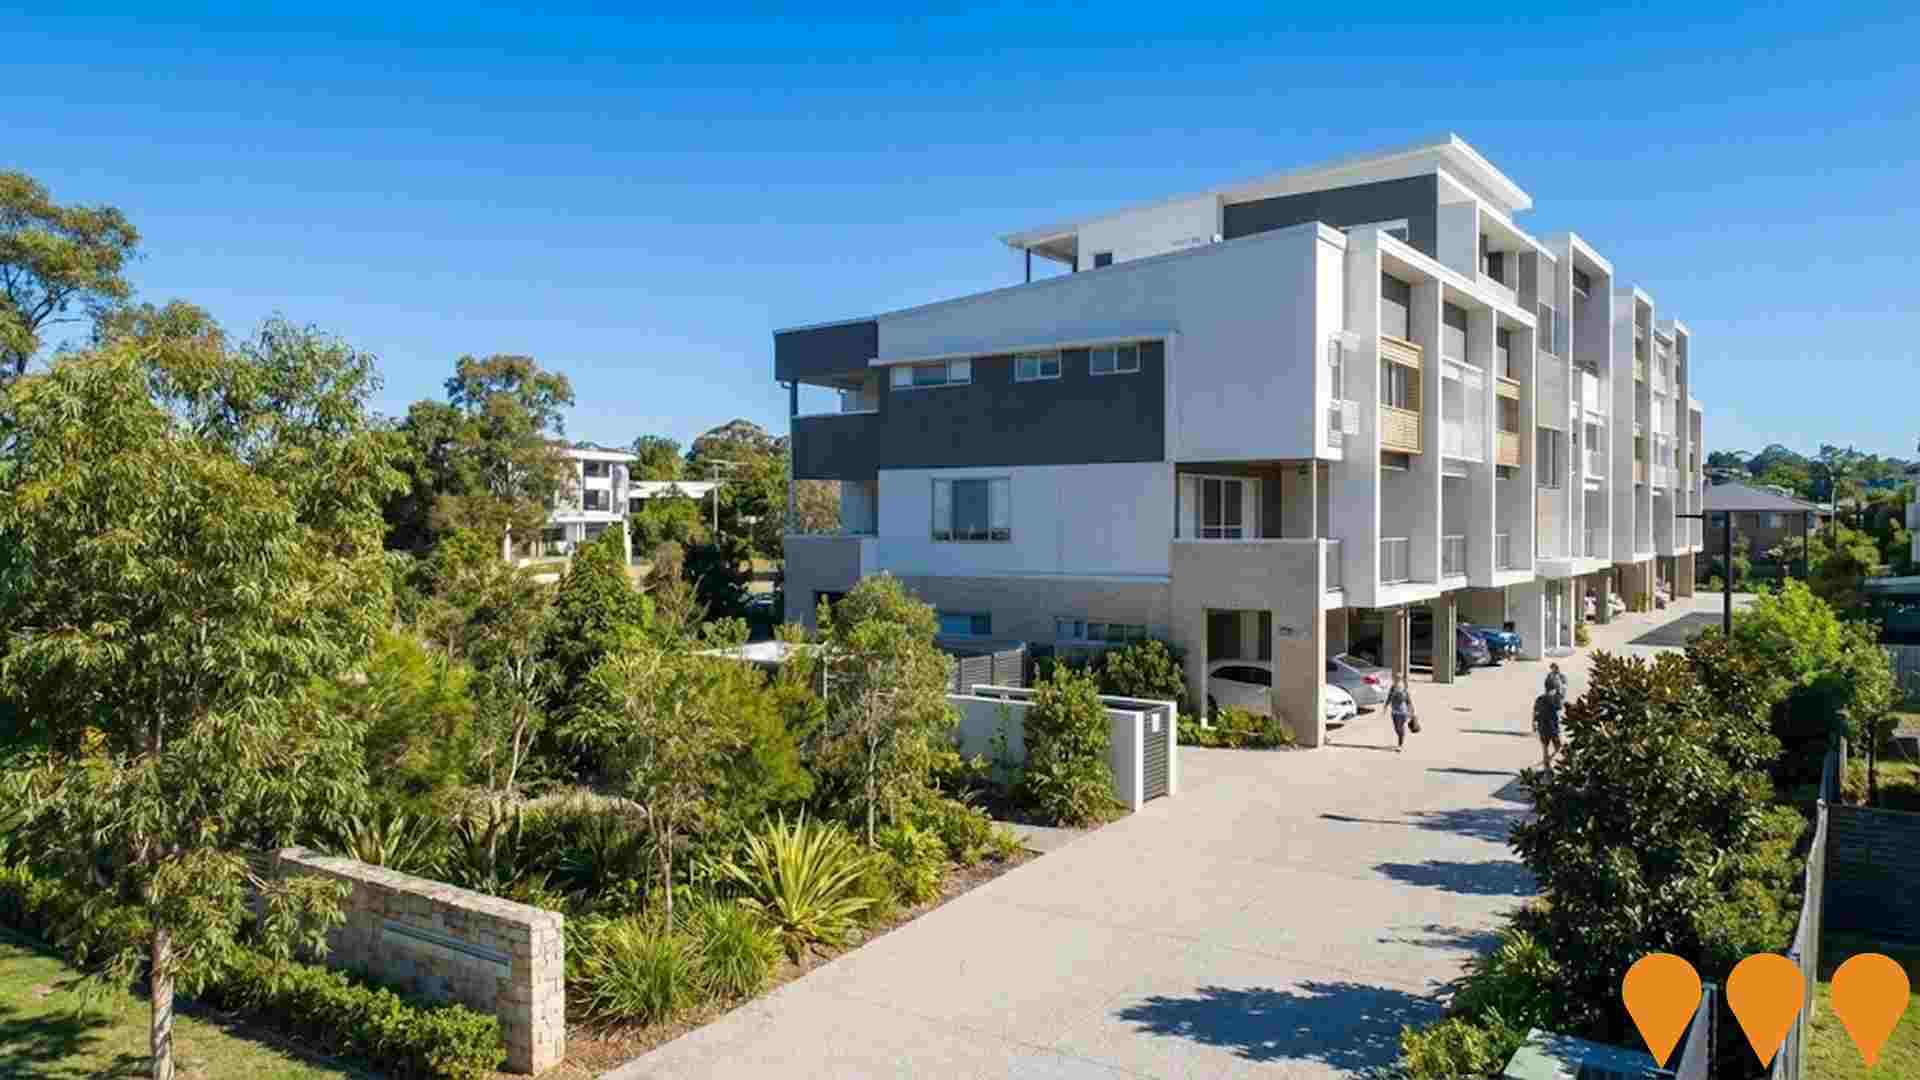
 Denotes AI-based impression for illustrative purposes only, not to be taken as definitive under any circumstances. Please follow links and conduct other investigations from the project's source for actual imagery. Developers and project owners wishing us to use original imagery please Contact Us and we will do so.
Frequently Asked Questions - Infrastructure
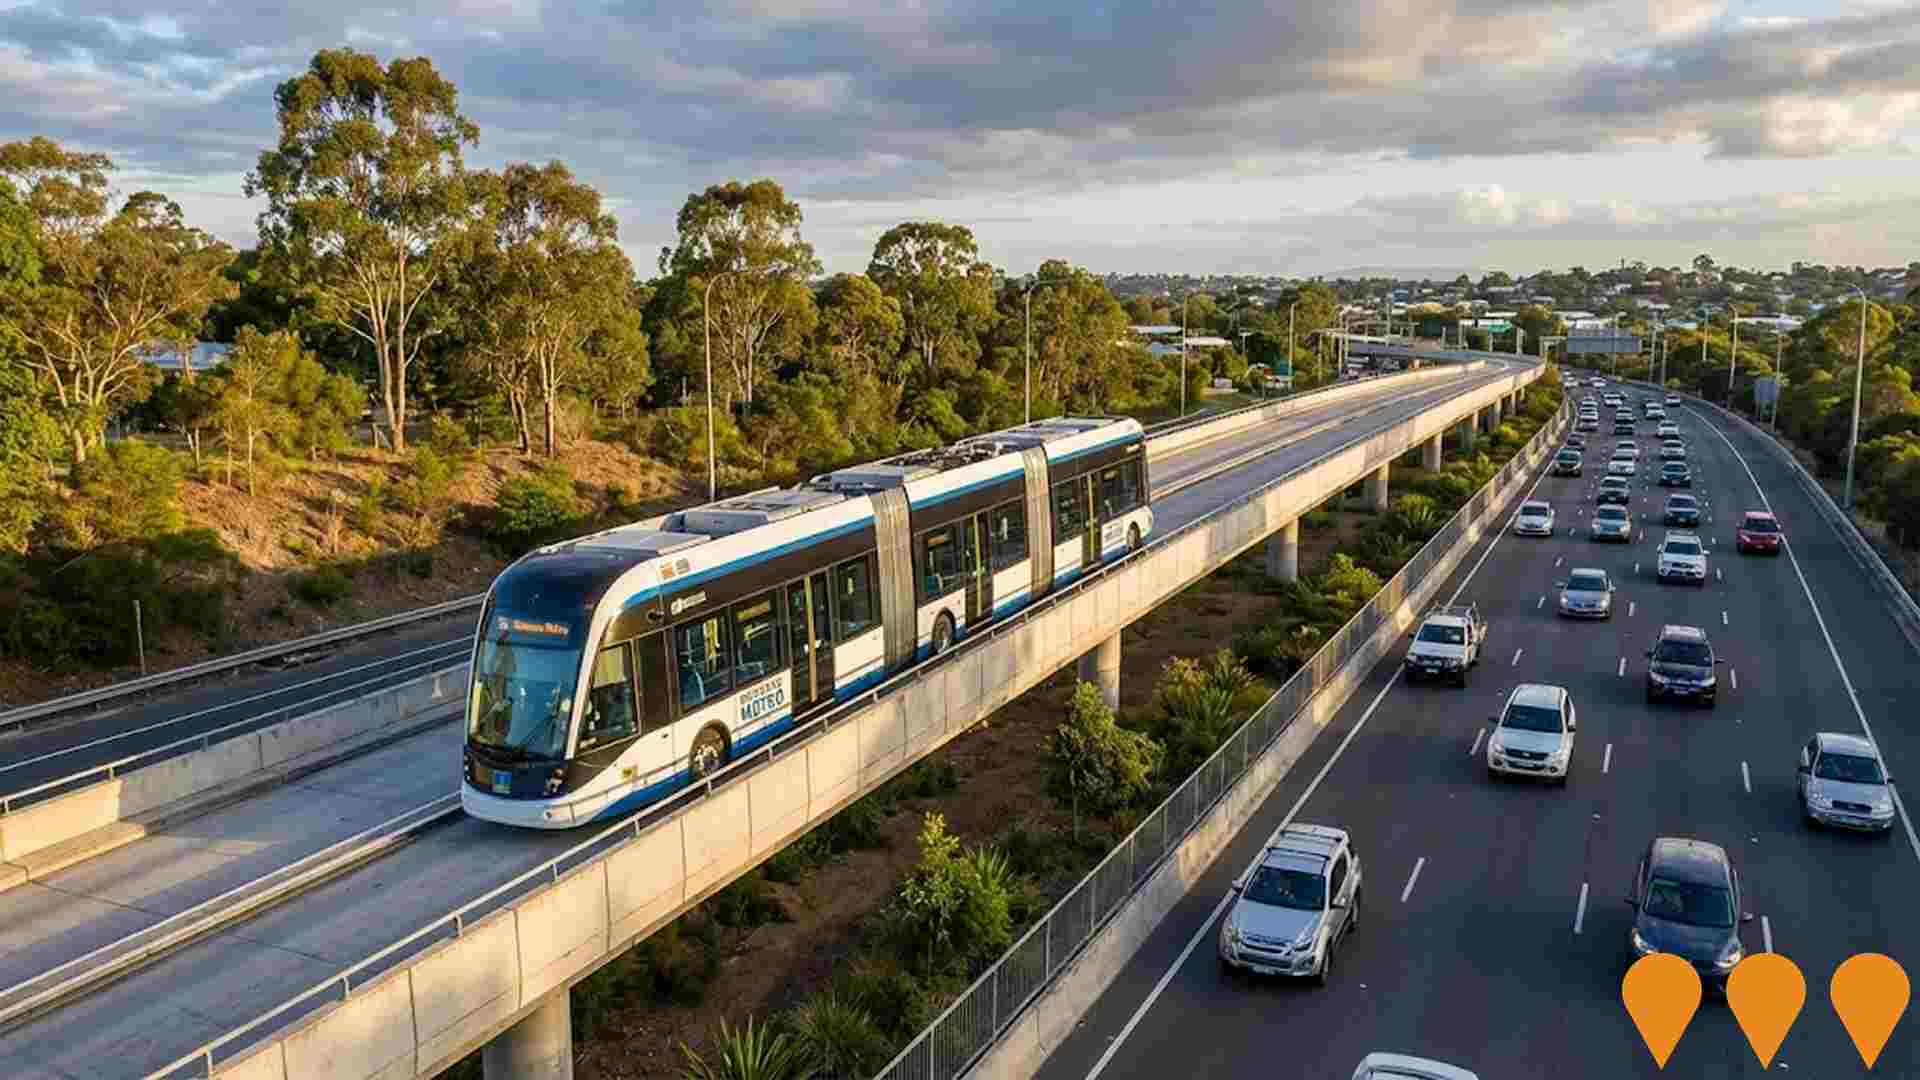
Eastern Metro Study - Coorparoo to Capalaba
Strategic study examining options for a high-capacity, high-frequency public transport corridor along Old Cleveland Road from Coorparoo to Capalaba. The study is assessing extensions of Brisbane Metro-style services or dedicated busway priority to better connect eastern Brisbane suburbs, Redlands, and major activity centres, with the aim of reducing car dependency and improving travel times. Jointly led by Queensland Department of Transport and Main Roads (TMR), Brisbane City Council and Redland City Council. A detailed business case for an eastward Brisbane Metro extension is in preparation.
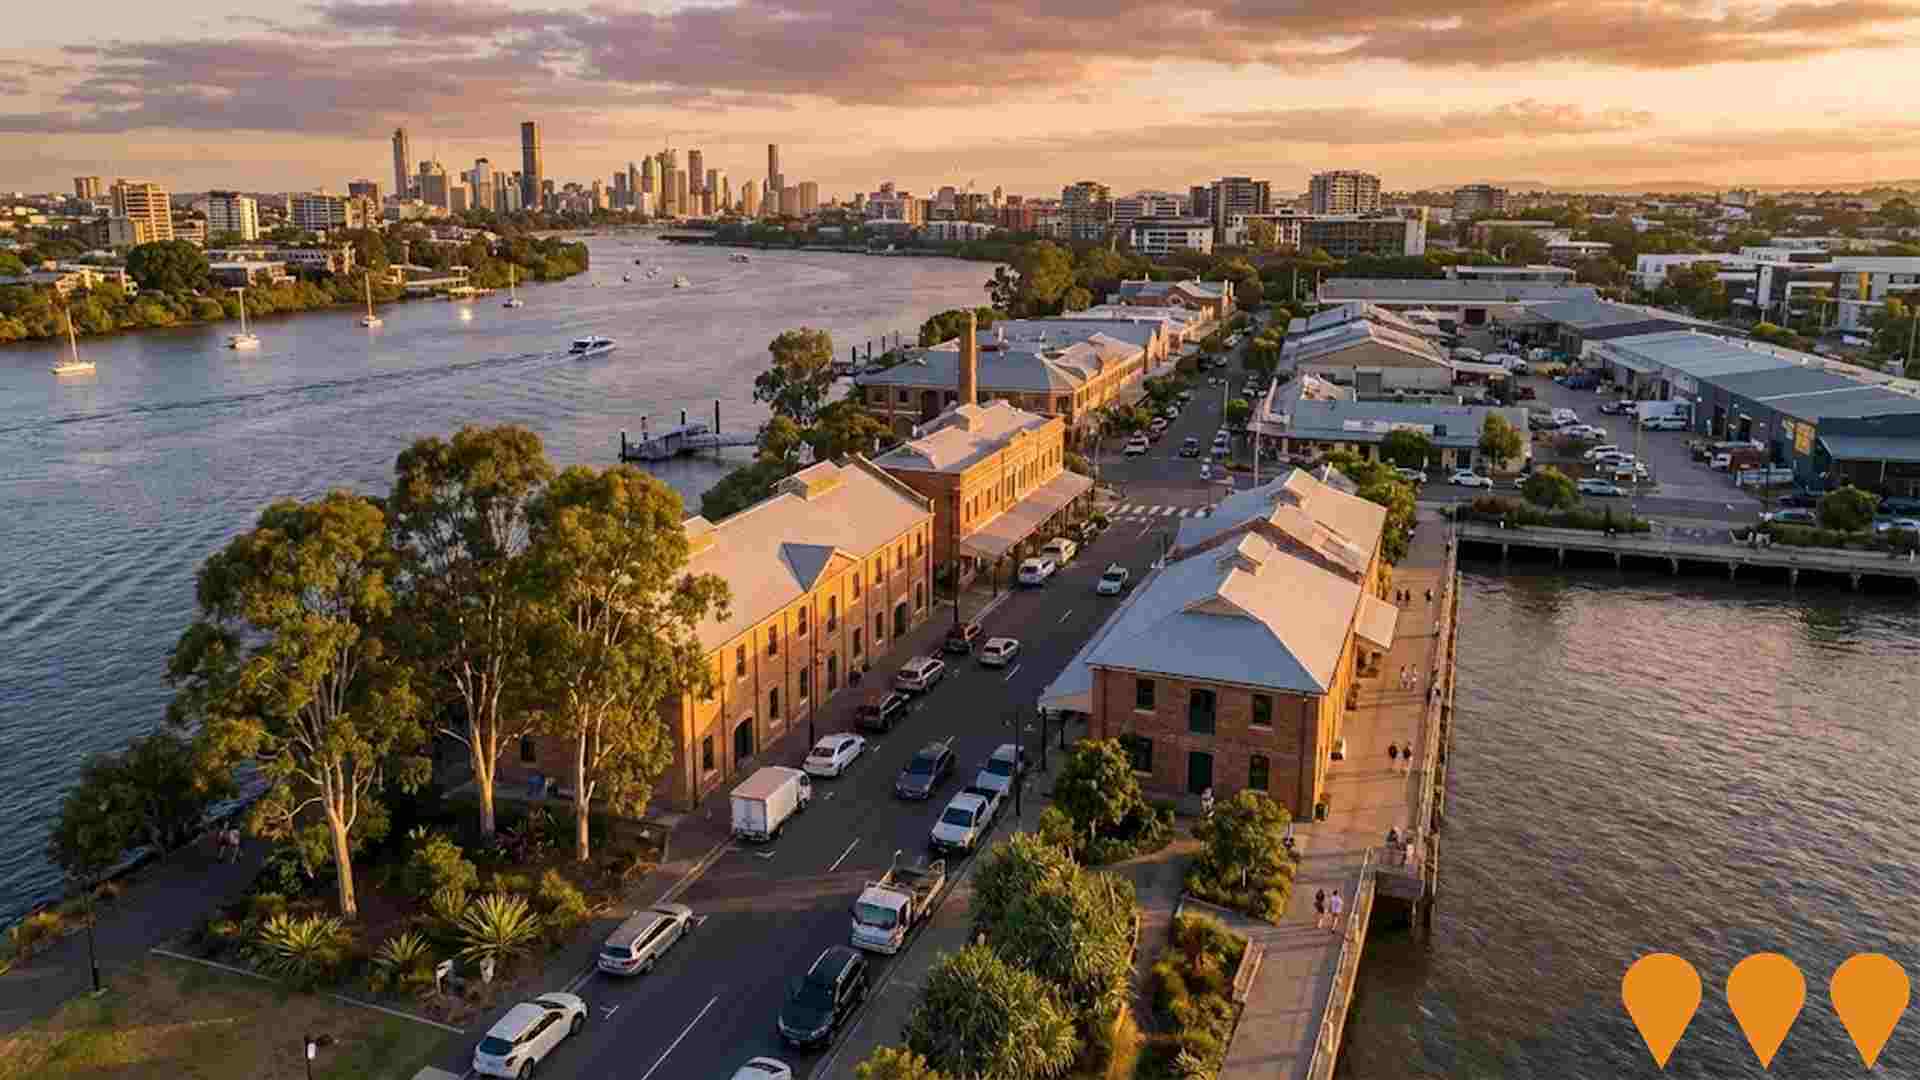
Rivermakers Precinct
30-hectare riverside mixed-use industrial and business precinct. Comprises three precincts: The Depot (retail/industrial), Mixed Business & Industry, and Heritage Quarter (food & beverage destination). Features restored heritage buildings from 1917 lime factory. Developed by BMI Group.
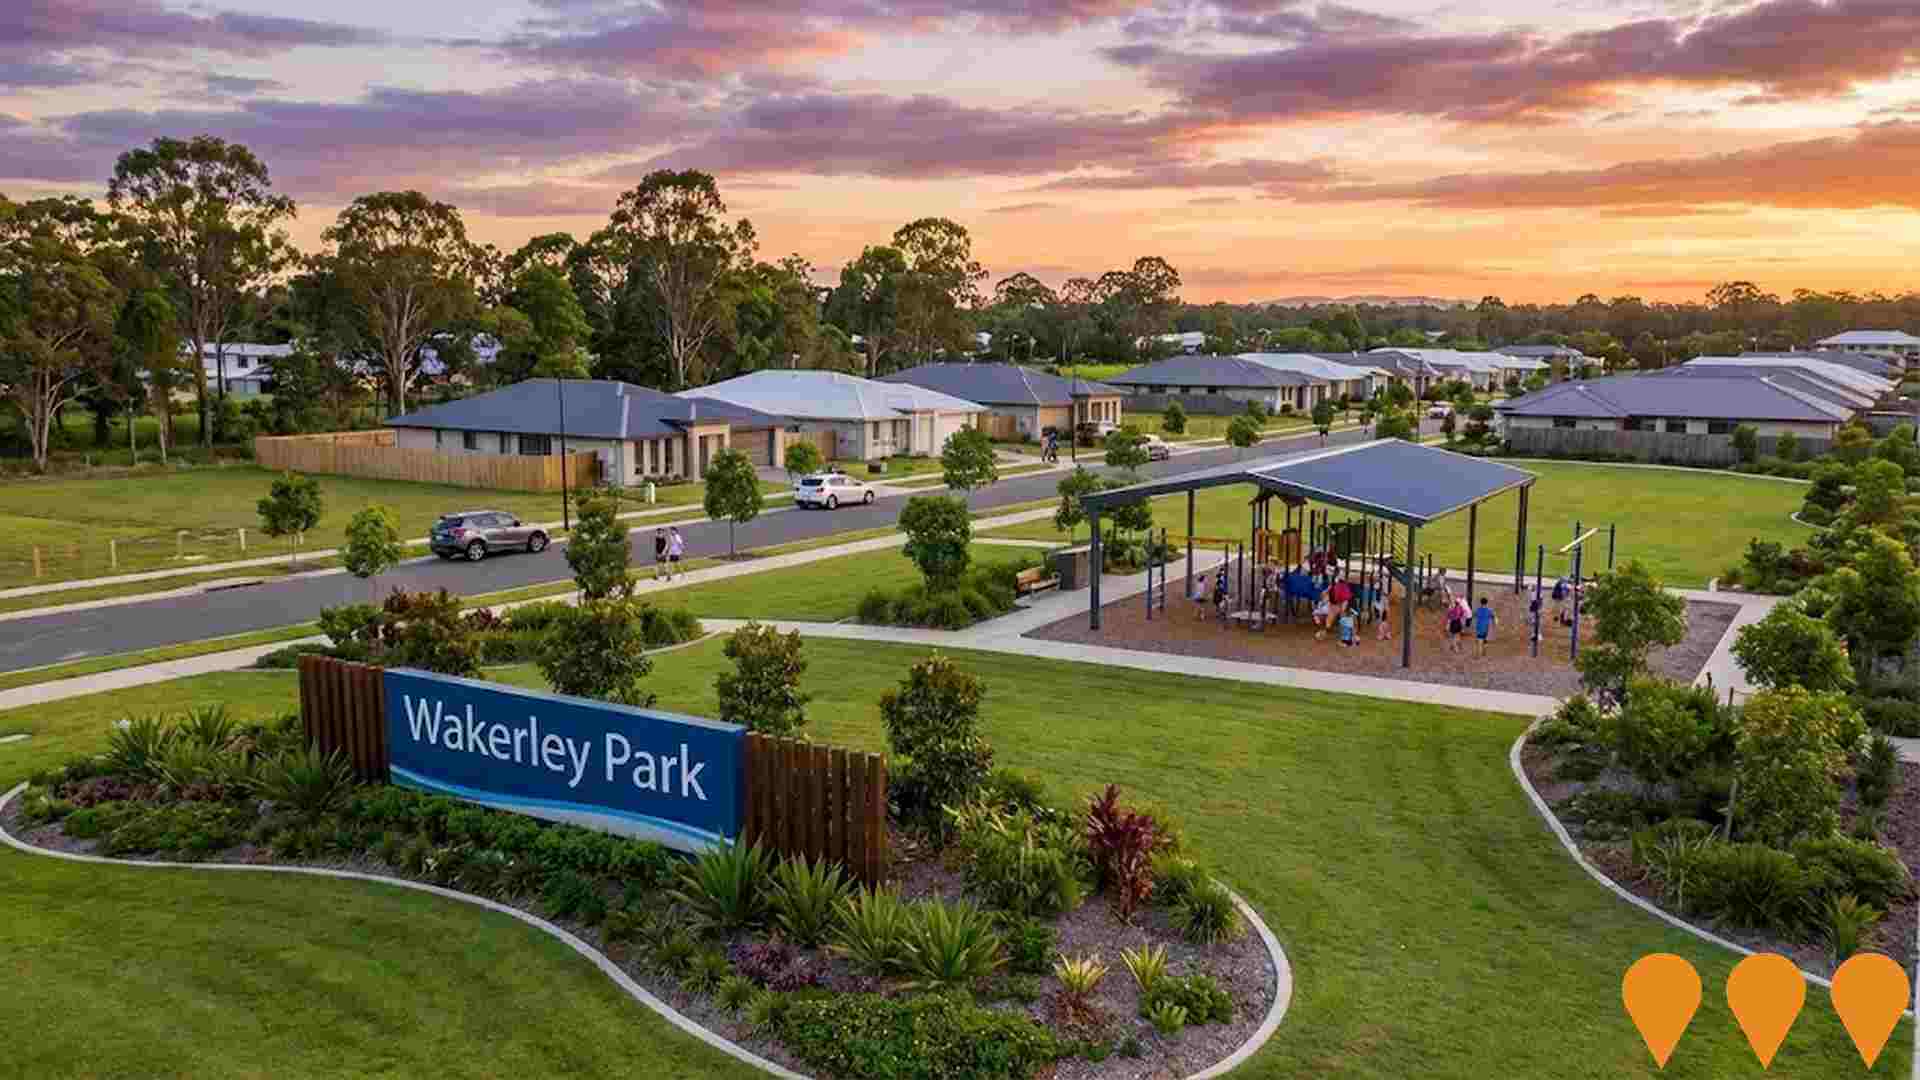
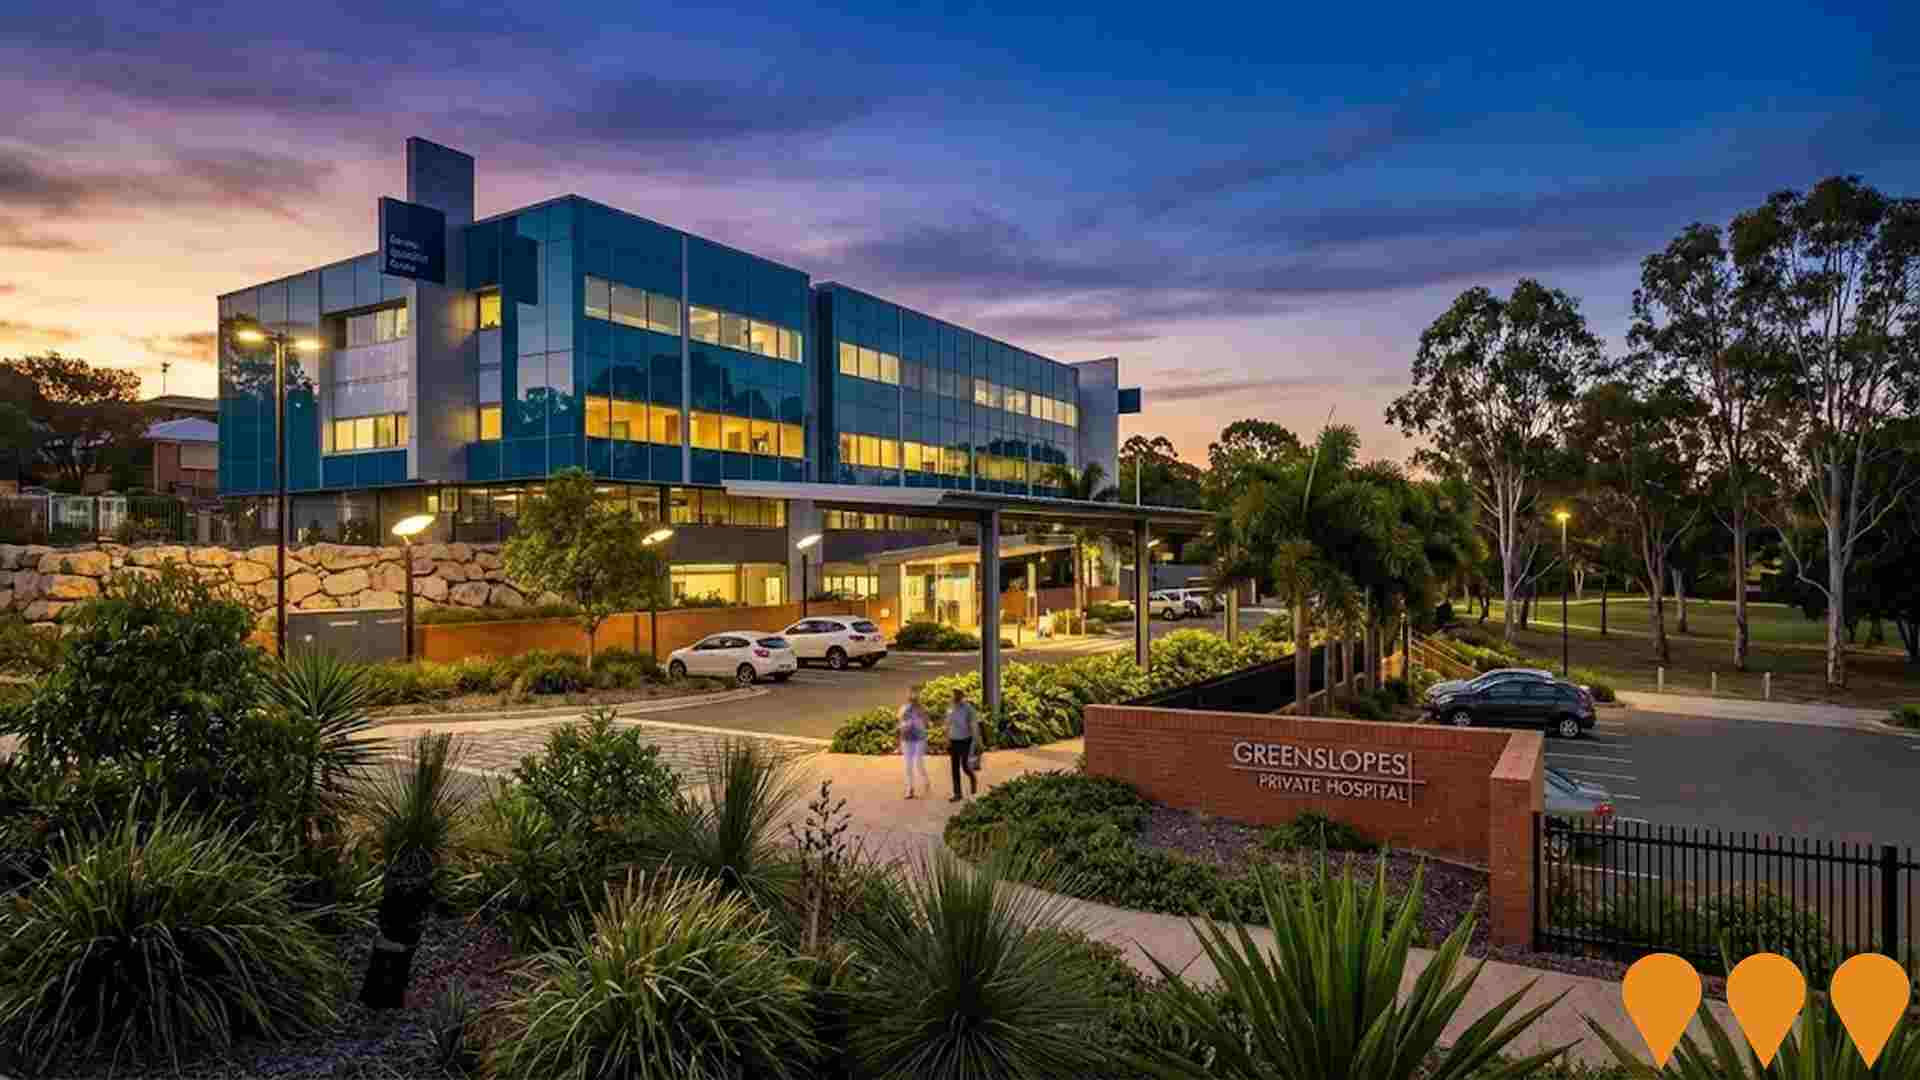
Greenslopes Private Hospital Wakerley Specialist Centre
Specialist medical centre being developed by Ramsay Health Care near Wakerley Park on New Cleveland Road, designed to bring outpatient clinics, day procedures and diagnostic services closer to Brisbane's bayside and eastern suburbs.
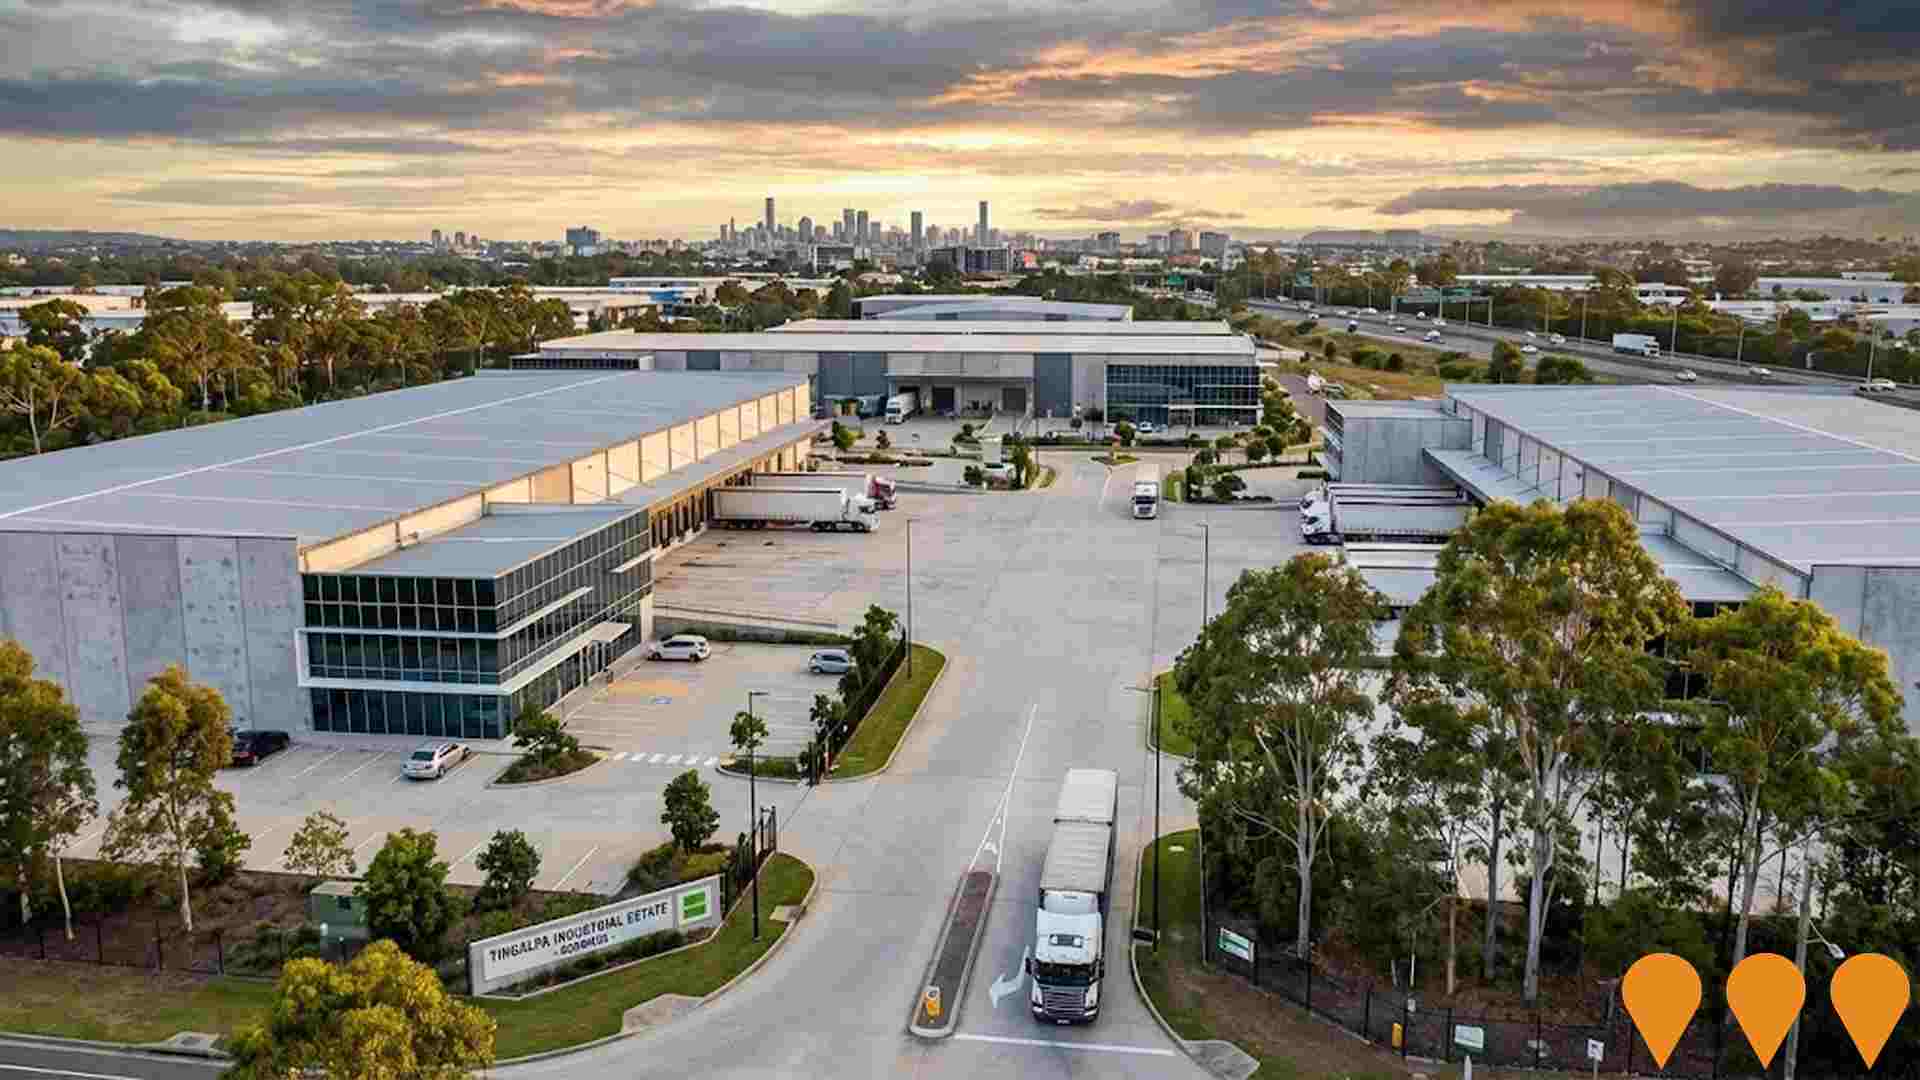
Tingalpa Industrial Estate
A fully developed industrial estate in Brisbane's TradeCoast precinct, offering large warehouse and office facilities with direct access to the Gateway Motorway and convenient links to Brisbane CBD, Airport and Port of Brisbane.
Multispace Business Park - Tingalpa
Multispace Business Park is a new commercial and industrial estate at 1631 Wynnum Road in Tingalpa, delivering about 20 strata warehouse and office units plus a large health and fitness facility with high exposure to Wynnum Road and convenient access to the Gateway Motorway. The project has been developed by Dexar Development Group with funding support from Capital Property Funds and reached practical completion in 2025, providing flexible showroom, warehouse and office spaces for trade, logistics and service businesses in Brisbane's TradeCoast corridor.
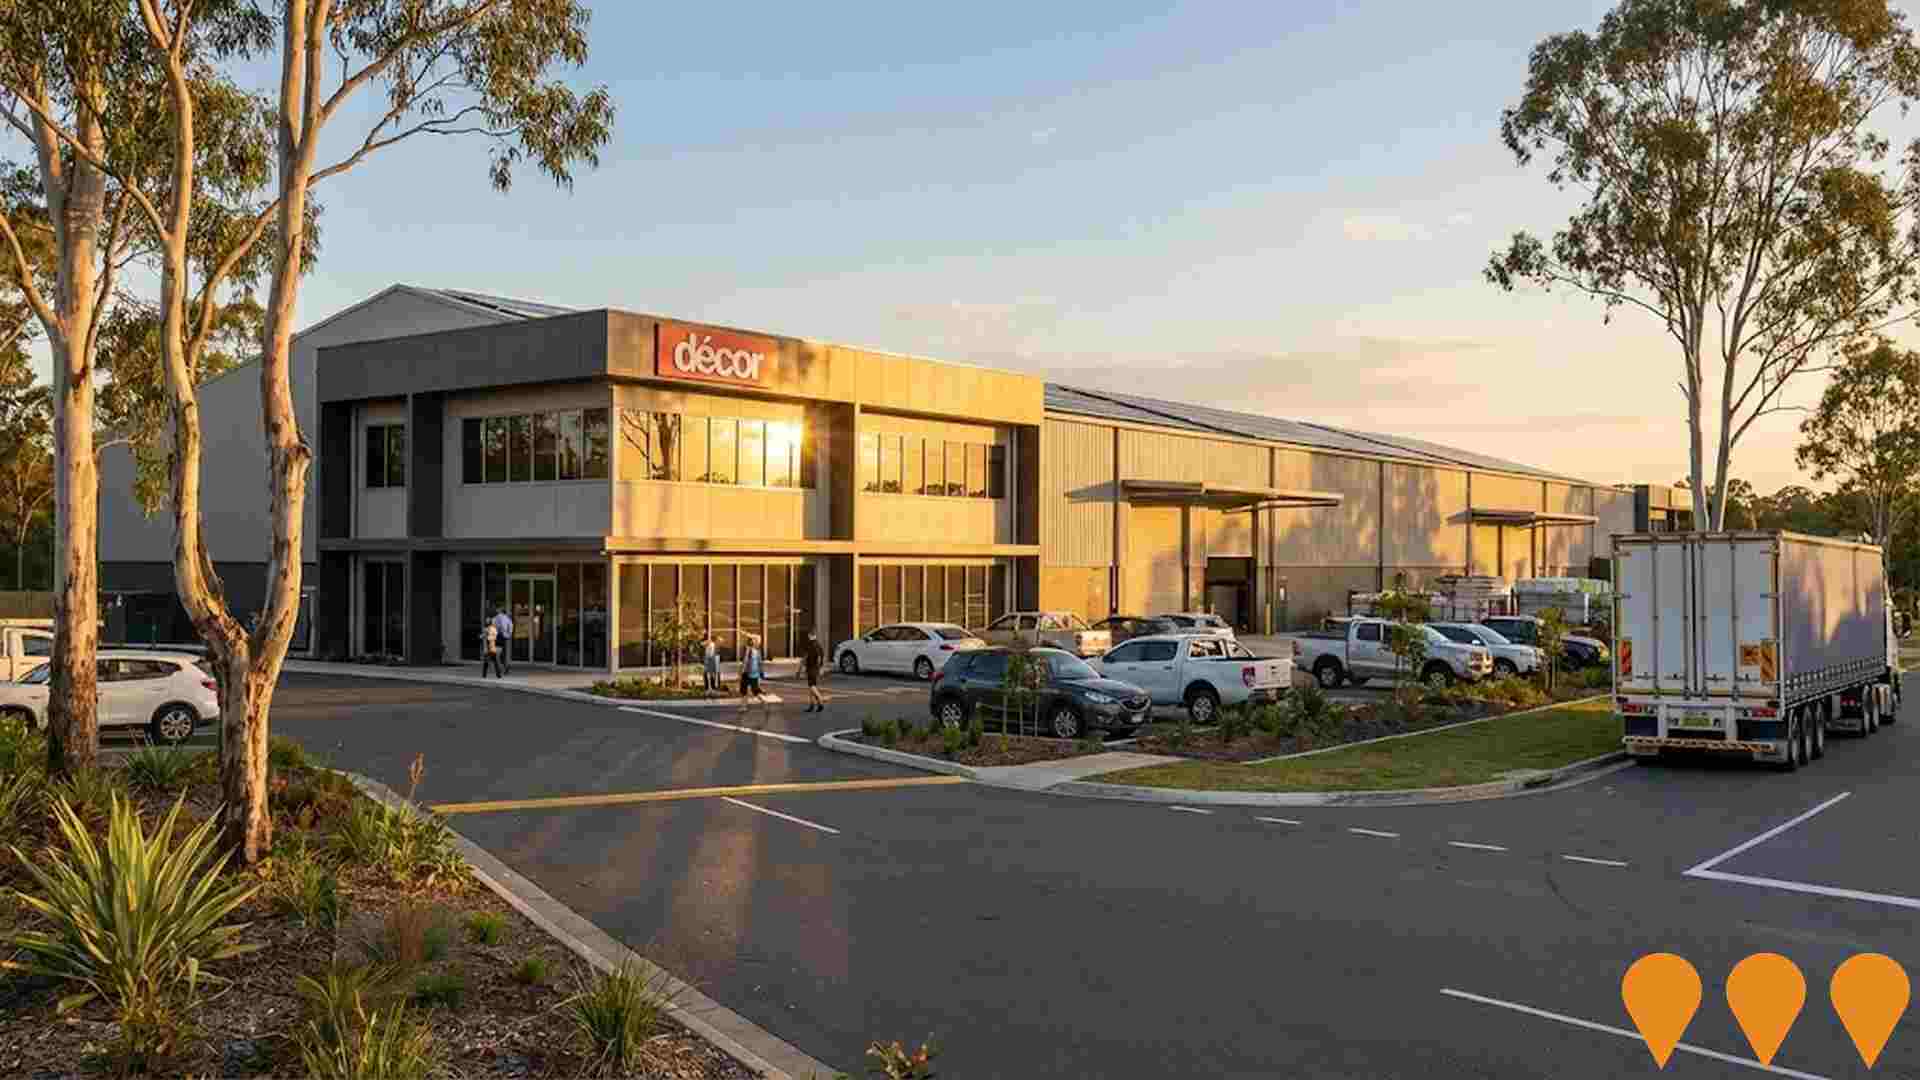
Tingalpa Central Industrial Estate
Final stage of the Tingalpa Central industrial and business park at the intersection of Wynnum and Manly Roads. The estate delivers around 20 high quality warehouse and office units plus a large gym and 134 car parks within an established mixed use precinct. Earlier stages of the business park are fully sold, and the Multispace Business Park / Southern Trade Coast Business Park component reached practical completion in late 2025. The project provides modern clear span warehousing, mezzanine offices, corporate presentation and strong main road exposure, serving a mix of small business, trade and professional tenants.
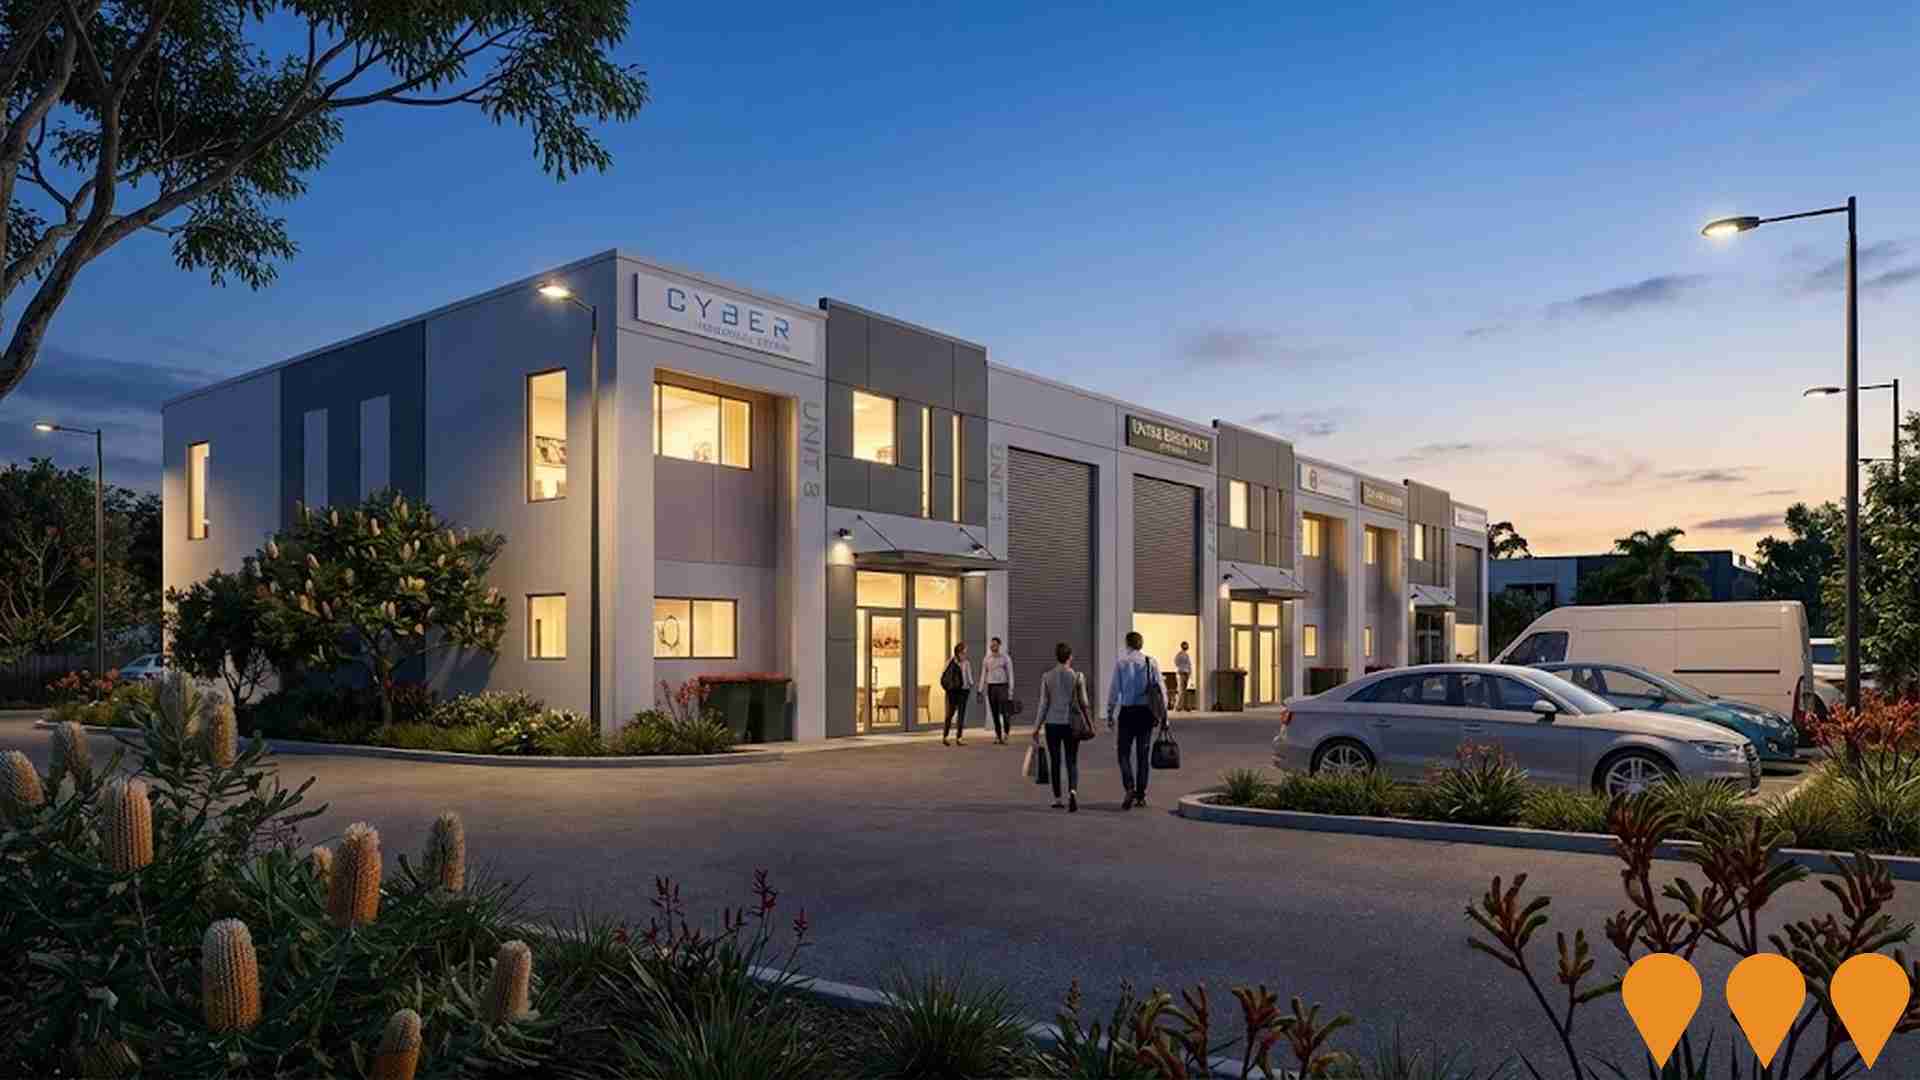
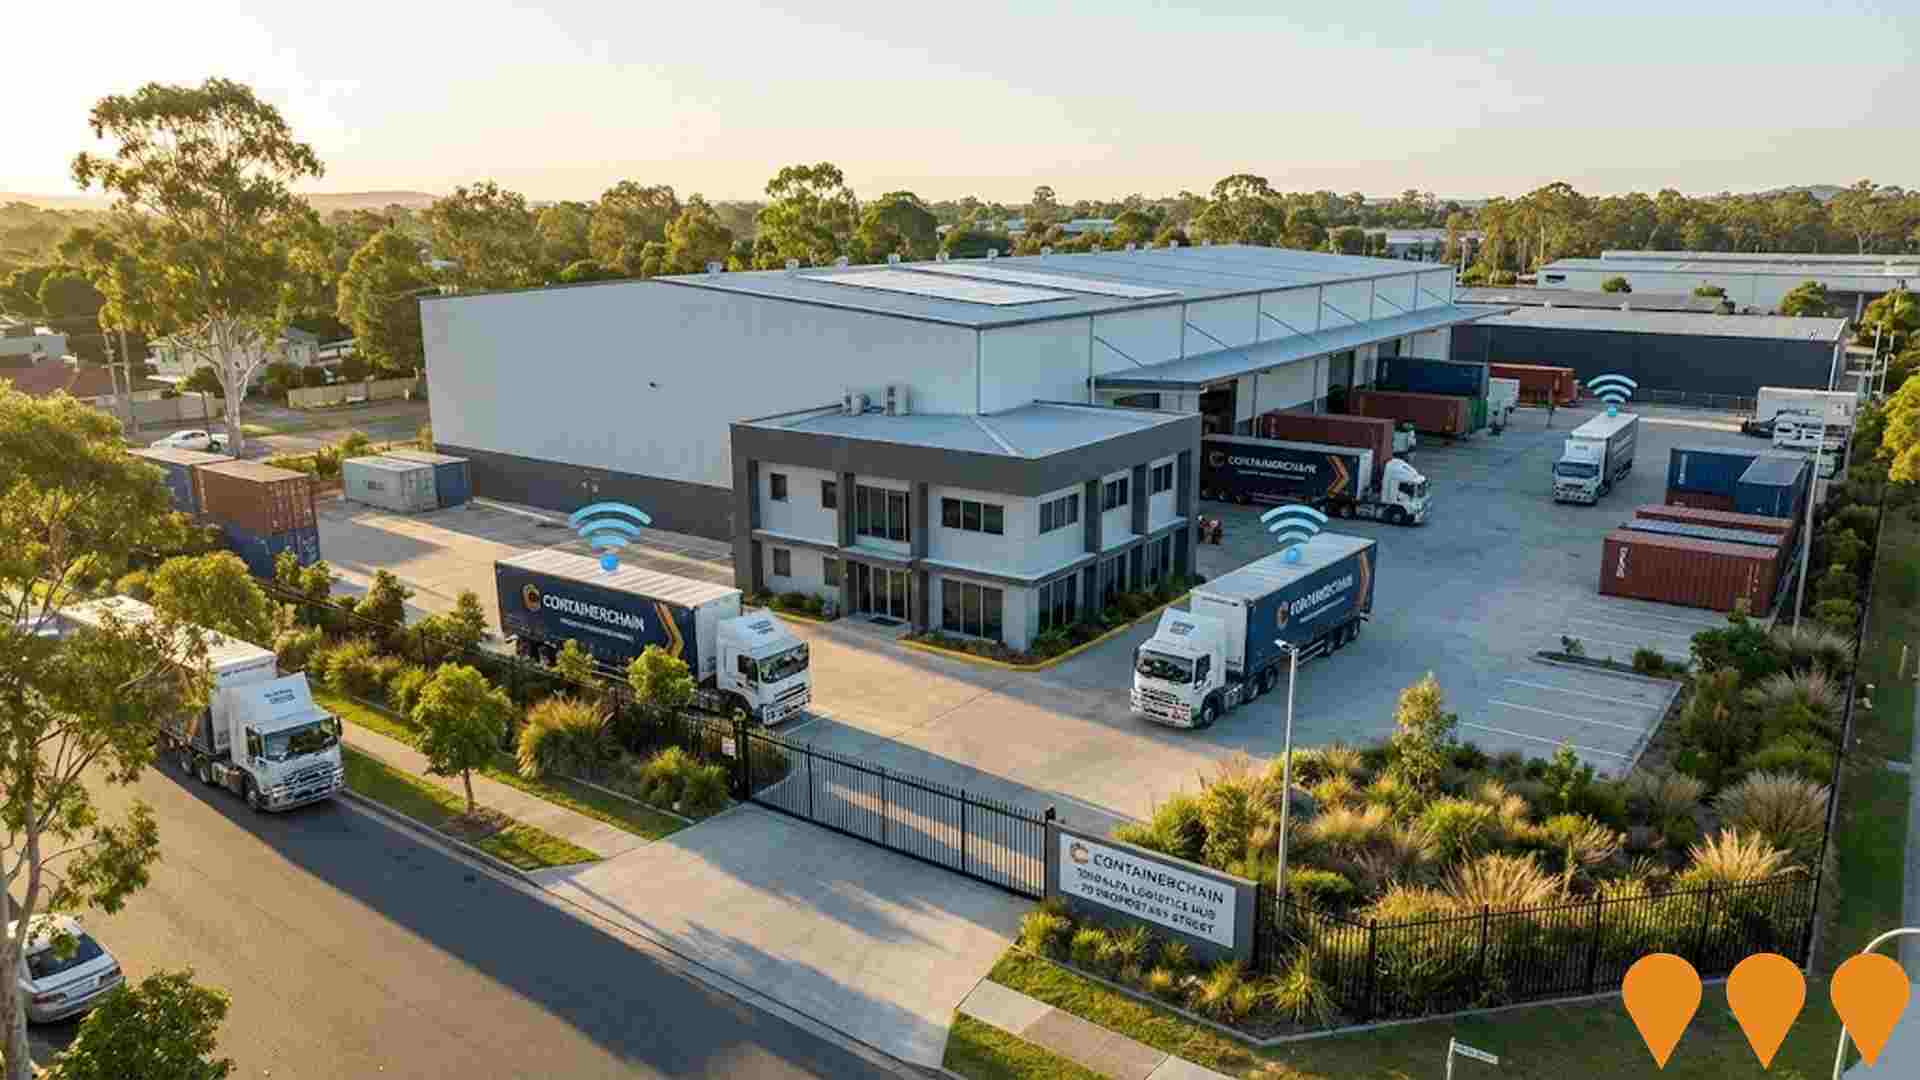
Containerchain Tingalpa Facility Expansion
Expansion of Containerchain national headquarters and logistics technology hub at 79 Proprietary Street, Tingalpa. The project adds office and operations space within the existing industrial precinct to support Containerchain digital container tracking, depot and transport management services for customers across Brisbane and the wider Australian landside logistics network.
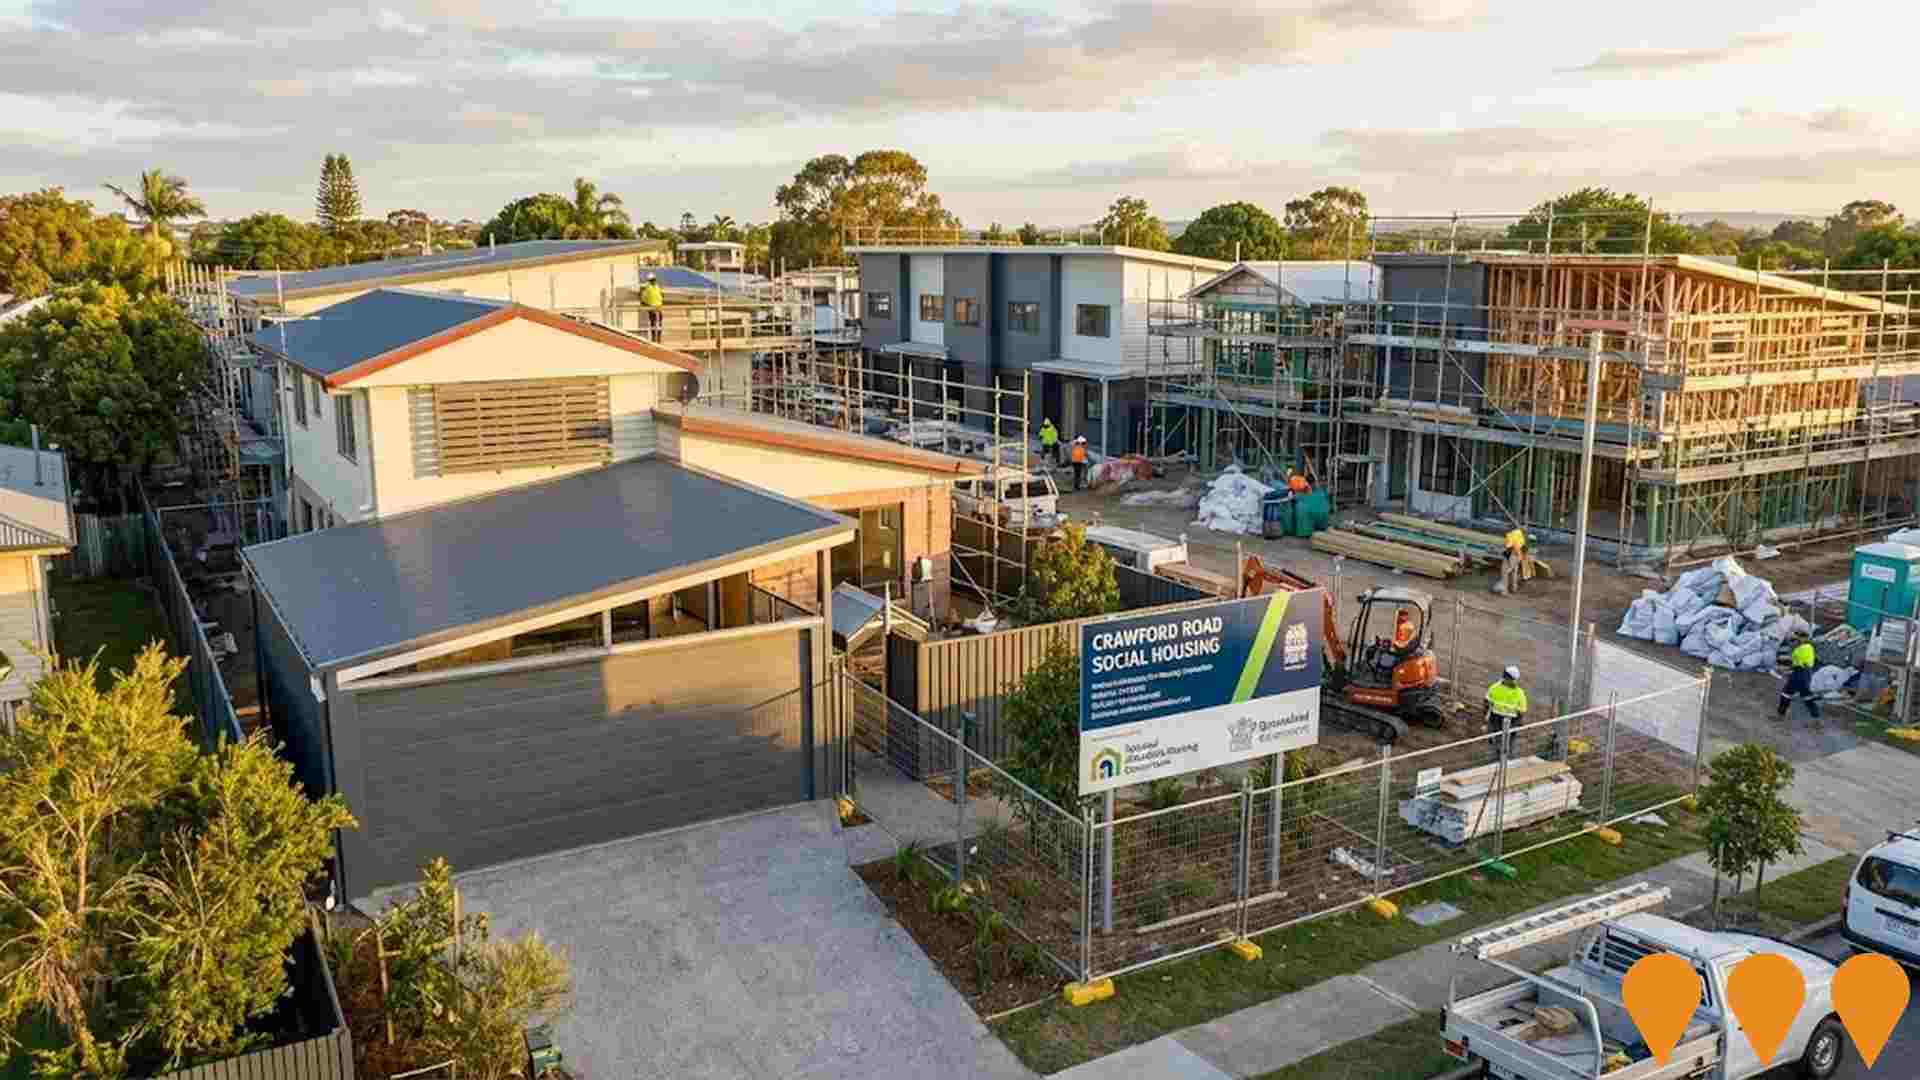
Crawford Road Social Housing and Subdivision
The project involves the development of 6 social housing units (3 Platinum and 3 Gold level) and 20 freehold lots in Wynnum West, aimed at providing affordable housing. Currently in pre-lodgement phase with Brisbane City Council, in collaboration with the National Affordable Housing Consortium and the Department of Communities, Housing and Digital Economy.
Employment
AreaSearch analysis of employment trends sees Tingalpa performing better than 90% of local markets assessed across Australia
Tingalpa has a skilled workforce with essential services sectors well represented. The unemployment rate in Tingalpa was 1.9% as of September 2025.
Employment growth over the past year was estimated at 6.8%. There were 5,855 residents employed by September 2025, with an unemployment rate of 2.1%, which is below Greater Brisbane's rate of 4.0%. Workforce participation in Tingalpa was higher at 70.0% compared to Greater Brisbane's 64.5%.
The leading employment industries among residents were health care & social assistance, construction, and education & training. Health care & social assistance had a limited presence with 14.1% employment compared to the regional rate of 16.1%. Many Tingalpa residents commute elsewhere for work based on Census data. Over the 12 months to September 2025, employment increased by 6.8%, labour force increased by 6.0%, and unemployment fell by 0.8 percentage points in Tingalpa. In Greater Brisbane, employment grew by 3.8%, labour force expanded by 3.3%, and unemployment fell by 0.5 percentage points during the same period. State-level data to November 25 shows Queensland employment contracted by 0.01% (losing 1,210 jobs), with a state unemployment rate of 4.2%. National employment forecasts from May-25 suggest national employment will expand by 6.6% over five years and 13.7% over ten years. Applying these projections to Tingalpa's employment mix suggests local employment should increase by 6.5% over five years and 13.4% over ten years, based on a simple weighting extrapolation for illustrative purposes.
Frequently Asked Questions - Employment
Income
The area exhibits notably strong income performance, ranking higher than 70% of areas assessed nationally through AreaSearch analysis
The Tingalpa SA2 had a median taxpayer income of $60,332 and an average of $69,426 in the financial year 2022, according to postcode level ATO data aggregated by AreaSearch. This is higher than national averages, with Greater Brisbane having a median income of $55,645 and an average income of $70,520 during the same period. By September 2025, estimated incomes would be approximately $68,772 (median) and $79,139 (average), based on Wage Price Index growth of 13.99% since financial year 2022. Census data shows that household, family, and personal incomes in Tingalpa cluster around the 68th percentile nationally. The largest income bracket comprises 36.3% earning between $1,500 and $2,999 weekly (3,410 residents), similar to the surrounding region where 33.3% fall into this bracket. High housing costs consume 15.4% of income in Tingalpa, but strong earnings place disposable income at the 65th percentile nationally. The area's SEIFA income ranking places it in the 6th decile.
Frequently Asked Questions - Income
Housing
Tingalpa is characterized by a predominantly suburban housing profile, with above-average rates of outright home ownership
In Tingalpa, as per the latest Census, 80.6% of dwellings were houses and 19.5% other dwellings (semi-detached, apartments, 'other'). Brisbane metro had 78.0% houses and 22.0% other dwellings. Home ownership in Tingalpa was 29.4%, similar to Brisbane metro's level. Mortgaged dwellings were 44.8% and rented ones 25.9%. The median monthly mortgage repayment was $1,900, below Brisbane metro's $2,100 but above the national average of $1,863. Median weekly rent in Tingalpa was $420, equal to Brisbane metro's figure and substantially higher than the national average of $375.
Frequently Asked Questions - Housing
Household Composition
Tingalpa features high concentrations of group households, with a fairly typical median household size
Family households account for 73.8% of all households, including 33.9% couples with children, 26.7% couples without children, and 11.8% single parent families. Non-family households constitute the remaining 26.2%, with lone person households at 22.3% and group households comprising 3.9%. The median household size is 2.6 people, which aligns with the Greater Brisbane average.
Frequently Asked Questions - Households
Local Schools & Education
The educational profile of Tingalpa exceeds national averages, with above-average qualification levels and academic performance metrics
In Tingalpa, 26.6% of residents hold university qualifications, slightly below Greater Brisbane's average of 30.5%. Bachelor degrees are the most common at 19.0%, followed by postgraduate qualifications (5.0%) and graduate diplomas (2.6%). Vocational credentials are held by 37.2% of residents aged 15 and above, with advanced diplomas at 11.5% and certificates at 25.7%.
Educational participation is high, with 26.3% currently enrolled in formal education. This includes 9.2% in primary, 6.8% in secondary, and 4.5% in tertiary education.
Frequently Asked Questions - Education
Schools Detail
Nearby Services & Amenities
Transport
Transport servicing is low compared to other areas nationally based on assessment of service frequency, route connectivity and accessibility
Transport analysis indicates 44 active transport stops in Tingalpa, comprising a mix of buses. These stops are served by 8 individual routes, collectively offering 455 weekly passenger trips. Transport accessibility is rated good, with residents typically located 241 meters from the nearest stop.
Service frequency averages 65 trips per day across all routes, equating to approximately 10 weekly trips per stop.
Frequently Asked Questions - Transport
Transport Stops Detail
Health
Health outcomes in Tingalpa are marginally below the national average with the level of common health conditions among the general population somewhat typical, though higher than the nation's average among older cohorts
Tingalpa's health indicators show below-average results with common health conditions amongst its general population being somewhat typical but higher than the national average in older cohorts. Private health cover is very high at approximately 54% of the total population (around 5,110 people), compared to Greater Brisbane's 58.6%.
Mental health issues and asthma are the most prevalent medical conditions, affecting 9.1 and 8.3% of residents respectively. About 68.4% of residents claim to be completely free from medical ailments, compared to 69.4% in Greater Brisbane. As of 2016, 16.5% of Tingalpa's population is aged 65 and over (around 1,549 people). Health outcomes amongst seniors require more attention than those of the broader population.
Frequently Asked Questions - Health
Cultural Diversity
The level of cultural diversity witnessed in Tingalpa was found to be slightly above average when compared nationally for a number of language and cultural background related metrics
Tingalpa had a cultural diversity level above average, with 14.8% of its population speaking a language other than English at home and 25.3% born overseas. Christianity was the predominant religion in Tingalpa, making up 52.9% of its population, closely aligning with Greater Brisbane's 52.5%. The top three ancestry groups were English (27.0%), Australian (24.2%), and Irish (9.4%).
Notably, New Zealanders were overrepresented at 1.4%, compared to the regional average of 1.3%, Maori at 1.6% versus 1.4%, and Samoans at 0.4% against a regional figure of 0.3%.
Frequently Asked Questions - Diversity
Age
Tingalpa's population is slightly younger than the national pattern
Tingalpa has a median age of 38 years, which is slightly higher than Greater Brisbane's figure of 36 years but equal to Australia's median age of 38 years. The age group of 35-44 years shows strong representation in Tingalpa at 16.4%, compared to Greater Brisbane, while the 15-24 age group is less prevalent at 11.3%. Between 2021 and present, the 75-84 age group has grown from 4.9% to 6.5% of Tingalpa's population. Conversely, the 25-34 age group has declined from 15.3% to 13.9%. By 2041, demographic projections indicate significant shifts in Tingalpa's age structure. The 85+ age group is projected to grow by 163%, reaching 395 people from 150. The aging population trend is evident, with those aged 65 and above comprising 82% of the projected growth. Meanwhile, the 55-64 and 15-24 age groups are expected to experience population declines.
