Chart Color Schemes
This analysis uses ABS Statistical Areas Level 2 (SA2) boundaries, which can materially differ from Suburbs and Localities (SAL) even when sharing similar names.
SA2 boundaries are defined by the Australian Bureau of Statistics and are designed to represent communities for statistical reporting (e.g., census and ERP).
Suburbs and Localities (SAL) represent commonly-used suburb/locality names (postal-style areas) and may use different geographic boundaries. For comprehensive analysis, consider reviewing both boundary types if available.
est. as @ -- *
ABS ERP | -- people | --
2021 Census | -- people
Sales Activity
Curious about local property values? Filter the chart to assess the volume and appreciation (including resales) trends and regional comparisons, or scroll to the map below view this information at an individual property level.
Find a Recent Sale
Sales Detail
Population
Murarrie lies within the top quartile of areas nationally for population growth performance according to AreaSearch analysis of recent, and medium to long-term trends
Murarrie's population is approximately 5,162 as of November 2025. This represents an increase of 387 people since the 2021 Census, which recorded a population of 4,775. The growth is inferred from ABS data showing an estimated resident population of 5,164 in June 2024 and the addition of 20 validated new addresses since the Census date. This results in a population density ratio of 611 persons per square kilometer. Murarrie's population growth of 8.1% since the 2021 Census exceeded both its SA3 area (6.4%) and SA4 region, indicating it is a growth leader in the region. Natural growth contributed approximately 56.8% to overall population gains during recent periods, with all migration factors also being positive contributors.
AreaSearch uses ABS/Geoscience Australia projections for each SA2 area released in 2024 with a base year of 2022. For areas not covered by this data and years post-2032, Queensland State Government's SA2 area projections released in 2023 based on 2021 data are adopted. However, these state projections do not provide age category splits, so AreaSearch applies proportional growth weightings aligned with the ABS Greater Capital Region projections for each age cohort. Future population trends forecast a significant increase in the top quartile of national statistical areas, with Murarrie expected to expand by 1,366 persons to 2041 based on the latest annual ERP population numbers, reflecting a total gain of 26.5% over the 17 years.
Frequently Asked Questions - Population
Development
AreaSearch assessment of residential development activity positions Murarrie among the top 25% of areas assessed nationwide
Murarrie averaged approximately 26 new dwelling approvals annually between FY-21 and FY-25. A total of 133 homes were approved during this period, with an additional 1 approved in FY-26. On average, 4.3 new residents arrived per dwelling constructed over the past five financial years.
This significant demand outpaces supply, typically leading to price growth and increased buyer competition. The average construction value of new properties was $378,000. In FY-26, $20.8 million in commercial approvals were registered, indicating moderate levels of commercial development. Compared to Greater Brisbane, Murarrie has slightly more development, with 22.0% above the regional average per person over the five-year period. This maintains good buyer choice while supporting existing property values.
New building activity shows 17.0% detached dwellings and 83.0% attached dwellings, reflecting a shift towards compact living that offers affordable entry pathways for downsizers, investors, and first-time purchasers. This marks a considerable change from the current housing mix of 73.0% houses, likely due to reduced availability of development sites and shifting lifestyle demands and affordability requirements. With approximately 140 people per dwelling approval, Murarrie exhibits characteristics of a growth area. According to AreaSearch's latest quarterly estimate, Murarrie is forecasted to gain 1,368 residents by 2041. If current development rates continue, housing supply may struggle to match population growth, potentially intensifying buyer competition and supporting price increases.
Frequently Asked Questions - Development
Infrastructure
Murarrie has emerging levels of nearby infrastructure activity, ranking in the 29thth percentile nationally
Changes to local infrastructure significantly affect an area's performance. AreaSearch has identified 25 projects that could impact the area. Notable projects include Rivermakers Masterplan, Rivermakers Masterplan, Rivermakers Masterplan, and Rivermakers Masterplan. The following list details those expected to be most relevant.
Professional plan users can use the search below to filter and access additional projects.
INFRASTRUCTURE SEARCH
 Denotes AI-based impression for illustrative purposes only, not to be taken as definitive under any circumstances. Please follow links and conduct other investigations from the project's source for actual imagery. Developers and project owners wishing us to use original imagery please Contact Us and we will do so.
Frequently Asked Questions - Infrastructure
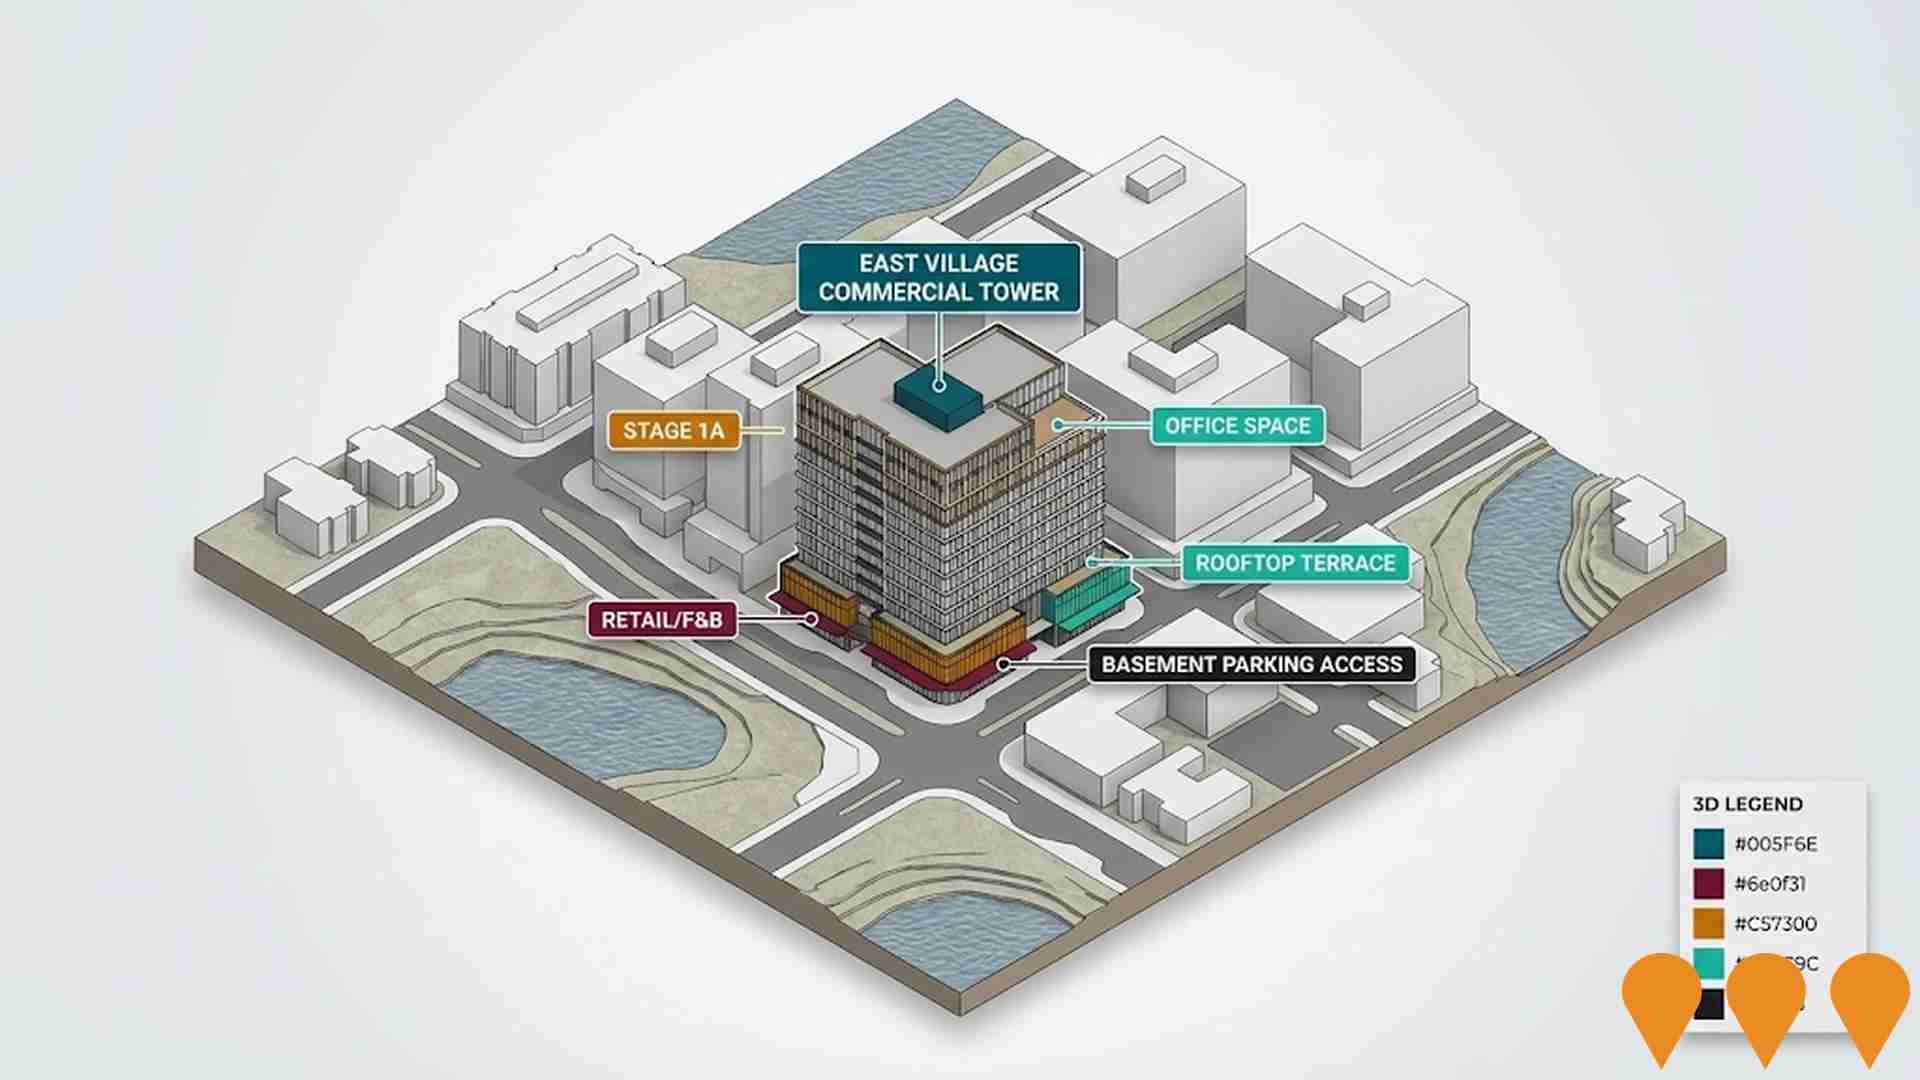
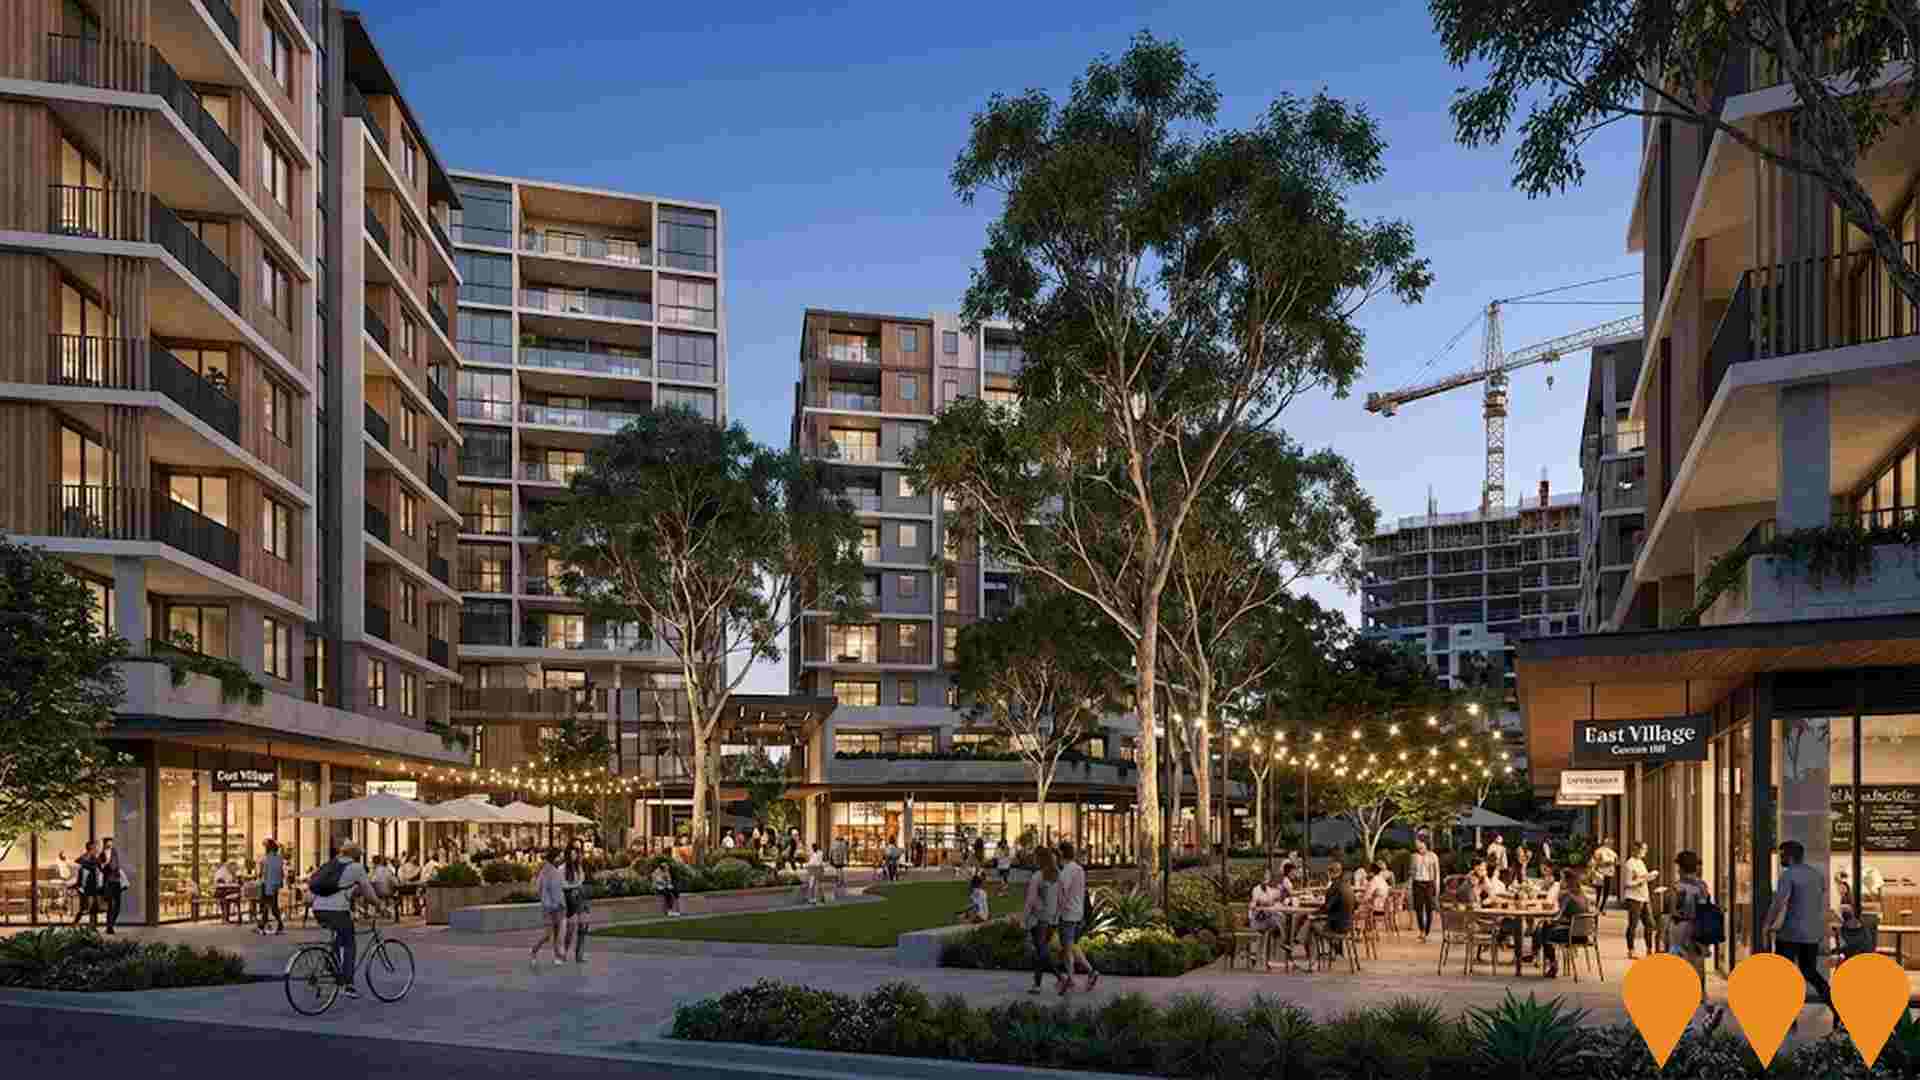
East Village Cannon Hill
Large-scale $1 billion+ mixed-use urban renewal precinct on the former CSIRO site in Cannon Hill. Features residential apartments (over 600 delivered/planned), commercial office space, retail, dining, cinema, hotel, and significant public realm. Developed by Anthony John Group in stages, with construction active across multiple buildings.
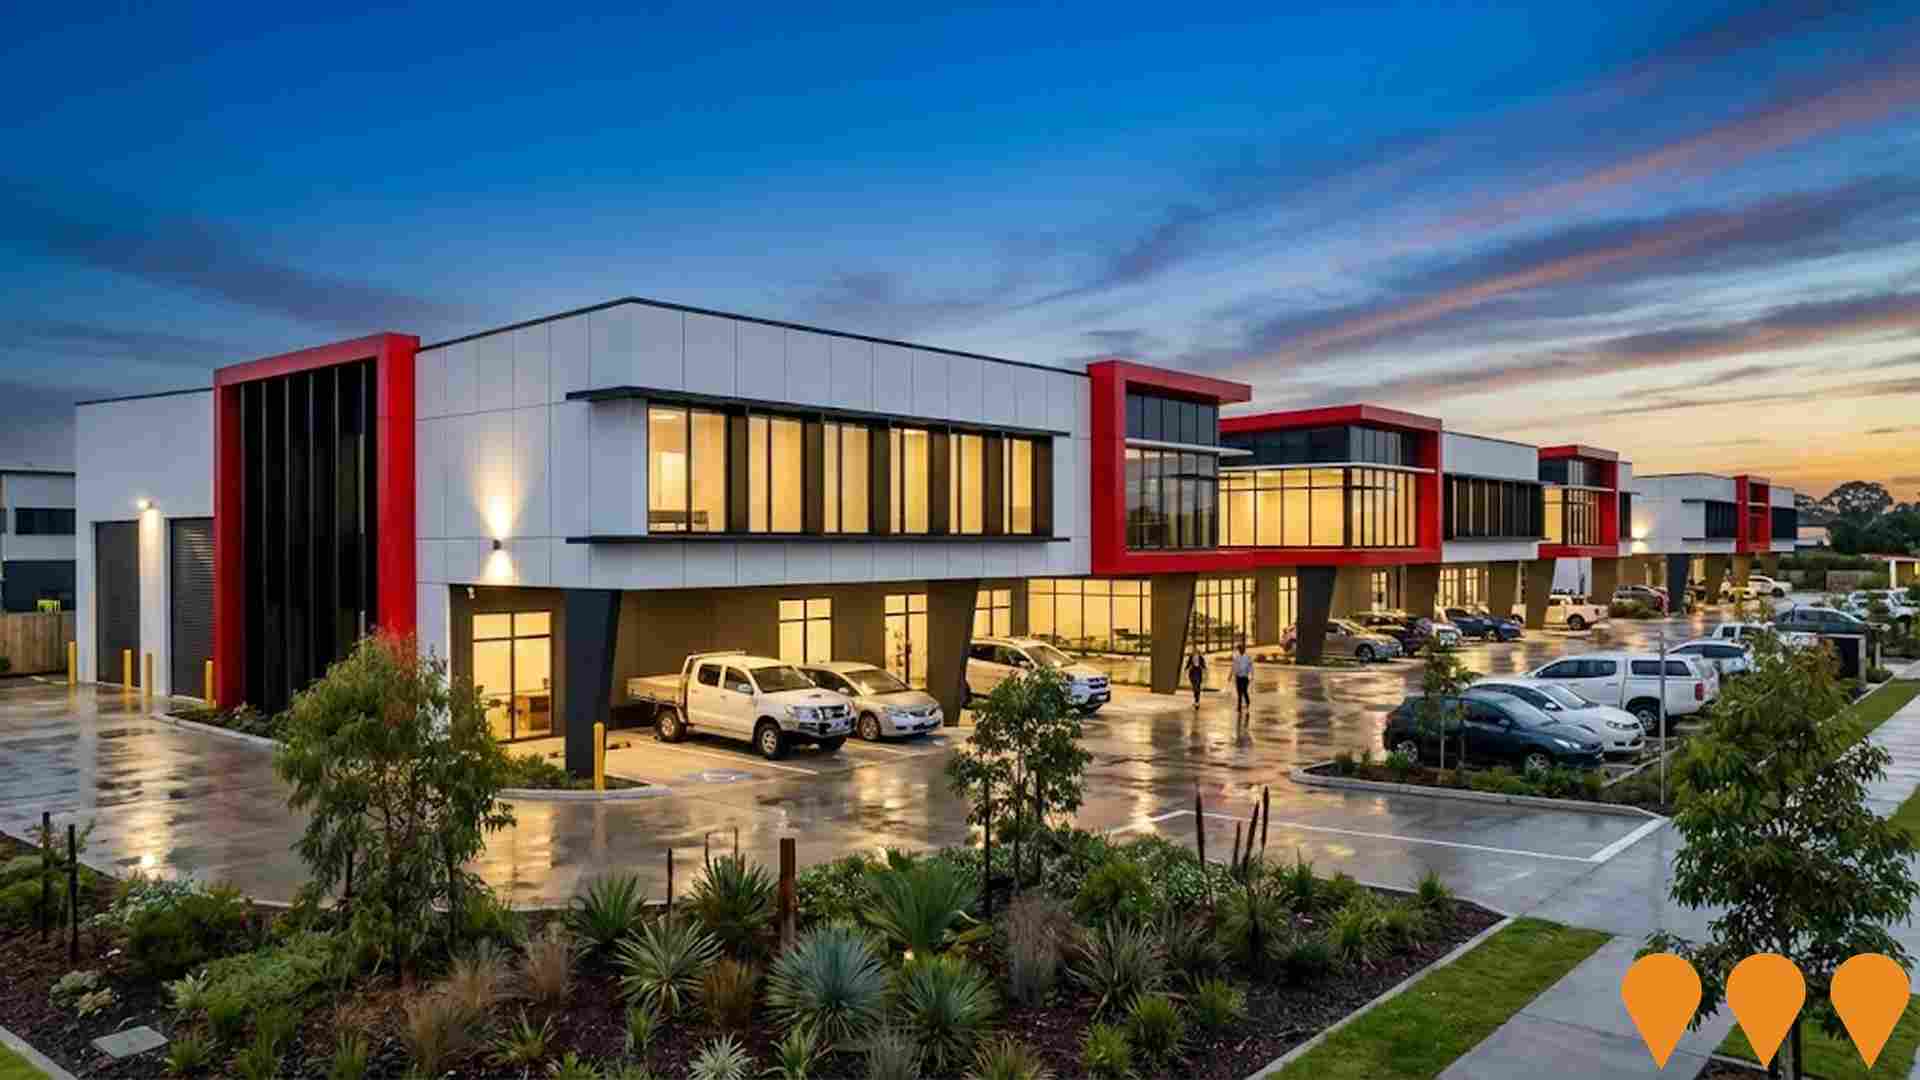
Rivermakers Masterplan
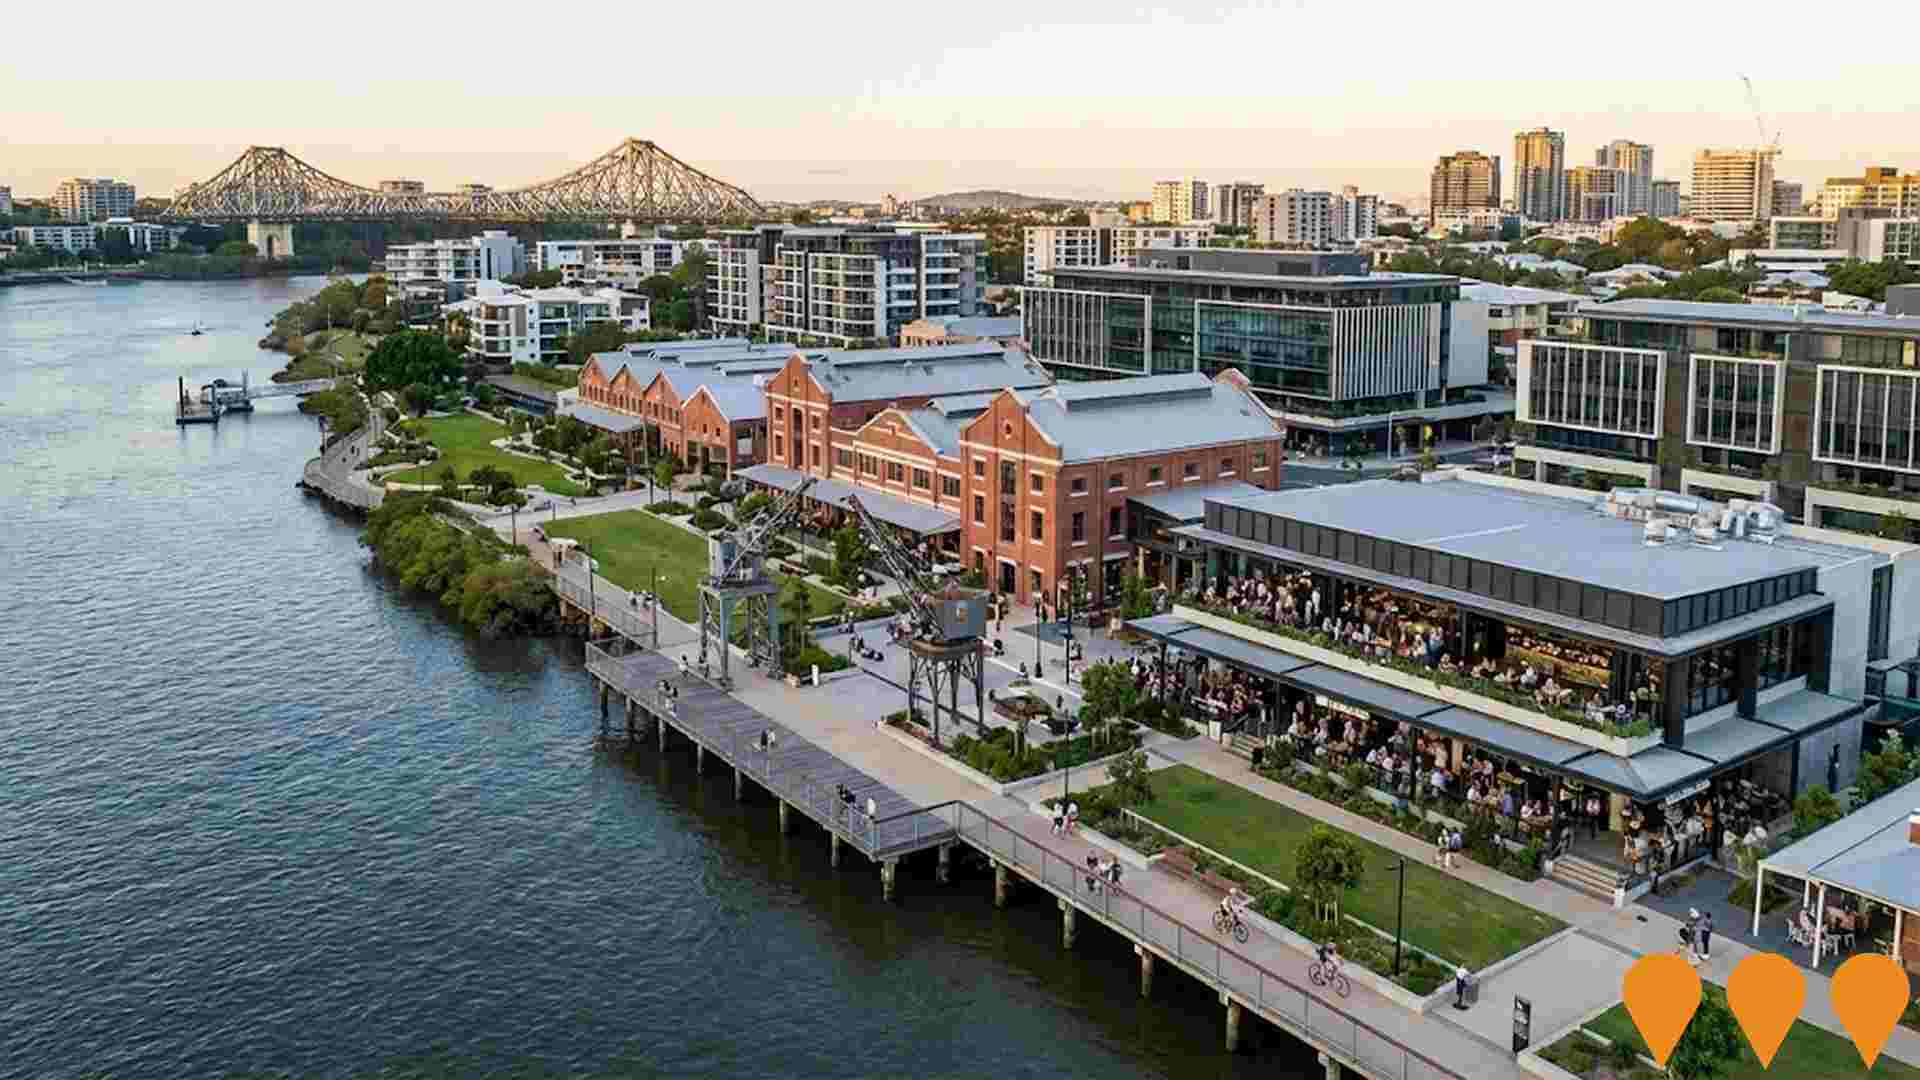
A 30-hectare riverside mixed-use masterplan comprising three distinct precincts: The Depot (mixed industrial and retail), Mixed Business and Industry precinct, and Heritage Quarter (food and beverage destination in restored heritage buildings). The project transforms a former industrial site into a vibrant destination combining artisan manufacturing, commercial spaces, dining, and entertainment. The Hills of Rivermakers dining and entertainment precinct opened December 2024, featuring restored heritage buildings from the 1910 Commonwealth Acetate of Lime Factory. The masterplan includes 250 meters of riverfront recreational space and promotes co-location of industrial and commercial activities without residential components.

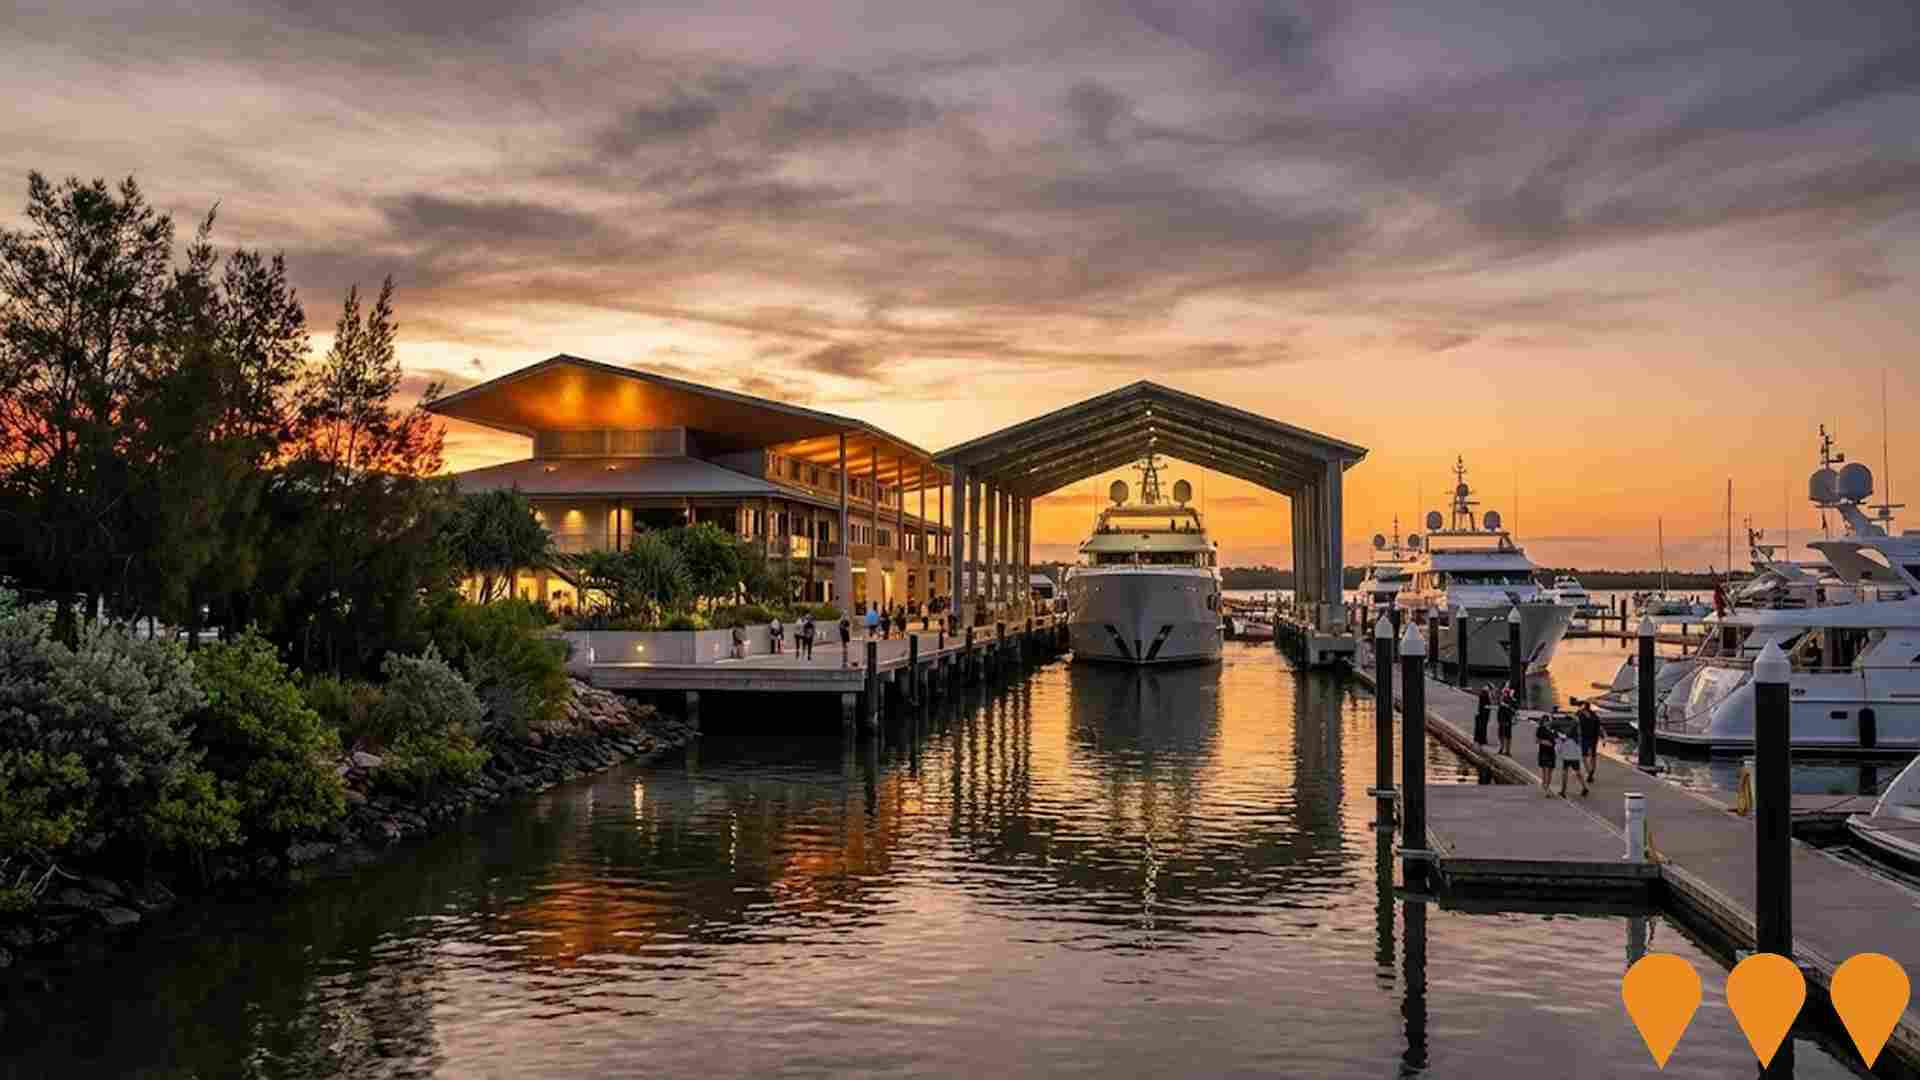
Colmslie Wharves
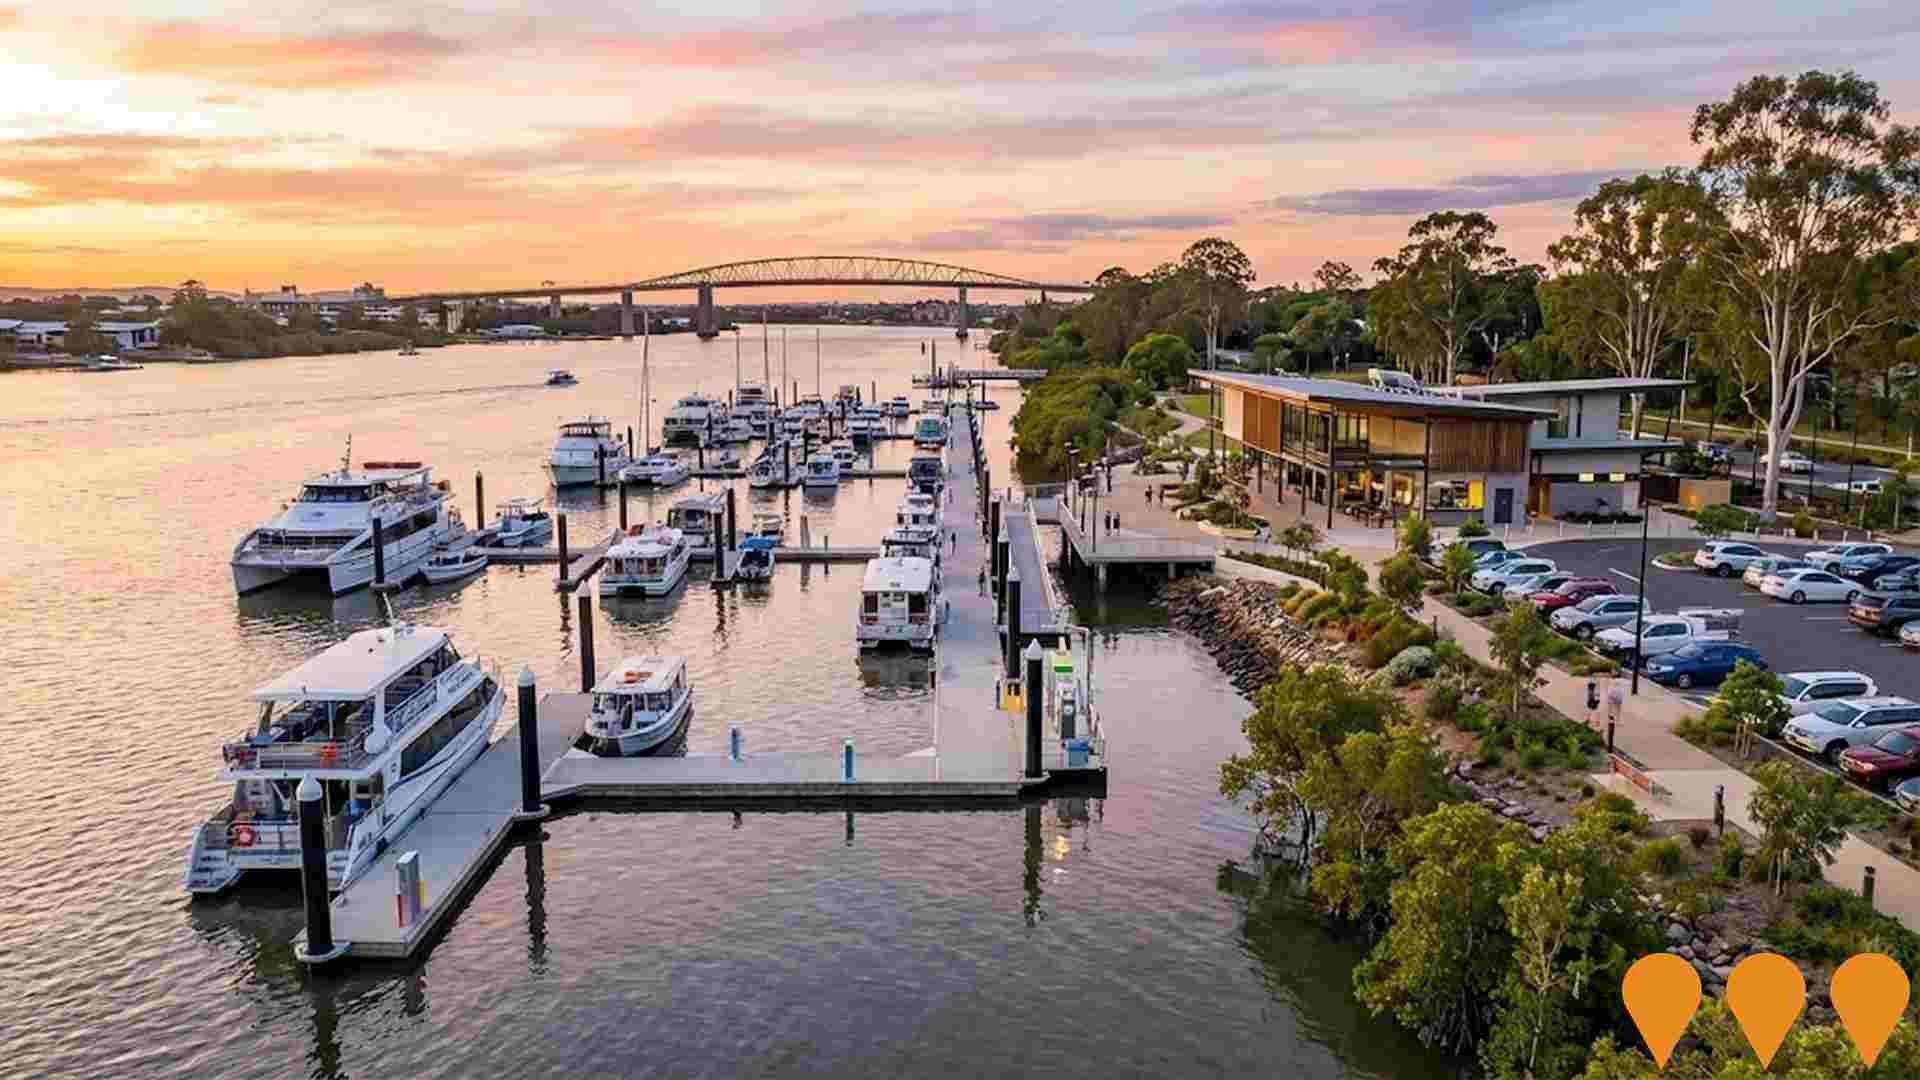
A purpose-built commercial marina providing 51 berths for vessels up to 35 metres to support Brisbane's marine tourism industry. The project addresses a critical shortage of commercial berthing following closures at Dockside Marina and Eagle Street Pier. Expected to inject over $100 million annually into the local economy, attract 109,625 additional visitors per year, and create 337 ongoing jobs across tourism, hospitality, and marine services. Backed by a $4 million Queensland Government grant from the Growing Tourism Infrastructure Fund. The marina will include on-water fuelling, wastewater pump-out facilities, car parking, and staff amenities. Construction expected to commence immediately following approval with first vessels arriving in 2026.

Employment
The exceptional employment performance in Murarrie places it among Australia's strongest labour markets
Murarrie has a highly educated workforce with strong representation in professional services. Its unemployment rate was 2.2% as of September 2025, lower than the Greater Brisbane average of 4.0%.
The area experienced an estimated employment growth of 6.4% over the past year. As of September 2025, 3,579 residents were employed, with a workforce participation rate of 75.1%, significantly higher than Greater Brisbane's 64.5%. Leading industries include health care & social assistance, professional & technical services, and construction. Murarrie specializes particularly in professional & technical services, with an employment share 1.3 times the regional level.
However, health care & social assistance has a limited presence at 13.9%, compared to the regional average of 16.1%. The area functions as an employment hub, hosting more jobs than residents and attracting workers from surrounding areas, with a ratio of 3.0 workers per resident as at the Census. Over the year to September 2025, employment increased by 6.4% while labour force grew by 6.1%, leading to a decrease in unemployment rate by 0.3 percentage points. In contrast, Greater Brisbane saw employment rise by 3.8%, labour force grow by 3.3%, and unemployment fall by 0.5 percentage points. State-wide, Queensland's employment contracted slightly by 0.01% (losing 1,210 jobs) as of 25-Nov, with an unemployment rate of 4.2%, closely aligned with the national rate of 4.3%. National employment forecasts from May-25 project a 6.6% growth over five years and 13.7% over ten years. Applying these projections to Murarrie's employment mix suggests local employment should increase by 6.7% over five years and 13.7% over ten years, though this is a simple extrapolation for illustrative purposes and does not account for localized population projections.
Frequently Asked Questions - Employment
Income
The economic profile demonstrates exceptional strength, placing the area among the top 10% nationally based on comprehensive AreaSearch income analysis
Murarrie SA2 has an exceptionally high national income level, according to the latest Australian Taxation Office data aggregated by AreaSearch for the financial year 2022. The median income among taxpayers in Murarrie is $65,569, with an average income of $81,239. In comparison, Greater Brisbane's figures are $55,645 and $70,520 respectively. Based on Wage Price Index growth of 13.99% since financial year 2022, current estimates for Murarrie would be approximately $74,742 (median) and $92,604 (average) as of September 2025. Census data shows that household, family, and personal incomes in Murarrie rank highly nationally, between the 86th and 88th percentiles. Income analysis reveals that 35.5% of locals (1,832 people) fall into the $1,500 - 2,999 weekly income category. Higher earners make up a significant portion, with 37.0% exceeding $3,000 weekly, indicating strong purchasing power within the community. High housing costs consume 15.8% of income, but strong earnings place disposable income at the 87th percentile nationally. The area's SEIFA income ranking places it in the 8th decile.
Frequently Asked Questions - Income
Housing
Murarrie is characterized by a predominantly suburban housing profile, with a higher proportion of rental properties than the broader region
Murarrie's dwelling structures, as per the latest Census, consisted of 72.7% houses and 27.4% other dwellings (semi-detached, apartments, 'other' dwellings). In comparison, Brisbane metro had 78.0% houses and 22.0% other dwellings. Home ownership in Murarrie was at 20.6%, with mortgaged dwellings at 43.7% and rented ones at 35.7%. The median monthly mortgage repayment was $2,167, above Brisbane metro's average of $2,100. Median weekly rent in Murarrie was $450, compared to Brisbane metro's $420. Nationally, Murarrie's mortgage repayments were higher than the Australian average of $1,863, and rents were substantially above the national figure of $375.
Frequently Asked Questions - Housing
Household Composition
Murarrie features high concentrations of group households, with a fairly typical median household size
Family households constitute 74.3% of all households, including 33.0% couples with children, 28.0% couples without children, and 11.5% single parent families. Non-family households account for 25.7%, with lone person households at 19.4% and group households comprising 6.0%. The median household size is 2.6 people, which aligns with the Greater Brisbane average.
Frequently Asked Questions - Households
Local Schools & Education
Murarrie shows below-average educational performance compared to national benchmarks, though pockets of achievement exist
Murarrie's residents aged 15+ have a higher proportion with university qualifications (35.1%) compared to the SA4 region (23.7%) and Queensland (25.7%). Bachelor degrees are most common at 24.3%, followed by postgraduate qualifications (7.3%) and graduate diplomas (3.5%). Vocational credentials are also prevalent, with 34.5% of residents holding such qualifications, including advanced diplomas (12.6%) and certificates (21.9%). Educational participation is high, with 29.3% currently enrolled in formal education, comprising 9.4% in primary, 7.4% in secondary, and 6.5% in tertiary education.
Educational participation is notably high, with 29.3% of residents currently enrolled in formal education. This includes 9.4% in primary education, 7.4% in secondary education, and 6.5% pursuing tertiary education.
Frequently Asked Questions - Education
Schools Detail
Nearby Services & Amenities
Transport
Transport servicing is good compared to other areas nationally based on assessment of service frequency, route connectivity and accessibility
Murarrie has 16 active public transport stops offering a mix of train and bus services. These stops are served by 28 different routes, collectively facilitating 2,572 weekly passenger trips. Transport accessibility is rated good with residents typically located 257 meters from the nearest stop.
Service frequency averages 367 trips per day across all routes, equating to approximately 160 weekly trips per individual stop.
Frequently Asked Questions - Transport
Transport Stops Detail
Health
Murarrie's residents are extremely healthy with prevalence of common health conditions low among the general population though higher than the nation's average across older, at risk cohorts
Analysis of health metrics shows strong performance throughout Murarrie. Prevalence of common health conditions is low among the general population, but higher than the national average across older, at-risk cohorts. The rate of private health cover is exceptionally high, approximately 61% of the total population (3,138 people), compared to 58.6% across Greater Brisbane and a national average of 55.3%.
The most common medical conditions in the area are mental health issues and asthma, impacting 9.1 and 8.0% of residents respectively. A total of 72.2% of residents declared themselves completely clear of medical ailments, compared to 69.4% across Greater Brisbane. The area has 9.4% of residents aged 65 and over (484 people), which is lower than the 16.7% in Greater Brisbane but requires more attention due to higher prevalence of health conditions among older residents.
Frequently Asked Questions - Health
Cultural Diversity
The level of cultural diversity witnessed in Murarrie was found to be slightly above average when compared nationally for a number of language and cultural background related metrics
Murarrie's population showed higher linguistic diversity, with 15.9% speaking a language other than English at home, compared to the broader area. Born overseas, 28.1% of Murarrie residents were born outside Australia. Christianity was the predominant religion in Murarrie, accounting for 49.0%.
However, Judaism's representation was higher than average, with 0.2%, compared to Greater Brisbane's 0.1%. The top three ancestral groups were English (26.0%), Australian (23.0%), and Irish (9.7%). Notably, New Zealanders made up 1.6% of Murarrie's population, higher than the regional average of 1.3%. Maori representation was 0.9%, lower than the broader area's 1.4%. South Africans comprised 0.7%, slightly below the regional average of 0.8%.
Frequently Asked Questions - Diversity
Age
Murarrie's population is younger than the national pattern
Murarrie's median age is 35 years, nearly matching Greater Brisbane's average of 36 years, and somewhat younger than Australia's average of 38 years. Compared to Greater Brisbane, Murarrie has a higher percentage of residents aged 35-44 (18.2%) but fewer residents aged 65-74 (5.5%). Between the 2021 Census and the present, the population aged 15-24 has grown from 12.1% to 13.2%, while the 55-64 cohort has increased from 9.4% to 10.5%. Conversely, the 5-14 age group has declined from 12.3% to 10.7%, and the 25-34 age group has dropped from 18.6% to 17.0%. By 2041, population forecasts indicate significant demographic changes for Murarrie. The 45-54 cohort is projected to grow by 47%, adding 369 residents to reach a total of 1,150. In contrast, the 0-4 age group shows minimal growth of just 4% (12 people).
