Chart Color Schemes
This analysis uses ABS Statistical Areas Level 2 (SA2) boundaries, which can materially differ from Suburbs and Localities (SAL) even when sharing similar names.
SA2 boundaries are defined by the Australian Bureau of Statistics and are designed to represent communities for statistical reporting (e.g., census and ERP).
Suburbs and Localities (SAL) represent commonly-used suburb/locality names (postal-style areas) and may use different geographic boundaries. For comprehensive analysis, consider reviewing both boundary types if available.
est. as @ -- *
ABS ERP | -- people | --
2021 Census | -- people
Sales Activity
Curious about local property values? Filter the chart to assess the volume and appreciation (including resales) trends and regional comparisons, or scroll to the map below view this information at an individual property level.
Find a Recent Sale
Sales Detail
Population
An assessment of population growth drivers in Hawthorne reveals an overall ranking slightly below national averages considering recent, and medium term trends
Hawthorne's population is around 5,705 as of November 2025. This reflects an increase of 572 people since the 2021 Census, which reported a population of 5,133 people. The change is inferred from the estimated resident population of 5,695 from the ABS as of June 2024 and an additional 57 validated new addresses since the Census date. This level of population equates to a density ratio of 4,104 persons per square kilometer. Hawthorne's growth rate of 11.1% since the 2021 census exceeded the national average of 8.9%. Population growth was primarily driven by overseas migration contributing approximately 55.3% of overall population gains during recent periods.
AreaSearch adopts ABS/Geoscience Australia projections for each SA2 area, released in 2024 with a base year of 2022. For areas not covered and years post-2032, Queensland State Government's SA2 area projections are adopted, released in 2023 based on 2021 data. These state projections do not provide age category splits; hence proportional growth weightings in line with ABS Greater Capital Region projections are applied where utilised. Future population dynamics anticipate an increase just below the median of statistical areas analysed by AreaSearch, with Hawthorne expected to increase by 488 persons to reach approximately 6,193 by 2041 based on the latest annual ERP population numbers, reflecting a gain of 8.4% in total over the 17 years.
Frequently Asked Questions - Population
Development
AreaSearch analysis of residential development drivers sees Hawthorne recording a relatively average level of approval activity when compared to local markets analysed countrywide
Hawthorne has received around 18 dwelling approvals annually over the past five financial years, totalling 91 homes. As of FY26, 9 approvals have been recorded. On average, 3.9 people move to the area each year for every dwelling built between FY21 and FY25, indicating high demand exceeding new supply. New dwellings are developed at an average cost of $837,000, targeting the premium segment with upmarket properties.
This financial year has seen $813,000 in commercial approvals, reflecting Hawthorne's residential nature. Compared to Greater Brisbane, Hawthorne records approximately 66% of building activity per person and ranks among the 32nd percentile nationally, suggesting relatively constrained buyer choice and interest in existing properties due to its established nature and potential planning limitations. New development consists of 67.0% detached houses and 33.0% townhouses or apartments, offering options across different price points from family homes to more affordable compact living. With around 499 people per dwelling approval, Hawthorne indicates a developed market.
Population forecasts suggest Hawthorne will gain 478 residents by 2041. Current construction rates appear balanced with future demand, maintaining steady market conditions without excessive price pressure.
Frequently Asked Questions - Development
Infrastructure
Hawthorne has very high levels of nearby infrastructure activity, ranking in the top 10% nationally
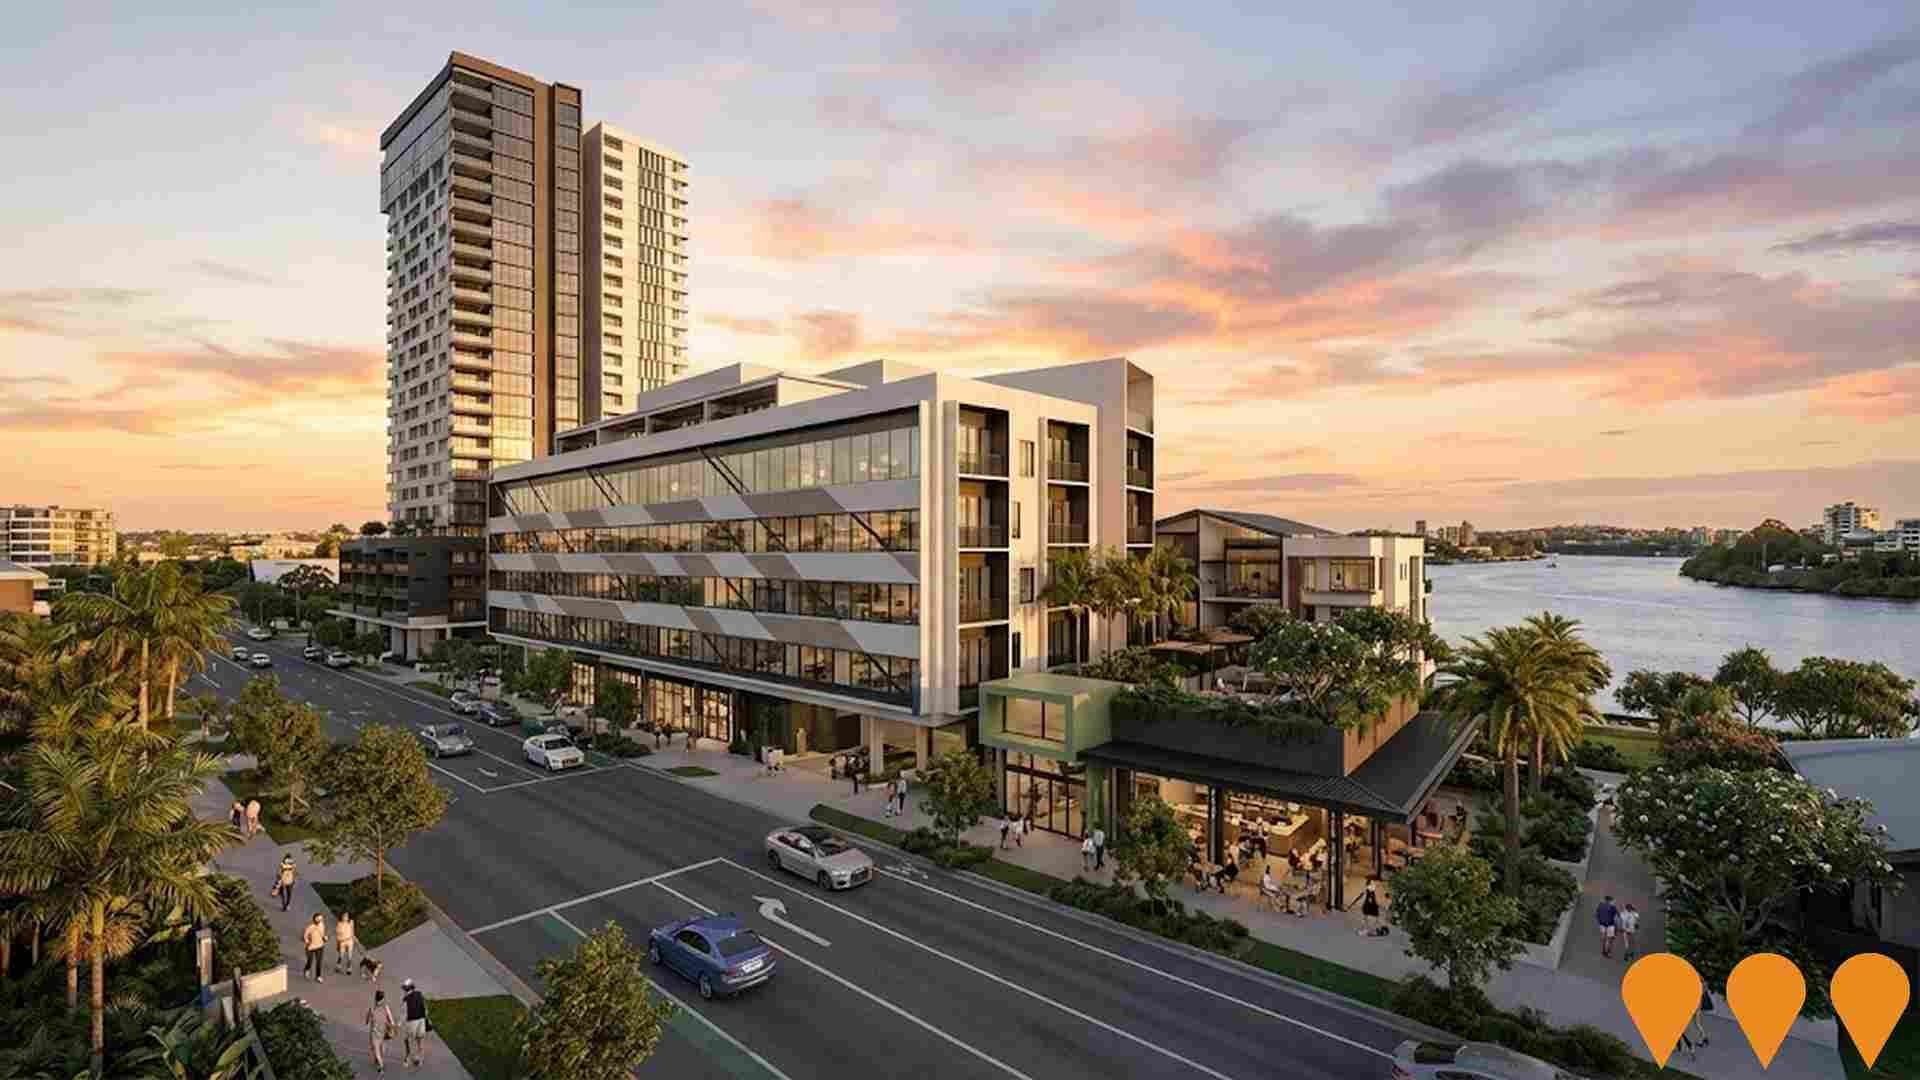
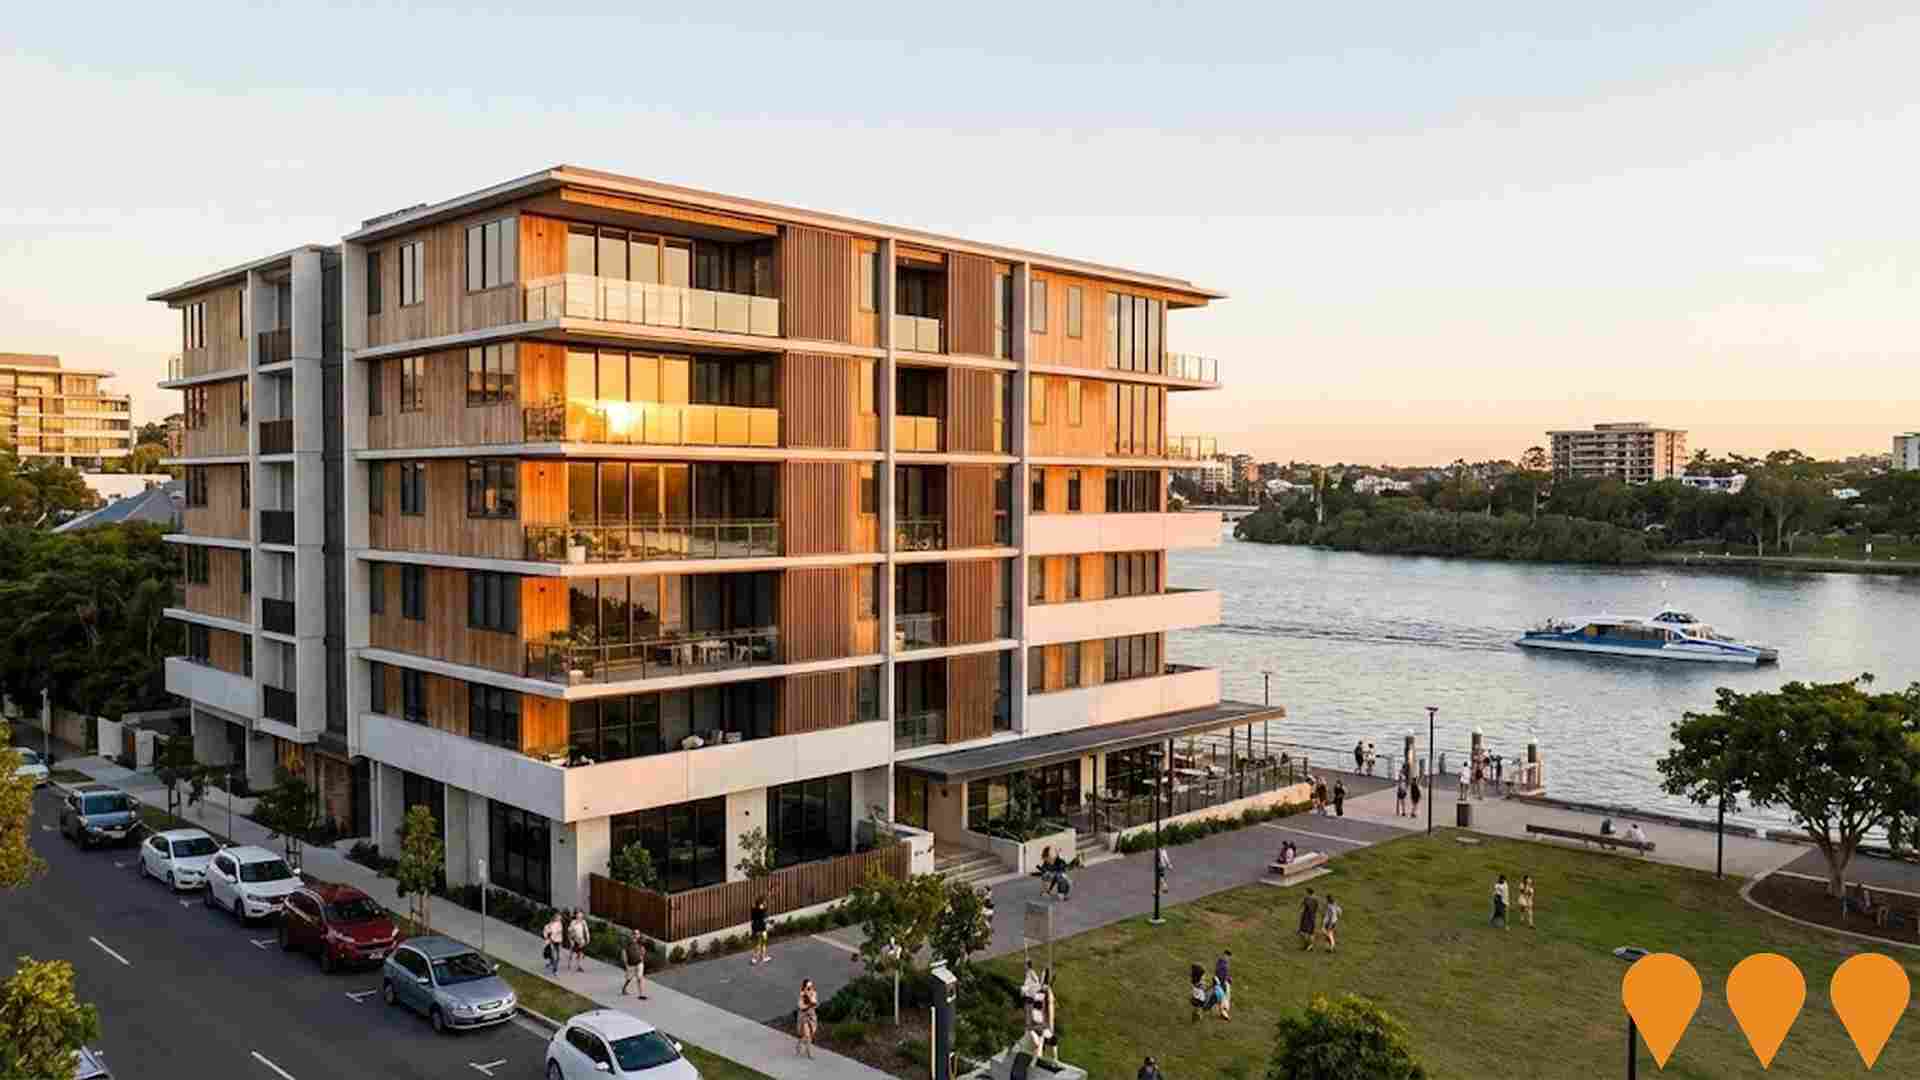
Area infrastructure changes significantly influence local performance. AreaSearch identified eight projects potentially impacting the area. Major initiatives include Skyring Terrace Road Upgrade, Bulimba Barracks Urban Renewal Project, VOIR, and Brisbane 2032 Games Venue Infrastructure Program. The following details those likely most relevant.
Professional plan users can use the search below to filter and access additional projects.
INFRASTRUCTURE SEARCH
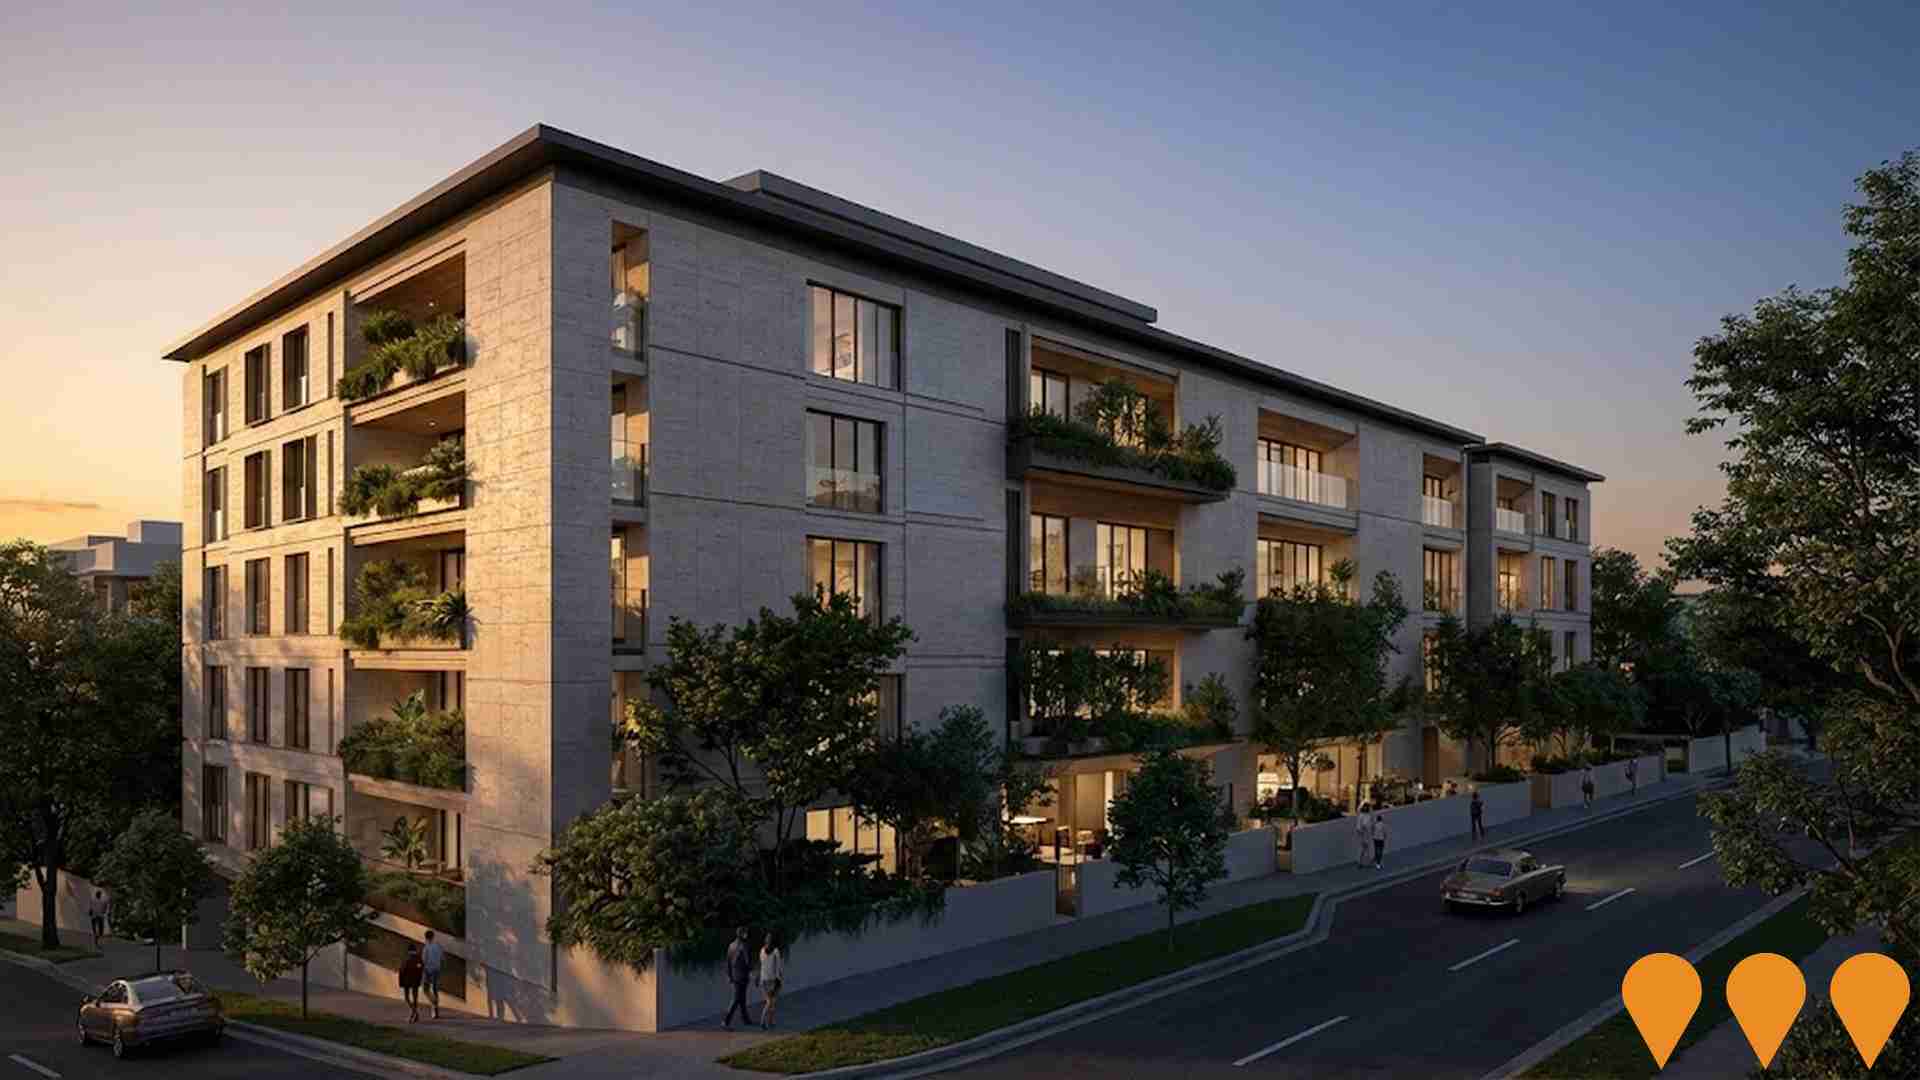
 Denotes AI-based impression for illustrative purposes only, not to be taken as definitive under any circumstances. Please follow links and conduct other investigations from the project's source for actual imagery. Developers and project owners wishing us to use original imagery please Contact Us and we will do so.
Frequently Asked Questions - Infrastructure
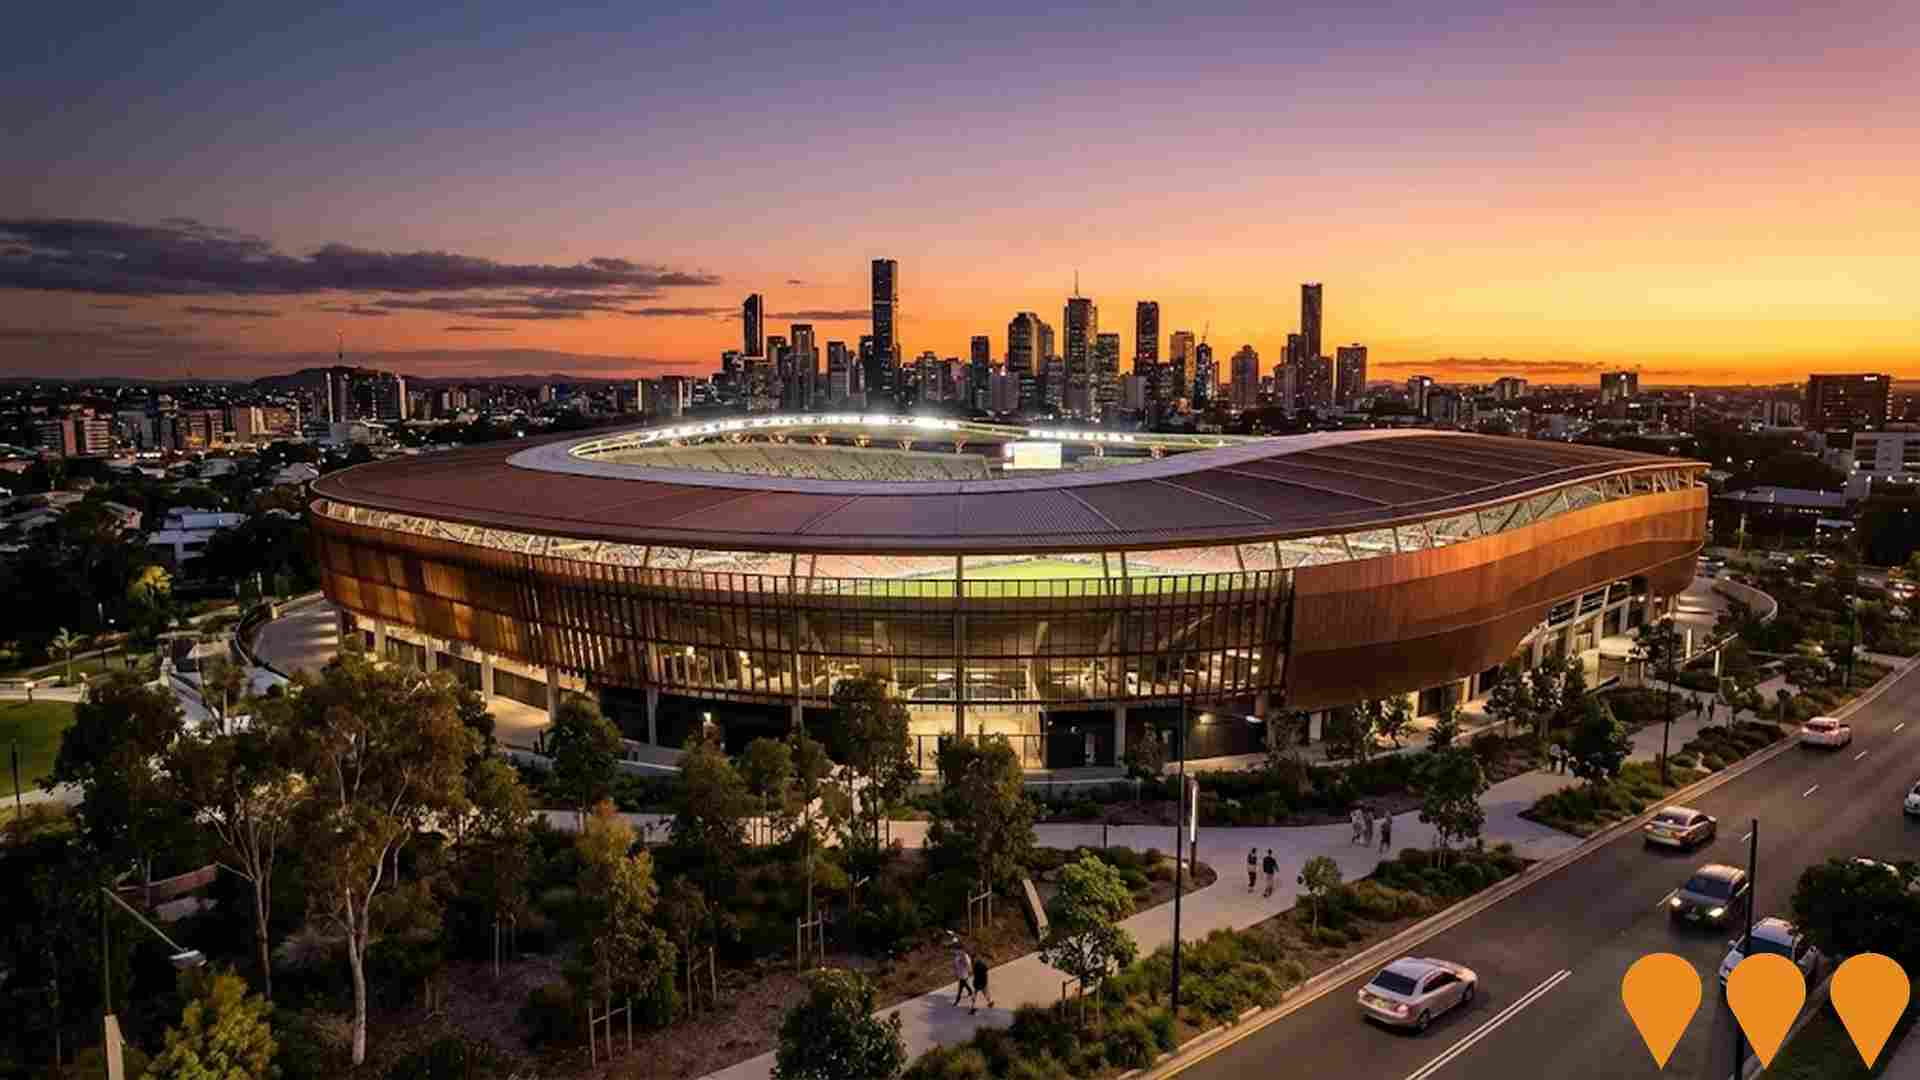
Brisbane 2032 Games Venue Infrastructure Program
The $7.1 billion Games Venue Infrastructure Program involves the planning and delivery of 17 new and upgraded venues across Queensland, including the new 63,000-seat Brisbane Stadium at Victoria Park and the National Aquatic Centre. Led by the Games Independent Infrastructure and Coordination Authority (GIICA), the program aims to deliver long-term sporting and community legacy benefits for Brisbane and regional Queensland.
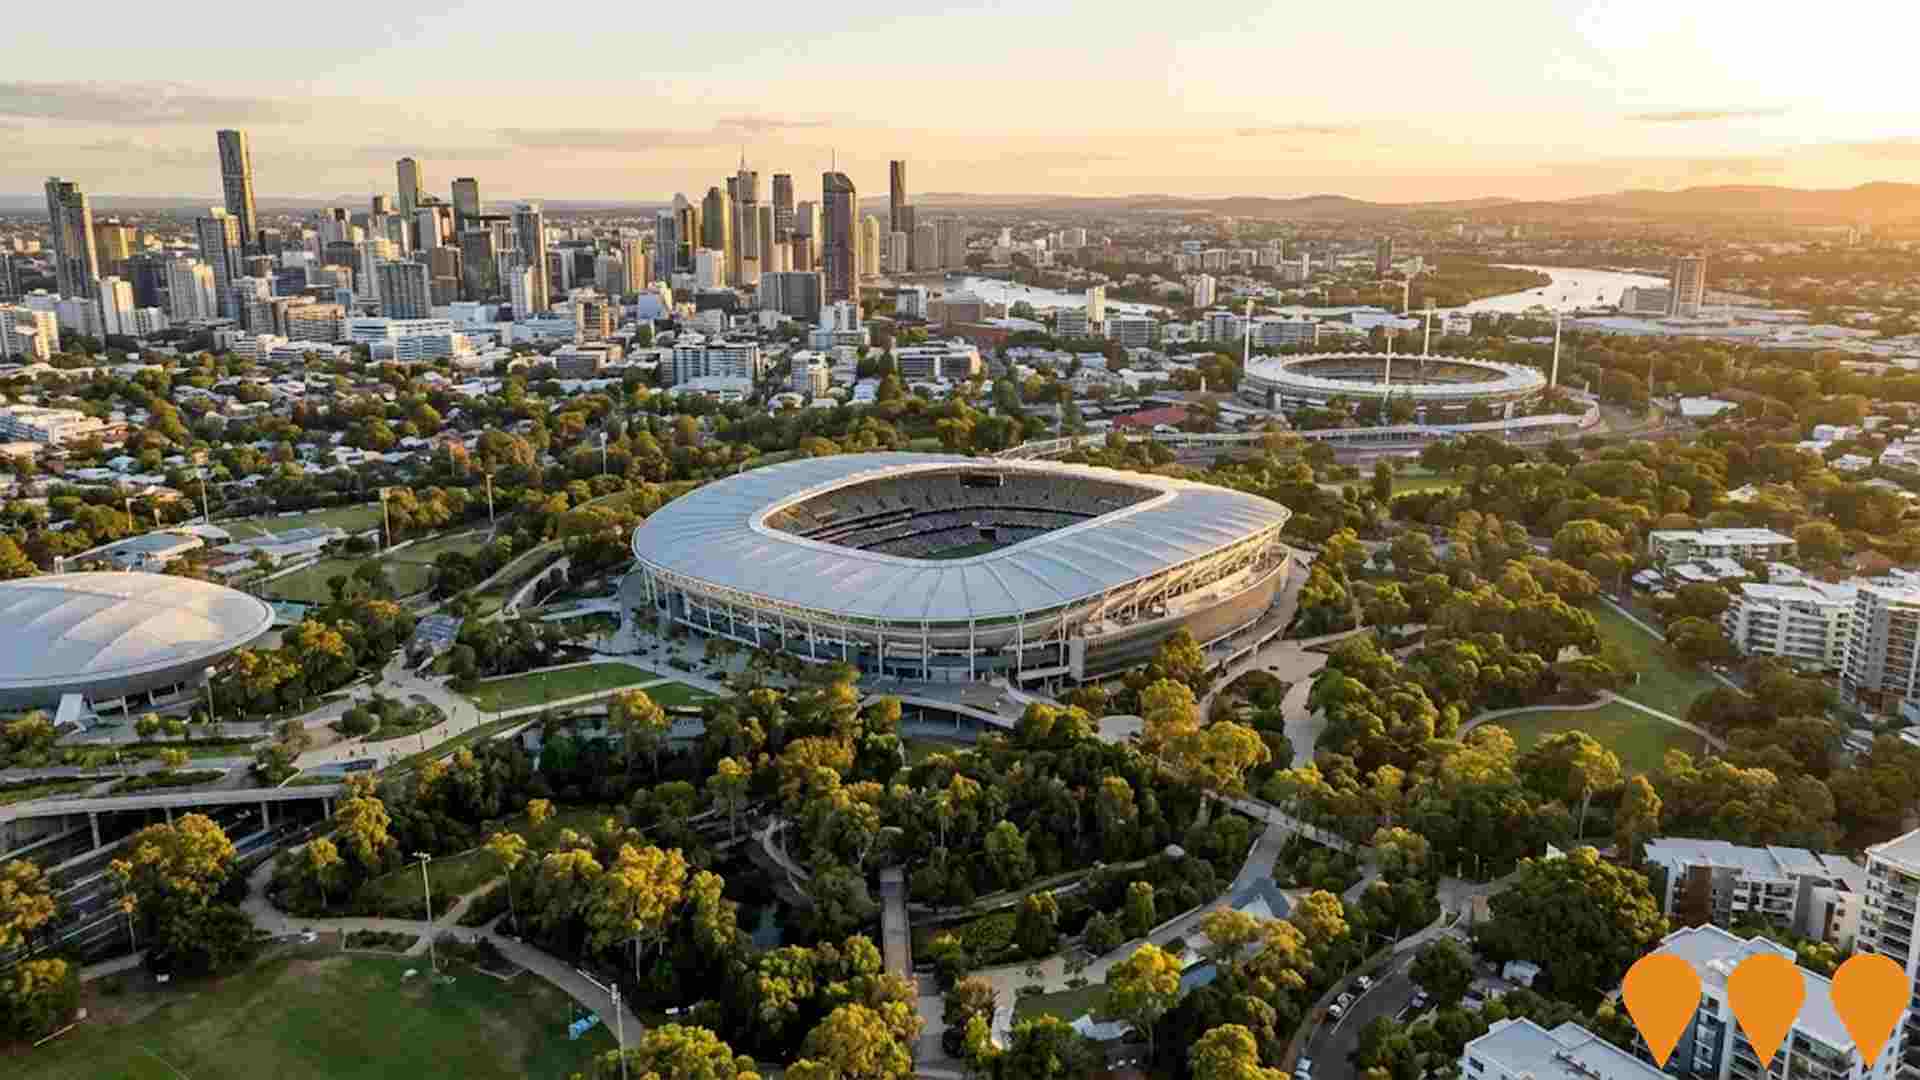
Cross River Rail - Woolloongabba Station
New underground rail station at Woolloongabba forming part of the 10.2 km Cross River Rail project. The station will provide four platforms, high-frequency Turn-Up-and-Go services, and direct connections to The Gabba stadium and surrounding precinct. Construction is well advanced with structural works largely complete, architectural fit-out ongoing, and glazed entrance canopies being installed. Station is on track for opening in 2026 as part of the full Cross River Rail network.

Victoria Park Stadium (Brisbane Arena)
New 55,000-60,000 seat roofed stadium to be built in Victoria Park as the main venue for the Brisbane 2032 Olympic and Paralympic Games. The existing Gabba will host the Olympics athletics and ceremonies in 2032, then be demolished afterwards. Victoria Park Stadium is scheduled to open in 2030.
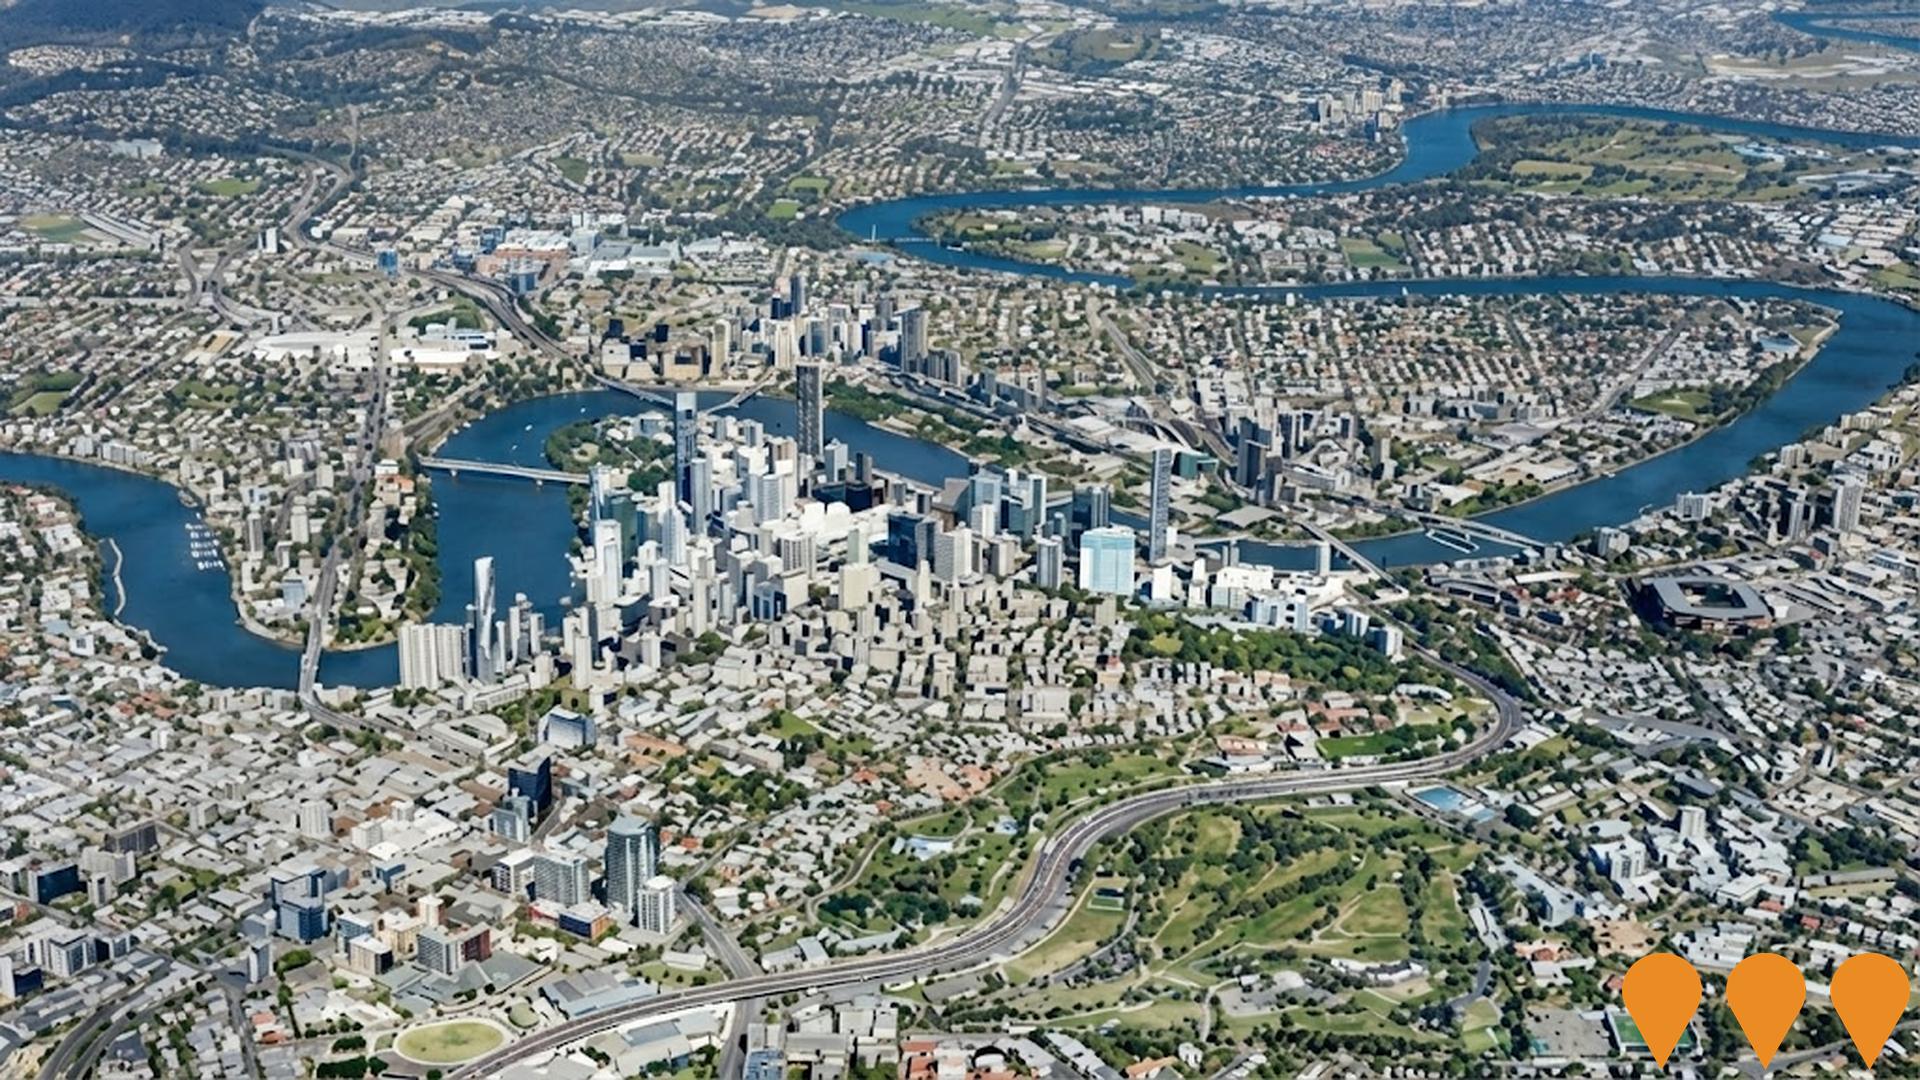
Cross River Rail
Cross River Rail is a 10.2 km north-south rail project in Brisbane, including 5.9 km of twin tunnels under the Brisbane River and CBD. It features four new underground stations (Boggo Road, Woolloongabba, Albert Street, Roma Street), a new above-ground station at Exhibition, upgrades/rebuilds to existing stations including seven between Dutton Park and Salisbury, three new Gold Coast line stations (Pimpama - opened Oct 2025, Merrimac, Hope Island), new train stabling facilities, and a new signalling system. The project has experienced significant cost escalation (latest public figures indicate an outturn cost approaching or exceeding A$19 billion when including broader enabling works) with passenger services now expected in 2029. Queensland's largest infrastructure project unlocking rail capacity bottlenecks across Southeast Queensland.
Bulimba Barracks Urban Renewal Project
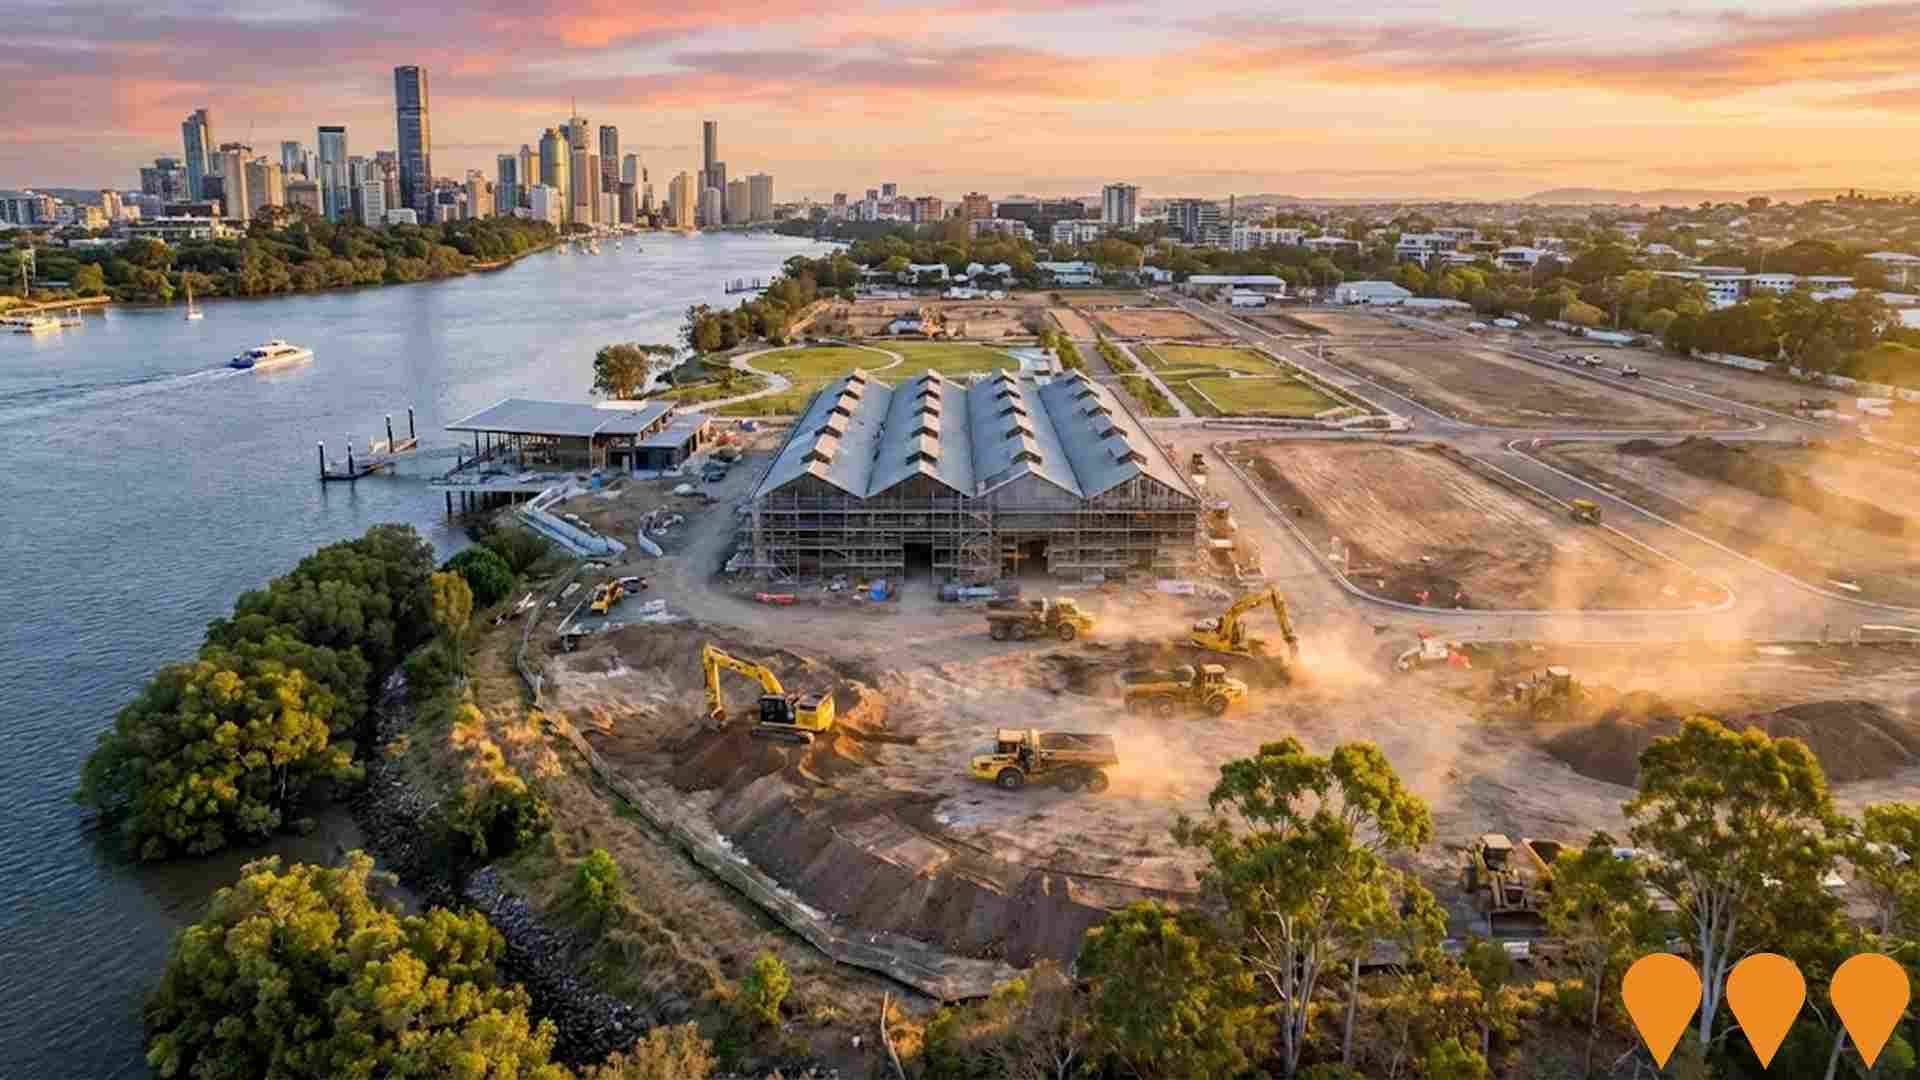
Large scale masterplanned urban renewal of the former Bulimba Barracks defence site on about 20ha of Brisbane riverfront, delivering around 850 new homes, a mixed use lifestyle precinct in the refurbished WWII fabrication shed, retail and dining, a riverside pavilion, new riverfront parkland and community facilities, with remediation, bulk earthworks and civil works now underway.
Skyring Terrace Road Upgrade
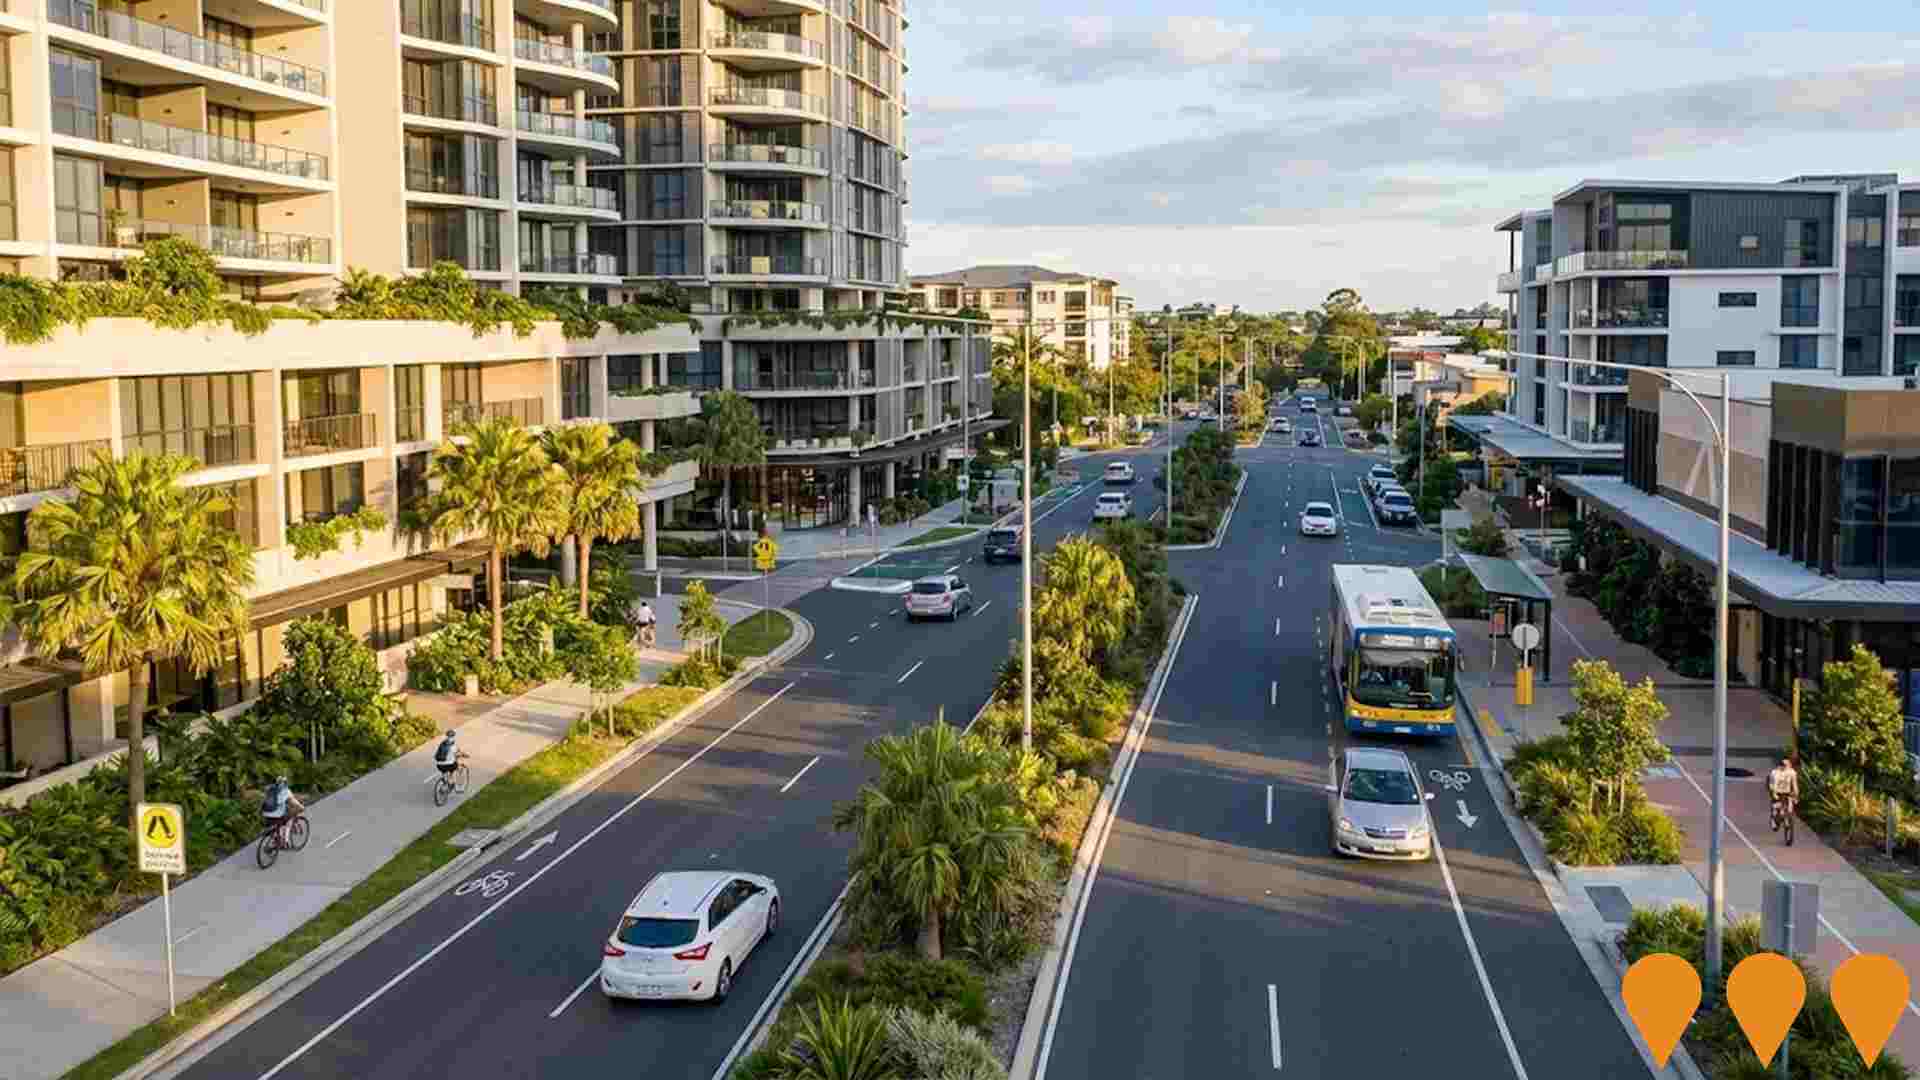
Major road infrastructure upgrade to widen Skyring Terrace with additional lanes in both directions, turning lanes, and high-quality active transport facilities to accommodate exponential growth in Newstead/Teneriffe area.
Norman Park Ferry Terminal Upgrade
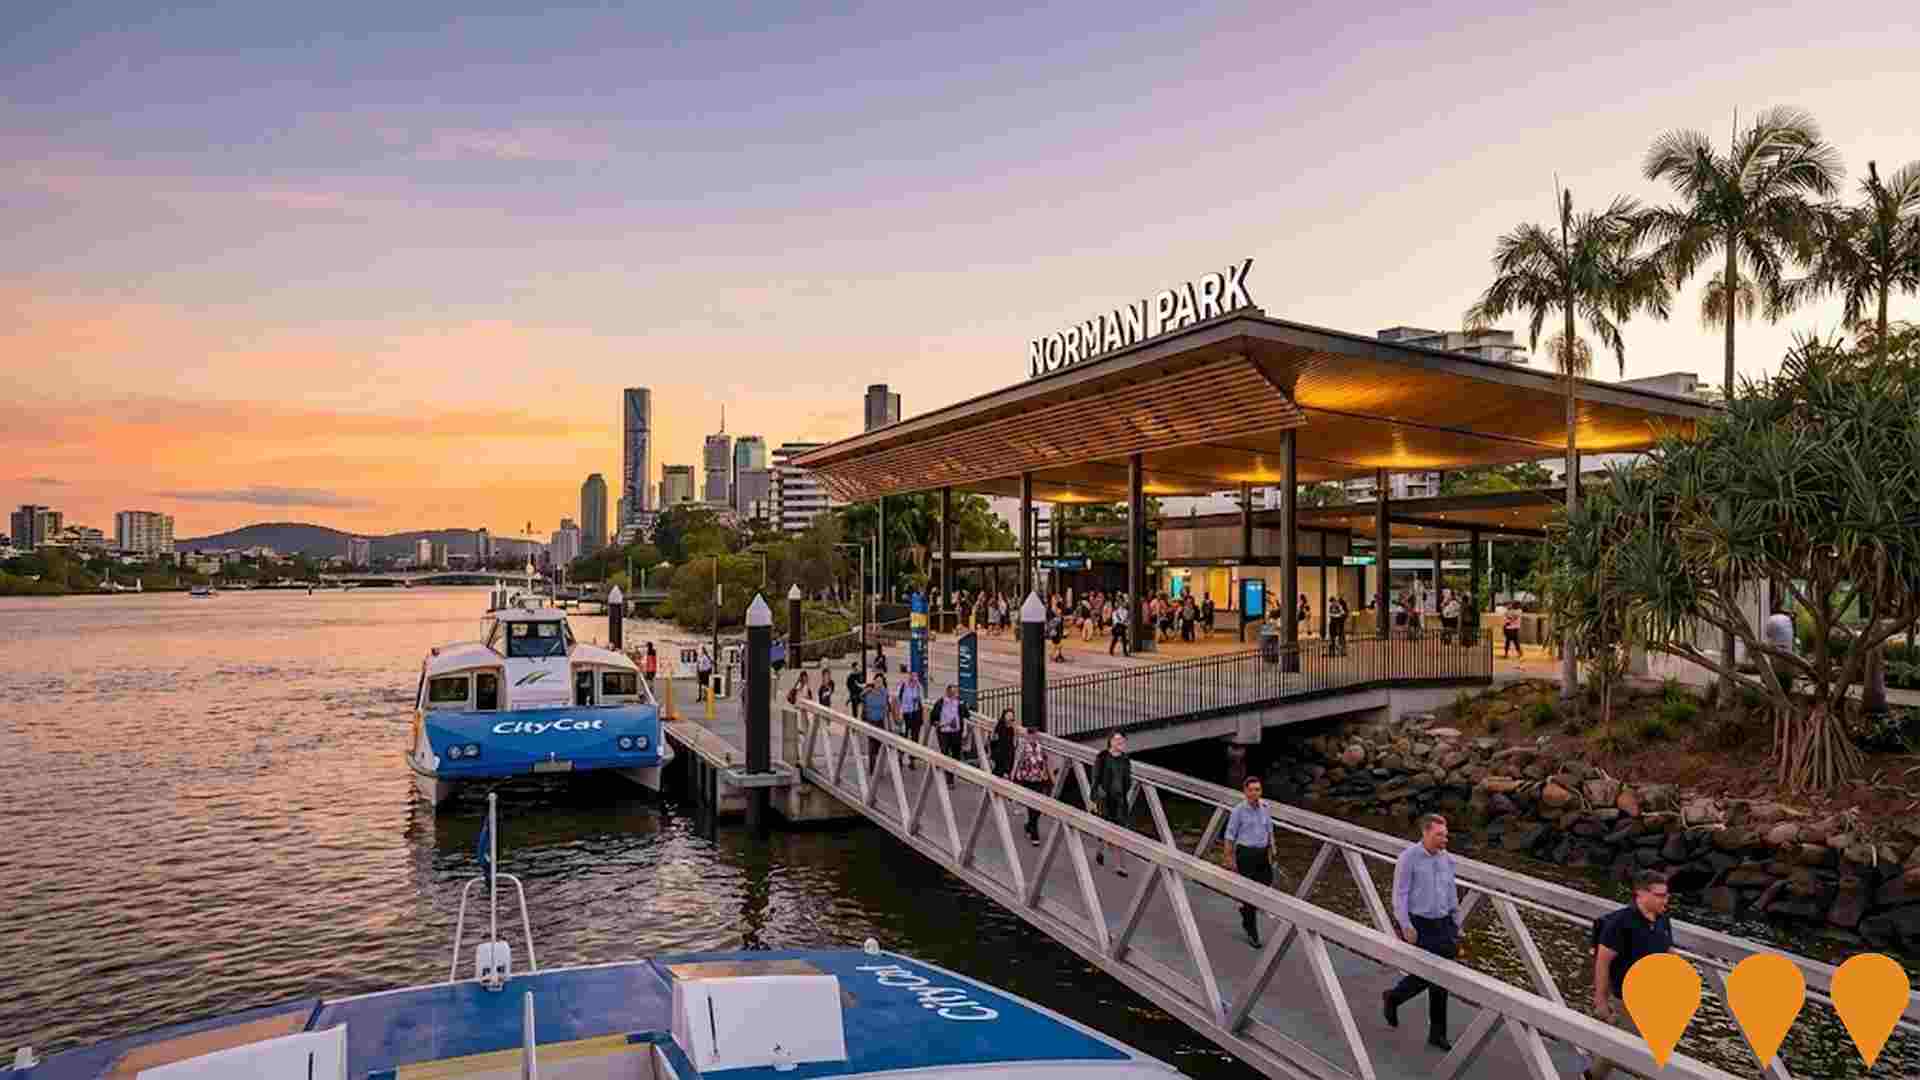
Major upgrade and replacement of the existing Norman Park ferry terminal to improve accessibility, safety and capacity as part of Brisbane City Council's ferry terminal renewal program, due for completion mid-2025.
Eastbourne Norman Park
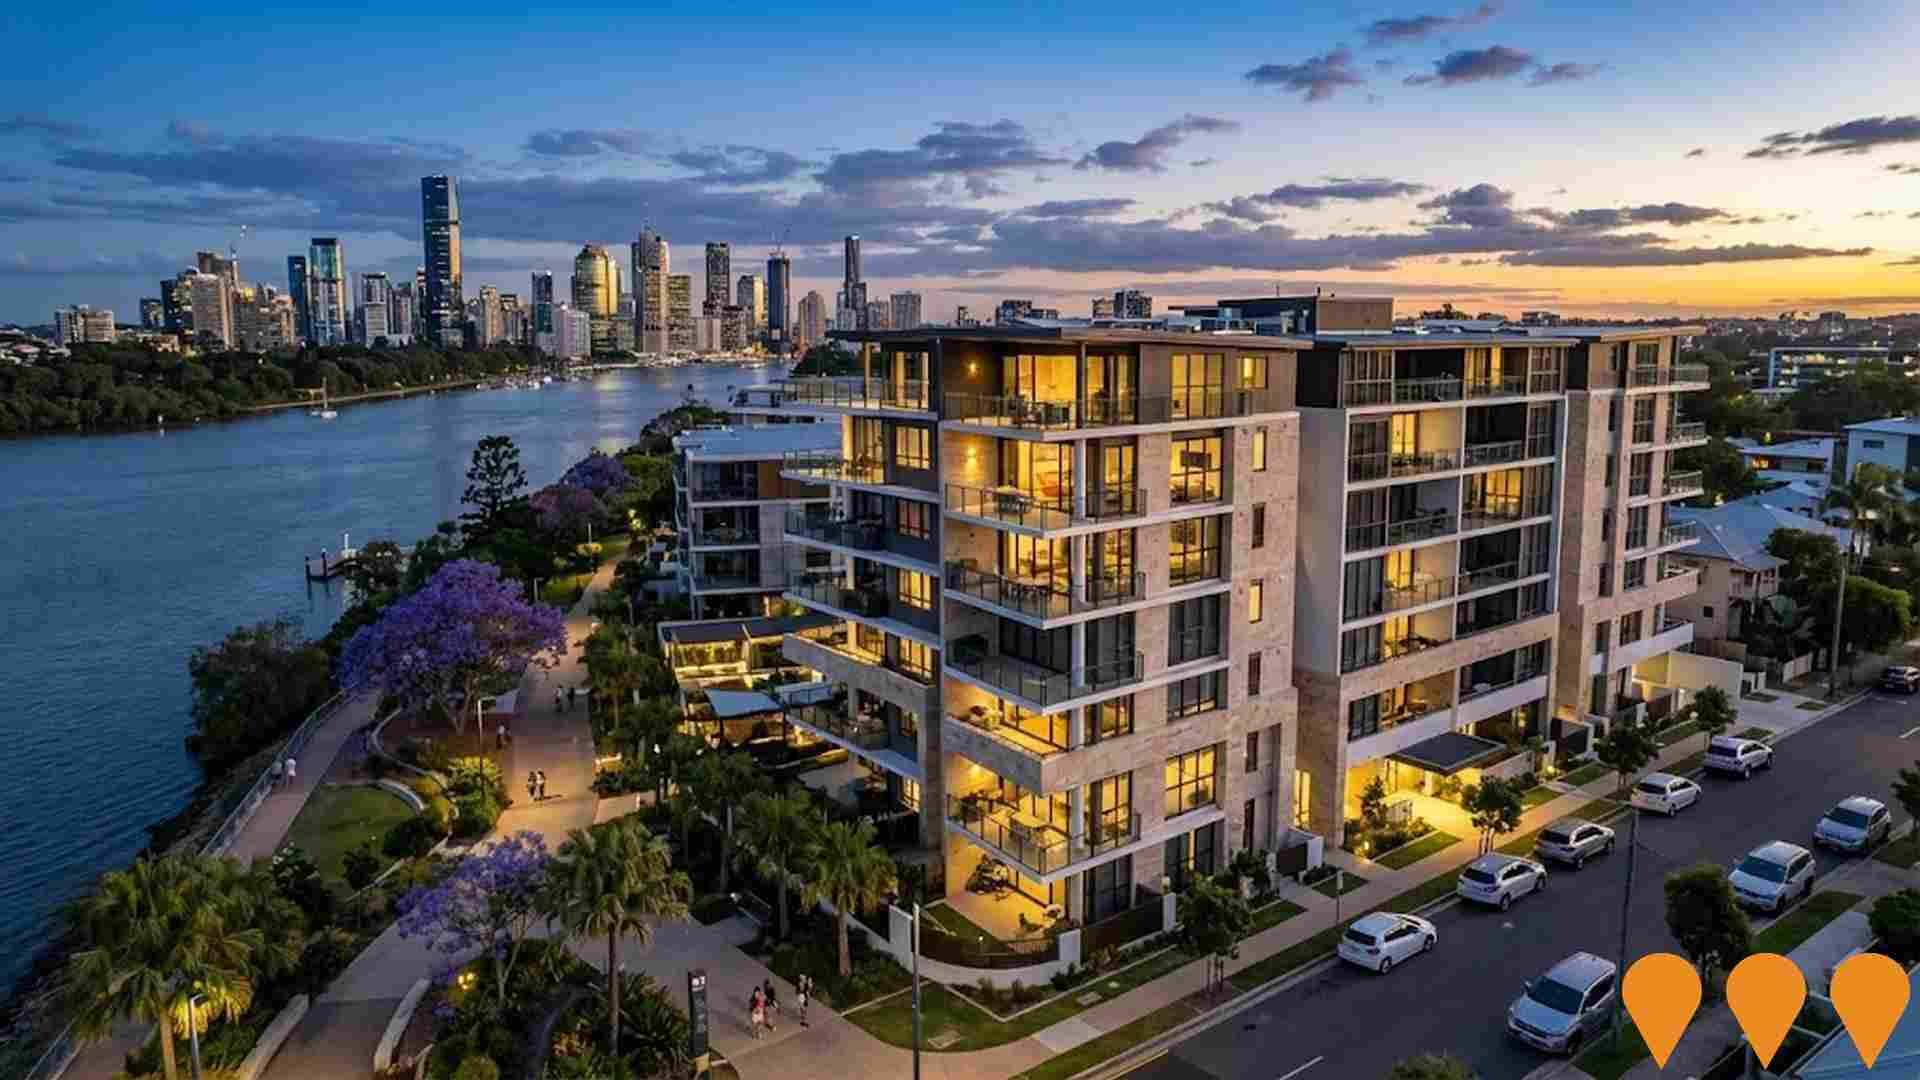
Landmark 8-level residential building containing 92 luxury apartments with river and city views, completed 2023 by developer Consolidated Properties Group.
Employment
AreaSearch analysis of employment trends sees Hawthorne performing better than 85% of local markets assessed across Australia
Hawthorne has an educated workforce with professional services well-represented. Its unemployment rate was 2.3% in September 2025, lower than Greater Brisbane's 4.0%.
Workforce participation was high at 76.8%. Key industries included professional & technical, health care & social assistance, and education & training. Professional & technical jobs were particularly prevalent, with an employment share of 1.7 times the regional level. Manufacturing employed only 3.7% of local workers, below Greater Brisbane's 6.4%.
Employment opportunities locally may be limited, as indicated by Census data comparing working population to resident population. Between September 2024 and September 2025, employment levels increased by 0.3%, labour force grew by 0.7%, causing unemployment to rise by 0.4 percentage points. In contrast, Greater Brisbane saw employment growth of 3.8% and labour force growth of 3.3%, with a drop in unemployment rate by 0.5 percentage points. State-level data from QLD as of 25-Nov-25 shows employment contracted by 0.01%, with an unemployment rate of 4.2%. National forecasts suggest total employment will expand by 6.6% over five years and 13.7% over ten years, but growth rates vary between industries. Applying these projections to Hawthorne's employment mix indicates local employment should increase by 7.2% over five years and 14.5% over ten years.
Frequently Asked Questions - Employment
Income
The economic profile demonstrates exceptional strength, placing the area among the top 10% nationally based on comprehensive AreaSearch income analysis
Hawthorne SA2 has one of the highest income levels nationally according to AreaSearch data from the Australian Taxation Office (ATO) for financial year 2022. The median income among taxpayers in Hawthorne is $76,318, with an average income of $131,759. These figures are higher than Greater Brisbane's median and average incomes of $55,645 and $70,520 respectively. Based on a 13.99% increase in wages since financial year 2022, as per the Wage Price Index, estimated current incomes for Hawthorne would be approximately $86,995 (median) and $150,192 (average) by September 2025. The 2021 Census data shows that household, family, and personal incomes in Hawthorne rank highly nationally, between the 95th and 97th percentiles. Income brackets indicate that 38.6% of residents earn over $4,000 weekly (2,202 people), contrasting with the surrounding region where the majority earn between $1,500 and $2,999. Higher earners dominate in Hawthorne, with 50.0% exceeding $3,000 weekly, suggesting strong purchasing power within the community. After accounting for housing costs, residents retain 86.7% of their income on average, reflecting strong purchasing power. The area's SEIFA income ranking places it in the 9th decile nationally.
Frequently Asked Questions - Income
Housing
Hawthorne displays a diverse mix of dwelling types, with above-average rates of outright home ownership
In Hawthorne, as per the latest Census evaluation, 63.1% of dwellings were houses while 36.9% consisted of other types such as semi-detached homes and apartments. This contrasts with Brisbane's metropolitan area where 52.7% were houses and 47.3% were other dwellings. Home ownership in Hawthorne stood at 25.4%, with the rest being mortgaged (37.6%) or rented (37.0%). The median monthly mortgage repayment was $2,800, significantly higher than Brisbane's metro average of $2,500 and the national average of $1,863. The median weekly rent in Hawthorne was recorded at $430, above Brisbane's metro figure of $440 but below the national average of $375.
Frequently Asked Questions - Housing
Household Composition
Hawthorne features high concentrations of group households, with a higher-than-average median household size
Family households account for 70.6% of all households, including 37.1% couples with children, 23.3% couples without children, and 8.9% single parent families. Non-family households constitute the remaining 29.4%, with lone person households at 23.8% and group households comprising 5.2%. The median household size is 2.6 people, which is larger than the Greater Brisbane average of 2.4.
Frequently Asked Questions - Households
Local Schools & Education
Hawthorne demonstrates exceptional educational outcomes, ranking among the top 5% of areas nationally based on AreaSearch's comprehensive analysis of qualification and performance metrics
Hawthorne's educational attainment exceeds broader benchmarks. Among residents aged 15+, 50.0% hold university qualifications, compared to 25.7% in Queensland (QLD) and 30.4% nationally. Bachelor degrees are most prevalent at 33.6%, followed by postgraduate qualifications (11.5%) and graduate diplomas (4.9%). Vocational pathways account for 23.9% of qualifications, with advanced diplomas at 11.2% and certificates at 12.7%.
Educational participation is high, with 33.5% currently enrolled in formal education. This includes 9.9% in primary education, 9.4% in secondary education, and 8.5% pursuing tertiary education.
Frequently Asked Questions - Education
Schools Detail
Nearby Services & Amenities
Transport
Transport servicing is good compared to other areas nationally based on assessment of service frequency, route connectivity and accessibility
Hawthorne has 29 active public transport stops, serving a mix of ferry and bus services. These stops are covered by 9 routes, offering a total of 1,511 weekly passenger trips. The average distance to the nearest stop for residents is 137 meters.
Daily service frequency averages 215 trips across all routes, equating to approximately 52 weekly trips per individual stop.
Frequently Asked Questions - Transport
Transport Stops Detail
Health
Hawthorne's residents boast exceedingly positive health performance metrics with very low prevalence of common health conditions across all age groups
Hawthorne's health outcomes show excellent results across all age groups, with a very low prevalence of common health conditions. Private health cover stands at approximately 82% of the total population (4,695 people), higher than Greater Brisbane's 73.8%, and significantly above the national average of 55.3%. Mental health issues and asthma are the most prevalent medical conditions in the area, affecting 7.1% and 6.7% of residents respectively.
A total of 77.9% of residents report being completely free from medical ailments, compared to 74.9% across Greater Brisbane. Hawthorne has a lower proportion of seniors aged 65 and over at 9.0% (511 people), compared to Greater Brisbane's 11.3%. Despite this, health outcomes among seniors in Hawthorne are strong and broadly align with the general population's health profile.
Frequently Asked Questions - Health
Cultural Diversity
In terms of cultural diversity, Hawthorne records figures broadly comparable to the national average, as found in AreaSearch's assessment of a number of language and cultural background related metrics
Hawthorne's population is approximately in line with the broader area, with 77.4% born in Australia, 89.4% being citizens, and 90.7% speaking English only at home. Christianity is the predominant religion in Hawthorne, practiced by 55.2% of its residents. Judaism, however, is slightly overrepresented compared to the wider region, with 0.2% of Hawthorne's population identifying as such.
The top three ancestry groups are English (28.5%), Australian (23.0%), and Irish (11.0%). Notably, Scottish ancestry is higher in Hawthorne at 9.8%, compared to 8.7% regionally. French and New Zealand ancestries also show similar representation in both areas, at 0.8% and 0.9% respectively.
Frequently Asked Questions - Diversity
Age
Hawthorne's population is slightly younger than the national pattern
Hawthorne's median age is nearly 37 years, closely matching Greater Brisbane's average of 36 and the Australian median of 38. Compared to Greater Brisbane, Hawthorne has a higher percentage of residents aged 45-54 (16.4%) but fewer residents aged 25-34 (11.6%). Between the 2021 Census and the present, the 15-24 age group has grown from 13.7% to 16.6%, while the 55-64 cohort increased from 12.0% to 13.2%. Conversely, the 5-14 age group declined from 14.4% to 12.8% and the 25-34 group dropped from 12.7% to 11.6%. By 2041, demographic modeling suggests Hawthorne's age profile will evolve significantly. The 55-64 cohort is projected to grow by 26%, adding 195 residents to reach 948. In contrast, both the 0-4 and 5-14 age groups are expected to see reduced numbers.
