Chart Color Schemes
This analysis uses ABS Statistical Areas Level 2 (SA2) boundaries, which can materially differ from Suburbs and Localities (SAL) even when sharing similar names.
SA2 boundaries are defined by the Australian Bureau of Statistics and are designed to represent communities for statistical reporting (e.g., census and ERP).
Suburbs and Localities (SAL) represent commonly-used suburb/locality names (postal-style areas) and may use different geographic boundaries. For comprehensive analysis, consider reviewing both boundary types if available.
est. as @ -- *
ABS ERP | -- people | --
2021 Census | -- people
Sales Activity
Curious about local property values? Filter the chart to assess the volume and appreciation (including resales) trends and regional comparisons, or scroll to the map below view this information at an individual property level.
Find a Recent Sale
Sales Detail
Population
Bulimba lies within the top quartile of areas nationally for population growth performance according to AreaSearch analysis of recent, and medium to long-term trends
Bulimba's population is around 7,911 as of Nov 2025. This reflects an increase of 504 people since the 2021 Census, which reported a population of 7,407 people. The change is inferred from the estimated resident population of 7,895 from the ABS as of June 2024 and an additional 65 validated new addresses since the Census date. This level of population equates to a density ratio of 3,840 persons per square kilometer, which lies in the top 10% of national locations assessed by AreaSearch. Bulimba's growth rate of 6.8% since the census positions it within 2.1 percentage points of the national average (8.9%). Population growth for the area was primarily driven by overseas migration, contributing approximately 84.6% of overall population gains during recent periods.
AreaSearch is adopting ABS/Geoscience Australia projections for each SA2 area, as released in 2024 with 2022 as the base year. For areas not covered by this data and years post-2032, Queensland State Government's SA2 area projections are adopted, released in 2023 based on 2021 data. These state projections do not provide age category splits; hence proportional growth weightings are applied in line with the ABS Greater Capital Region projections for each age cohort, released in 2023 based on 2022 data. Future population trends project an above median growth for national statistical areas, with Bulimba expected to grow by 1,347 persons to 2041 based on the latest annual ERP population numbers, reflecting a total increase of 16.8% over the 17 years.
Frequently Asked Questions - Population
Development
AreaSearch analysis of residential development drivers sees Bulimba recording a relatively average level of approval activity when compared to local markets analysed countrywide
Bulimba has received approximately 26 dwelling approvals per year over the past five financial years, totalling 131 homes. In FY-26 so far, 26 approvals have been recorded. On average, 3.4 people moved to Bulimba annually for each dwelling built between FY-21 and FY-25. This indicates supply is significantly lagging demand, leading to heightened buyer competition and pricing pressures.
New properties are constructed at an average expected cost of $677,000, reflecting a focus on the premium segment with upmarket dwellings. Additionally, $9.3 million in commercial development approvals have been recorded this financial year, demonstrating Bulimba's primarily residential nature. Compared to Greater Brisbane, Bulimba has around two-thirds the rate of new dwelling approvals per person and ranks among the 42nd percentile nationally when measured against other areas assessed. This results in relatively constrained buyer choice, supporting interest in existing dwellings. The market is lower than the national average, reflecting maturity and possible development constraints.
New development in Bulimba consists of 36% detached houses and 64% townhouses or apartments, skewed towards compact living which offers affordable entry pathways and attracts downsizers, investors, and first-time purchasers. With around 393 people per dwelling approval, Bulimba shows a developed market. Looking ahead, Bulimba is projected to grow by 1,326 residents through to 2041 according to the latest AreaSearch quarterly estimate. At current development rates, housing supply may struggle to match population growth, potentially heightening buyer competition and supporting price increases.
Frequently Asked Questions - Development
Infrastructure
Bulimba has very high levels of nearby infrastructure activity, ranking in the top 20% nationally
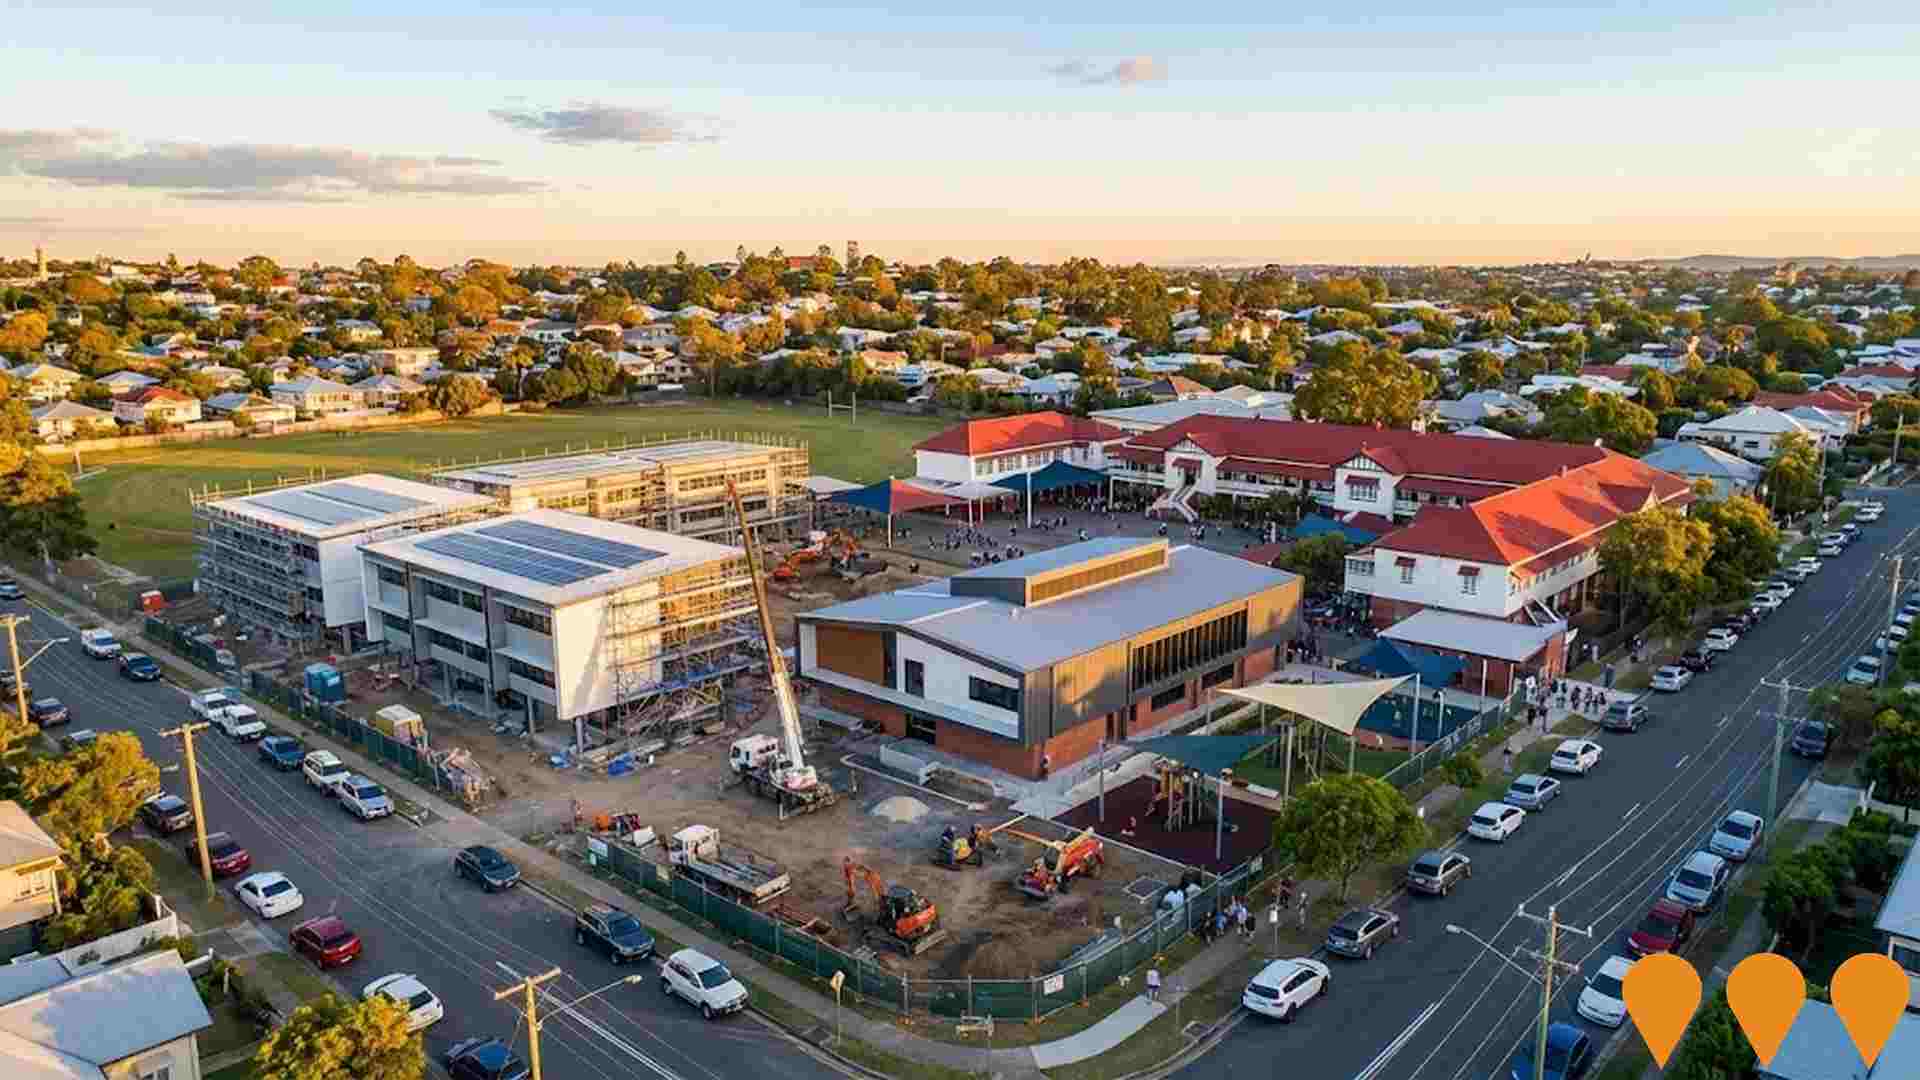
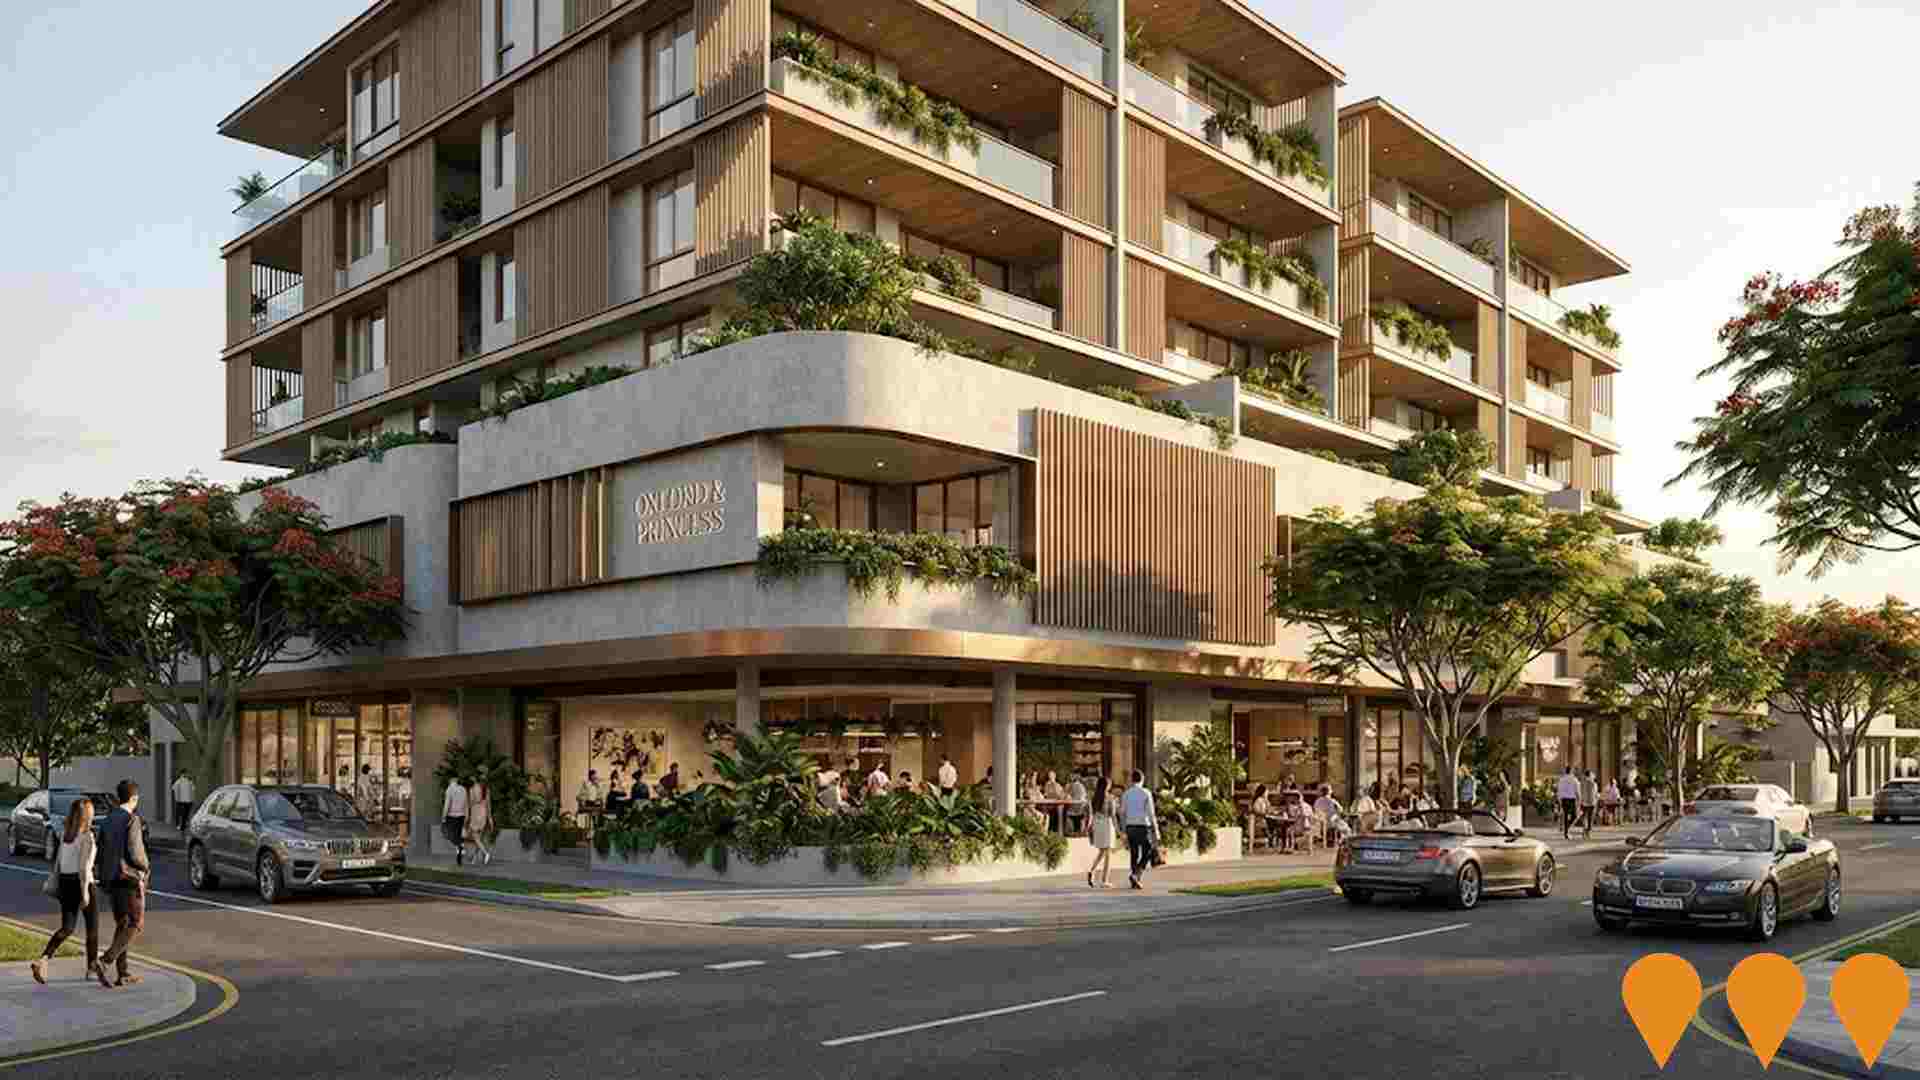
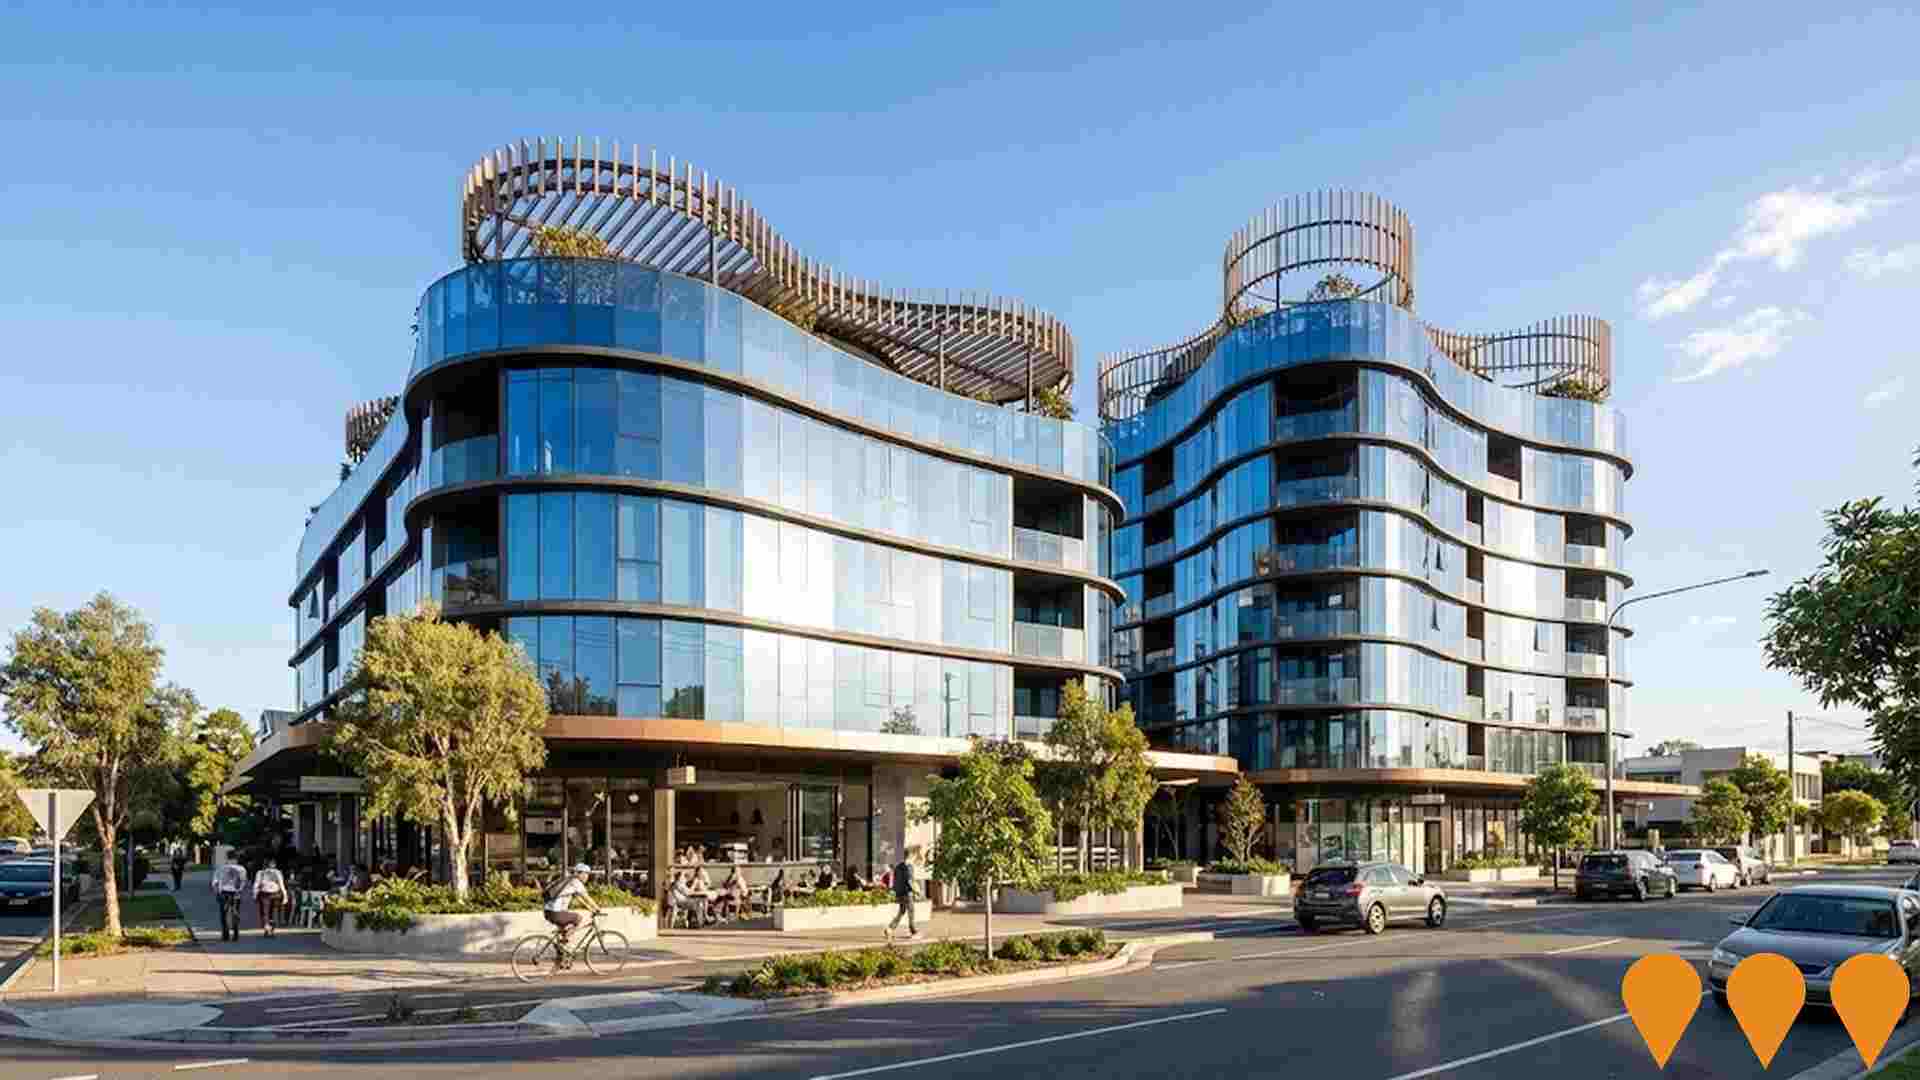
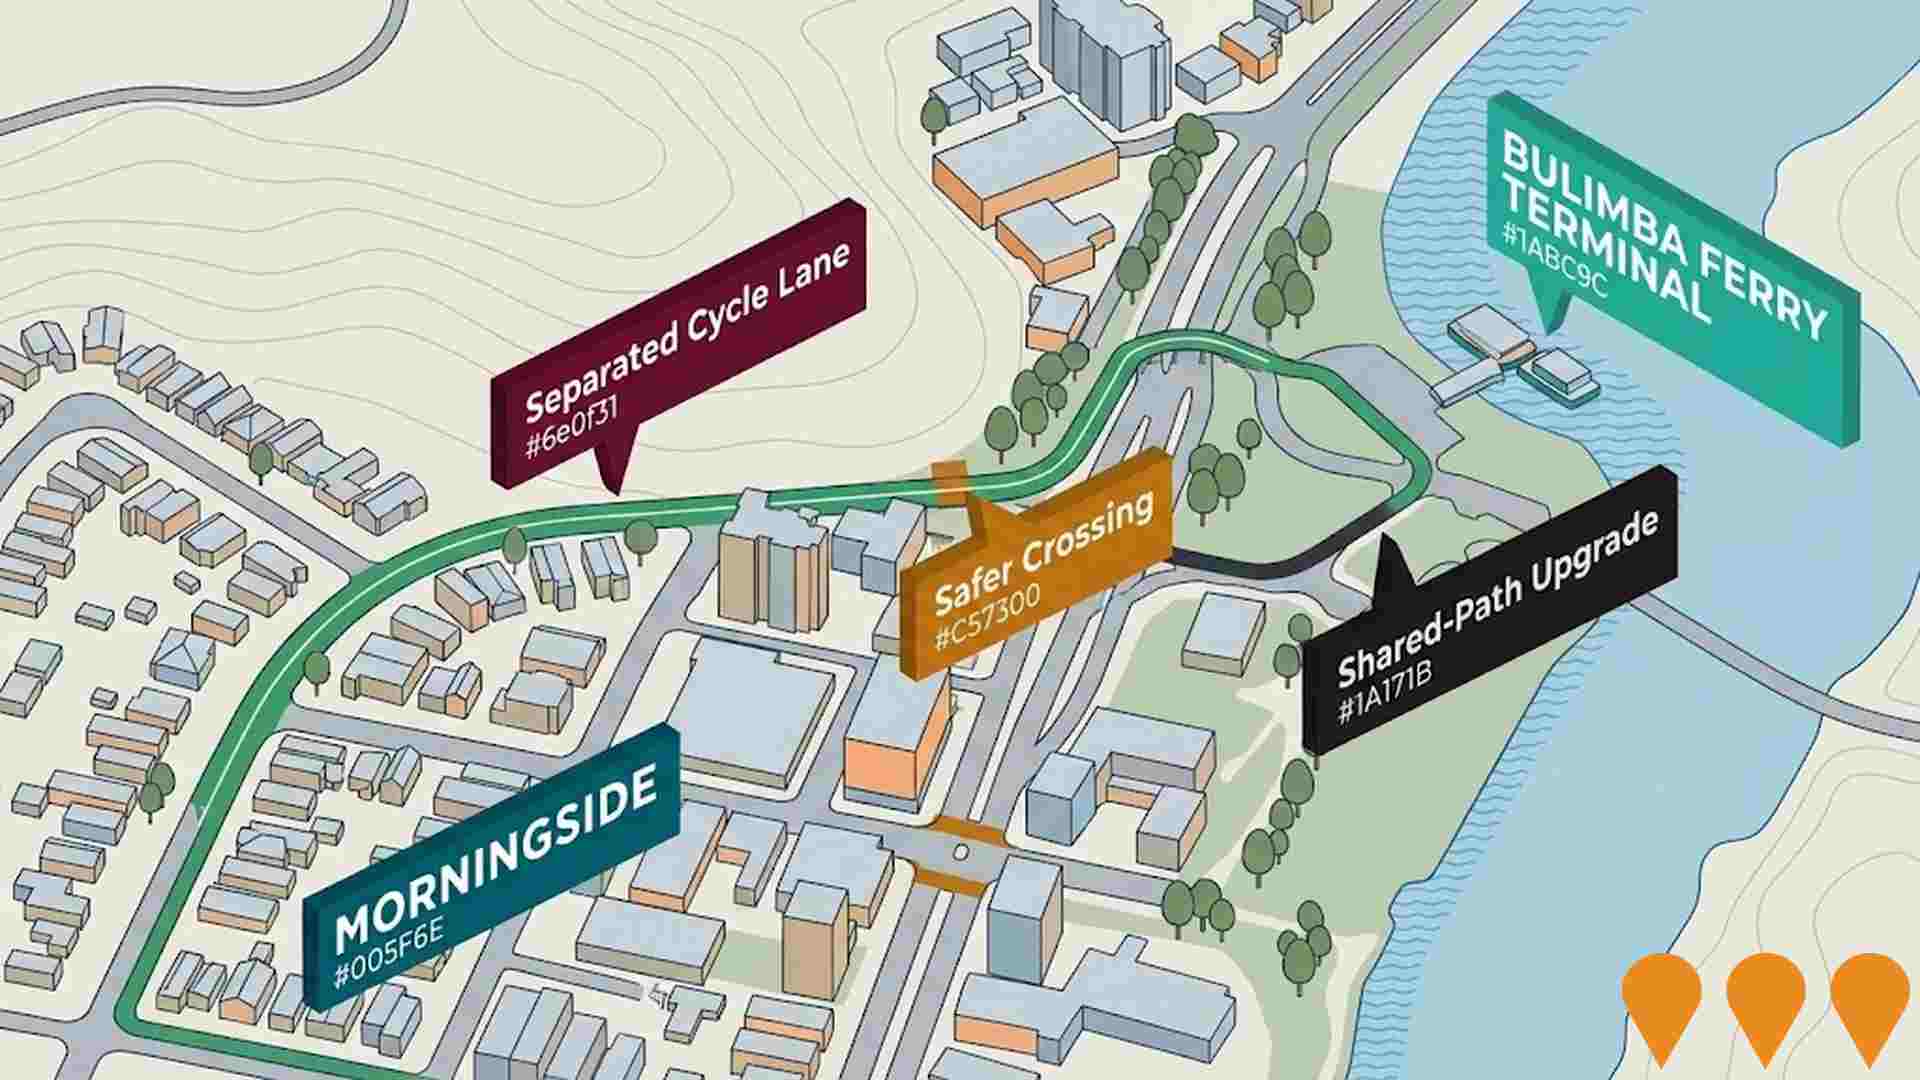
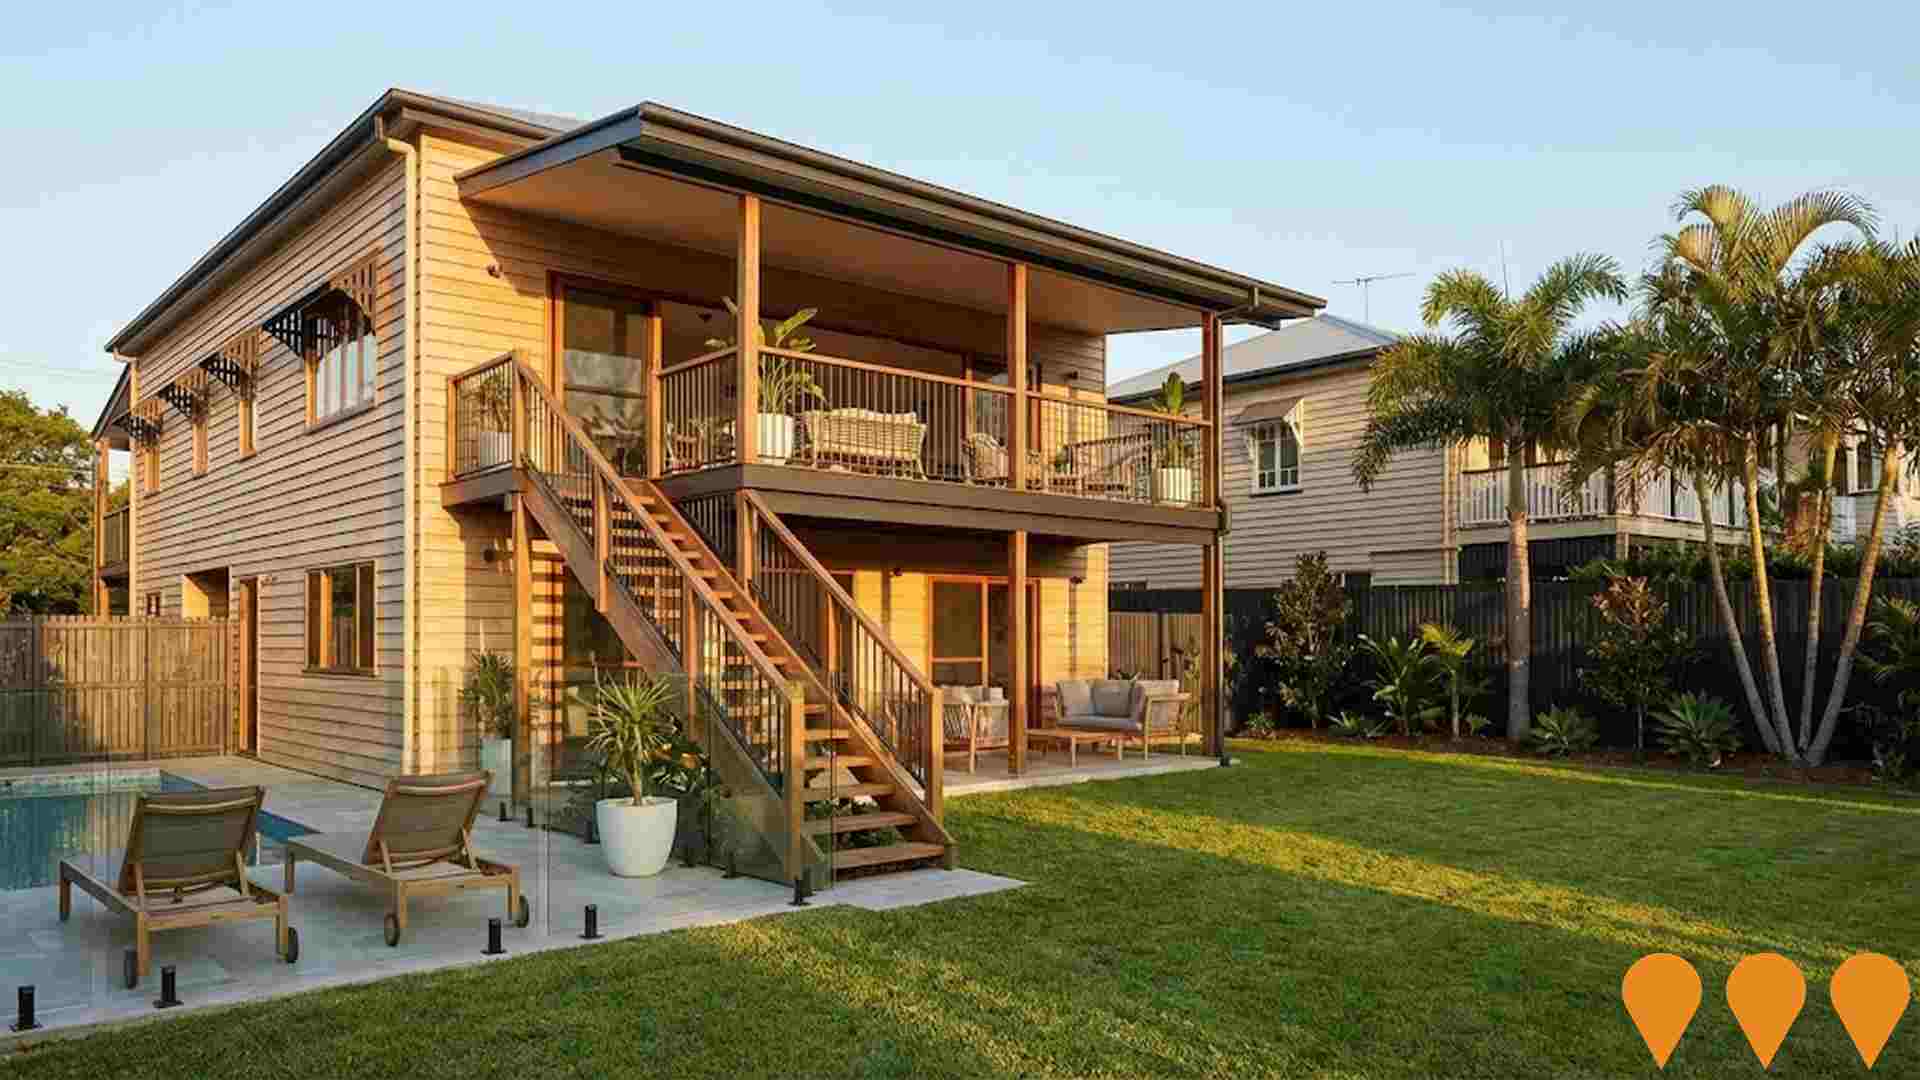
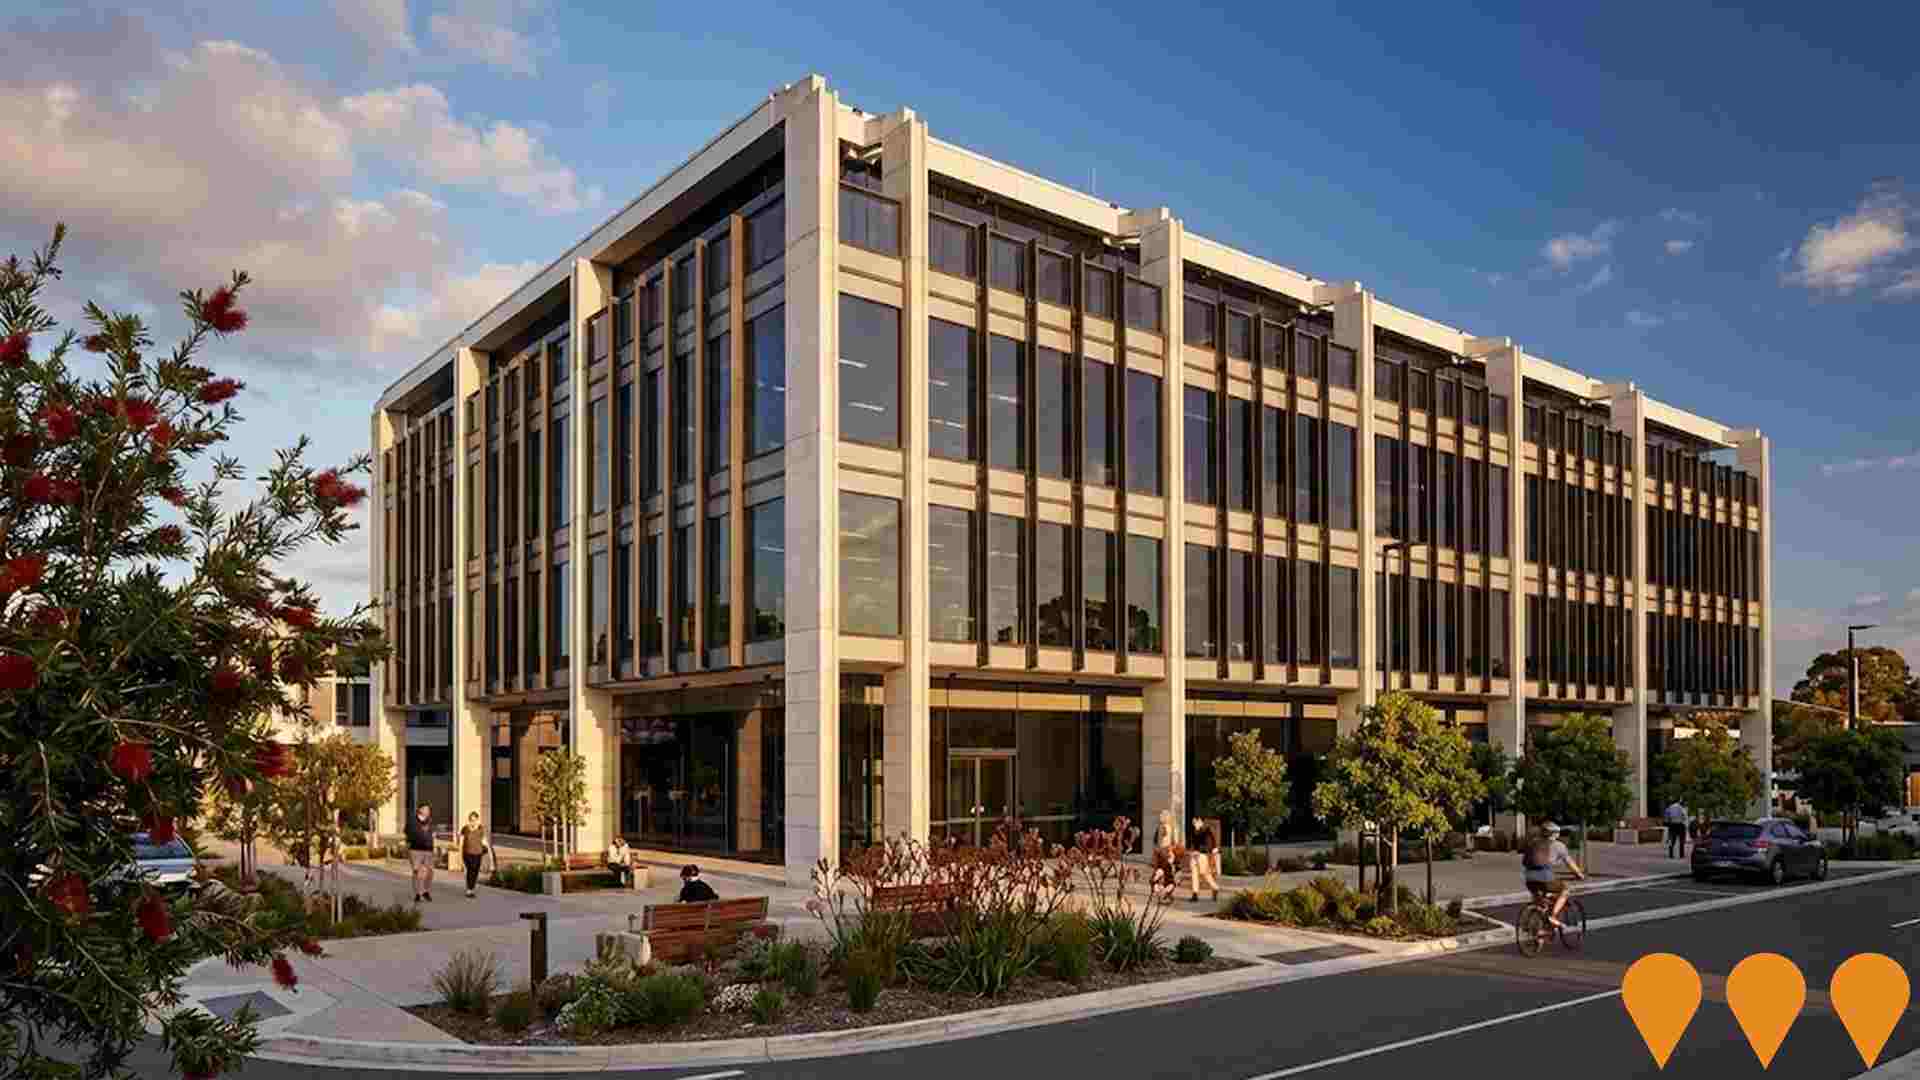
Area infrastructure significantly impacts local performance. AreaSearch identified 35 projects potentially affecting the area. Notable ones include Oxford & Princess - Bulimba Mixed-Use Development, QParks Group - 5 Riding Road Mixed-Use Development, Bulimba State School Infrastructure Upgrade, and Bulimba Memorial Park and Community Centre Upgrade. Below is a list of those likely most relevant.
Professional plan users can use the search below to filter and access additional projects.
INFRASTRUCTURE SEARCH
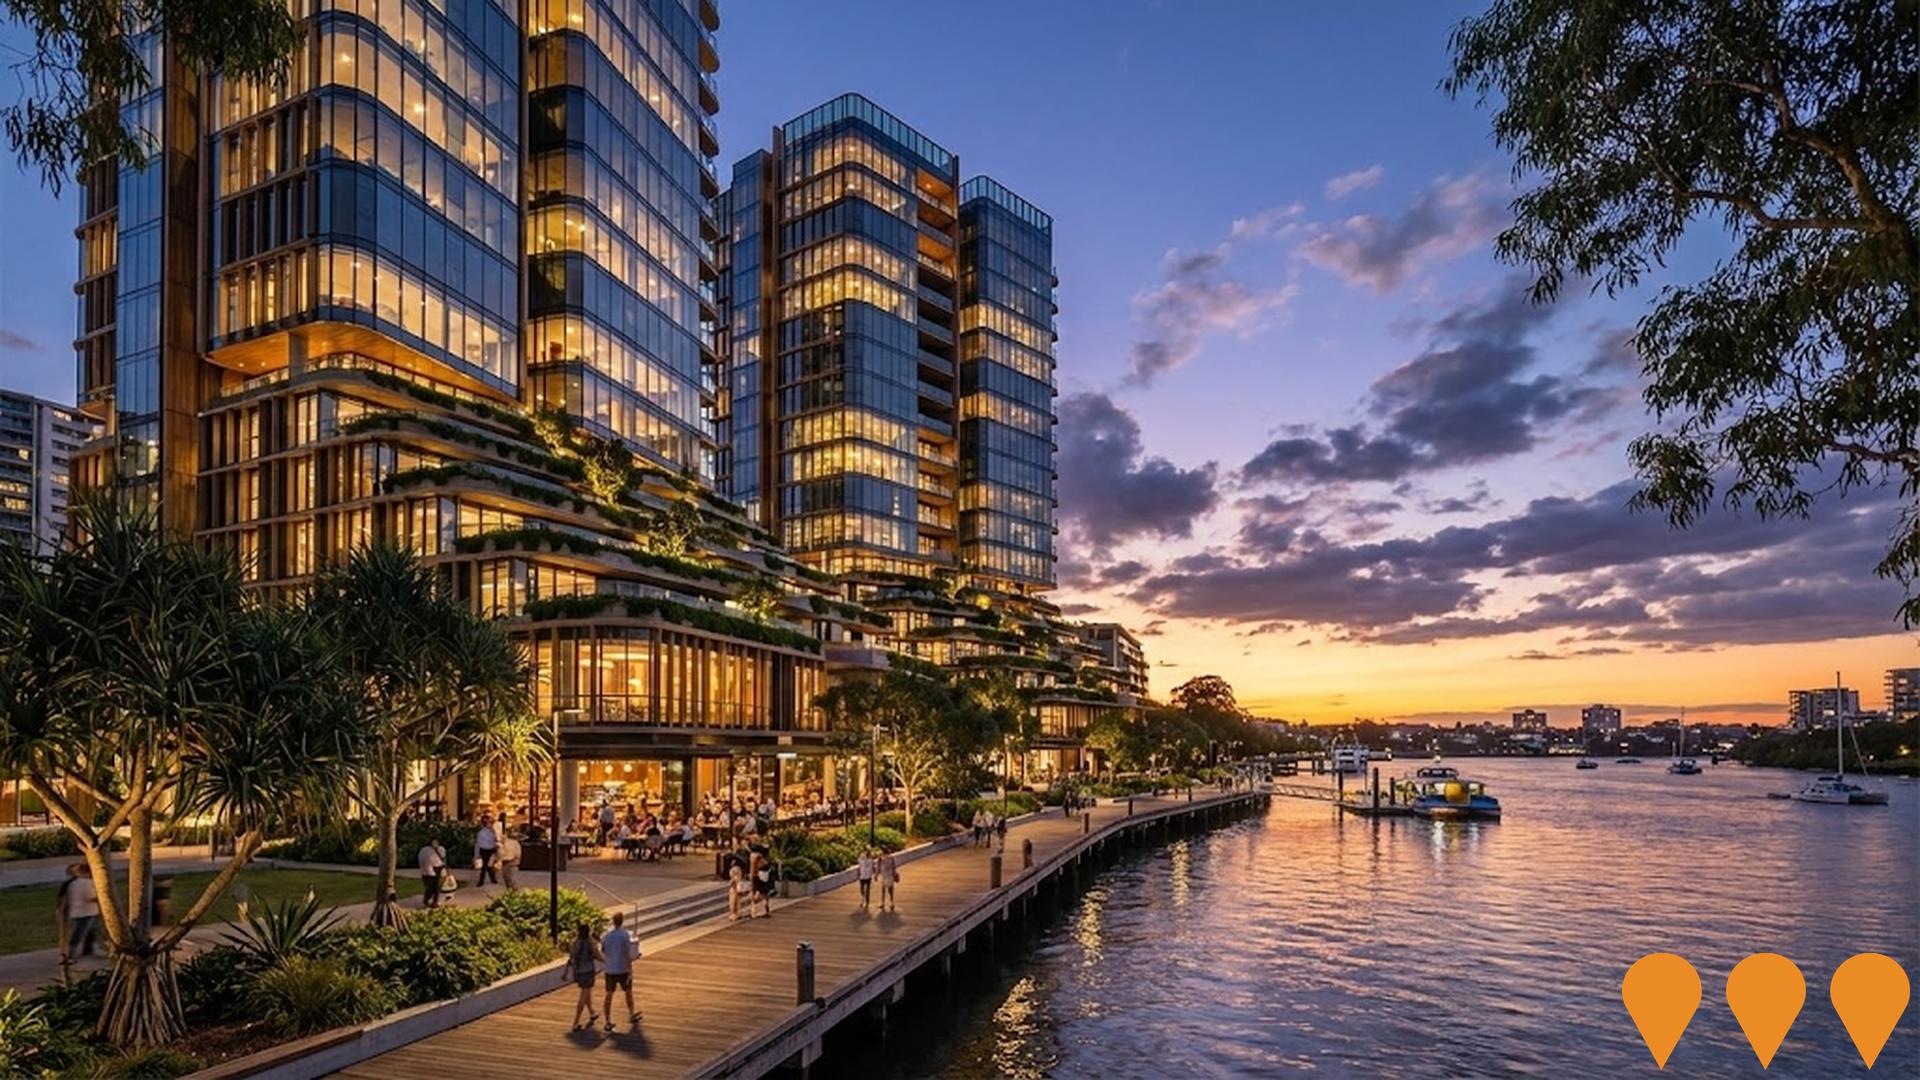
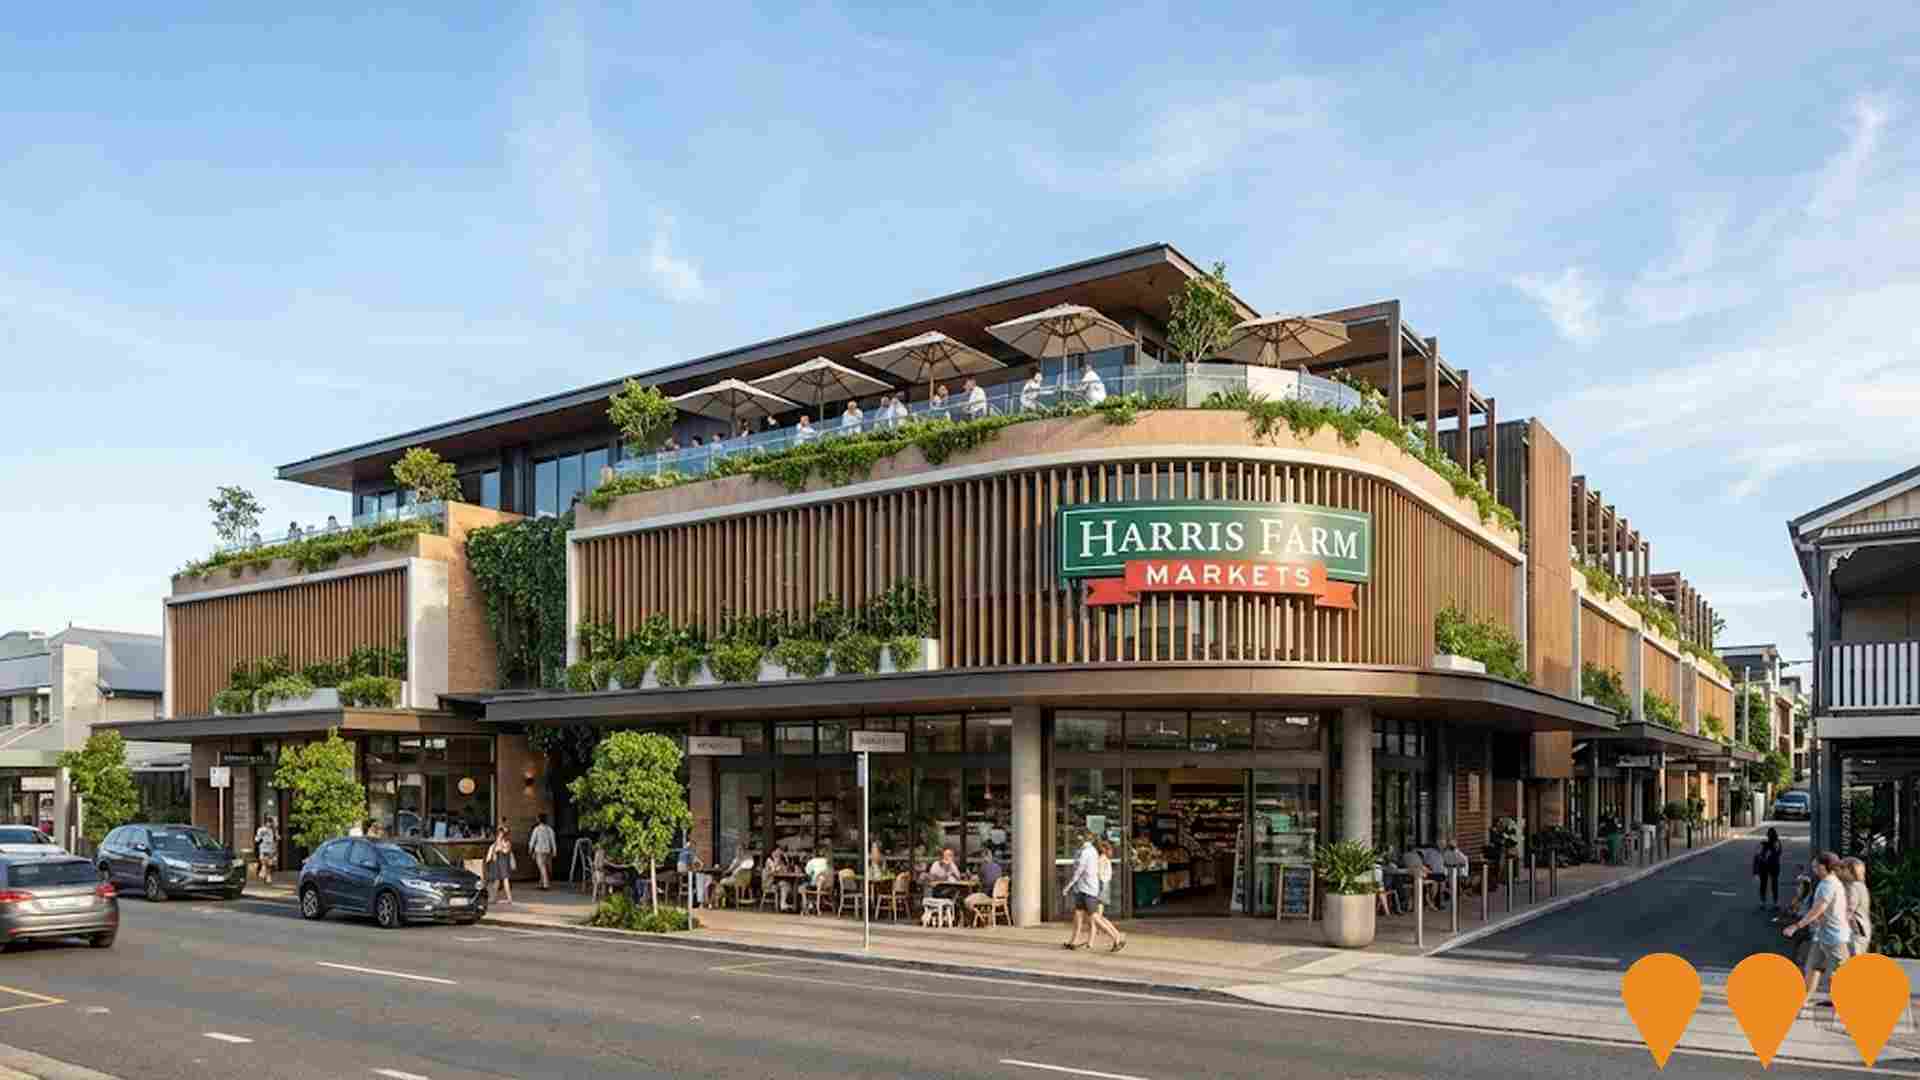
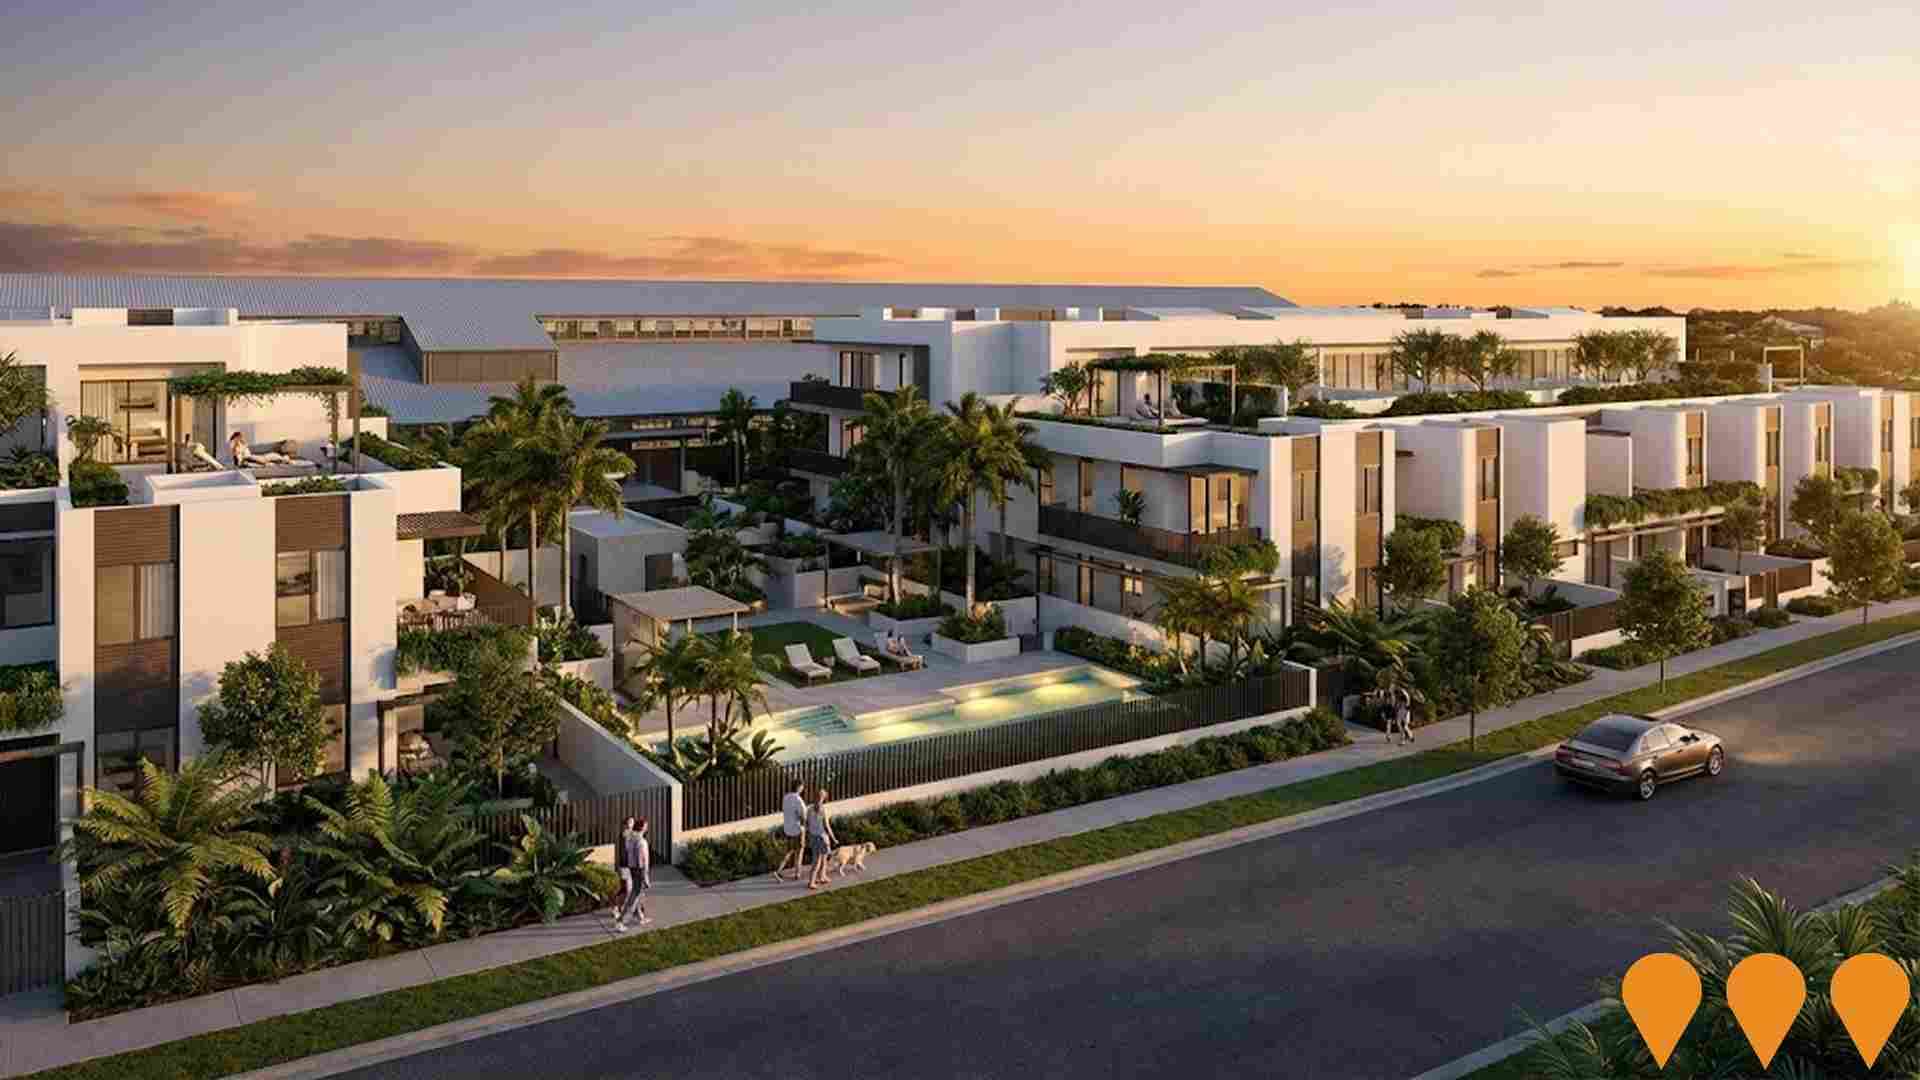
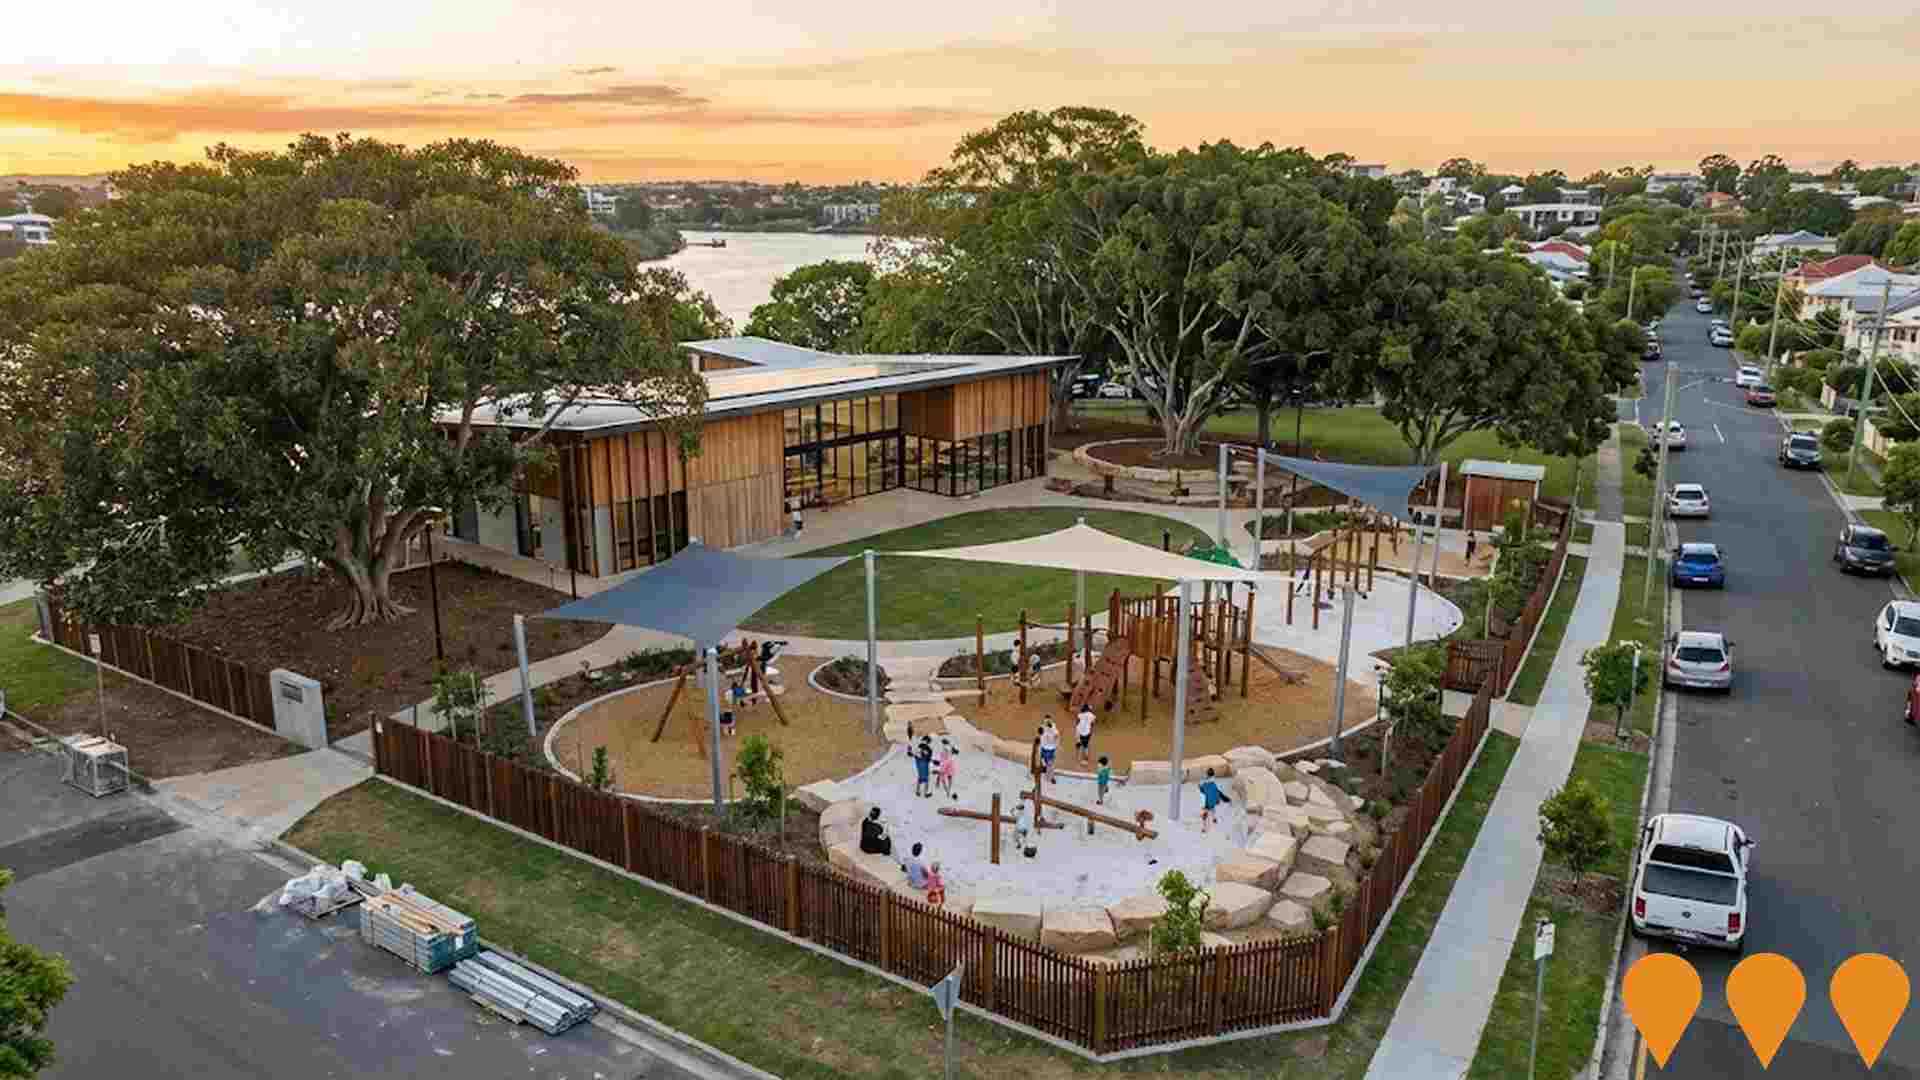
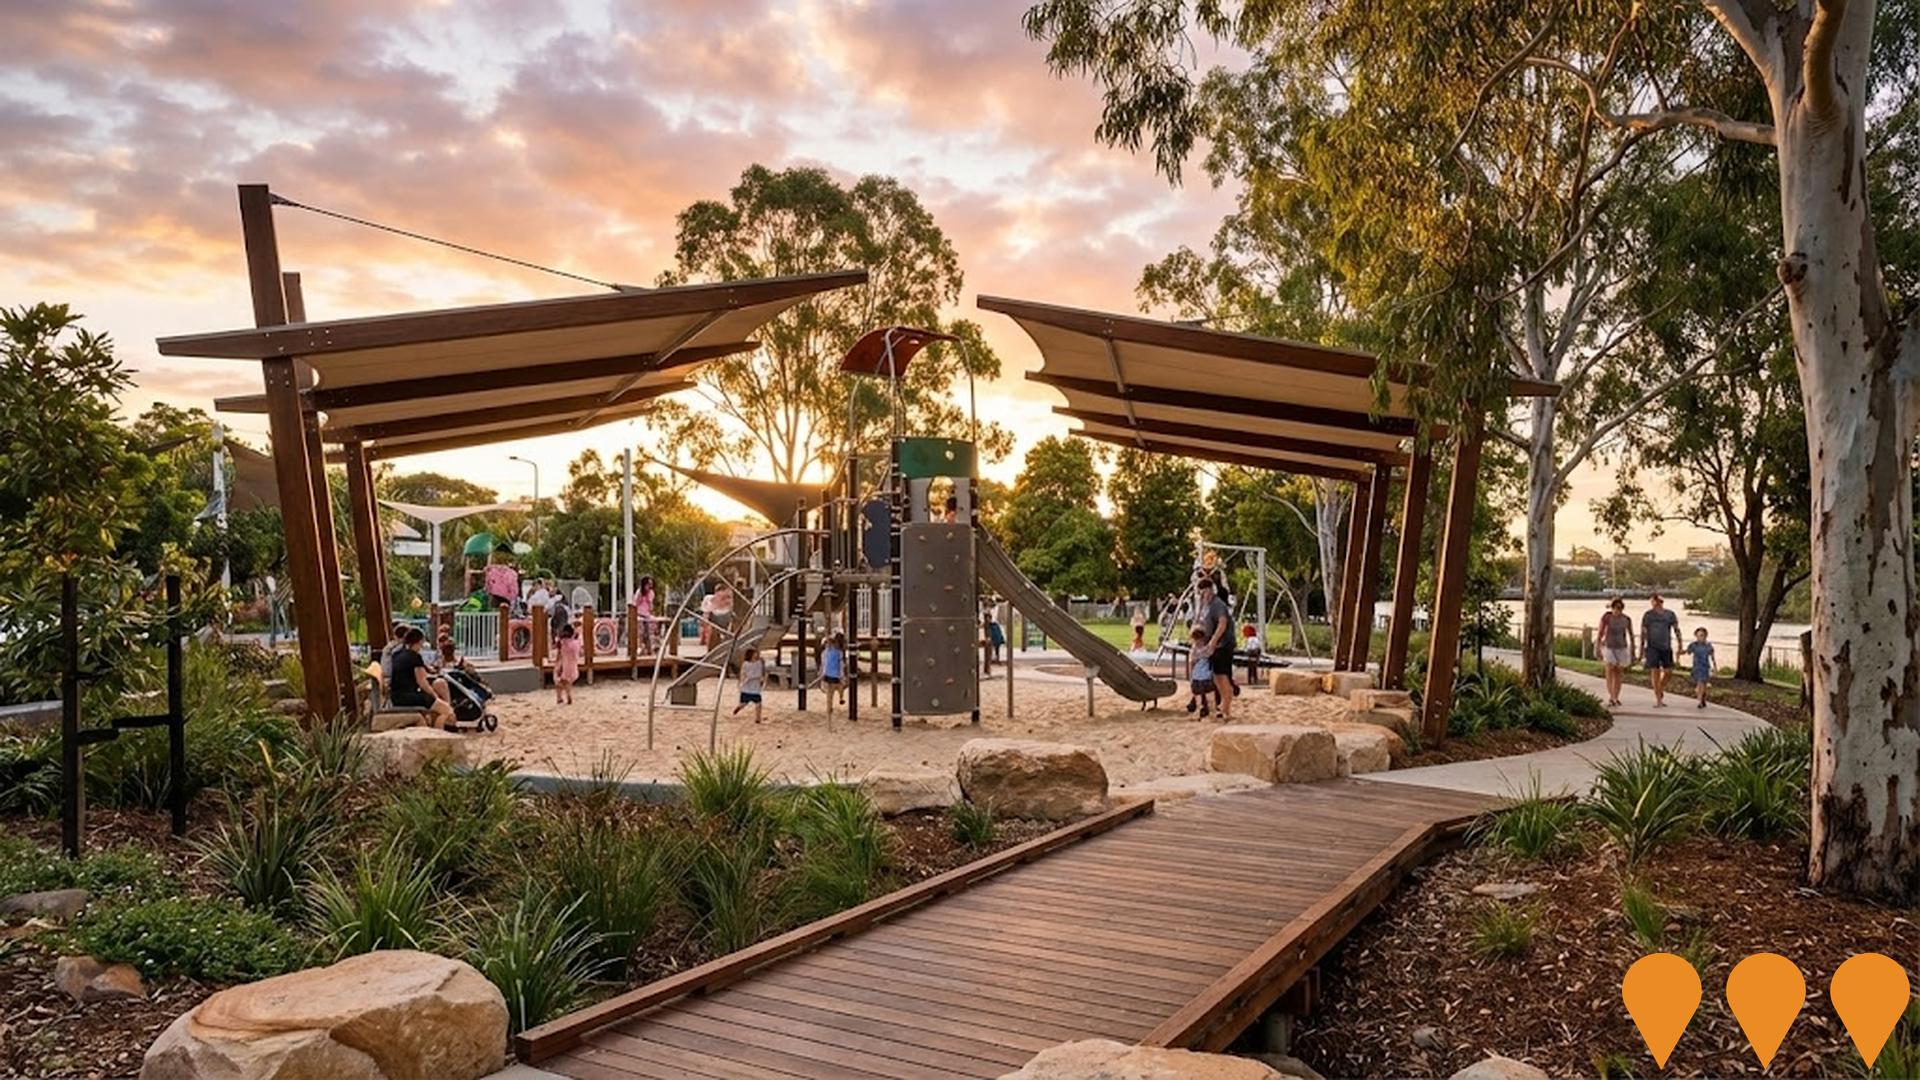
 Denotes AI-based impression for illustrative purposes only, not to be taken as definitive under any circumstances. Please follow links and conduct other investigations from the project's source for actual imagery. Developers and project owners wishing us to use original imagery please Contact Us and we will do so.
Frequently Asked Questions - Infrastructure
Teneriffe Banks
Brisbane's largest private mixed-use riverfront development by Kokoda Property. Five towers delivering 213 luxury residential apartments, Brisbane's first Kimpton Hotel (163 keys), commercial office space, riverfront dining, retail and over 4,800 sqm of public waterfront amenities including a 220 m riverwalk extension. Staged construction is underway with first completions expected 2027.
Waterfront Newstead - Mirvac Masterplan
Long-running, $1 billion masterplanned community and urban renewal project by Mirvac along the Brisbane River. The precinct includes luxury apartments, build-to-rent housing (LIV Anura), commercial and retail spaces, and over 50% dedicated public parkland and open space. The 'Sky Precinct' is the latest phase, with Quay (135 apartments) recently completed, Isle (133 apartments) under construction with expected completion in 2026, and the final residential tower (Sky Stage 3, 138 apartments) approved.

Lua Bulimba - Oxford Street Lifestyle Precinct
A completed three-level mixed-use lifestyle precinct on Oxford Street, Bulimba, anchored by a full-line Harris Farm Markets supermarket. Includes boutique food and beverage operators, wellness tenancies, specialty retail and a rooftop dining and entertainment venue. The project has revitalised the western end of the Oxford Street retail strip with upgraded streetscapes, laneway activation and new public realm improvements.
Bulimba Barracks Master Plan
Major redevelopment of the 20-hectare former Bulimba Barracks site into a masterplanned community. The project includes approximately 855 residential dwellings (apartments and townhouses), a retail and dining precinct centred around the heritage fabrication workshop, and extensive riverfront parklands. Remediation and civil works are currently progressing.
Bulimba Memorial Park and Community Centre Upgrade
Staged upgrade of the heritage listed Bulimba Memorial Park to provide a safer, more modern family playground and improved community recreation facilities. Stage 1 replaces ageing equipment and damaged trees with a new toddler and young children play area, shade and seating. Stage 2 is funded and will deliver new play equipment for older children, additional fencing along Stuart Street, better drainage and refreshed park landscaping. The project protects the park's memorial character while supporting local sport, community events and everyday use.
Riverside Green - Bulimba Creek Parkland Enhancement
Parkland enhancement along Bulimba Creek focused on trail upgrades, native vegetation restoration, play space renewal, and improved stormwater treatment to strengthen the local creek corridor and community access.
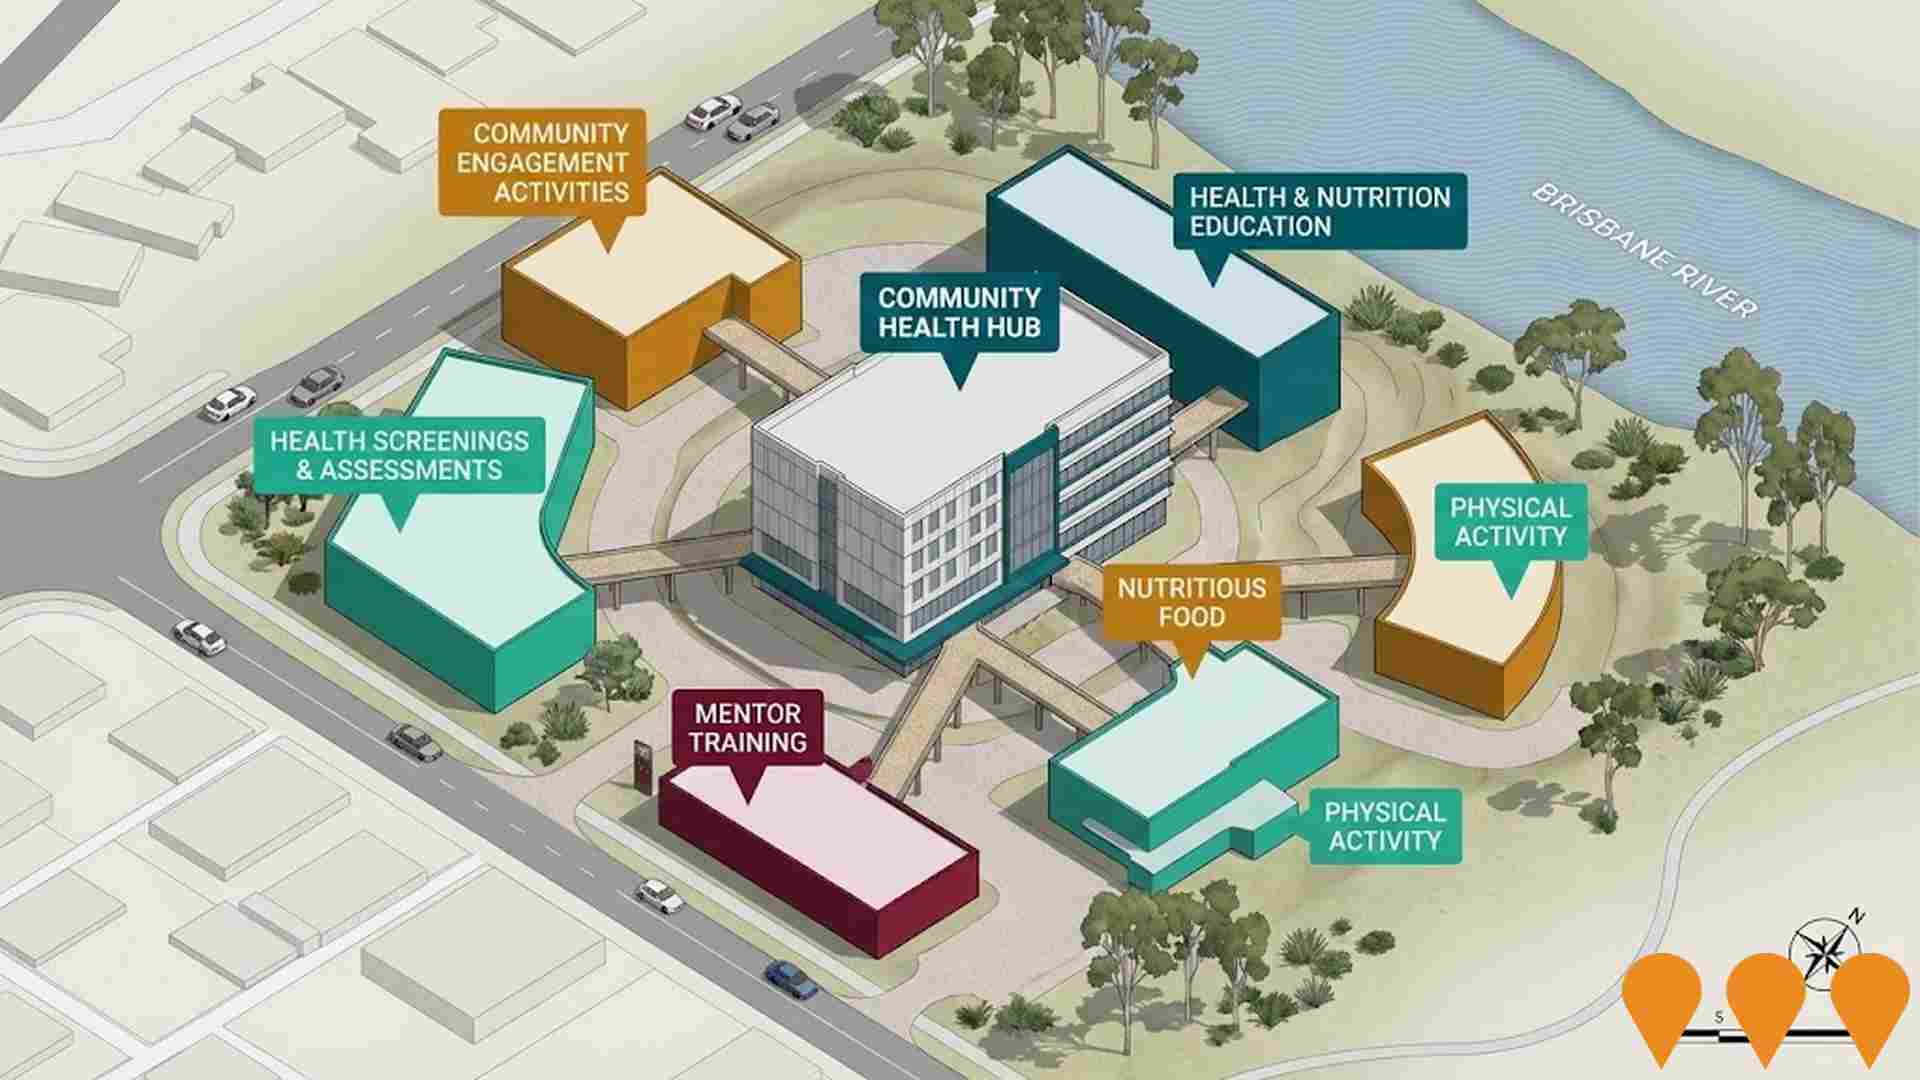
Community Health Hub - Bulimba
Proposed community health facility providing primary care services, allied health, community health programs, and specialist outreach services to serve the growing Bulimba population.
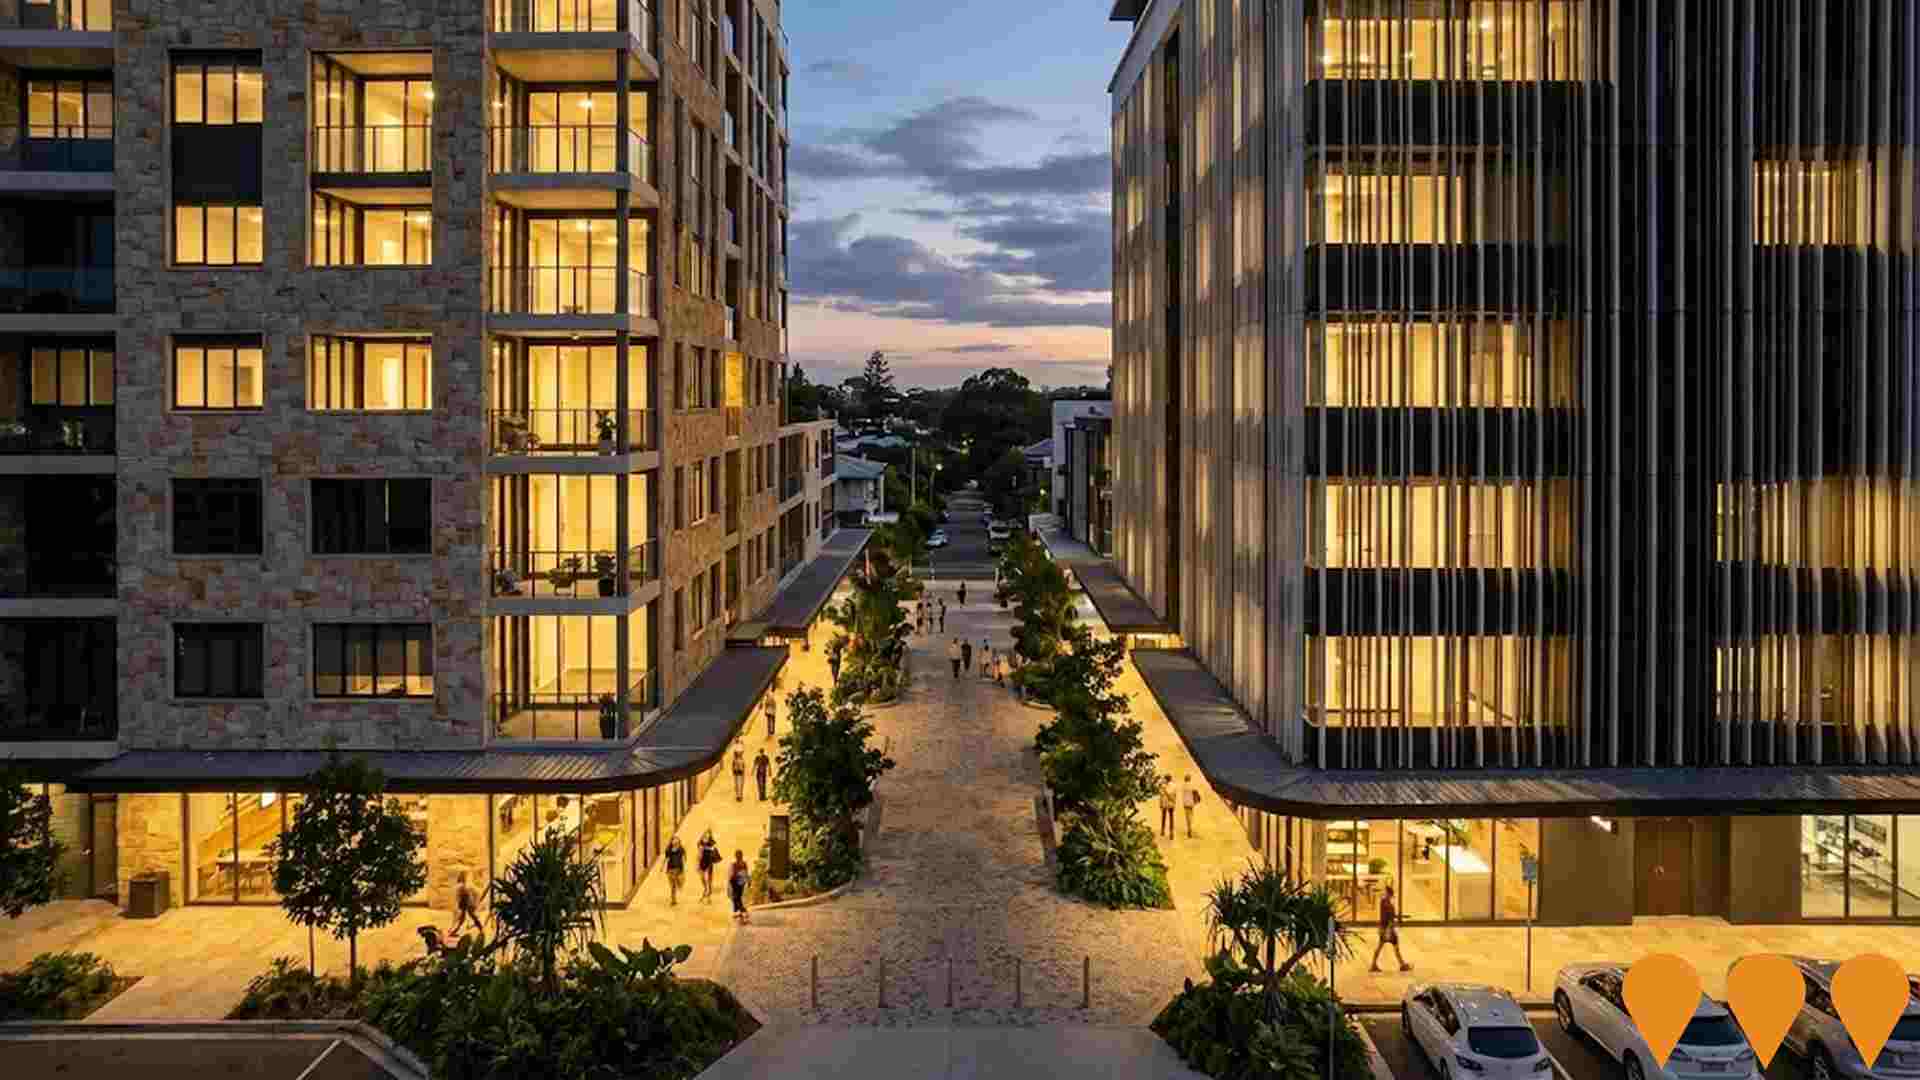
QParks Group - 5 Riding Road Mixed-Use Development
Mixed-use development featuring 110 apartments across two towers (8 and 9 storeys), ground floor retail spaces, and basement parking for 137 vehicles. Includes landscaped communal areas and rooftop amenities.
Employment
The labour market strength in Bulimba positions it well ahead of most Australian regions
Bulimba has a highly educated workforce with strong professional services representation. Its unemployment rate is 2.1%, lower than Greater Brisbane's 4.0%.
As of September 2025, 4,955 residents are employed and the participation rate is 71.2% compared to Greater Brisbane's 64.5%. Employment is concentrated in professional & technical (38.1%), health care & social assistance (13.1%), and education & training sectors. The area specializes in professional & technical jobs, with an employment share 1.8 times the regional level. However, health care & social assistance shows lower representation at 13.1% versus the regional average of 16.1%.
Between September 2024 and September 2025, employment levels increased by 0.5%, labour force grew by 0.7%, and unemployment rose by 0.2 percentage points. In contrast, Greater Brisbane had employment growth of 3.8% and a 0.5 percentage point drop in unemployment. Statewide, Queensland's employment contracted by 0.01% (losing 1,210 jobs) as of 25-Nov-25, with an unemployment rate of 4.2%. National employment forecasts from May-25 suggest a 6.6% increase over five years and 13.7% over ten years. Applying these projections to Bulimba's employment mix indicates local employment should grow by 7.1% over five years and 14.3% over ten years, assuming constant population projections.
Frequently Asked Questions - Employment
Income
The economic profile demonstrates exceptional strength, placing the area among the top 10% nationally based on comprehensive AreaSearch income analysis
The Bulimba SA2 had an exceptionally high national income level according to latest ATO data aggregated by AreaSearch for financial year 2022. The median income among taxpayers was $76,477 and the average income stood at $132,680, comparing favourably with Greater Brisbane's figures of $55,645 and $70,520 respectively. Based on Wage Price Index growth of 13.99% since financial year 2022, estimated incomes as of September 2025 would be approximately $87,176 (median) and $151,242 (average). Census data shows household, family and personal incomes all rank highly in Bulimba, between the 95th and 96th percentiles nationally. Income distribution reveals that 36.2% of the population (2,863 individuals) fall within the $4000+ income range, differing from regional patterns where $1,500 - 2,999 dominates with 33.3%. The substantial proportion of high earners (48.5% above $3,000/week) indicates strong economic capacity throughout Bulimba. Housing accounts for 14.3% of income while strong earnings rank residents within the 95th percentile for disposable income. The area's SEIFA income ranking places it in the 10th decile.
Frequently Asked Questions - Income
Housing
Bulimba displays a diverse mix of dwelling types, with above-average rates of outright home ownership
The dwelling structure in Bulimba, as per the latest Census, consisted of 46.2% houses and 53.8% other dwellings (semi-detached, apartments, 'other' dwellings). In comparison, Brisbane metro had 52.7% houses and 47.3% other dwellings. Home ownership in Bulimba was at 28.1%, with the rest being mortgaged (35.1%) or rented (36.9%). The median monthly mortgage repayment in Bulimba was $2,800, higher than Brisbane metro's average of $2,500. The median weekly rent in Bulimba was $500, compared to Brisbane metro's $440. Nationally, Bulimba's mortgage repayments were significantly higher than the Australian average of $1,863, and rents were substantially above the national figure of $375.
Frequently Asked Questions - Housing
Household Composition
Bulimba has a typical household mix, with a fairly typical median household size
Family households constitute 71.4 percent of all households, including 31.7 percent couples with children, 30.2 percent couples without children, and 8.4 percent single parent families. Non-family households account for the remaining 28.6 percent, with lone person households at 25.4 percent and group households comprising 3.3 percent of the total. The median household size is 2.4 people, which aligns with the Greater Brisbane average.
Frequently Asked Questions - Households
Local Schools & Education
The educational profile of Bulimba exceeds national averages, with above-average qualification levels and academic performance metrics
Bulimba's educational attainment is notably higher than regional averages. Among residents aged 15+, 50.8% have university qualifications, surpassing Queensland's 25.7% and Australia's 30.4%. The area's strongest showing is in Bachelor degrees (33.2%), followed by postgraduate qualifications (12.6%) and graduate diplomas (5.0%). Vocational pathways account for 23.3%, with advanced diplomas at 10.1% and certificates at 13.2%.
Educational participation is high, with 29.1% currently enrolled in formal education. This includes 9.5% in primary education, 7.7% in secondary education, and 7.1% pursuing tertiary education.
Frequently Asked Questions - Education
Schools Detail
Nearby Services & Amenities
Transport
Transport servicing is high compared to other areas nationally based on assessment of service frequency, route connectivity and accessibility
Bulimba has 37 active public transport stops, serving a mix of ferry and bus routes. These stops are spread across nine individual routes, collectively facilitating 2,700 weekly passenger trips. The average distance from residents to the nearest transport stop is 154 meters, indicating excellent accessibility.
Service frequency averages 385 trips per day across all routes, equating to approximately 72 weekly trips per stop.
Frequently Asked Questions - Transport
Transport Stops Detail
Health
Bulimba's residents boast exceedingly positive health performance metrics with very low prevalence of common health conditions across all age groups
Bulimba shows excellent health outcomes with a low prevalence of common conditions across all ages. Private health cover stands at approximately 82% (6,510 people), compared to 73.8% in Greater Brisbane and 55.3% nationally. Mental health issues affect 7.6%, while asthma impacts 6.6%.
A total of 74.8% report no medical ailments, similar to the 74.9% in Greater Brisbane. Bulimba has a higher proportion of seniors aged 65 and over at 16.8% (1,325 people), compared to 11.3% in Greater Brisbane. Senior health outcomes align with the general population's profile.
Frequently Asked Questions - Health
Cultural Diversity
The level of cultural diversity witnessed in Bulimba was found to be slightly above average when compared nationally for a number of language and cultural background related metrics
Bulimba's cultural diversity is above average, with 12.0% speaking a language other than English at home and 27.6% born overseas. Christianity is the main religion in Bulimba, making up 50.7%, compared to 47.7% across Greater Brisbane. The top three ancestry groups are English (29.8%), Australian (22.1%), and Irish (10.5%).
Scottish representation is notably higher at 9.7% compared to the regional average of 8.7%. Welsh and French representations are also slightly higher at 0.8% each, matching their respective regional averages.
Frequently Asked Questions - Diversity
Age
Bulimba's population is slightly older than the national pattern
Bulimba has a median age of 41, which is higher than Greater Brisbane's figure of 36 and Australia's figure of 38. The 55-64 age cohort is notably over-represented in Bulimba at 14.9%, compared to the Greater Brisbane average, while the 25-34 age cohort is under-represented at 12.2%. From 2021 to present, the 75-84 age group has grown from 4.0% to 5.9% of the population, and the 55-64 cohort has increased from 13.1% to 14.9%. Conversely, the 35-44 cohort has declined from 16.1% to 14.5%, and the 45-54 group has dropped from 15.9% to 14.3%. By 2041, demographic modeling suggests Bulimba's age profile will evolve significantly. The 75-84 age cohort is projected to grow by 412 people (89%), from 465 to 878. Notably, the combined 65+ age groups are expected to account for 64% of total population growth. Meanwhile, the 5-14 and 0-4 cohorts are expected to experience population declines.
