Chart Color Schemes
This analysis uses ABS Statistical Areas Level 2 (SA2) boundaries, which can materially differ from Suburbs and Localities (SAL) even when sharing similar names.
SA2 boundaries are defined by the Australian Bureau of Statistics and are designed to represent communities for statistical reporting (e.g., census and ERP).
Suburbs and Localities (SAL) represent commonly-used suburb/locality names (postal-style areas) and may use different geographic boundaries. For comprehensive analysis, consider reviewing both boundary types if available.
est. as @ -- *
ABS ERP | -- people | --
2021 Census | -- people
Sales Activity
Curious about local property values? Filter the chart to assess the volume and appreciation (including resales) trends and regional comparisons, or scroll to the map below view this information at an individual property level.
Find a Recent Sale
Sales Detail
Population
Windsor lies within the top quartile of areas nationally for population growth performance according to AreaSearch analysis of recent, and medium to long-term trends
Windsor's population is approximately 8,987 as of November 2025. This figure represents an increase of 1,009 people since the 2021 Census, which recorded a population of 7,978. The growth was inferred from the estimated resident population of 8,856 in June 2024 and an additional 365 validated new addresses post-Census. This results in a population density ratio of 3,077 persons per square kilometer, placing Windsor in the upper quartile nationally according to AreaSearch's assessment. Windsor's growth rate of 12.6% since the 2021 Census exceeds both national (8.9%) and state averages, positioning it as a region leader for population growth. Overseas migration contributed approximately 56.2% of overall population gains during recent periods, although all factors including interstate migration and natural growth were positive drivers.
AreaSearch adopts ABS/Geoscience Australia projections for each SA2 area, released in 2024 with a base year of 2022. For areas not covered by this data and years post-2032, Queensland State Government's SA2 area projections from 2023 based on 2021 data are used, with proportional growth weightings applied for age cohorts in line with ABS Greater Capital Region projections released in 2023. Future population trends indicate an above median growth projection for the area, with an expected increase of 2,123 persons by 2041 based on latest annual ERP population numbers, reflecting a total gain of 22.0% over the 17-year period.
Frequently Asked Questions - Population
Development
AreaSearch analysis of residential development drivers sees Windsor recording a relatively average level of approval activity when compared to local markets analysed countrywide
Windsor has averaged approximately 24 new dwelling approvals annually over the past five financial years, totalling 124 homes. As of FY-26, 57 approvals have been recorded. On average, 5.7 new residents per year arrive for each dwelling constructed between FY-21 and FY-25. This discrepancy between demand and supply typically leads to price growth and increased buyer competition, with new properties being constructed at an average expected cost of $307,000.
In this financial year, $13.7 million in commercial approvals have been registered, indicating balanced commercial development activity compared to Greater Brisbane. Windsor has significantly less development activity, 58.0% below the regional average per person, which often reinforces demand and pricing for existing dwellings due to constrained new construction. This is also lower than nationally, suggesting market maturity and possible development constraints. New development consists of 29.0% detached dwellings and 71.0% townhouses or apartments, reflecting a trend towards denser development that appeals to downsizers, investors, and entry-level buyers. This marks a significant change from the current housing mix, which is currently 49.0% houses. Windsor's population density is around 1177 people per approval, indicating a mature, established area. According to the latest AreaSearch quarterly estimate, Windsor is projected to add 1,980 residents by 2041.
If current development rates continue, housing supply may not keep pace with population growth, potentially increasing buyer competition and supporting stronger price growth.
Frequently Asked Questions - Development
Infrastructure
Windsor has very high levels of nearby infrastructure activity, ranking in the top 10% nationally
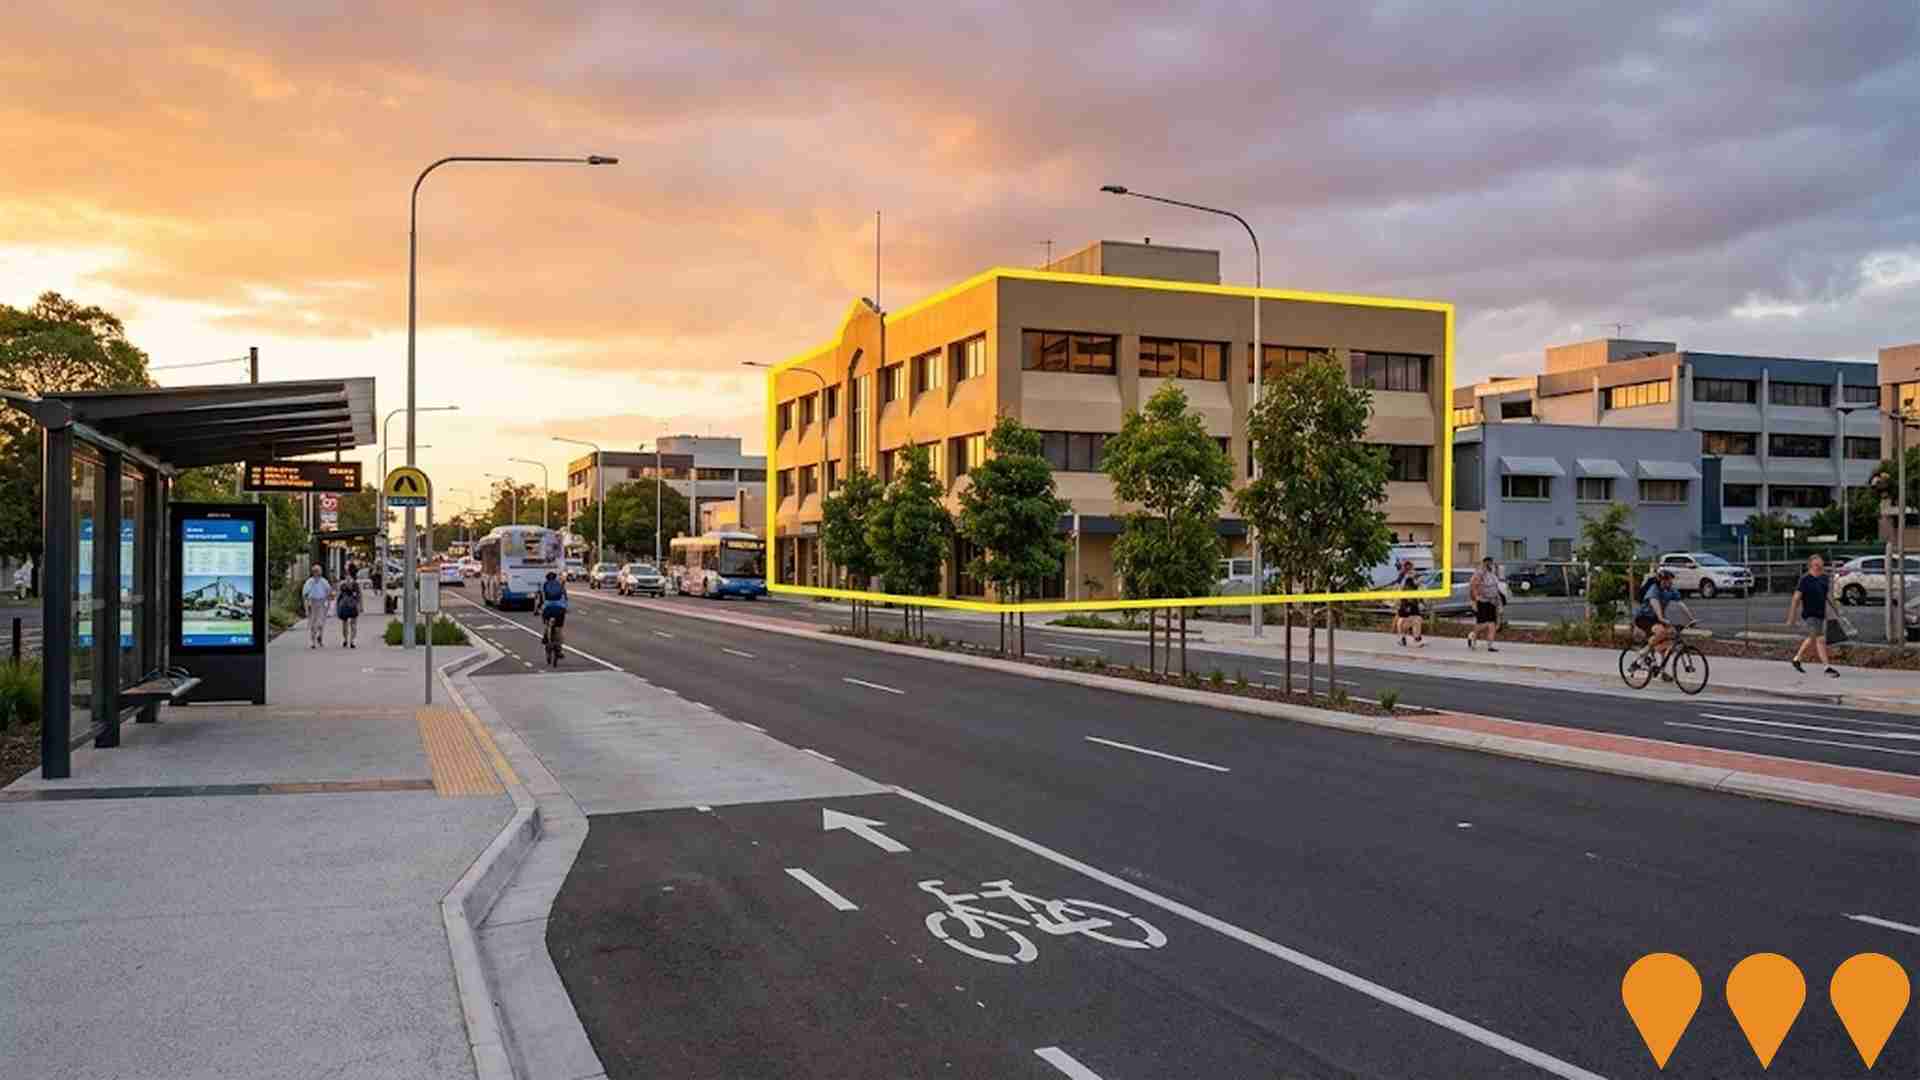
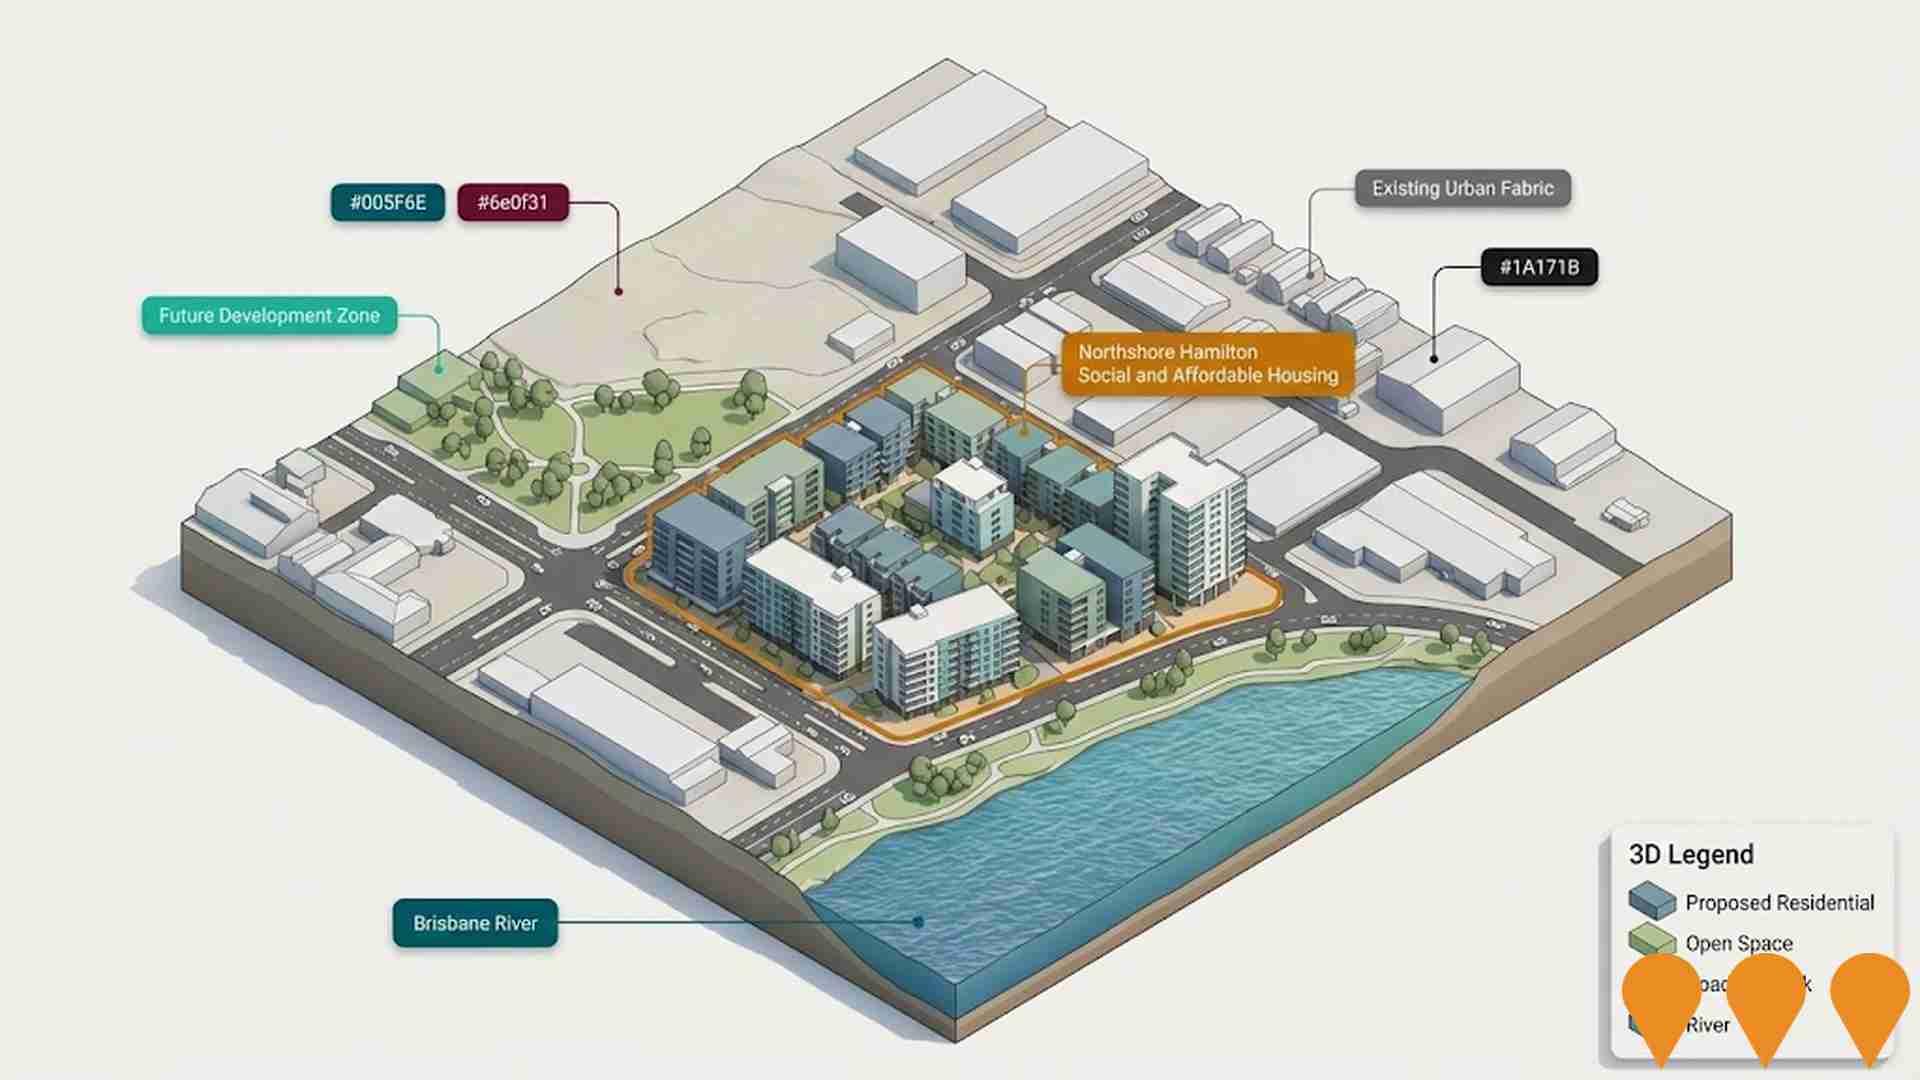
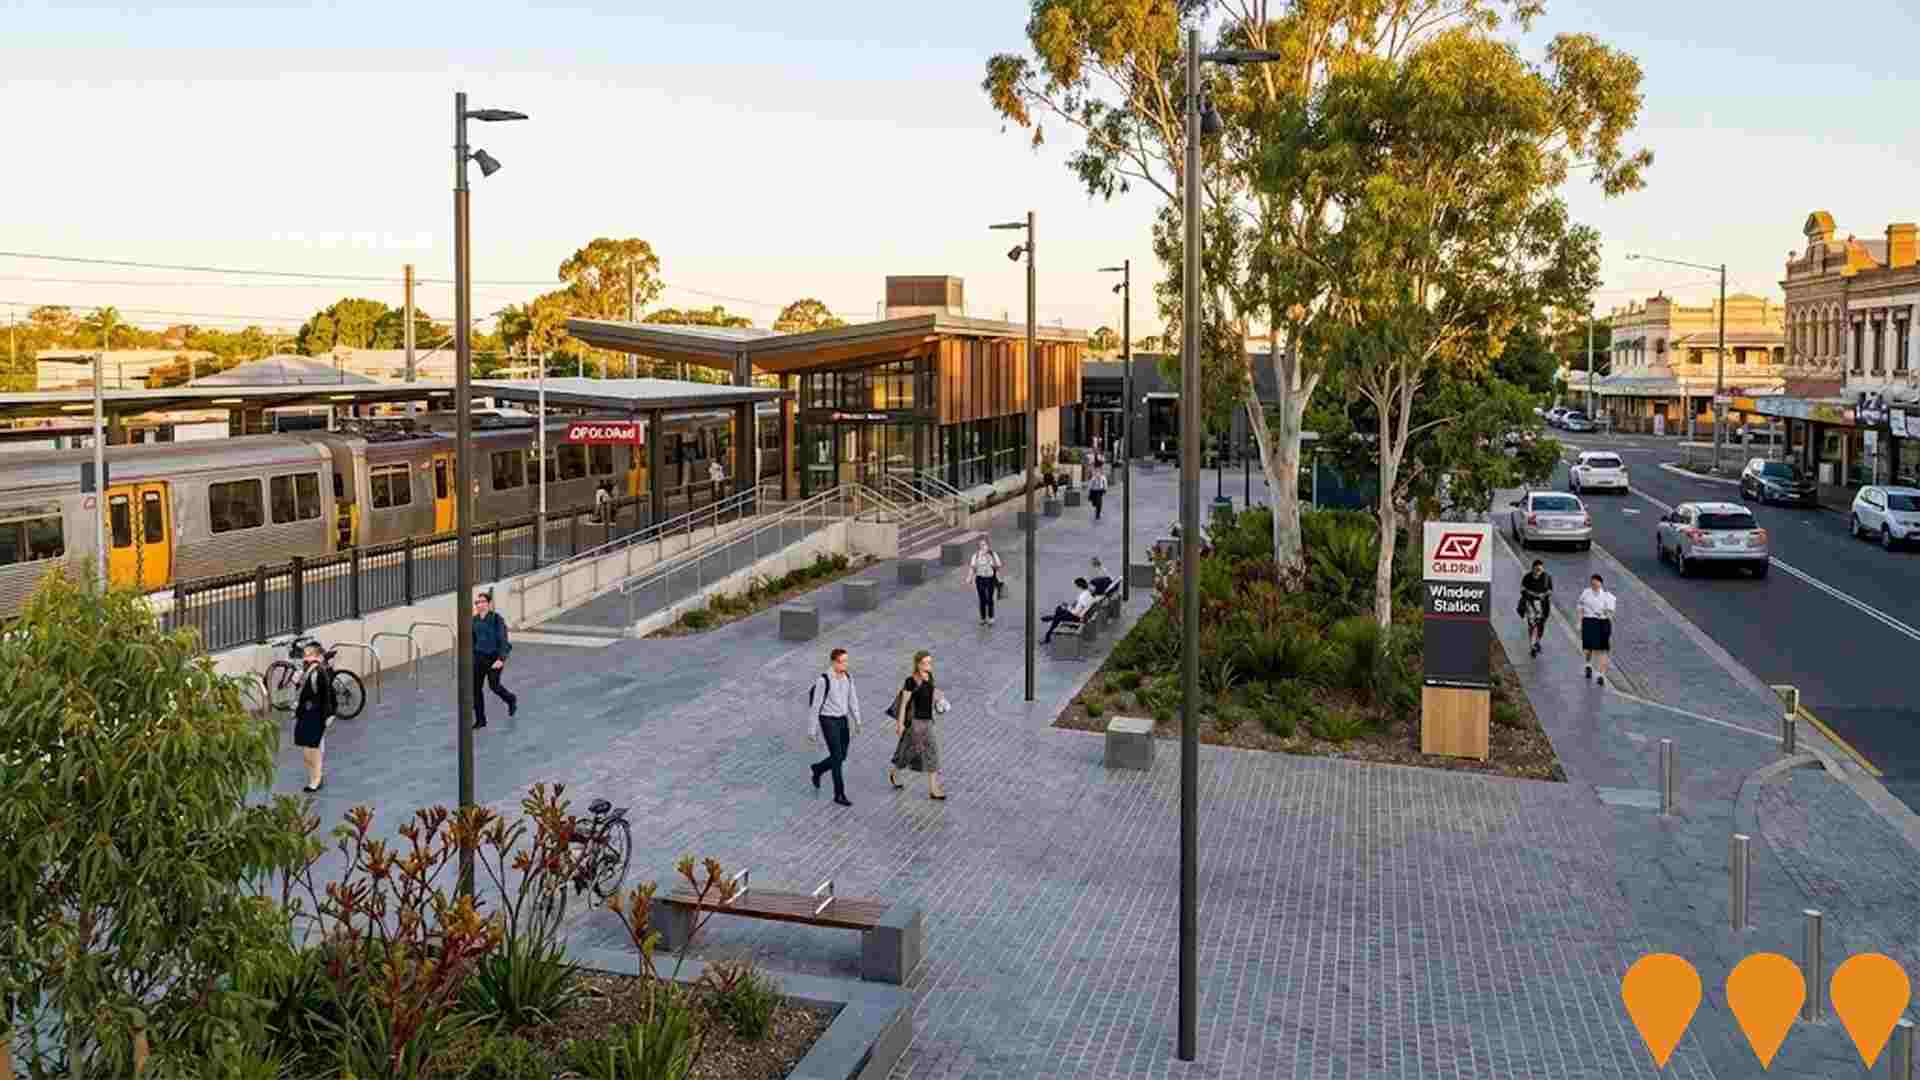
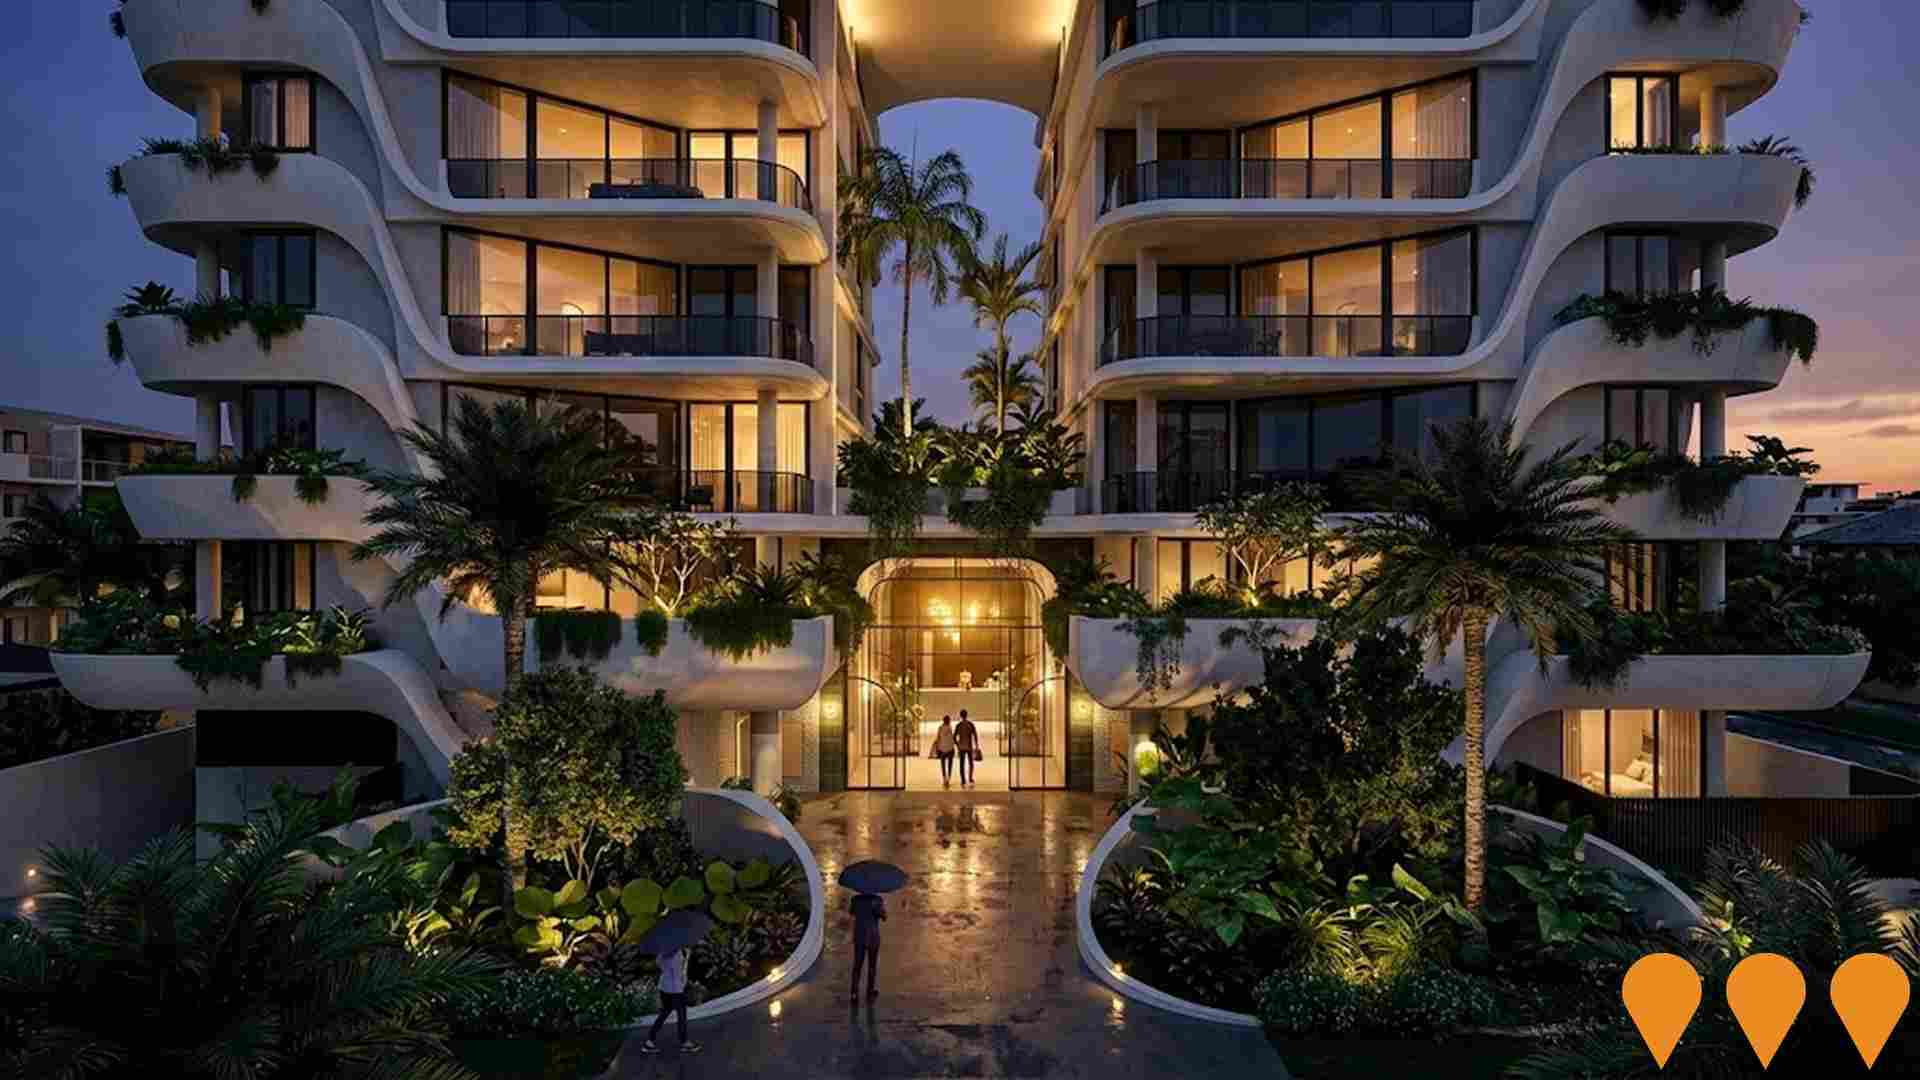
Infrastructure changes significantly influence an area's performance. AreaSearch identified 53 projects potentially impacting the region. Notable projects include Royal Brisbane and Women's Hospital Precinct, Windsor Station Upgrade, Mayne Rail Yards Heritage Precinct, and Queensland Cancer Centre. The following list details those likely to be most relevant.
Professional plan users can use the search below to filter and access additional projects.
INFRASTRUCTURE SEARCH
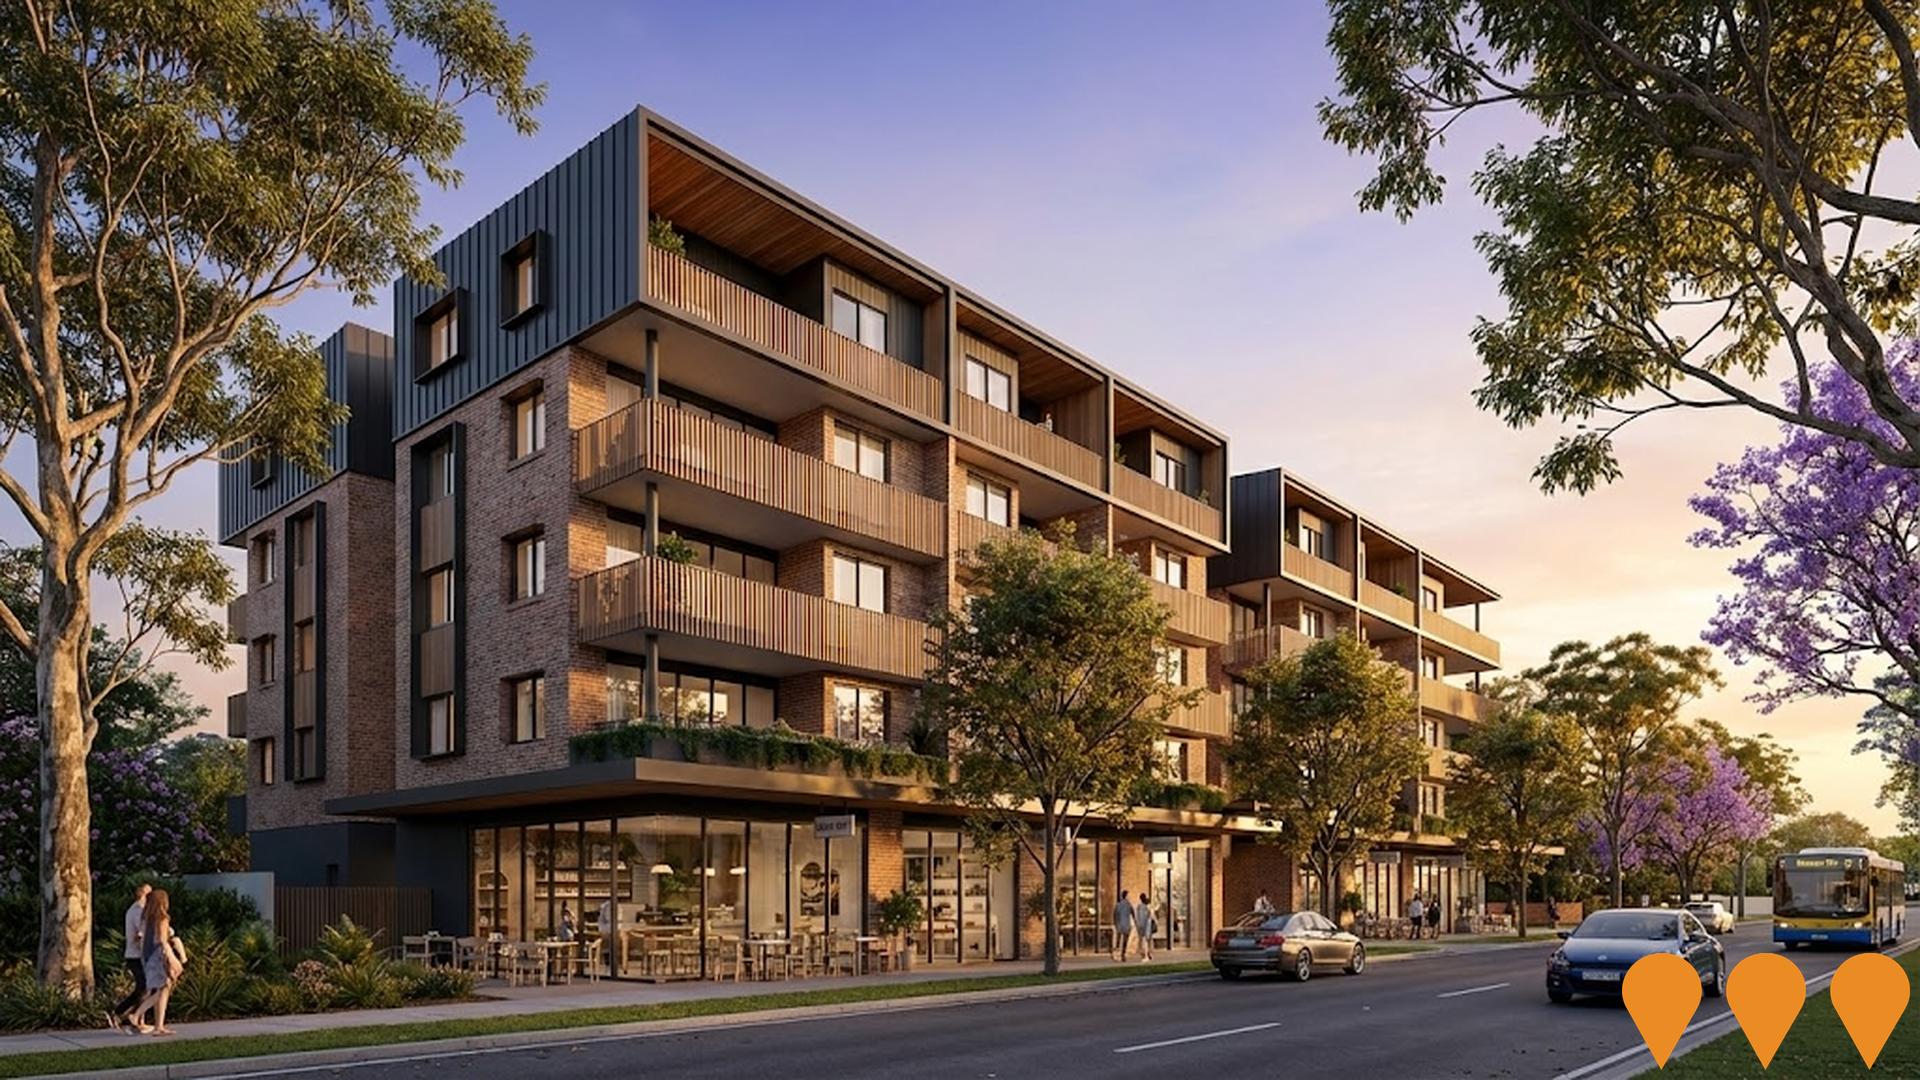
 Denotes AI-based impression for illustrative purposes only, not to be taken as definitive under any circumstances. Please follow links and conduct other investigations from the project's source for actual imagery. Developers and project owners wishing us to use original imagery please Contact Us and we will do so.
Frequently Asked Questions - Infrastructure
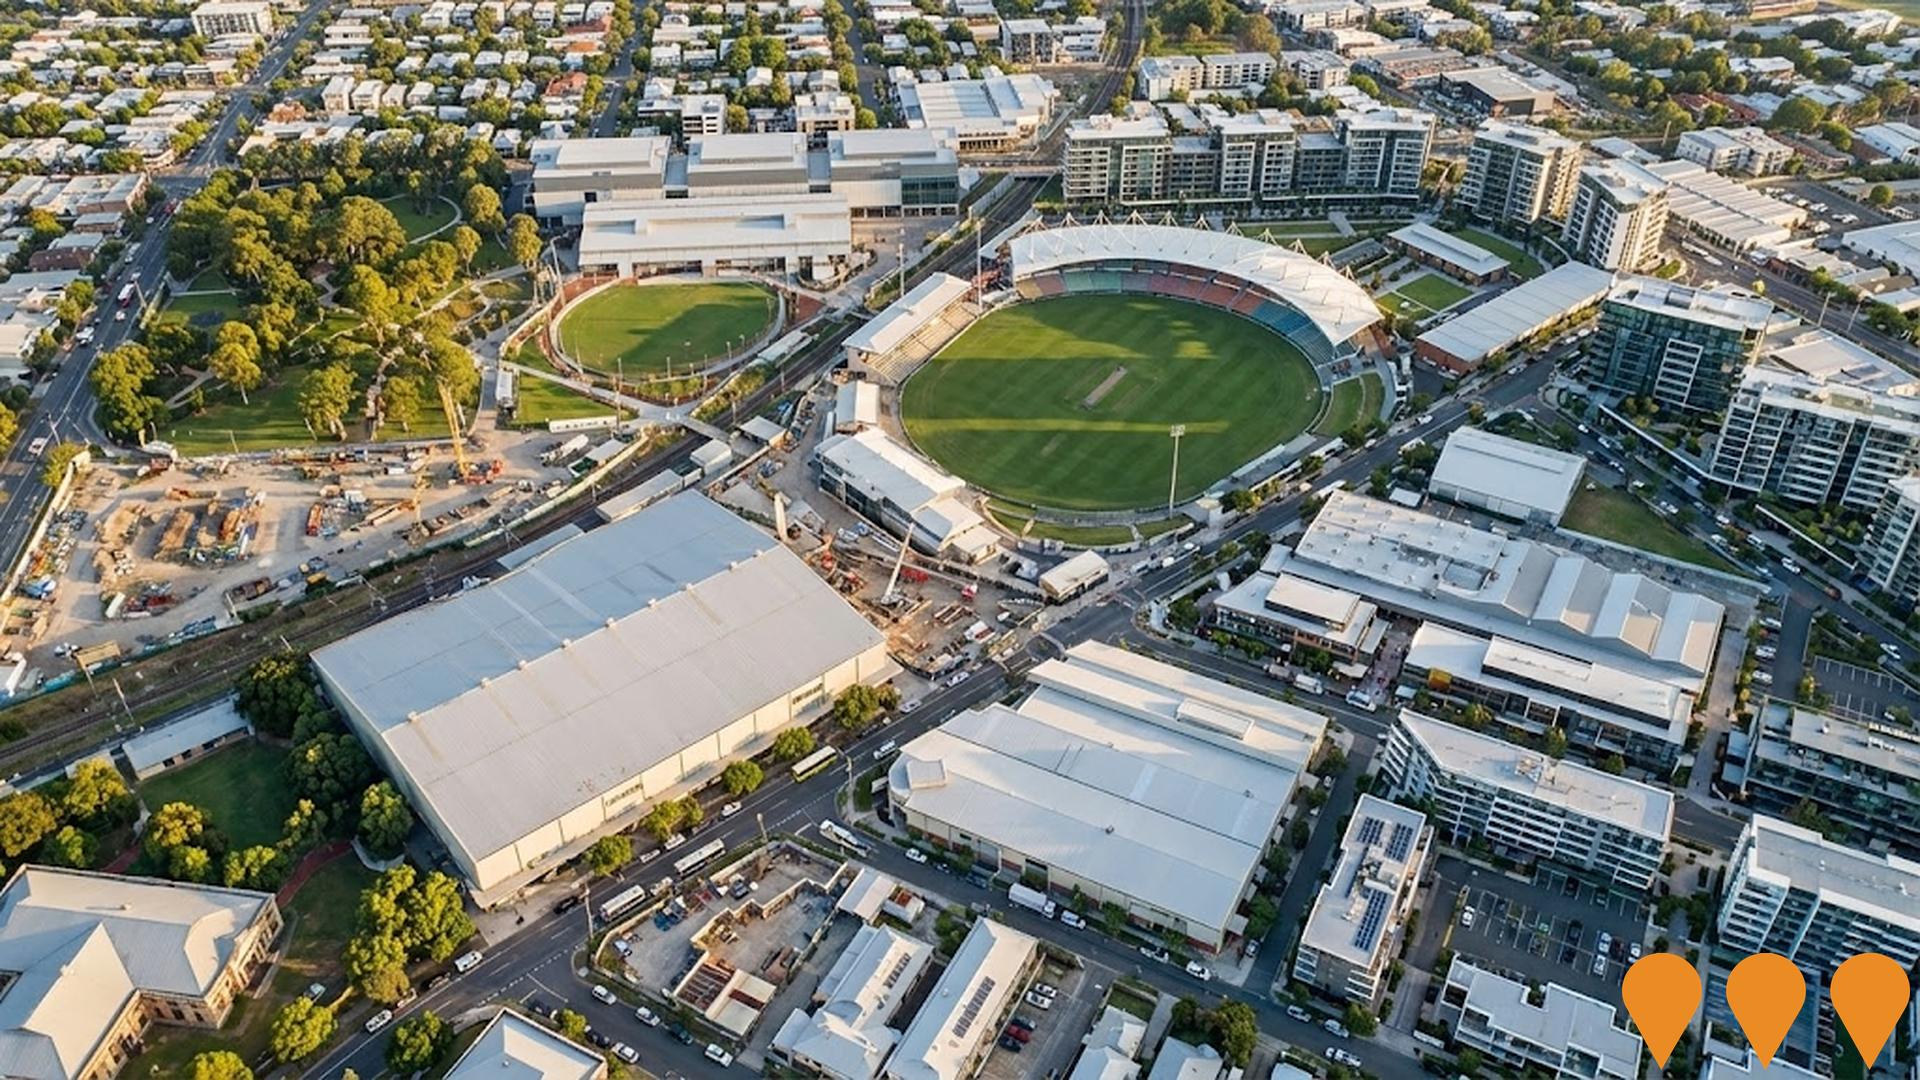
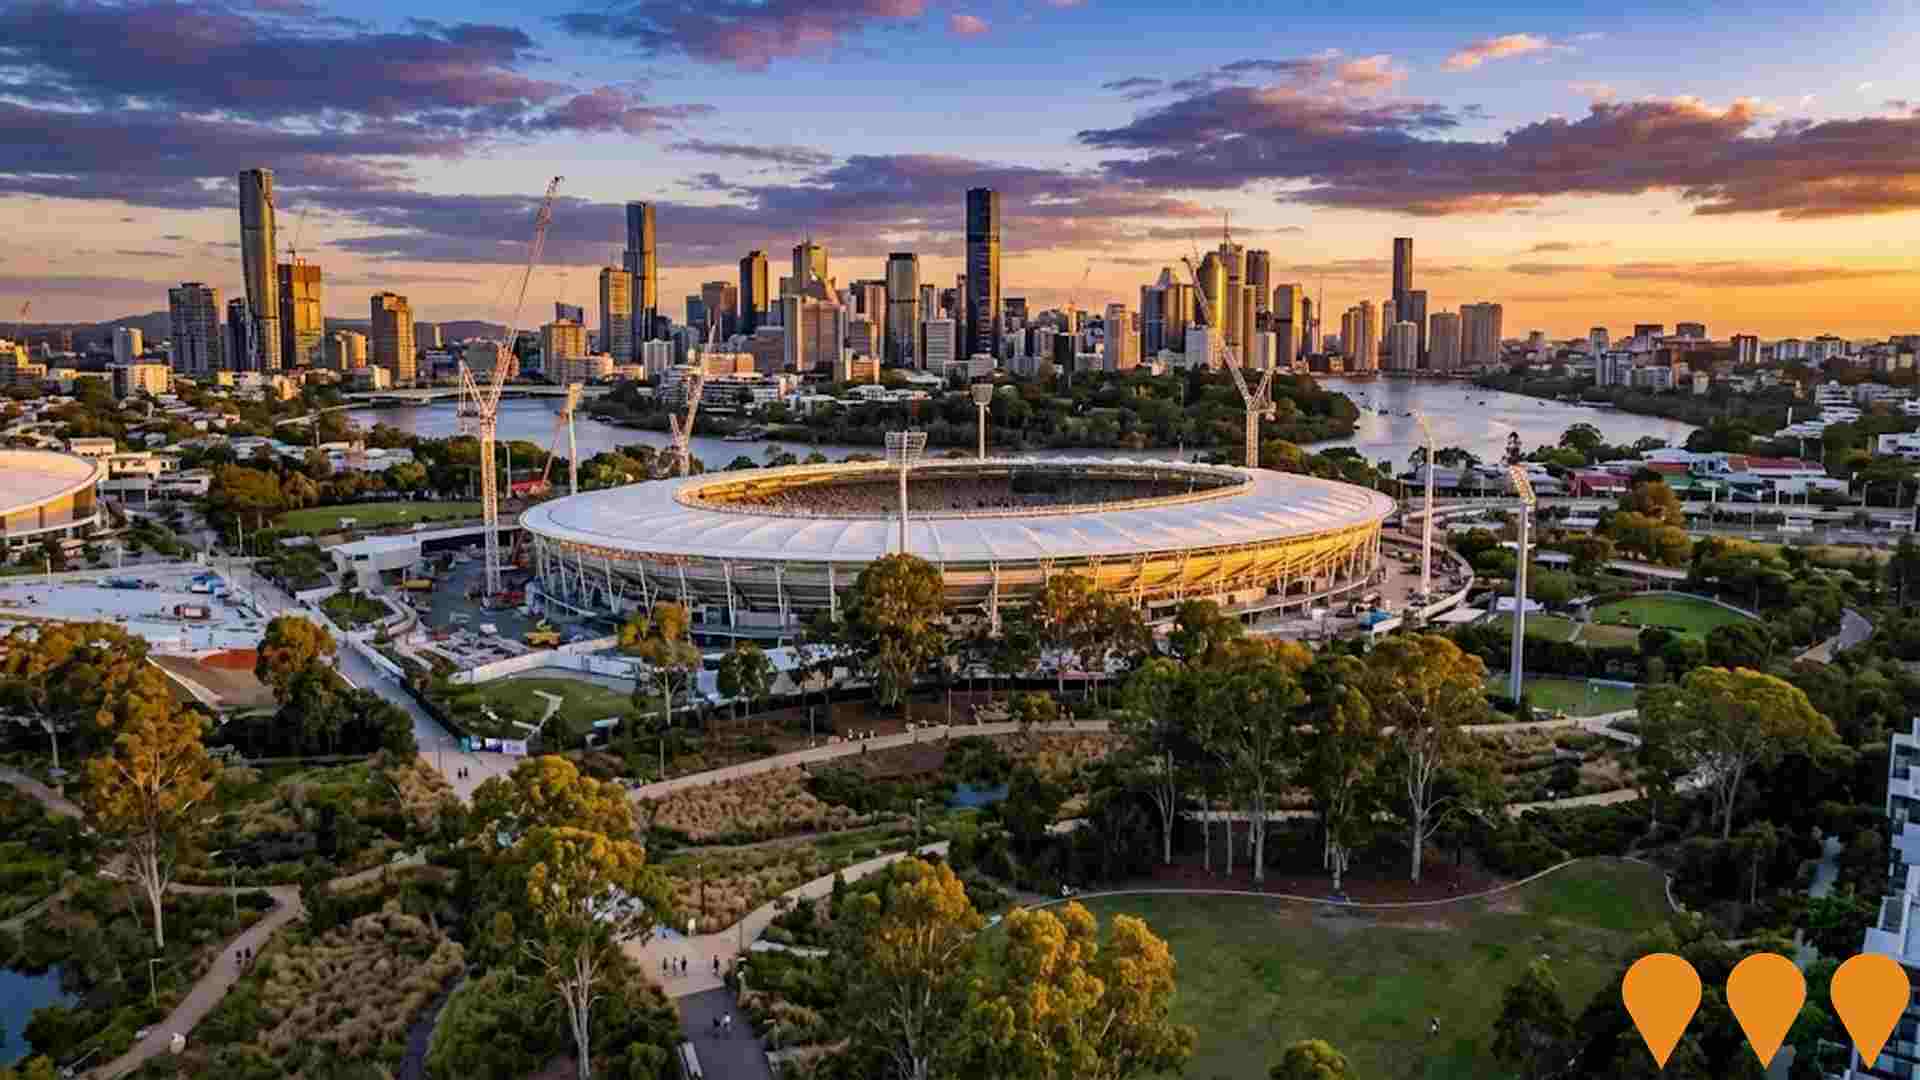
Brisbane Showgrounds Regeneration Project
Major urban regeneration of the 22-hectare Brisbane Showgrounds precinct, a long-term, staged project. Completed elements include the Royal International Convention Centre, King Street retail precinct, Rydges Hotel, Kingsgate commercial tower, 25 King engineered timber office building, and The Green and The Yards residential apartments. The current focus includes early works for the Brisbane 2032 Athletes Village and an upgrade of the 20,000-seat Main Arena, which will also temporarily host sporting events during The Gabba redevelopment. The overall project aims to deliver a vibrant, mixed-use precinct for living, working, and events, with a long-term completion date of 2033.
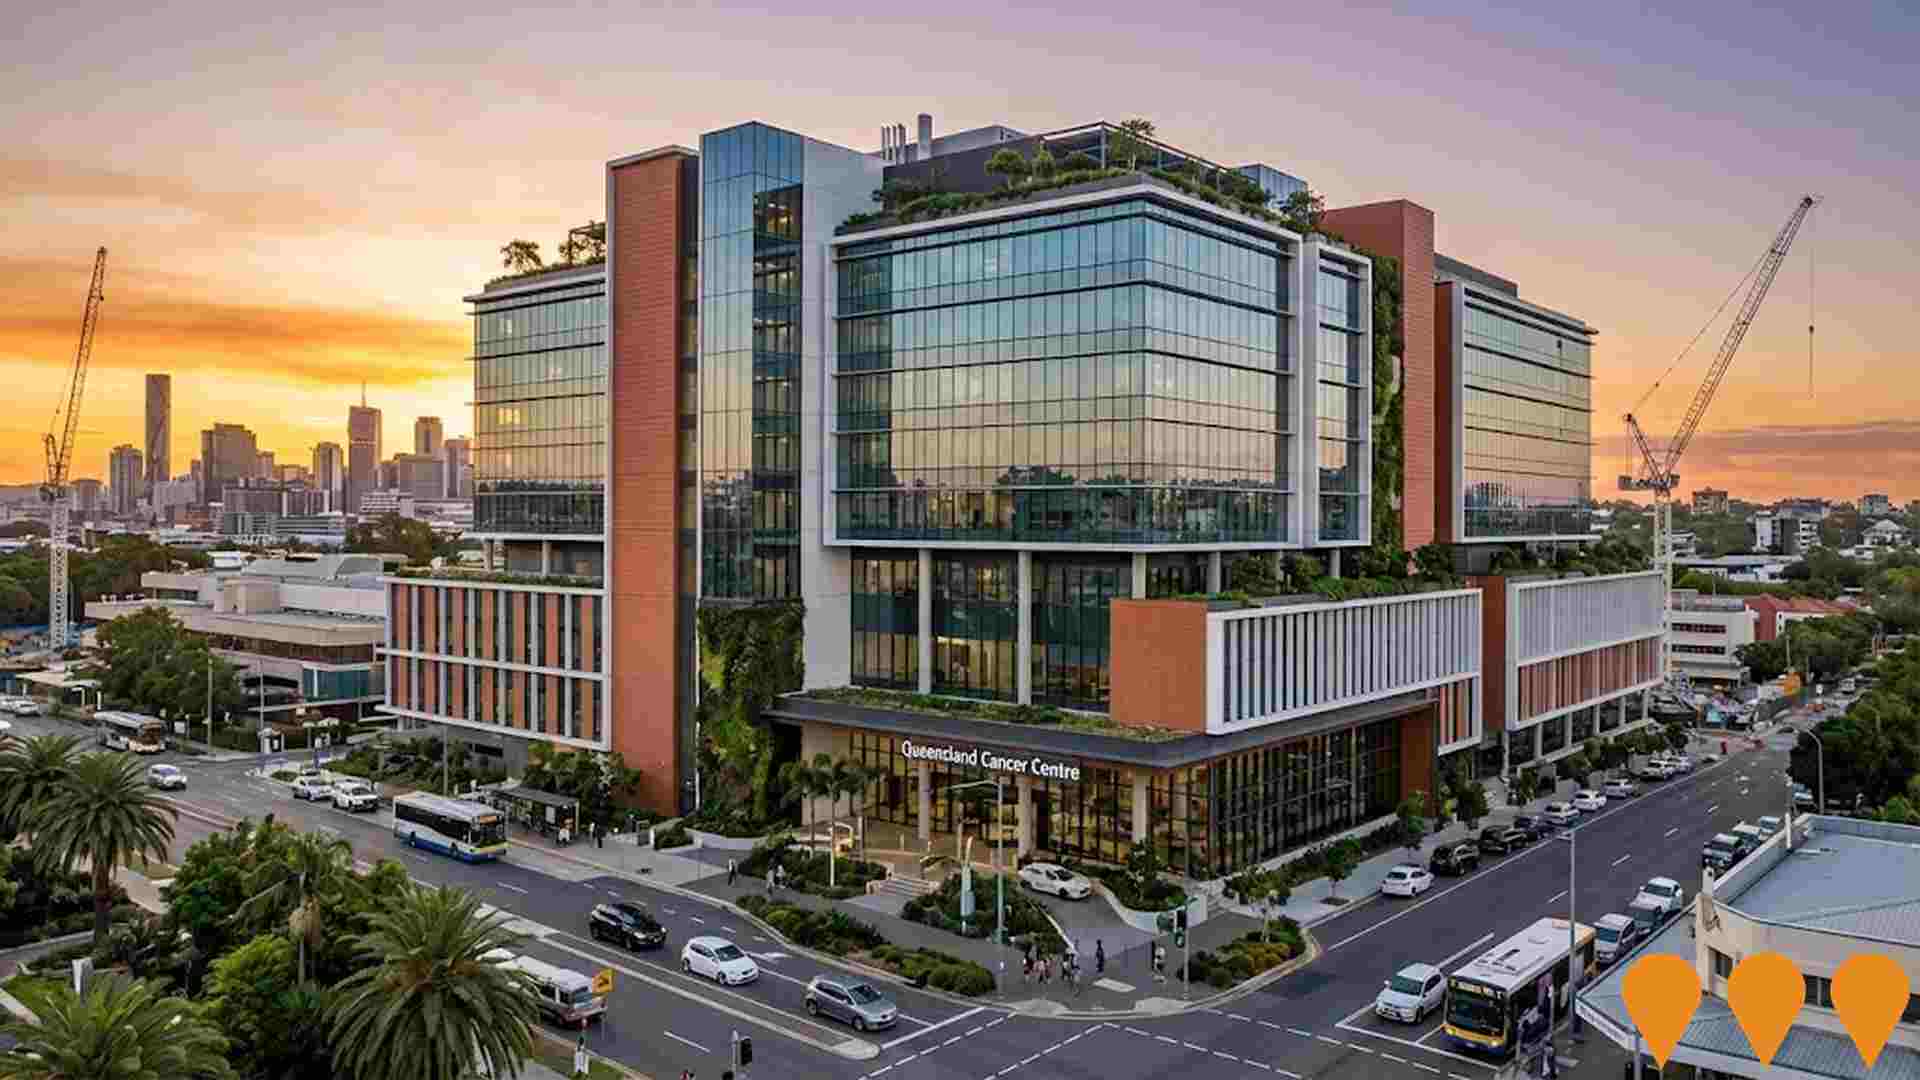
Queensland Cancer Centre
The Queensland Cancer Centre is a new dedicated tertiary cancer hospital being built within the Herston Health Precinct at the Royal Brisbane and Women's Hospital campus. The purpose-built facility will provide at least 150 inpatient beds and deliver comprehensive cancer services including medical oncology, radiation oncology, haematology, cellular therapies, nuclear theranostics, and proton beam therapy (future-proofed), together with clinical trials, research and education facilities. The centre is scheduled to open in late 2028.
New Queensland Cancer Centre (as part of RBWH Expansion)
Development of the New Queensland Cancer Centre (QCC) at the Herston Health Precinct, Royal Brisbane and Women's Hospital. The center is a major component of the Queensland Government's Capacity Expansion Program (CEP) and Hospital Rescue Plan. It is planned to deliver at least 150 beds and will be one of two facilities in Australia to offer proton beam therapy, alongside other cutting-edge cancer treatments and research. The total estimated cost has been increased from $1.2 billion to $1.8 billion, and the estimated completion date has been revised from 2028 to February 2031 at the earliest. Early site works were paused pending a review of the CEP. Lendlease is the preferred contractor for the design phase.
Victoria Park Stadium (Brisbane 2032 Olympic Stadium)
A new 60,000-seat (expandable to 63,000) multi-purpose stadium at Victoria Park/Barrambin to host the Opening and Closing Ceremonies and track & field events for the Brisbane 2032 Olympic and Paralympic Games. Post-Games it will become Queensland's premier rectangular stadium for AFL, cricket and major concerts. The Queensland Government confirmed Victoria Park as the preferred site in March 2025, replacing the earlier Gabba rebuild option. Master planning and environmental impact studies are underway, with an Expression of Interest process for the broader Victoria Park precinct now complete.
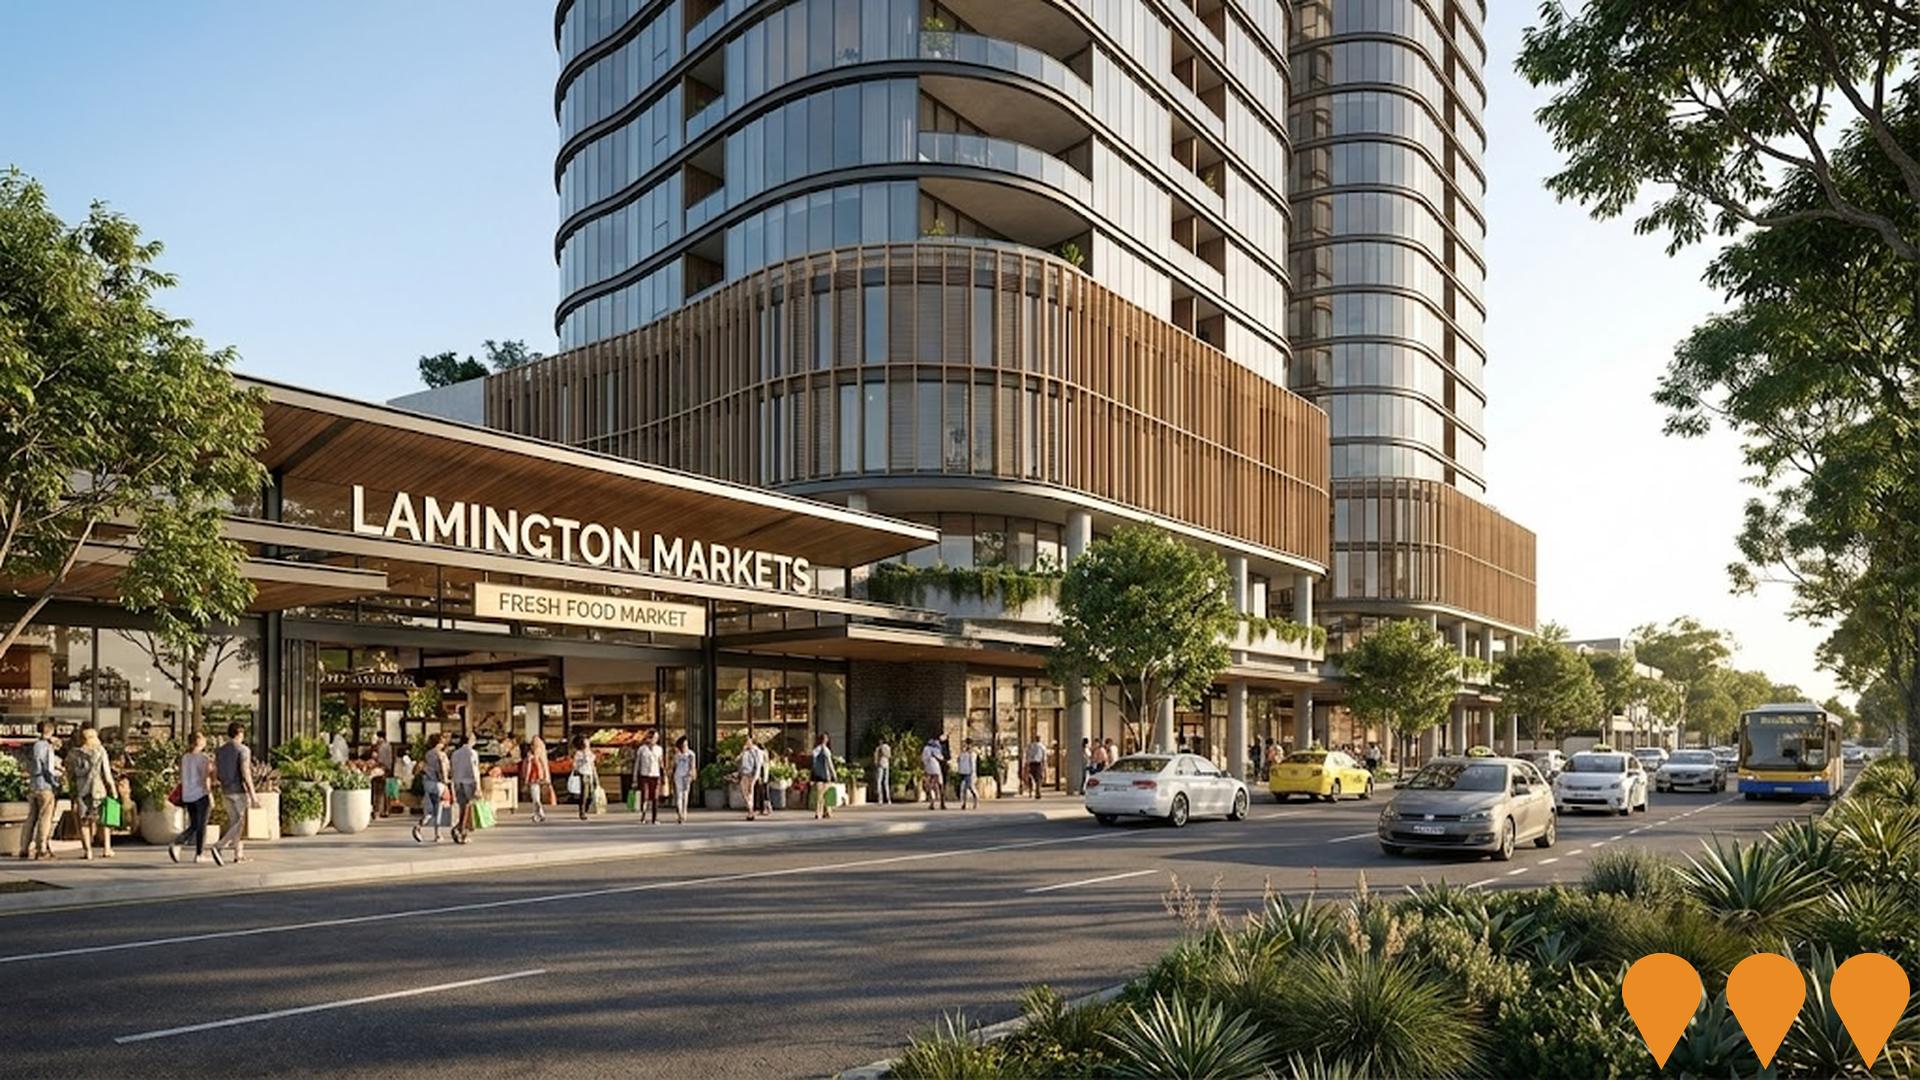
Lamington Markets
Mixed-use transit-oriented development featuring a 4,500sqm indoor market hall with over 100 stallholders, 134 apartments across two towers (12 and 13 storeys), 8-screen underground cinema, craft brewery, rooftop urban farm restaurant, child care/respite centre, retail tenancies and public plaza.
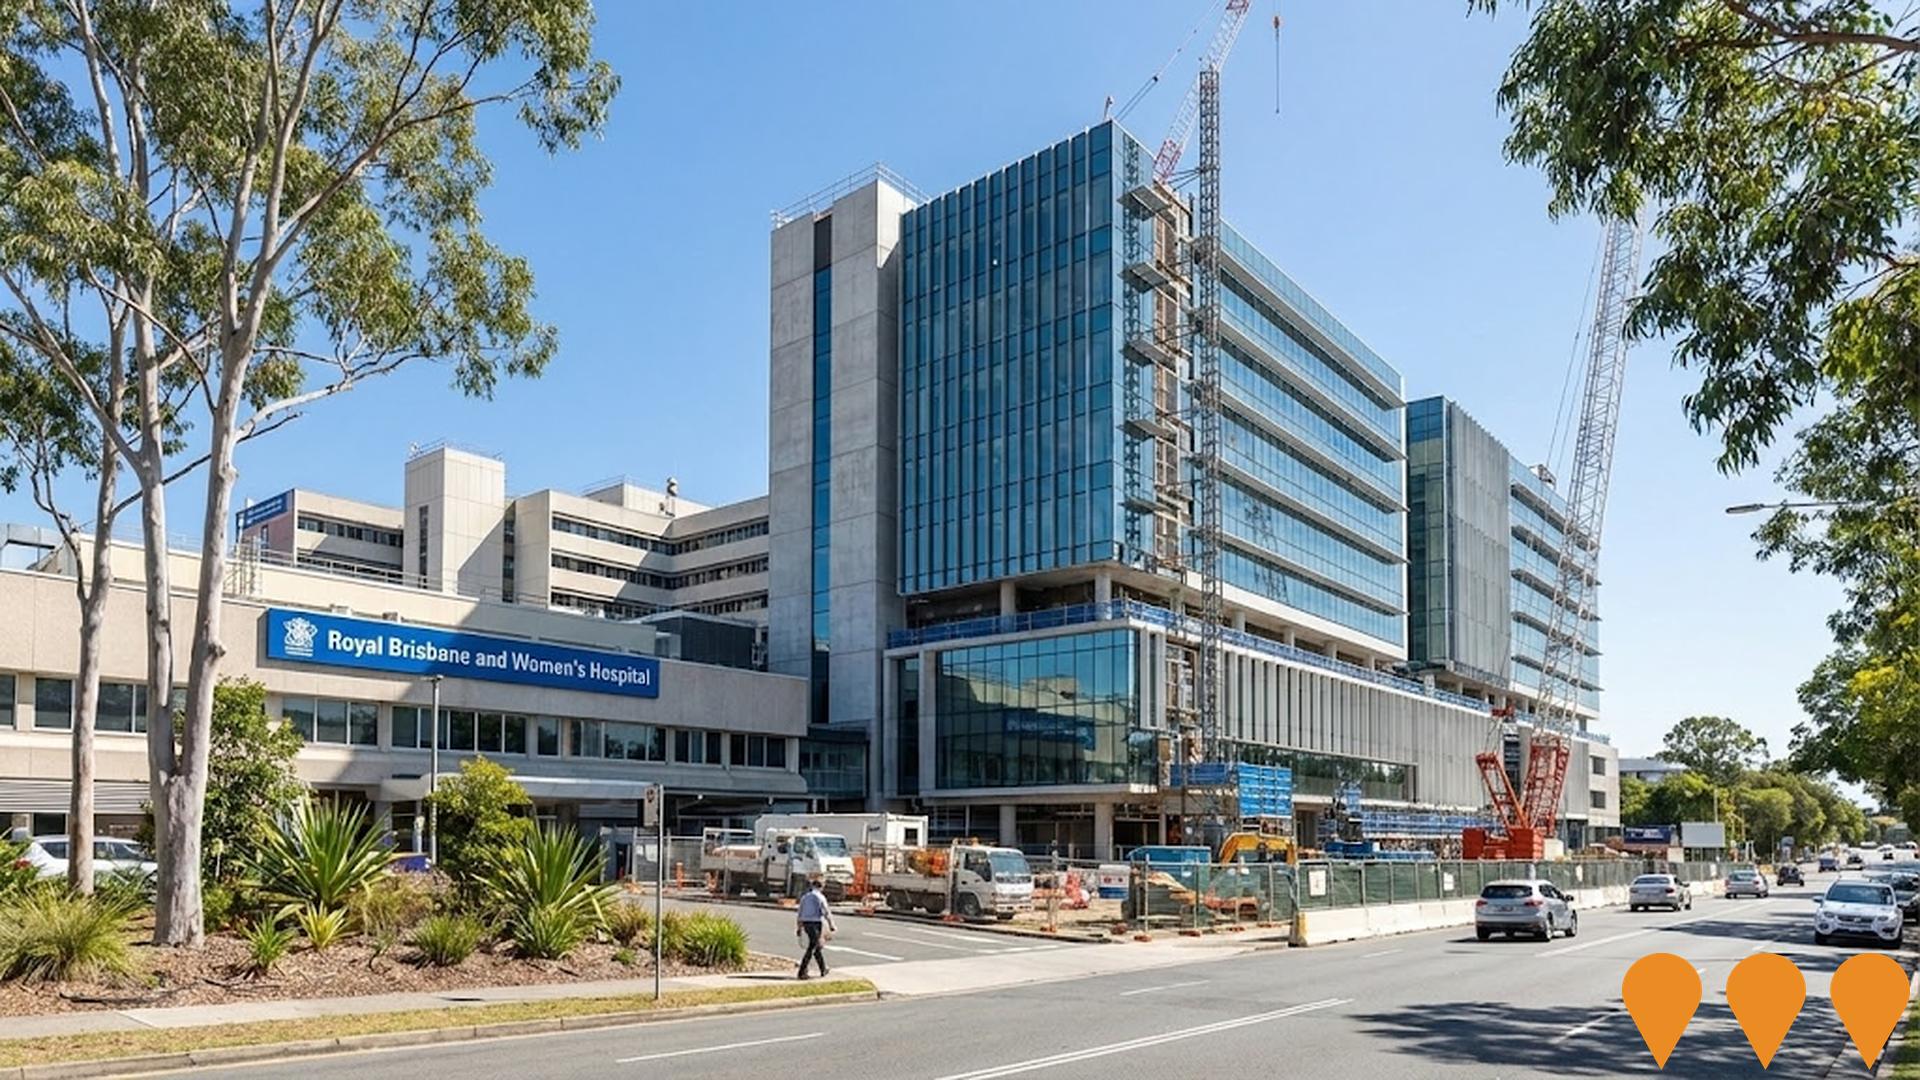
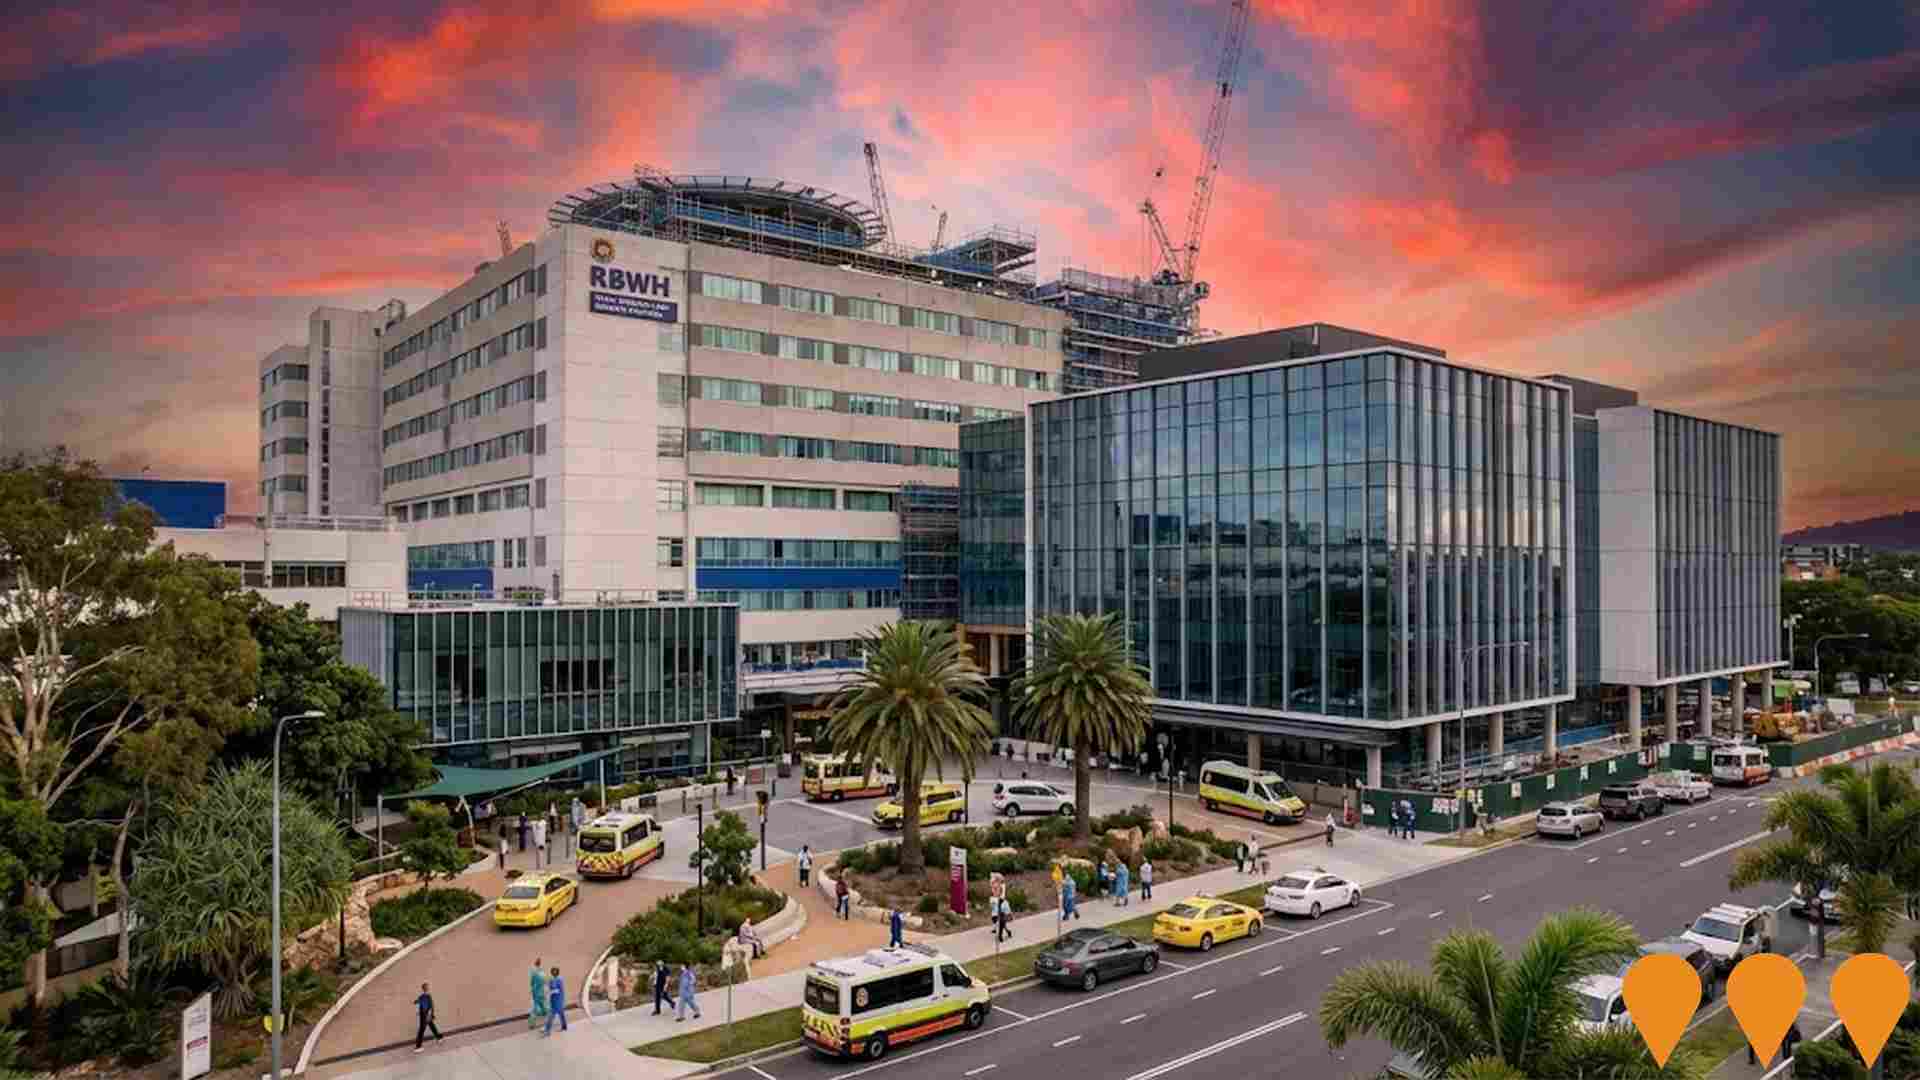
Royal Brisbane and Women's Hospital Precinct
Ongoing expansion and upgrade of the Royal Brisbane and Women's Hospital campus including new facilities, equipment, and infrastructure improvements. Major expansion including new clinical buildings, additional beds, upgraded facilities, and improved patient services to meet growing demand.
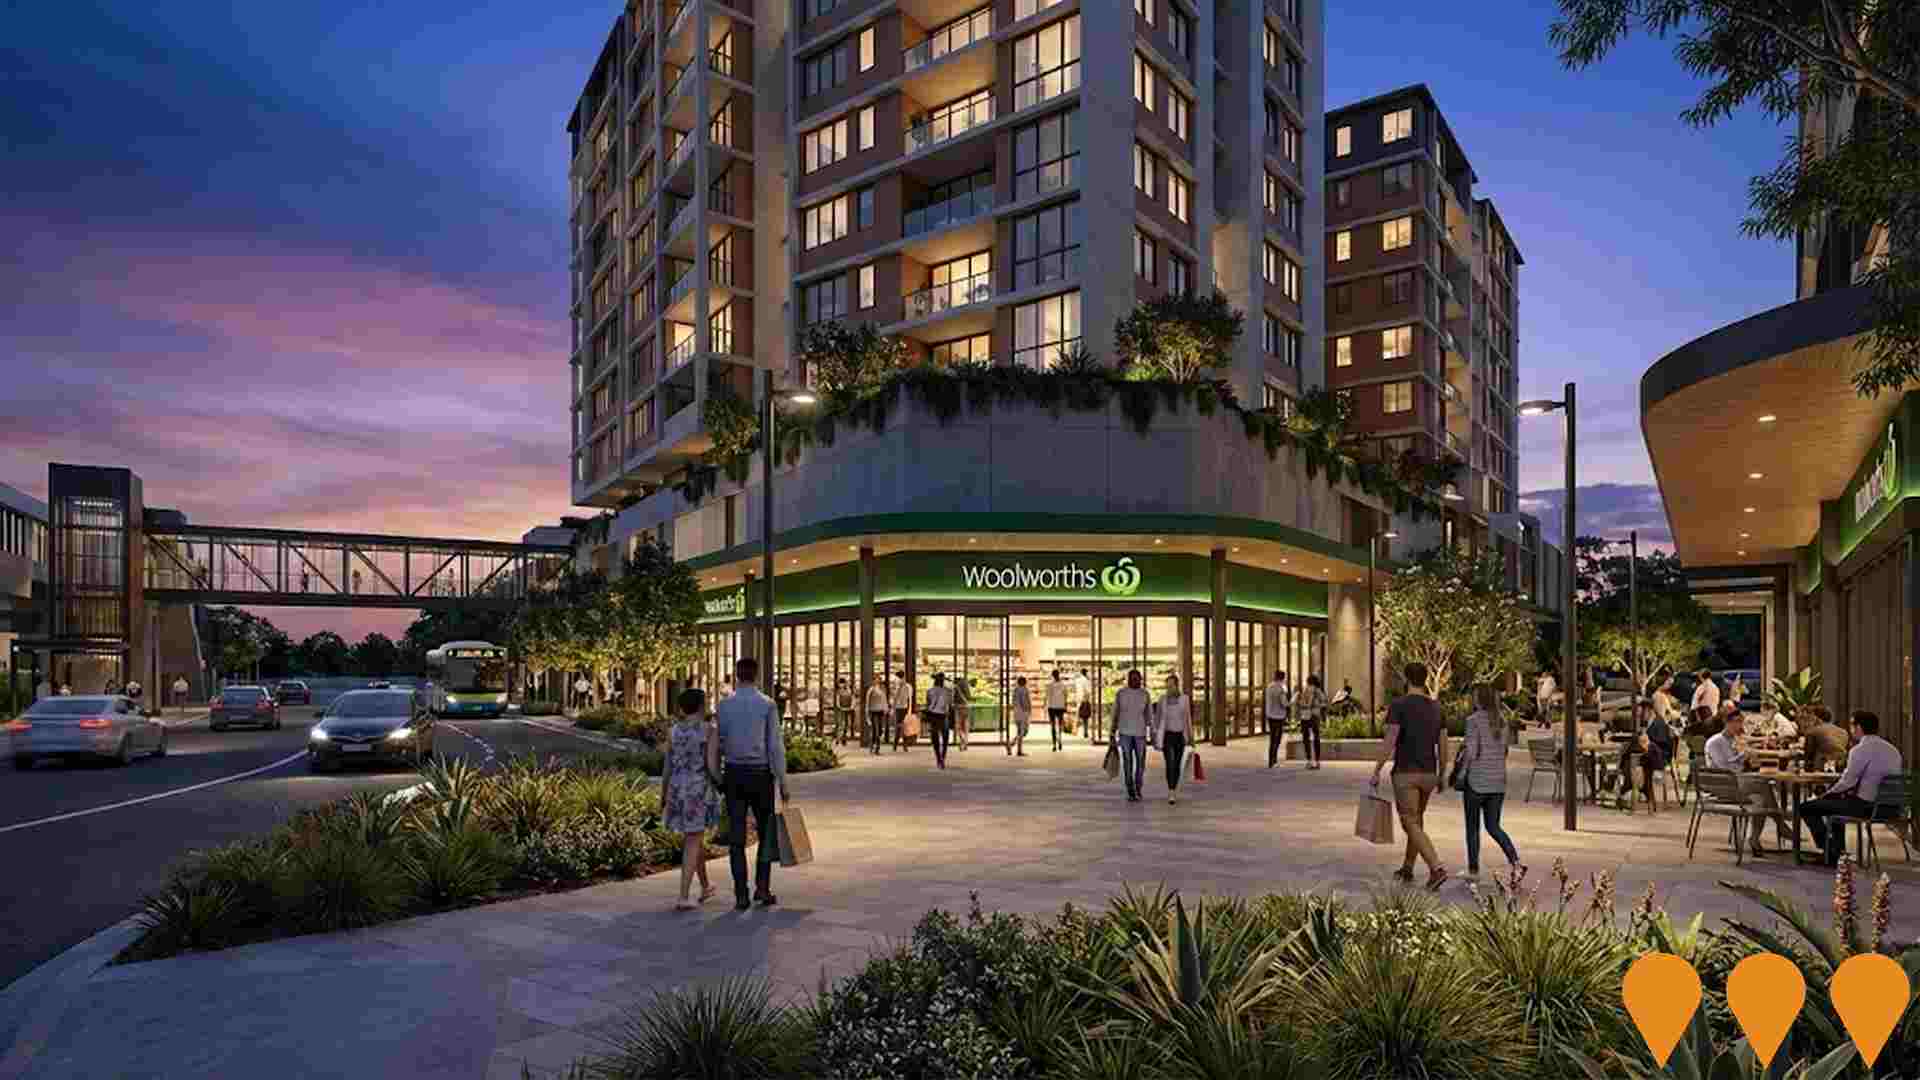
The Albion - Hudson Road Mixed-Use Development
Major mixed-use transit-oriented development on the former Albion Flour Mill site comprising two residential towers with 456 build-to-rent apartments, a full-line Woolworths supermarket, BWS, specialty retail and food & beverage tenancies within a podium, plus an elevated pedestrian link to Albion train station.
Market Central Lutwyche Redevelopment (Lutwyche City Shopping Centre)
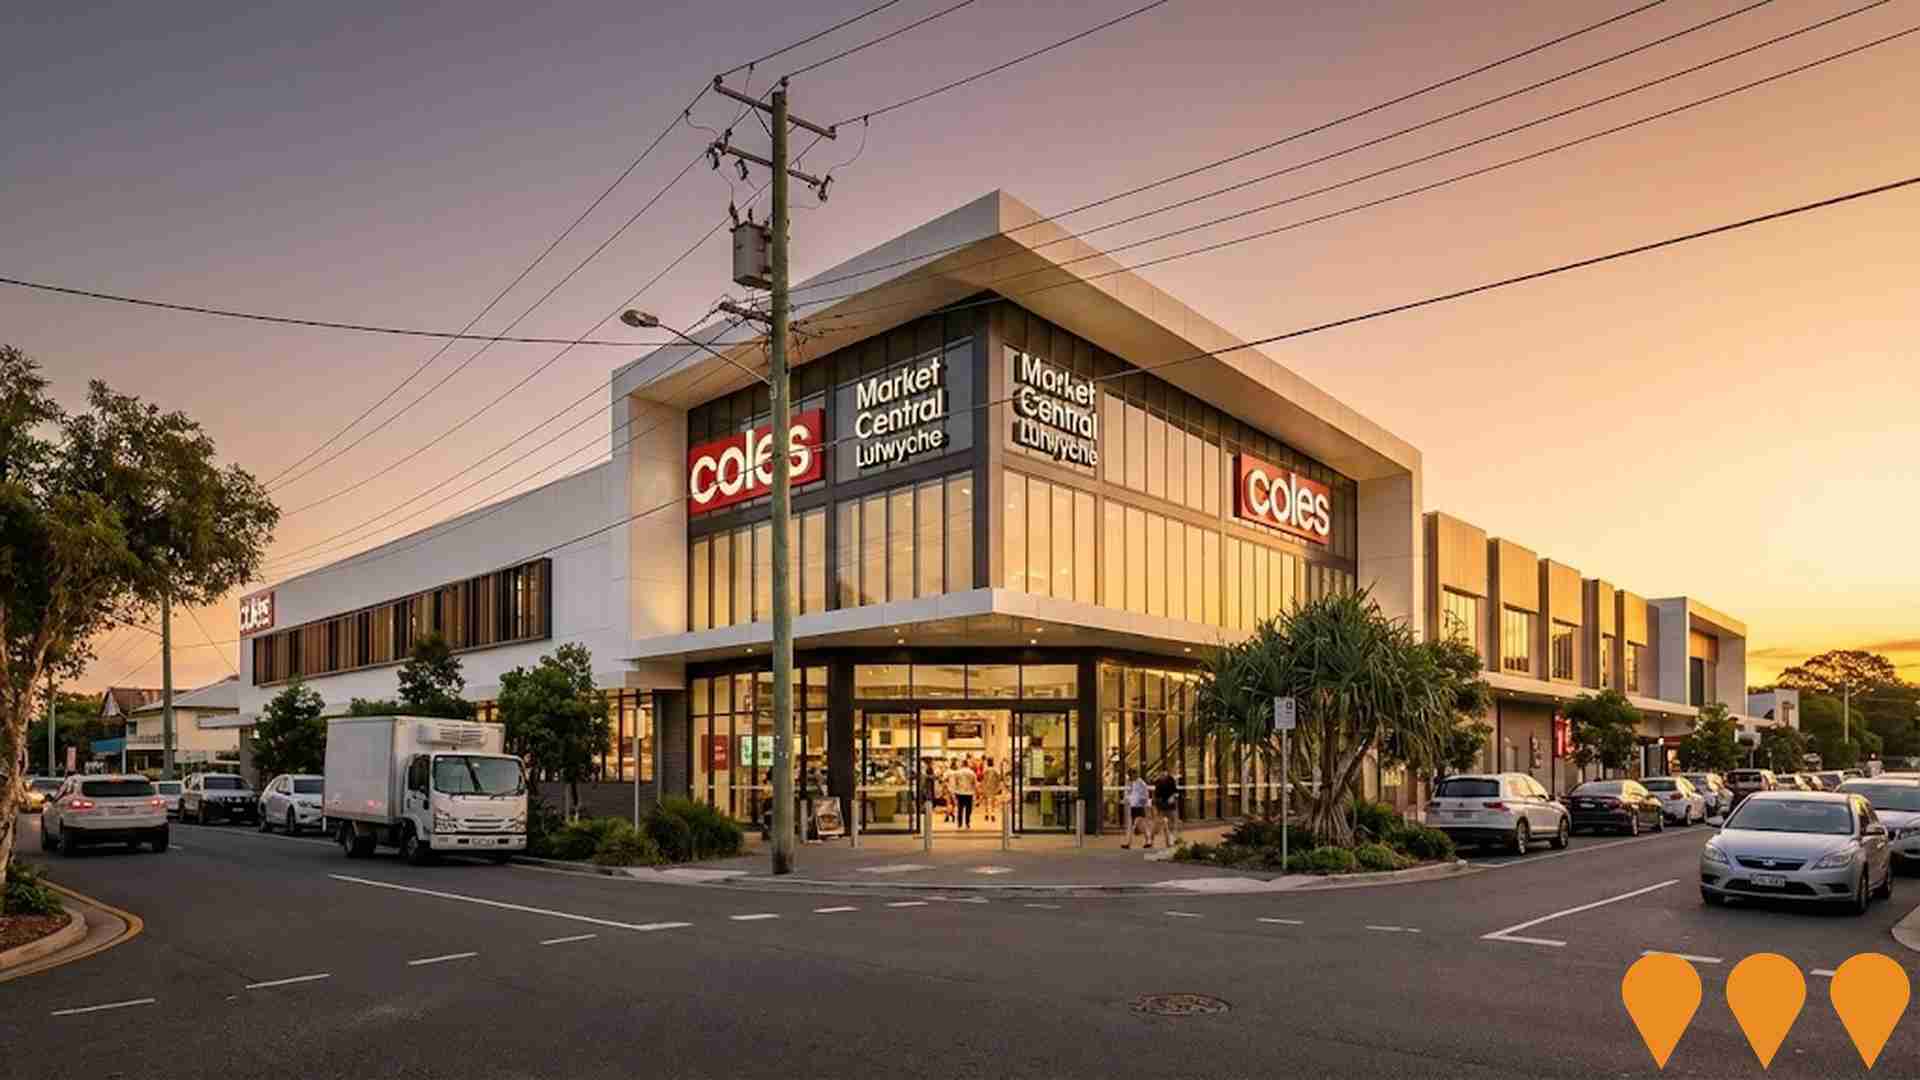
Major redevelopment of the existing Lutwyche City Shopping Centre in Brisbane's inner north, rebranded as Market Central Lutwyche. The roughly 60 to 80 million dollar project delivered a triple supermarket anchored neighbourhood centre with Coles, Woolworths and Aldi, expanded fresh food and dining offers, new medical and childcare precincts, refurbished mall areas and upgraded parking and access. The main works were completed in 2019 under Abacus Group and ISPT, with the centre now continuing to receive smaller internal tenancy reconfigurations and layout improvements via ongoing development applications.
Employment
AreaSearch analysis indicates Windsor maintains employment conditions that align with national benchmarks
Windsor has a highly educated workforce with professional services well represented. The unemployment rate in September 2025 was 4.3%.
Employment stability was maintained over the past year. As of that date, 6,065 residents were employed, with an unemployment rate 0.3% higher than Greater Brisbane's 4.0%. Workforce participation was at 76.4%, exceeding Greater Brisbane's 64.5%. Key employment sectors included health care & social assistance, professional & technical services, and retail trade.
Notably, professional & technical services had employment levels 1.7 times the regional average, while manufacturing had limited presence at 2.7% compared to the regional 6.4%. Many Windsor residents commuted elsewhere for work based on Census data. Over the year to September 2025, employment increased by 0.4%, labour force grew by 0.6%, and unemployment rose by 0.2 percentage points. In contrast, Greater Brisbane saw employment rise by 3.8% and unemployment fall by 0.5%. State-wide in Queensland as of 25-Nov, employment contracted by 0.01%, with an unemployment rate of 4.2%, closely aligned with the national rate of 4.3%. National employment forecasts from May-25 project overall growth of 6.6% over five years and 13.7% over ten years. Applying these projections to Windsor's employment mix suggests local employment should increase by 7.5% over five years and 15.0% over ten years, though these are simple extrapolations for illustrative purposes only.
Frequently Asked Questions - Employment
Income
Income metrics indicate excellent economic conditions, with the area achieving higher performance than 75% of national locations assessed by AreaSearch
AreaSearch's latest postcode level ATO data for financial year 2022 shows Windsor SA2's median income among taxpayers is $63,958, with an average of $89,206. These figures are among the highest in Australia, compared to Greater Brisbane's median of $55,645 and average of $70,520. Based on Wage Price Index growth of 13.99% since financial year 2022, current estimates for Windsor SA2 would be approximately $72,906 (median) and $101,686 (average) as of September 2025. Census data reveals household incomes rank at the 87th percentile nationally in Windsor, family incomes at the 77th percentile, and personal incomes at the 83rd percentile. The earnings profile shows that 33.6% of residents earn between $1,500 - 2,999 per week (3,019 people), reflecting patterns seen in the surrounding region where 33.3% occupy this range. Windsor SA2 demonstrates considerable affluence with 33.1% earning over $3,000 per week, supporting premium retail and service offerings. High housing costs consume 16.7% of income, though strong earnings still place disposable income at the 76th percentile nationally. The area's SEIFA income ranking places it in the 8th decile.
Frequently Asked Questions - Income
Housing
Windsor features a more urban dwelling mix with significant apartment living, with a higher proportion of rental properties than the broader region
Windsor's dwelling structure, as per the latest Census, consisted of 49.0% houses and 51.0% other dwellings such as semi-detached homes, apartments, and 'other' dwellings. In comparison, Brisbane metro had 36.5% houses and 63.6% other dwellings. Home ownership in Windsor was at 16.8%, with the remaining dwellings either mortgaged (27.2%) or rented (56.0%). The median monthly mortgage repayment in Windsor was $2,278, higher than Brisbane metro's average of $2,167. The median weekly rent figure in Windsor was recorded at $400, compared to Brisbane metro's $410. Nationally, Windsor's mortgage repayments were significantly higher than the Australian average of $1,863, while rents exceeded the national figure of $375.
Frequently Asked Questions - Housing
Household Composition
Windsor features high concentrations of group households and lone person households, with a higher-than-average median household size
Family households account for 57.6% of all households, including 22.1% couples with children, 26.5% couples without children, and 6.8% single parent families. Non-family households comprise the remaining 42.4%, with lone person households at 30.1% and group households comprising 12.1%. The median household size is 2.3 people, larger than the Greater Brisbane average of 2.2.
Frequently Asked Questions - Households
Local Schools & Education
Educational achievement in Windsor places it within the top 10% nationally, reflecting strong academic performance and high qualification levels across the community
Windsor's residents aged 15 and above have a higher educational attainment than broader benchmarks. As of the latest data, 50.1% hold university qualifications compared to 25.7% in Queensland (QLD) and 30.4% nationally. This is attributed to a strong presence of bachelor degrees holders at 33.6%, followed by postgraduate qualifications (11.5%) and graduate diplomas (5.0%). Vocational credentials are also prominent, with 25.4% of residents holding such qualifications – advanced diplomas account for 10.3% and certificates for 15.1%.
Educational participation is notably high in Windsor, with 31.4% currently enrolled in formal education, including 11.9% in tertiary education, 7.0% in primary education, and 5.9% pursuing secondary education.
Frequently Asked Questions - Education
Schools Detail
Nearby Services & Amenities
Transport
Transport servicing is high compared to other areas nationally based on assessment of service frequency, route connectivity and accessibility
The analysis of public transportation in Windsor shows that there are currently 37 active transport stops operating within the city. These stops offer a mix of train and bus services. The city is served by 31 individual routes, which collectively facilitate 4,627 weekly passenger trips.
The accessibility of these transport services is rated as excellent, with residents typically located just 163 meters from their nearest transport stop. On average, there are 661 trips per day across all routes, equating to approximately 125 weekly trips per individual stop.
Frequently Asked Questions - Transport
Transport Stops Detail
Health
Windsor's residents are extremely healthy with both young and old age cohorts seeing low prevalence of common health conditions
Analysis of health metrics indicates strong performance across Windsor. Both young and old age cohorts exhibit low prevalence of common health conditions. The rate of private health cover stands at approximately 64% of the total population (5,751 people), compared to 71.3% in Greater Brisbane and a national average of 55.3%.
Mental health issues and asthma are the most prevalent medical conditions, affecting 11.5% and 7.7% of residents respectively. A total of 72.4% of residents report being completely clear of medical ailments, compared to 73.7% in Greater Brisbane. Windsor has 8.3% of its population aged 65 and over (749 people), lower than the 12.2% in Greater Brisbane. Health outcomes among seniors are above average, generally aligning with the overall health profile of the population.
Frequently Asked Questions - Health
Cultural Diversity
The level of cultural diversity witnessed in Windsor was found to be slightly above average when compared nationally for a number of language and cultural background related metrics
Windsor, surveyed in 2016, had above-average cultural diversity with 24.6% of its population born overseas and 15.2% speaking a language other than English at home. Christianity was the predominant religion, comprising 42.1%. Hinduism showed overrepresentation at 2.6%, compared to Greater Brisbane's 2.7%.
Top ancestry groups were English (25.9%), Australian (22.7%), and Irish (10.5%). Welsh (0.8% vs regional 0.7%), New Zealand (1.0% vs 0.8%), and Scottish (9.0% vs 8.7%) were notably overrepresented.
Frequently Asked Questions - Diversity
Age
Windsor hosts a very young demographic, ranking in the bottom 10% of areas nationwide
Windsor's median age is 32 years, which is lower than the Greater Brisbane average of 36 and significantly below the Australian median of 38. Compared to Greater Brisbane, Windsor has a higher percentage of residents aged 25-34 (27.4%) but fewer residents aged 5-14 (8.7%). This concentration of 25-34 year-olds is notably higher than the national average of 14.5%. Between 2021 and present, the percentage of Windsor's population aged 25-34 has increased from 25.7% to 27.4%, while the percentage of those aged 45-54 has decreased from 12.7% to 11.9%. By 2041, demographic projections indicate significant changes in Windsor's age profile. The 55-64 age cohort is expected to grow by 378 people (53%), increasing from 714 to 1,093. Meanwhile, the 0-4 age cohort is projected to grow modestly by 9% (37 people).

