Chart Color Schemes
This analysis uses ABS Statistical Areas Level 2 (SA2) boundaries, which can materially differ from Suburbs and Localities (SAL) even when sharing similar names.
SA2 boundaries are defined by the Australian Bureau of Statistics and are designed to represent communities for statistical reporting (e.g., census and ERP).
Suburbs and Localities (SAL) represent commonly-used suburb/locality names (postal-style areas) and may use different geographic boundaries. For comprehensive analysis, consider reviewing both boundary types if available.
est. as @ -- *
ABS ERP | -- people | --
2021 Census | -- people
Sales Activity
Curious about local property values? Filter the chart to assess the volume and appreciation (including resales) trends and regional comparisons, or scroll to the map below view this information at an individual property level.
Find a Recent Sale
Sales Detail
Population
Sandgate - Shorncliffe is positioned among the lower quartile of areas assessed nationally for population growth based on AreaSearch's assessment of recent, and medium term trends
Sandgate-Shorncliffe's population is 6,967 as of November 2025, reflecting a 141-person increase since the 2021 Census. This increase represents a 2.1% rise from the previous figure of 6,826 people. The change is inferred from ABS estimated resident population figures: 6,965 in June 2024 and an additional 14 validated new addresses since the Census date. This results in a density ratio of 1,601 persons per square kilometer, higher than national averages assessed by AreaSearch. Overseas migration contributed approximately 59.2% of overall population gains during recent periods.
AreaSearch uses ABS/Geoscience Australia projections for each SA2 area released in 2024 with a base year of 2022. For areas not covered and years post-2032, Queensland State Government's SA2 area projections from 2023 based on 2021 data are adopted. Note that these state projections lack age category splits; thus, AreaSearch applies proportional growth weightings in line with ABS Greater Capital Region projections released in 2023 using 2022 data for each age cohort. Future demographic trends anticipate lower quartile growth of national areas. The area is expected to grow by 52 persons to 2041 based on the latest annual ERP population numbers, reflecting a total gain of 0.7% over 17 years.
Frequently Asked Questions - Population
Development
The level of residential development activity in Sandgate - Shorncliffe is very low in comparison to the average area assessed nationally by AreaSearch
Sandgate-Shorncliffe has seen approximately 11 new homes approved annually over the past five financial years. Between FY21 and FY25, 57 homes were approved, with an additional 2 approved so far in FY26. The population has been declining recently, suggesting that new supply is meeting demand, providing good choices for buyers.
The average construction cost value of new properties is $502,000, indicating a focus on the premium market and high-end developments. This financial year, $3.0 million in commercial approvals have been registered, reflecting the area's residential character. Compared to Greater Brisbane, Sandgate-Shorncliffe has about half the rate of new dwelling approvals per person. Nationally, it ranks around the 22nd percentile of areas assessed for buyer choice, suggesting relatively constrained options and interest in existing dwellings.
This lower activity may reflect market maturity and potential development constraints. Recent building activity consists solely of detached dwellings, maintaining the area's traditional suburban character with a focus on family homes appealing to those seeking space. Interestingly, developers are constructing more traditional houses than the current mix suggests (75.0% at Census), indicating continued strong demand for family homes despite density pressures. The location has approximately 695 people per dwelling approval, demonstrating an established market. Population forecasts indicate Sandgate-Shorncliffe will gain 50 residents by 2041, based on the latest AreaSearch quarterly estimate. Given current development patterns, new housing supply should readily meet demand, offering good conditions for buyers and potentially facilitating population growth beyond current projections.
Frequently Asked Questions - Development
Infrastructure
Sandgate - Shorncliffe has very high levels of nearby infrastructure activity, ranking in the top 20% nationally
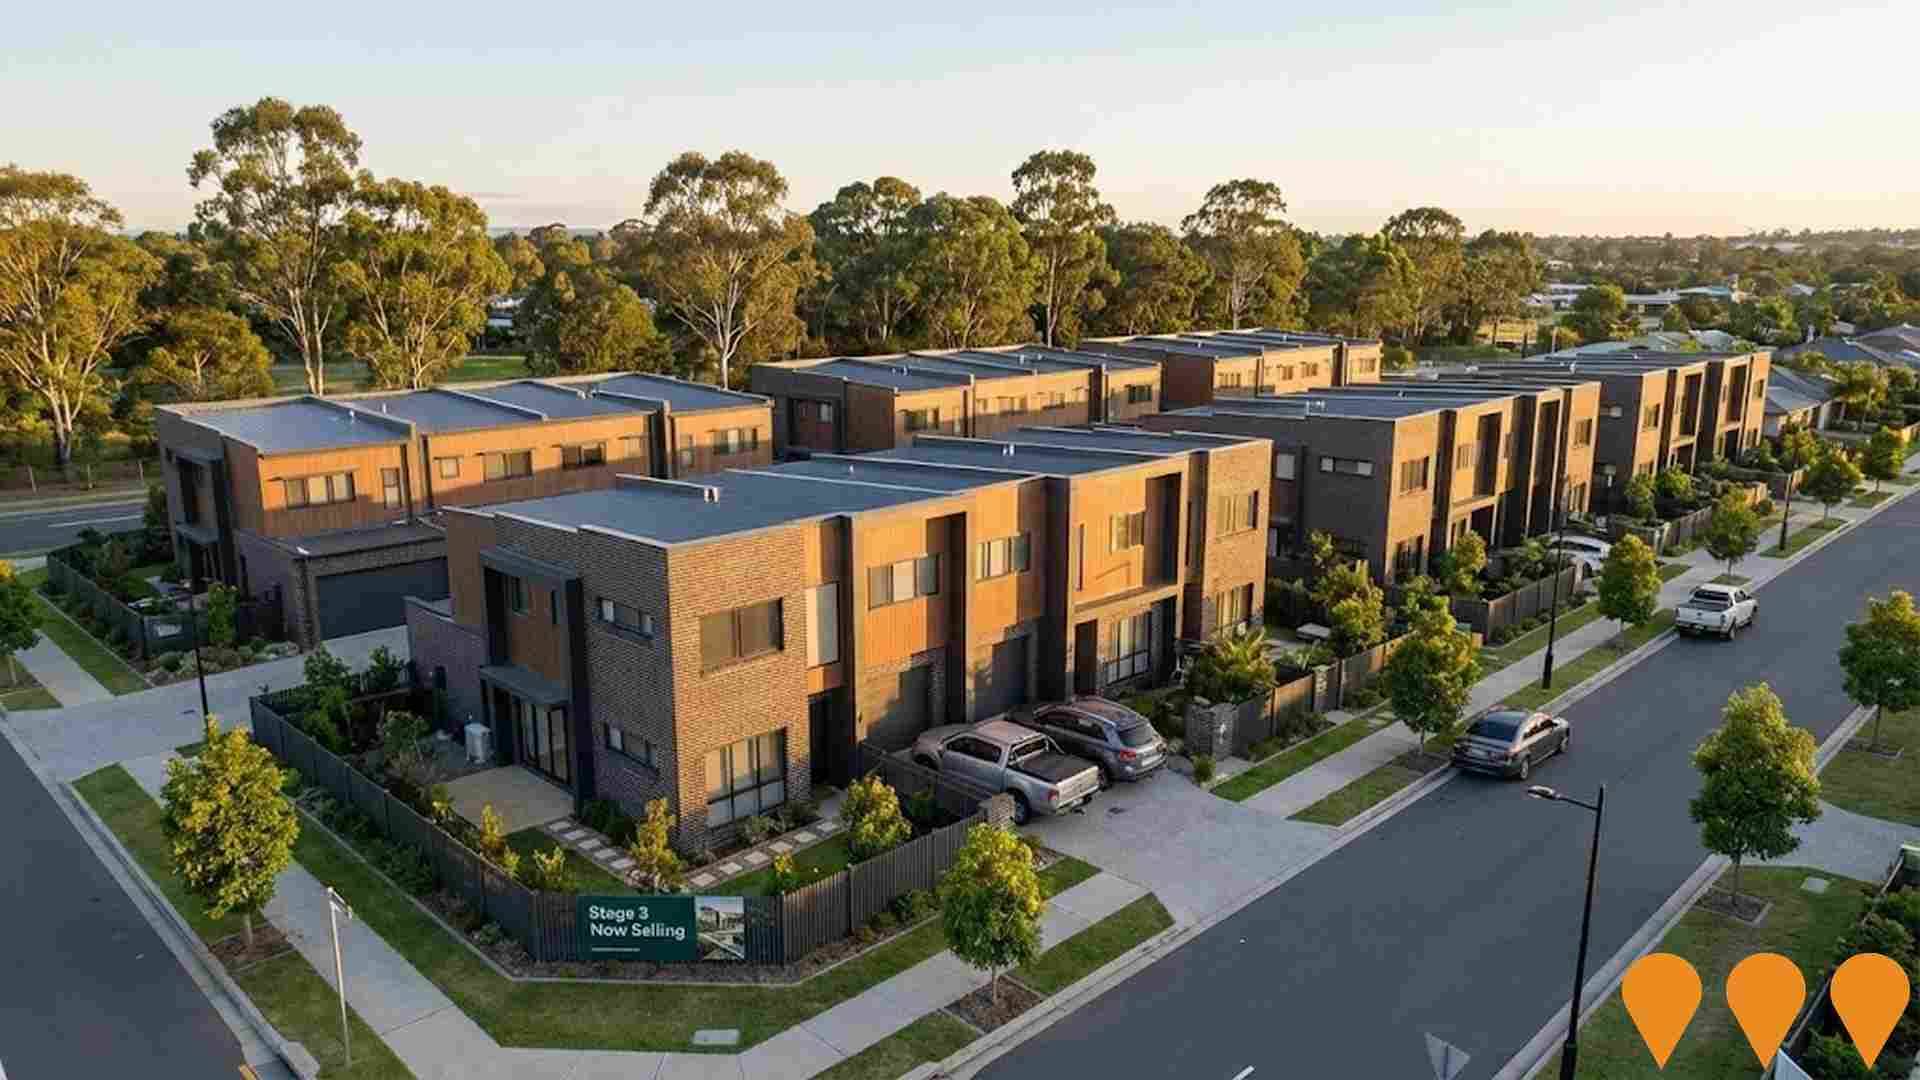
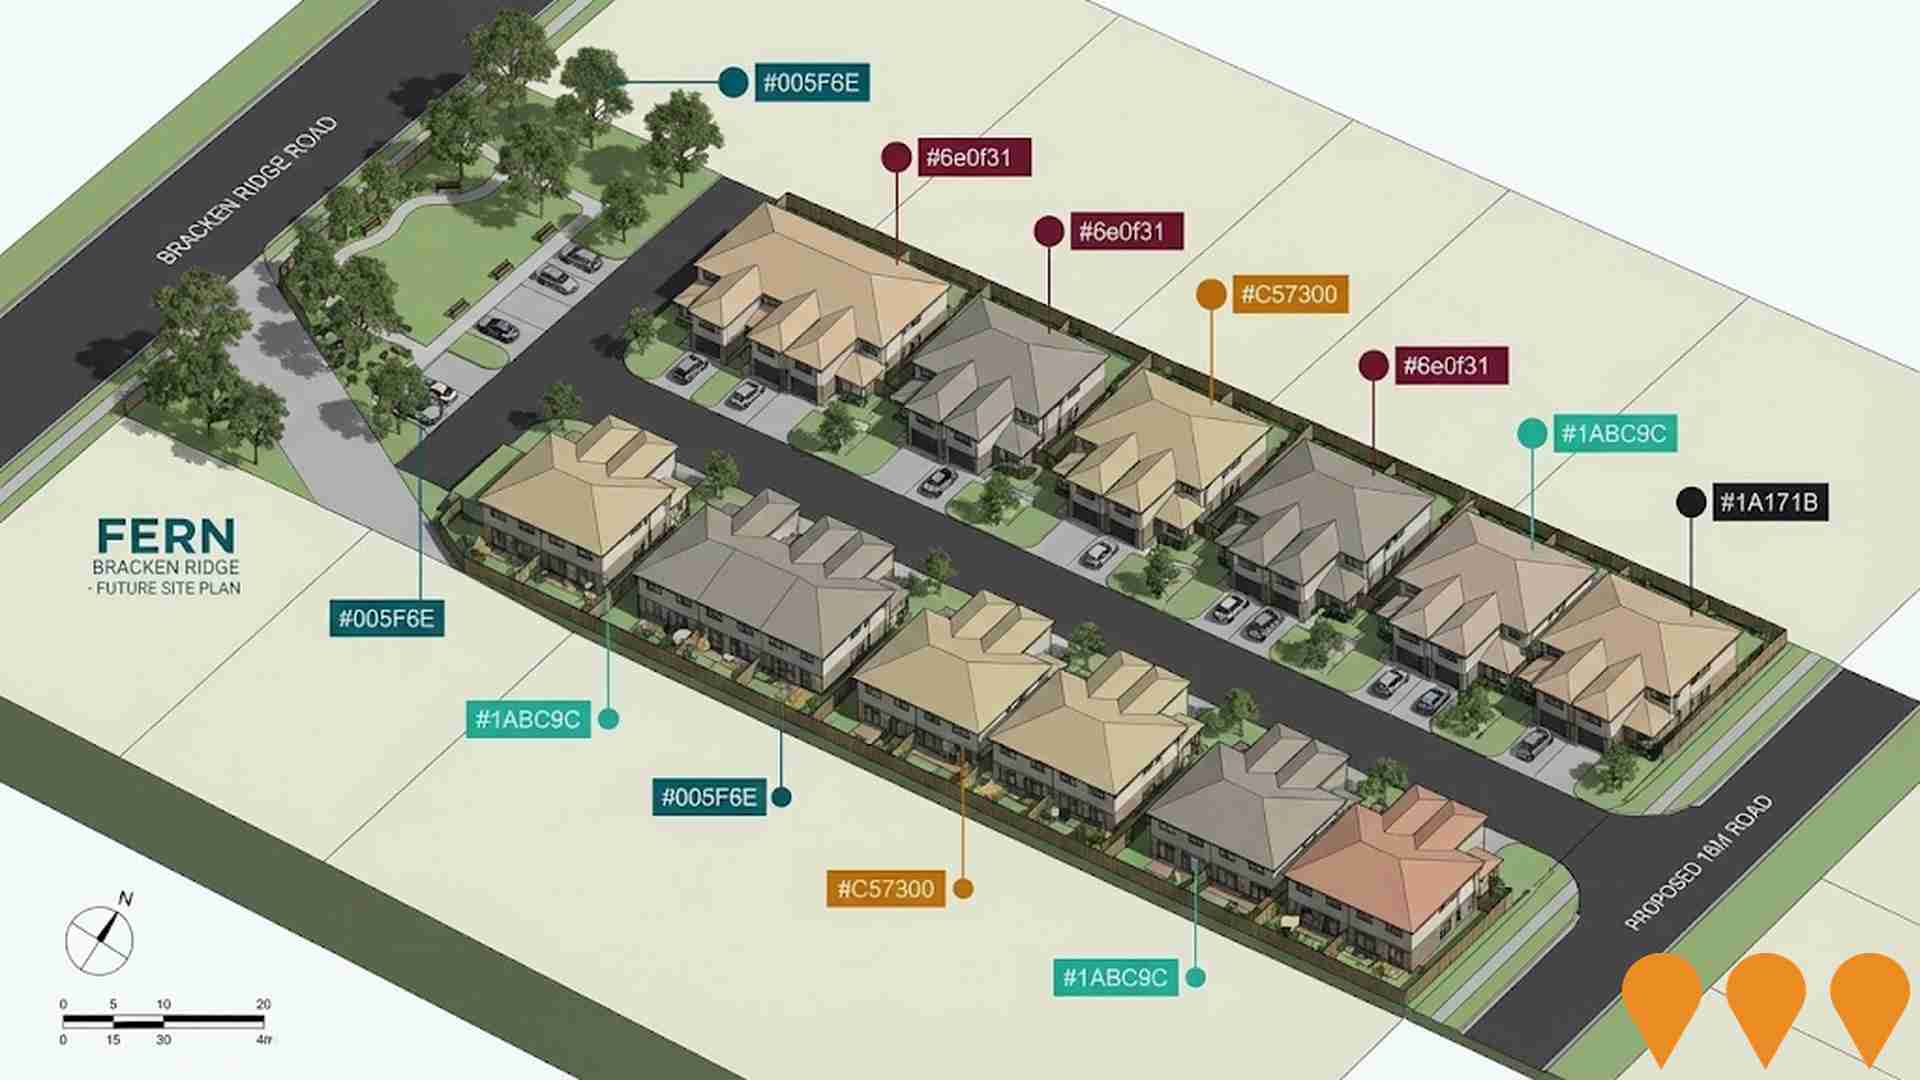
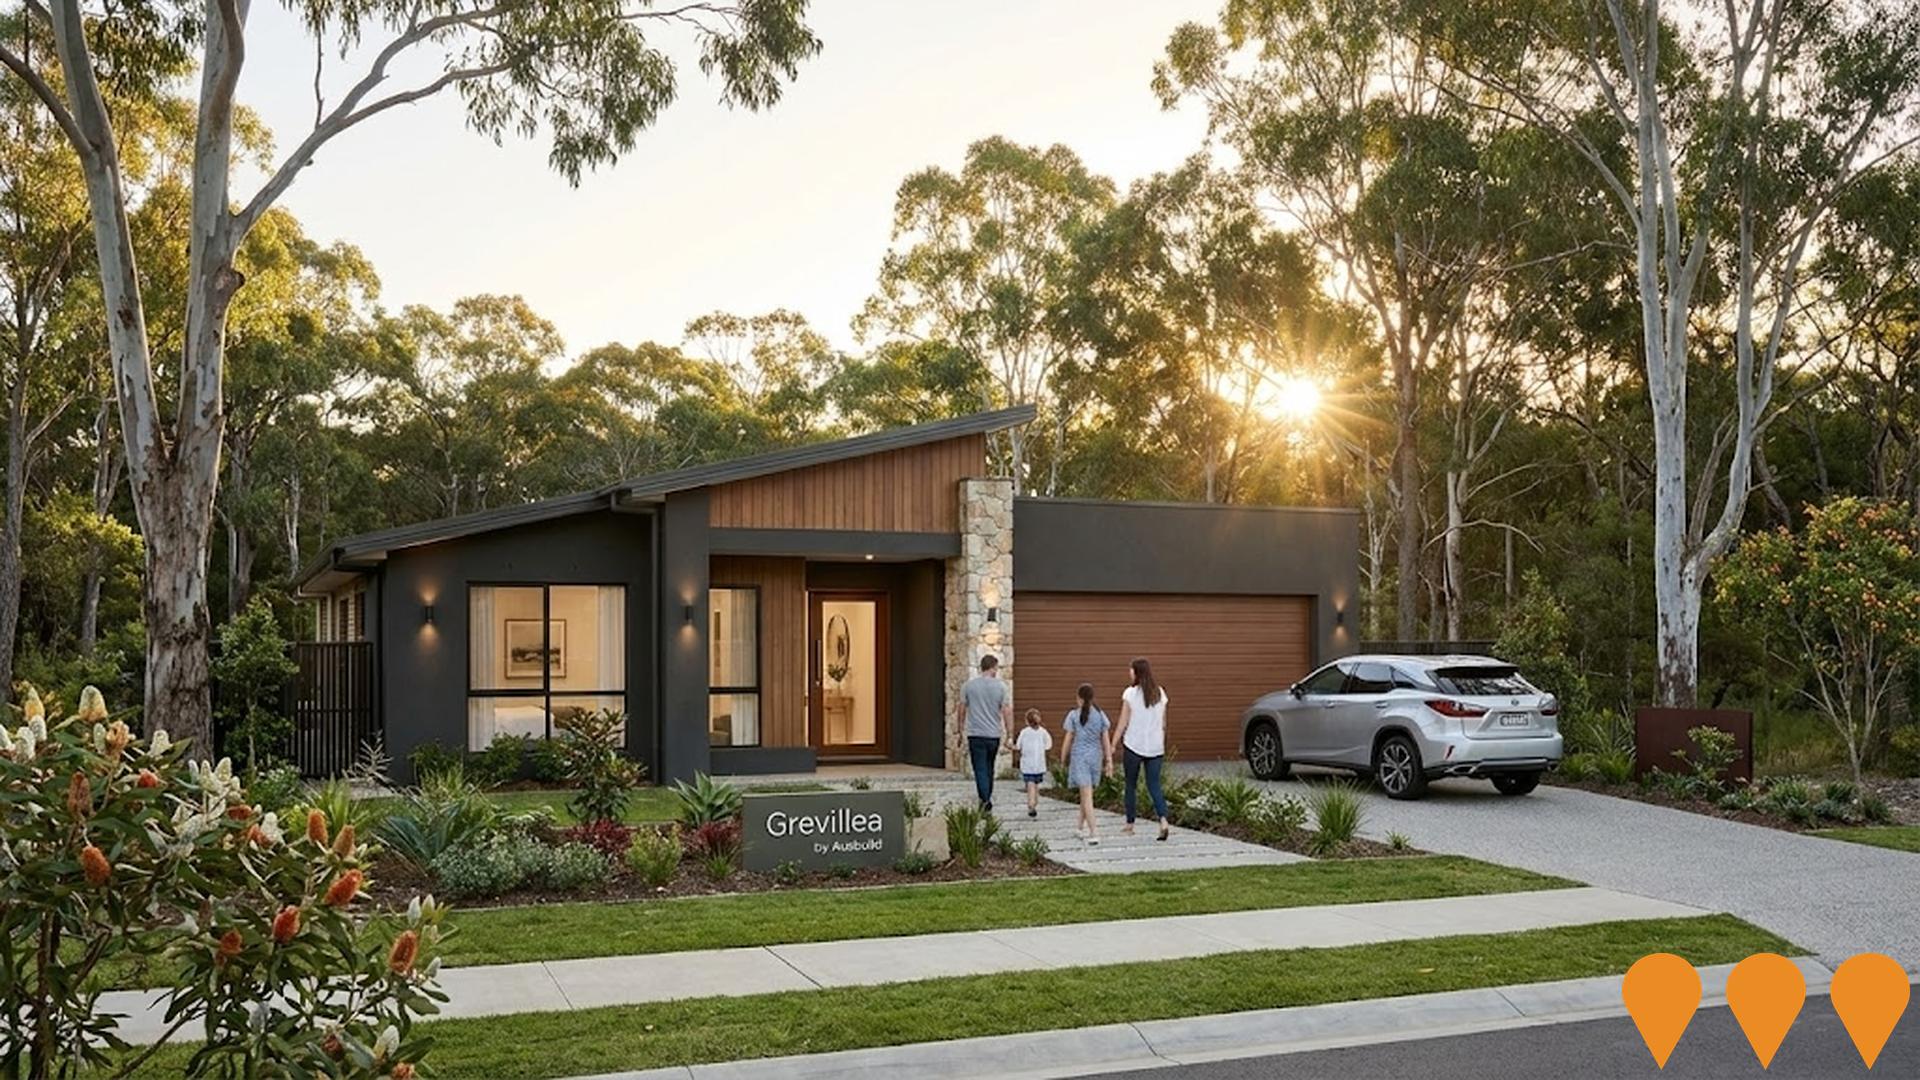
Changes to local infrastructure significantly impact an area's performance. AreaSearch identified ten projects likely affecting the area. Notable ones are Bridgeman Downs Neighbourhood Plan, Motif Bridgeman Downs, Lomandra Park Estate, and Grevillea by Ausbuild. The following list details those most relevant.
Professional plan users can use the search below to filter and access additional projects.
INFRASTRUCTURE SEARCH
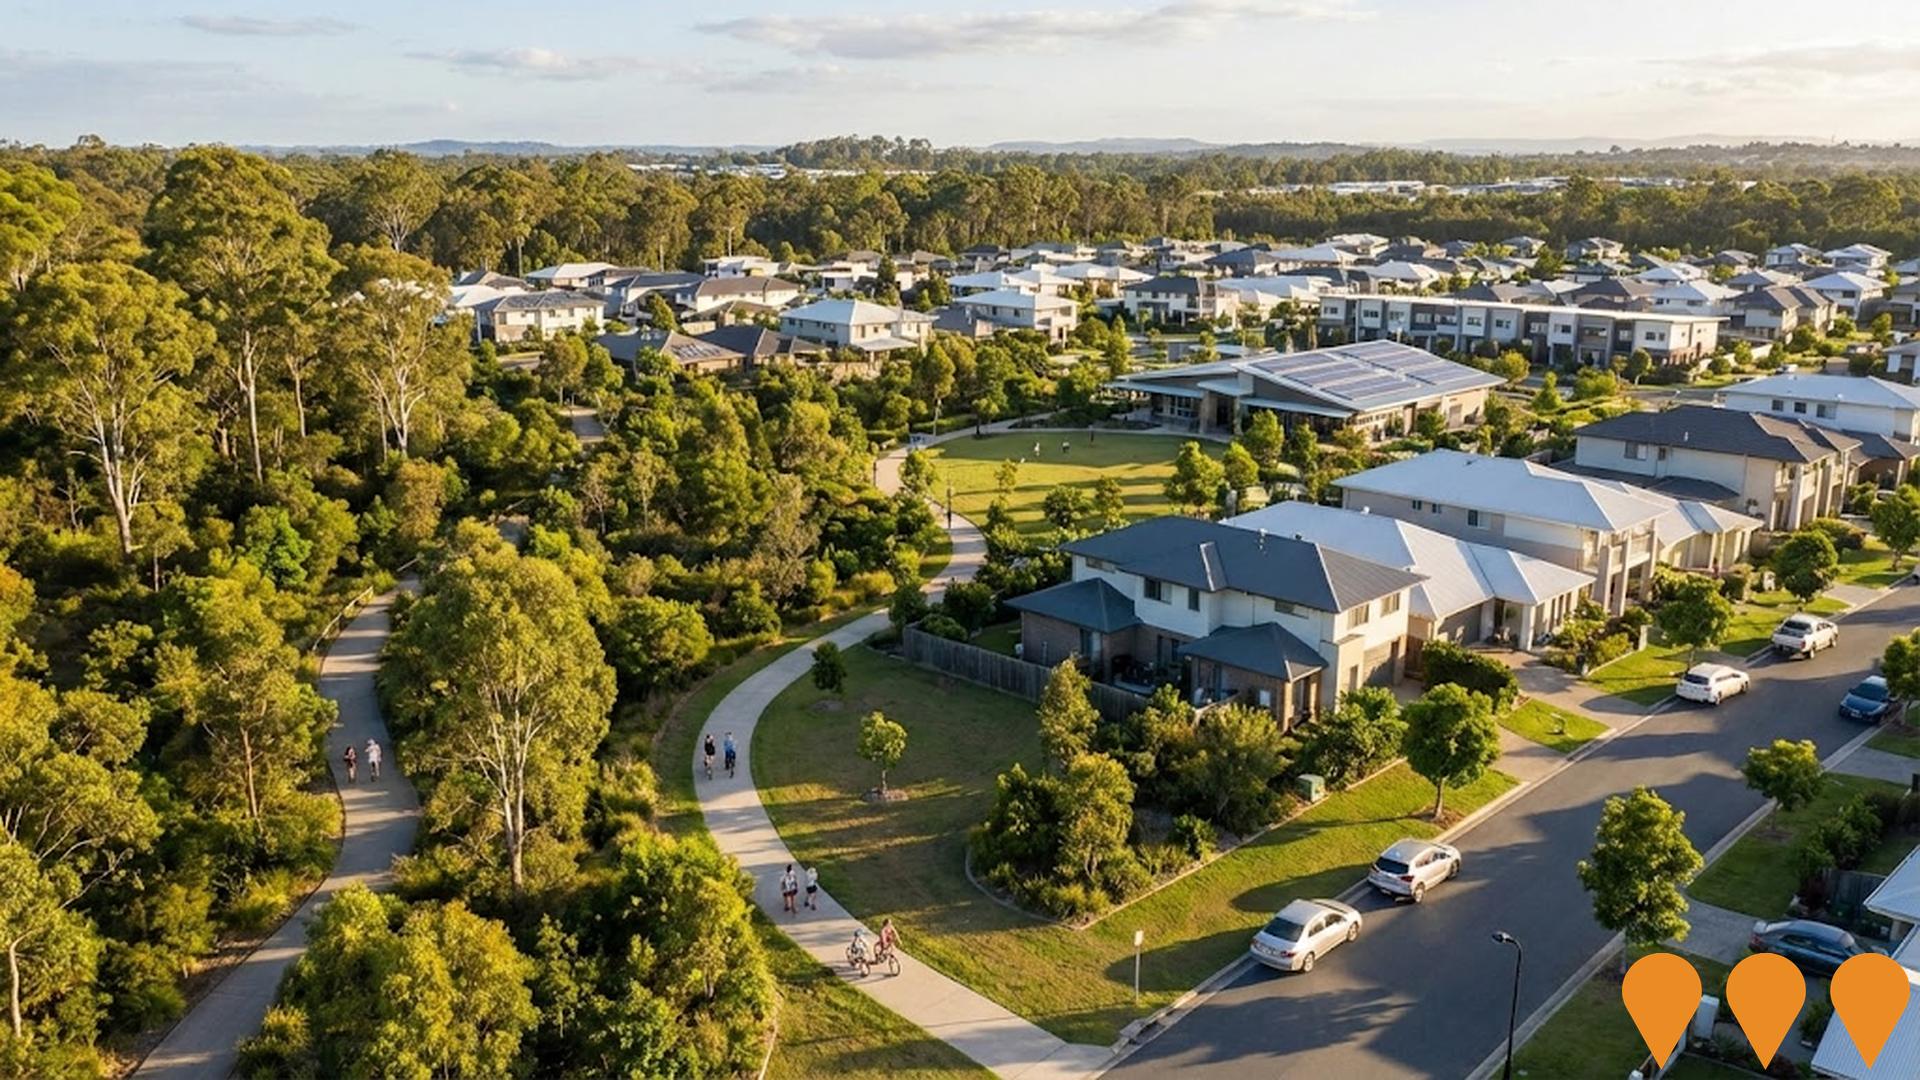
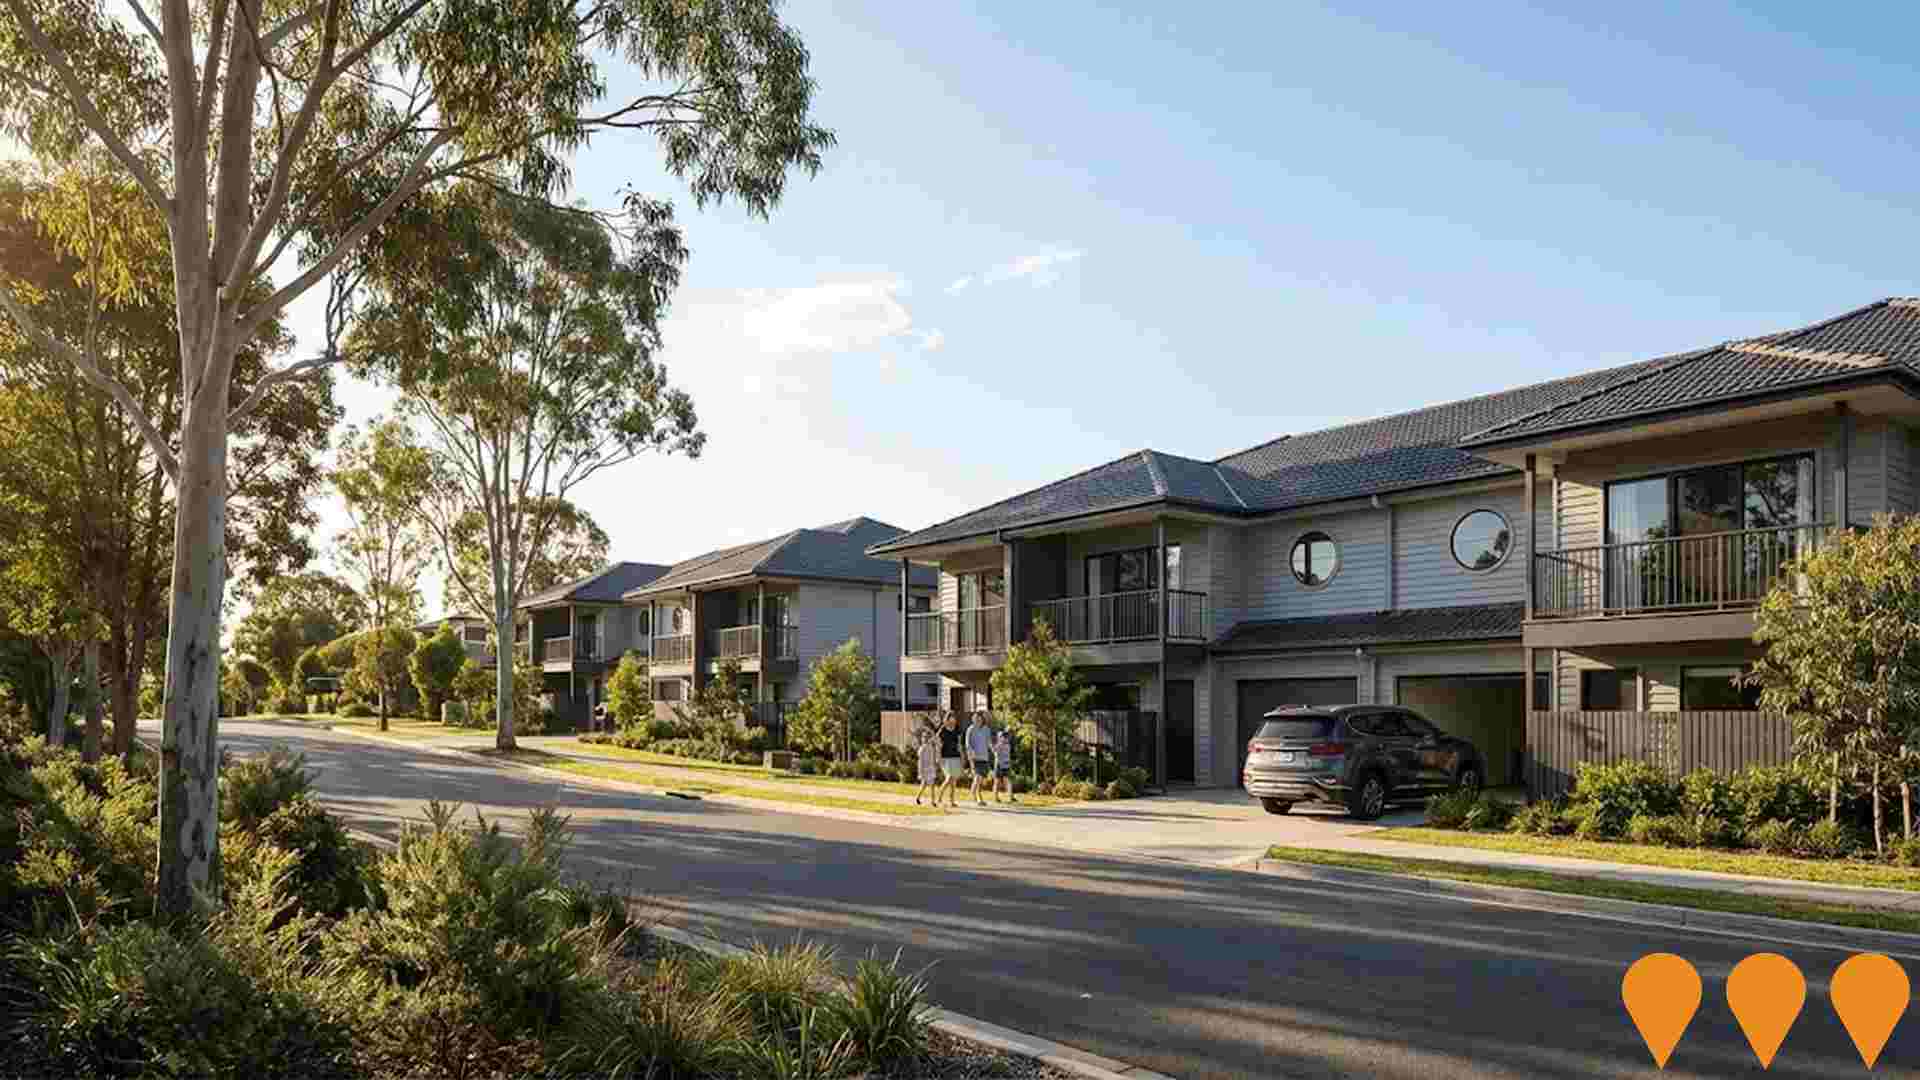
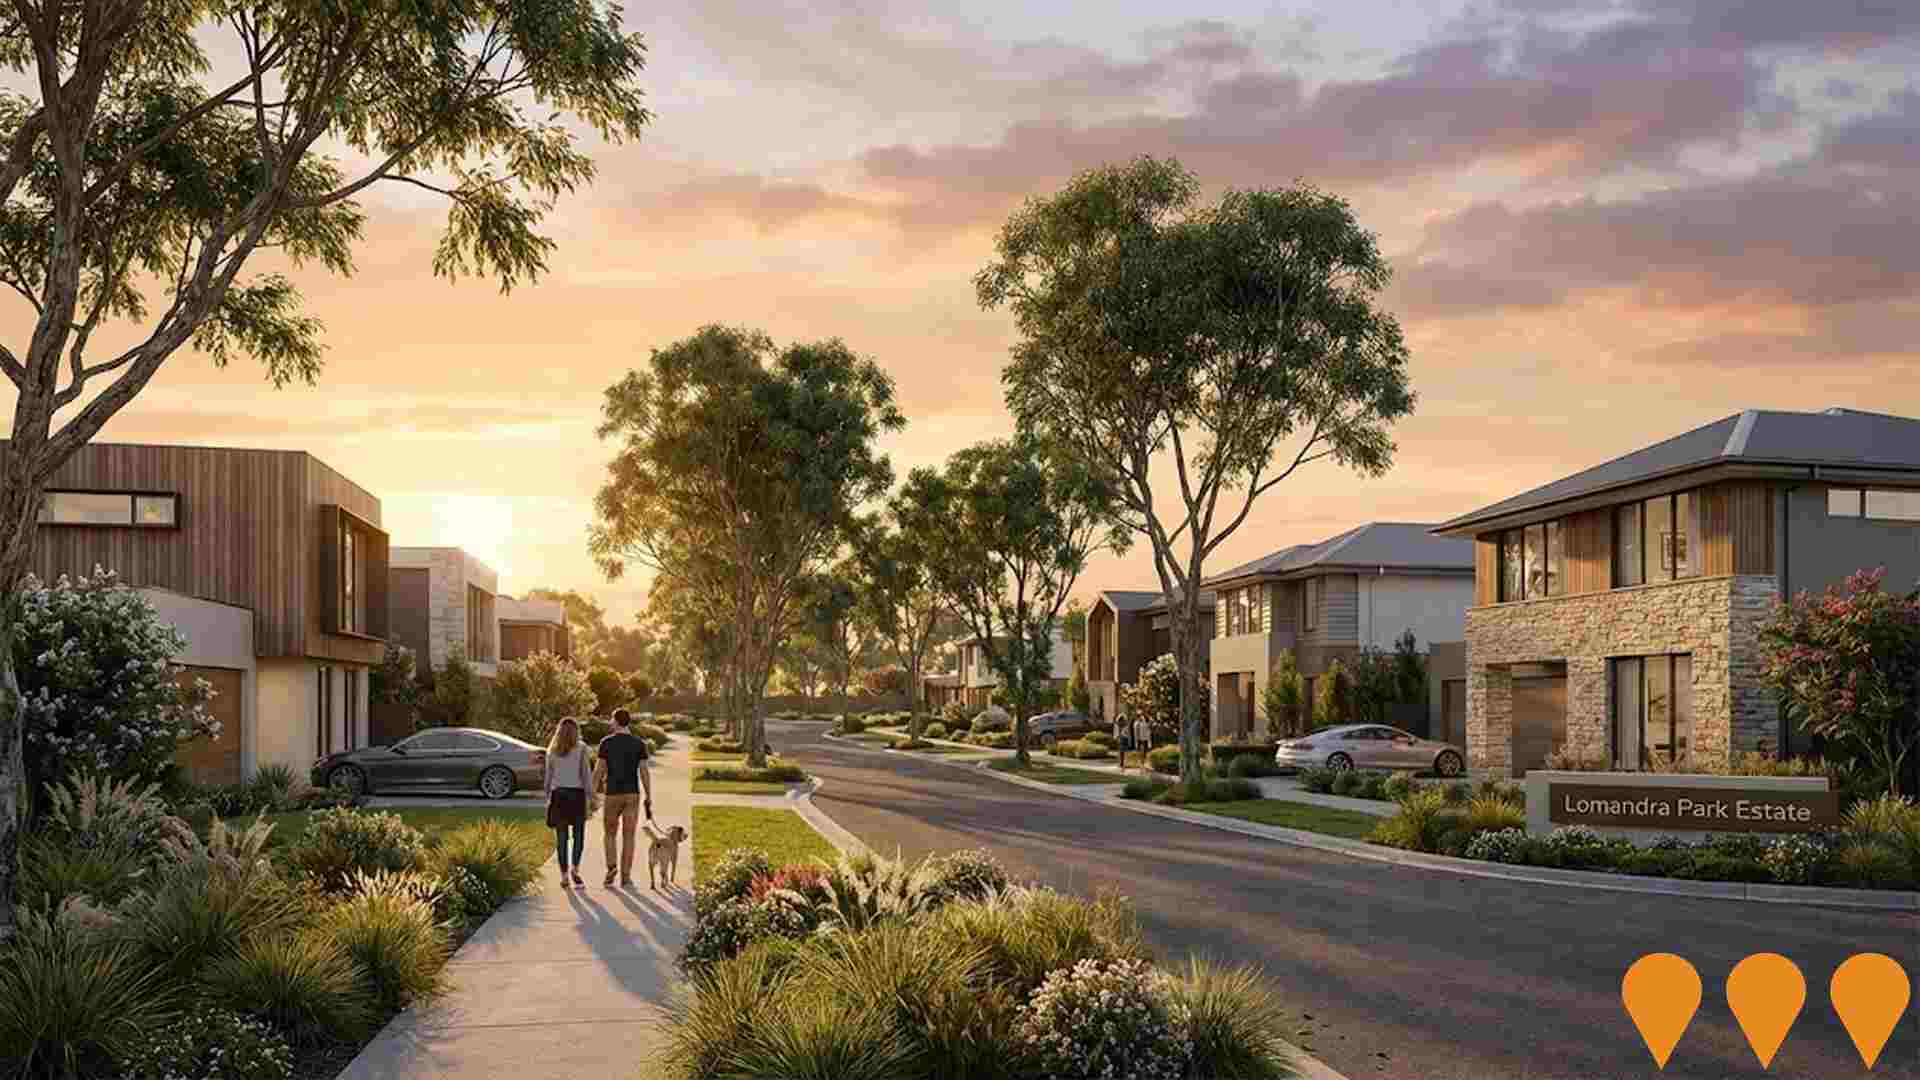
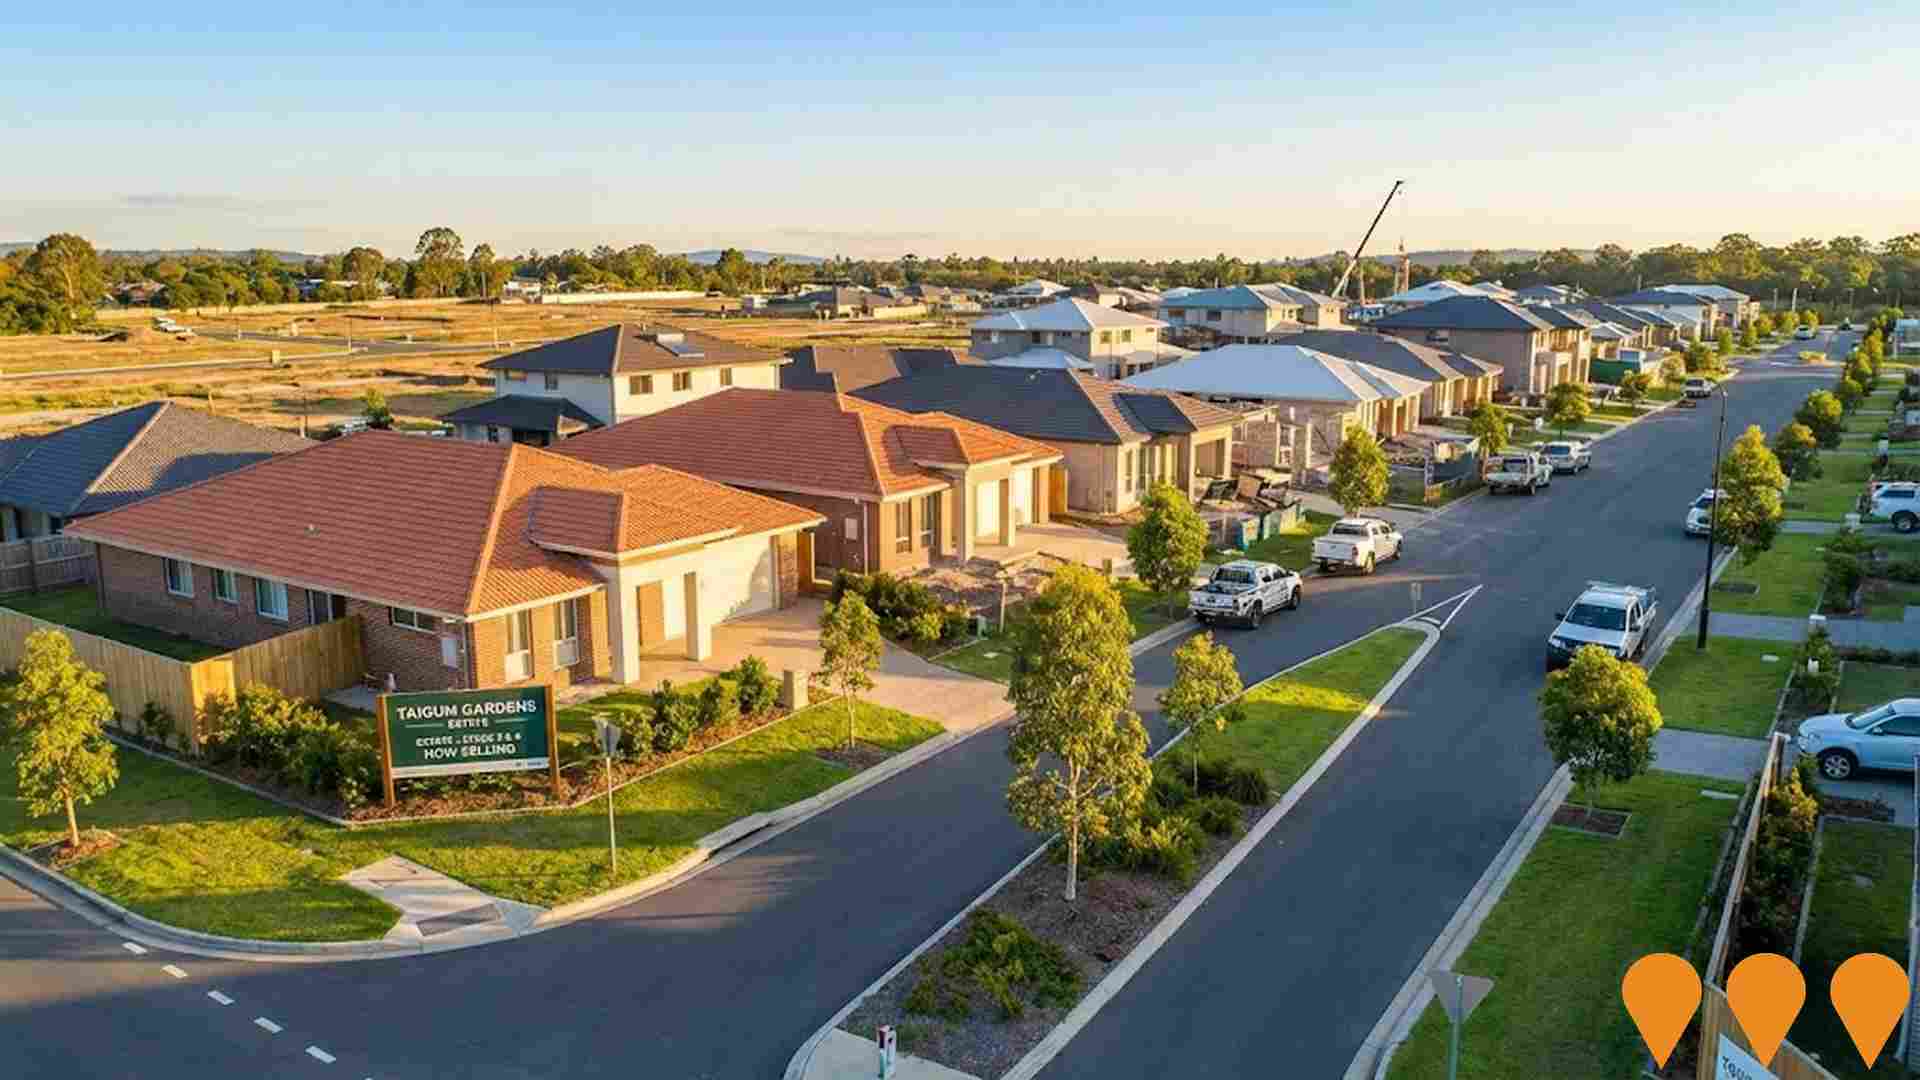
 Denotes AI-based impression for illustrative purposes only, not to be taken as definitive under any circumstances. Please follow links and conduct other investigations from the project's source for actual imagery. Developers and project owners wishing us to use original imagery please Contact Us and we will do so.
Frequently Asked Questions - Infrastructure
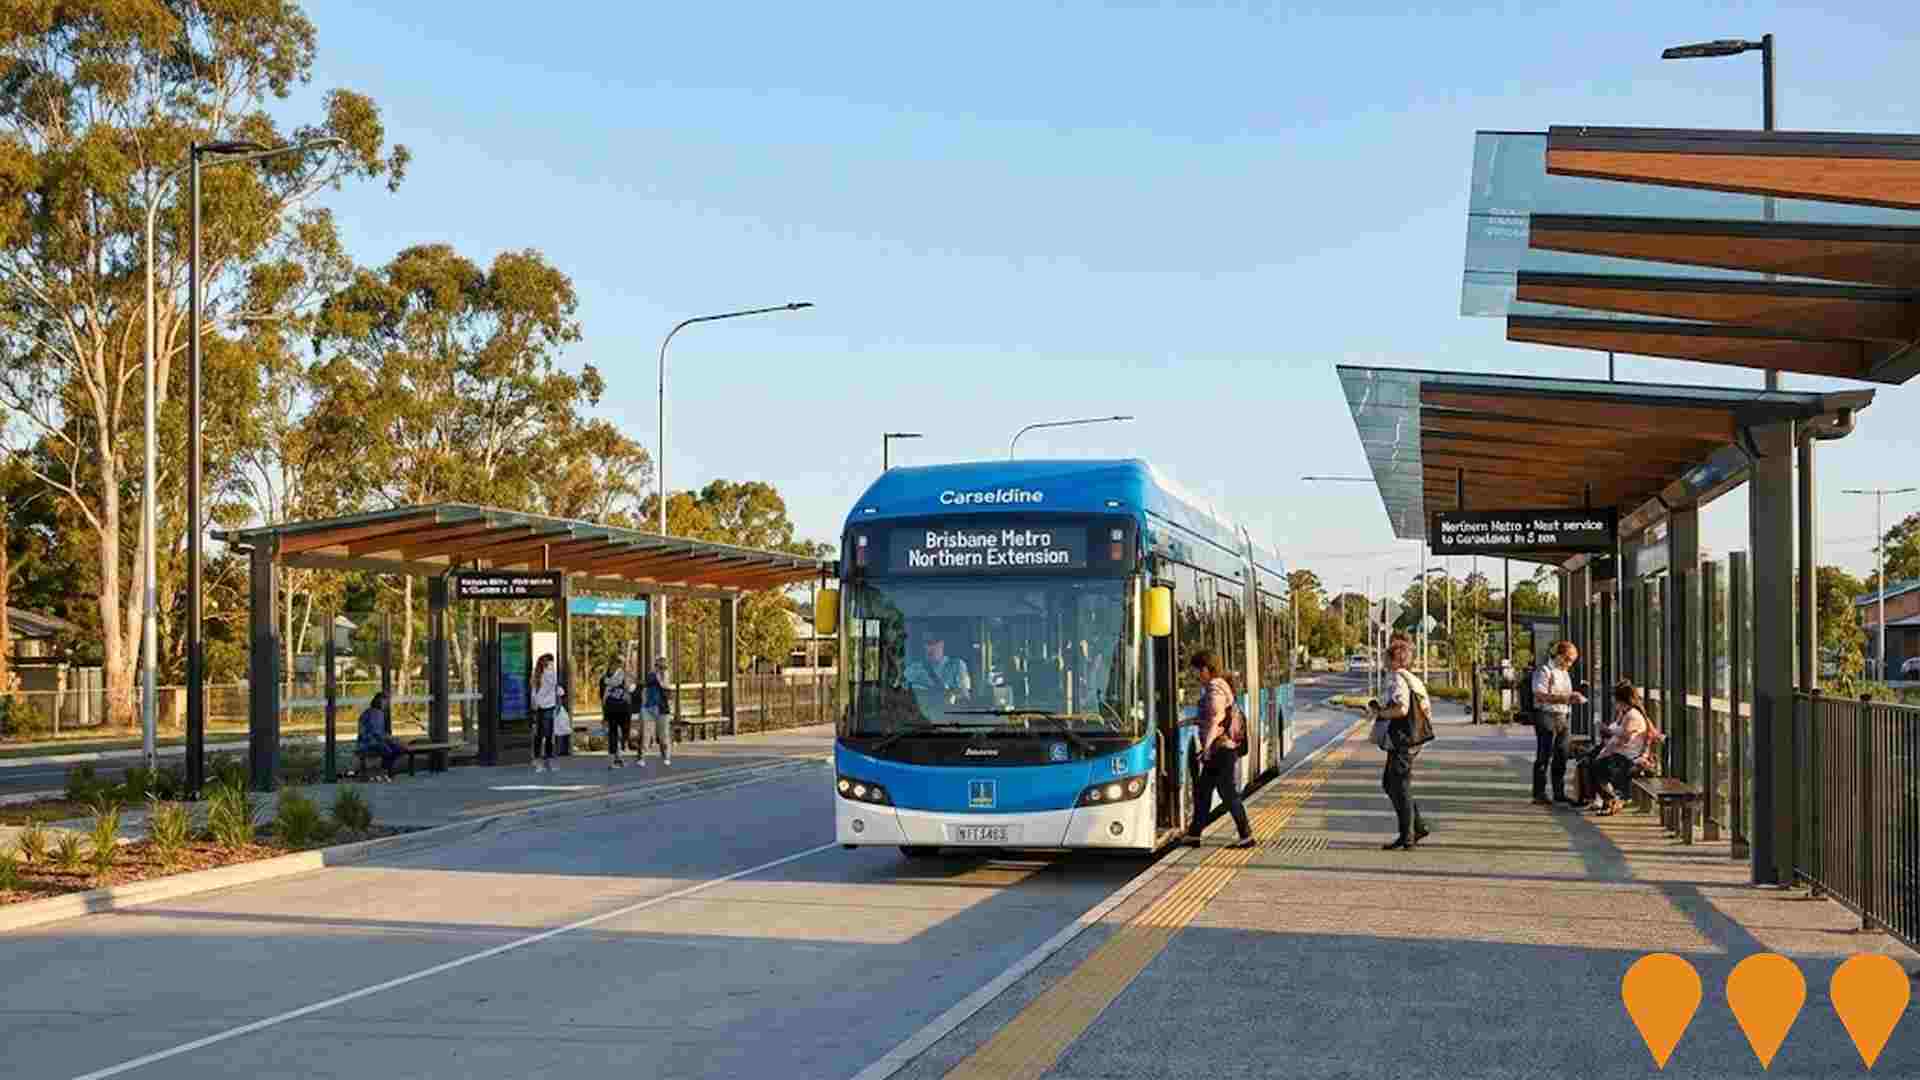
Brisbane Metro Northern Extension (Northern Metro)
Extension of the Brisbane Metro rapid bus transit system north from the Brisbane CBD to Carseldine (officially referred to as Northern Metro), delivering high-frequency, high-capacity fully electric metro services via dedicated infrastructure. The corridor includes new or extended stations at Lutwyche, Kedron, Chermside, Aspley and Carseldine, linking Moreton Bay communities to Brisbane employment centres ahead of the 2032 Olympic and Paralympic Games. A joint Brisbane City Council and Queensland Government project, supported by the Federal Government, currently in rapid business case phase with $50 million federal funding allocated for the business case.
Taigum Square Shopping Centre Redevelopment
Taigum Square is a single level sub regional shopping centre located on the corner of Church and Beams Roads in Taigum, approximately 15 kilometres north of the Brisbane CBD. The centre is owned and managed by Vicinity Centres and is anchored by Big W and Woolworths, supported by around 45 specialty stores and several freestanding tenancies. The most recent major redevelopment of the centre was completed in 2001, with the asset continuing to serve as a key local retail hub for Brisbane's northern suburbs.

Bridgeman Downs Neighbourhood Plan
Comprehensive 10+ year neighbourhood planning framework adopted by Brisbane City Council. Guides future development, transport, community facilities and environmental protection for sustainable growth.
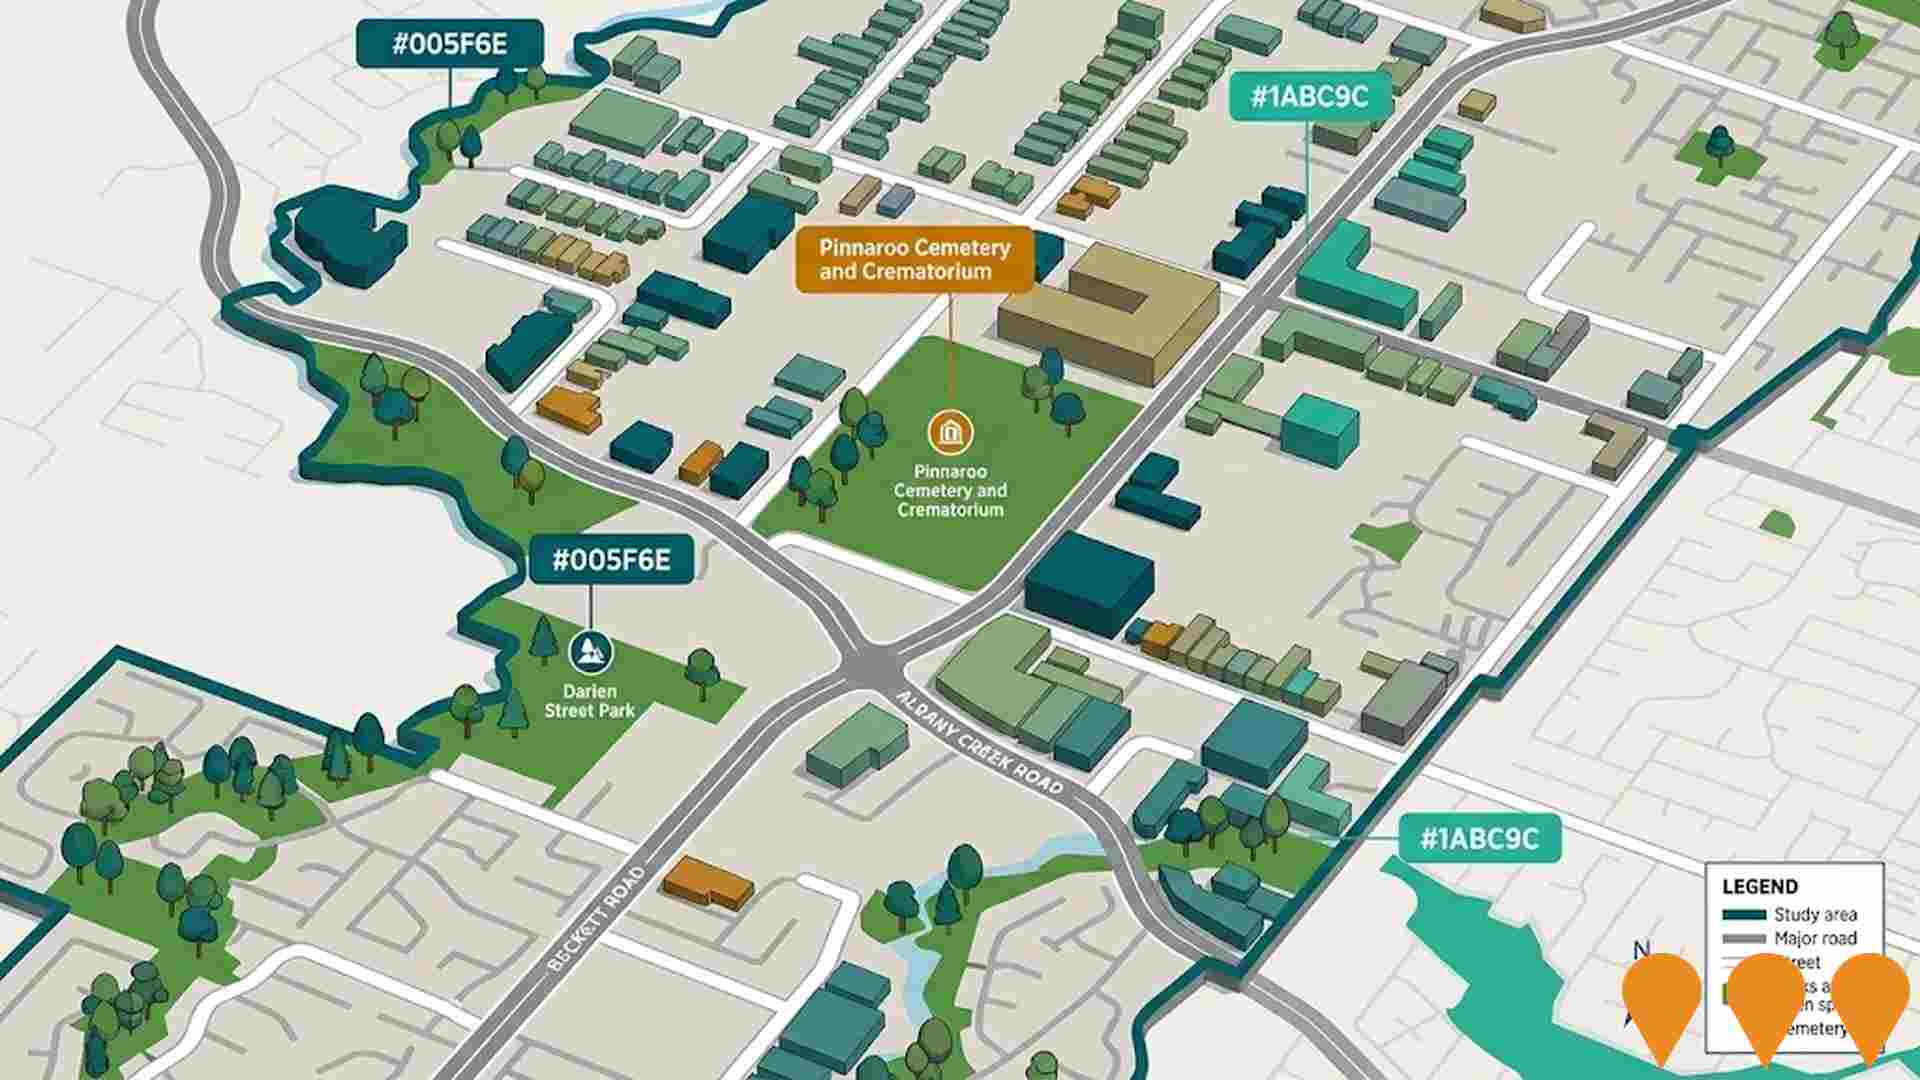
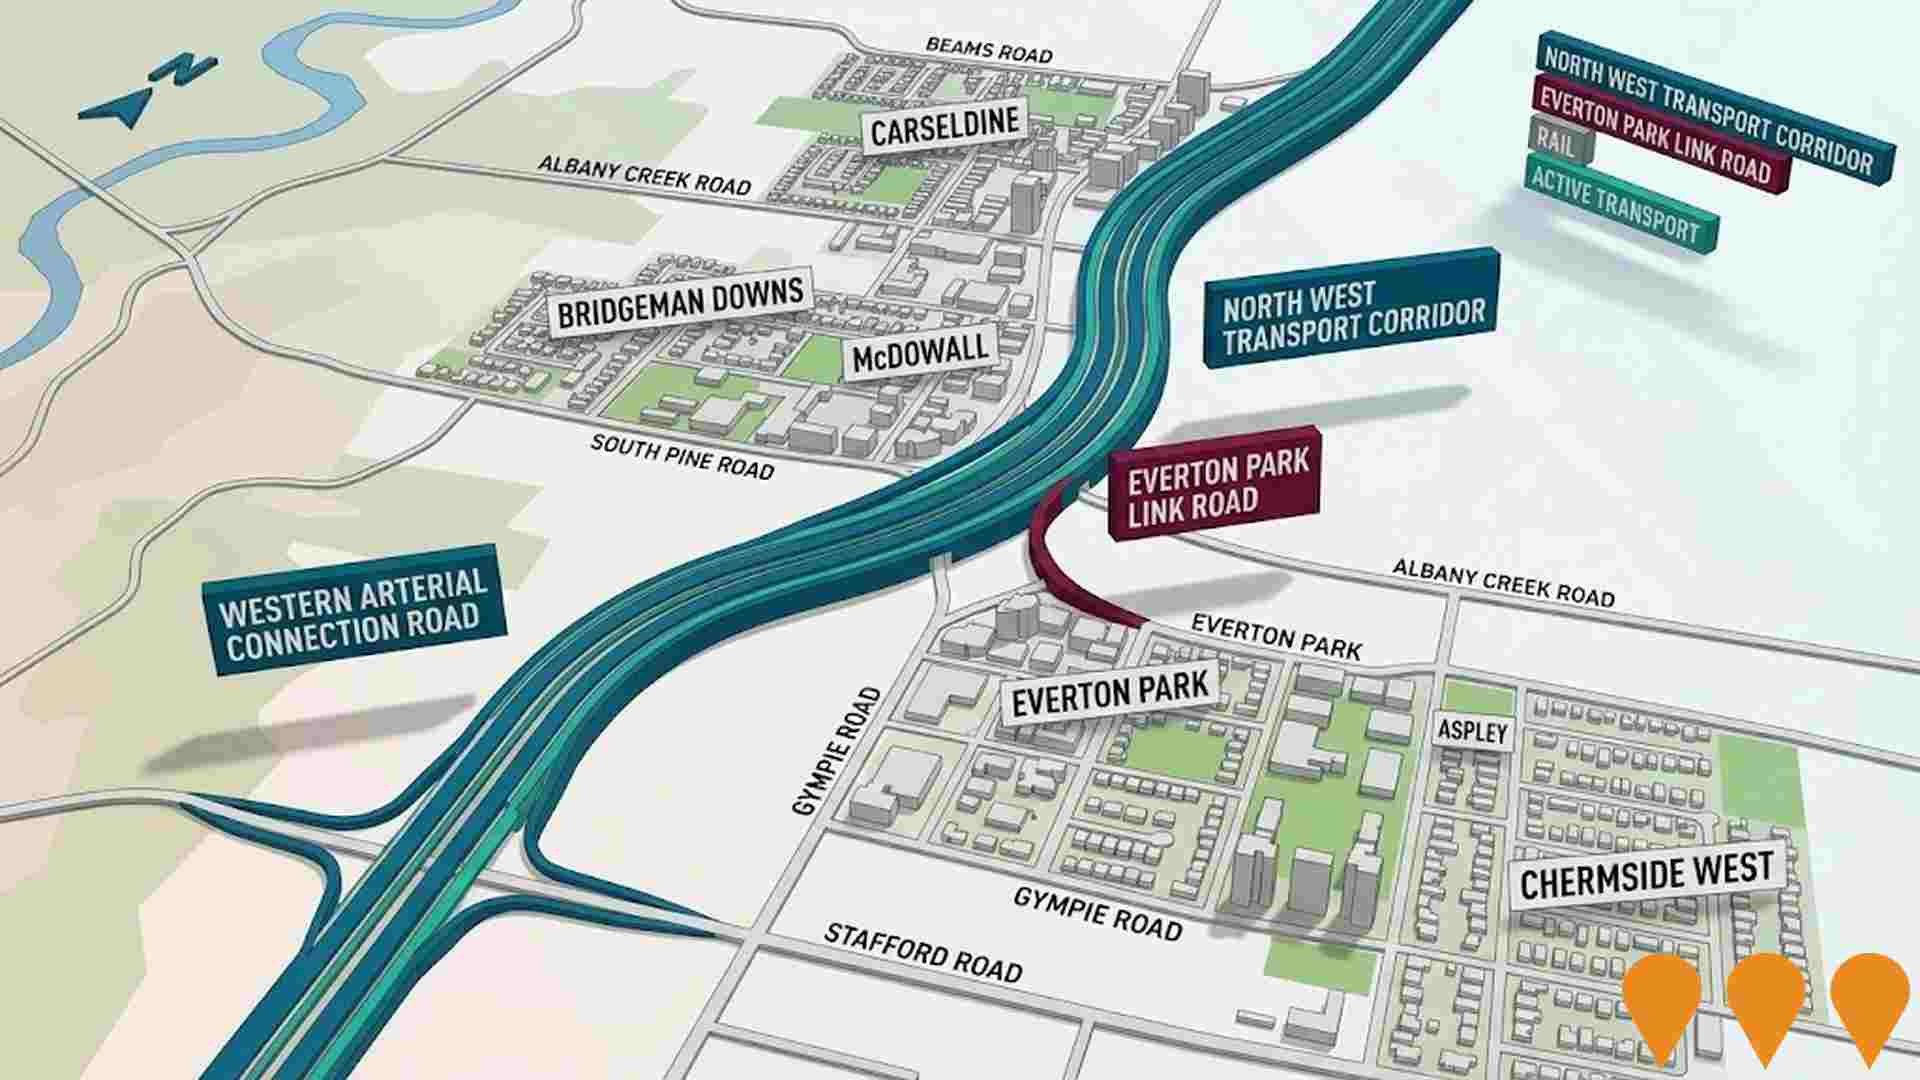
North West Transport Corridor
Integrated 9km transport corridor between Carseldine and Everton Park via Aspley area, preserved since the 1980s. $20 million business case study examining road, rail and active transport options to address growing congestion in northern Brisbane. Includes new arterial roads, public transport infrastructure, cycling and pedestrian paths. Various alignment options being considered including busway, rail, and tunnel solutions.
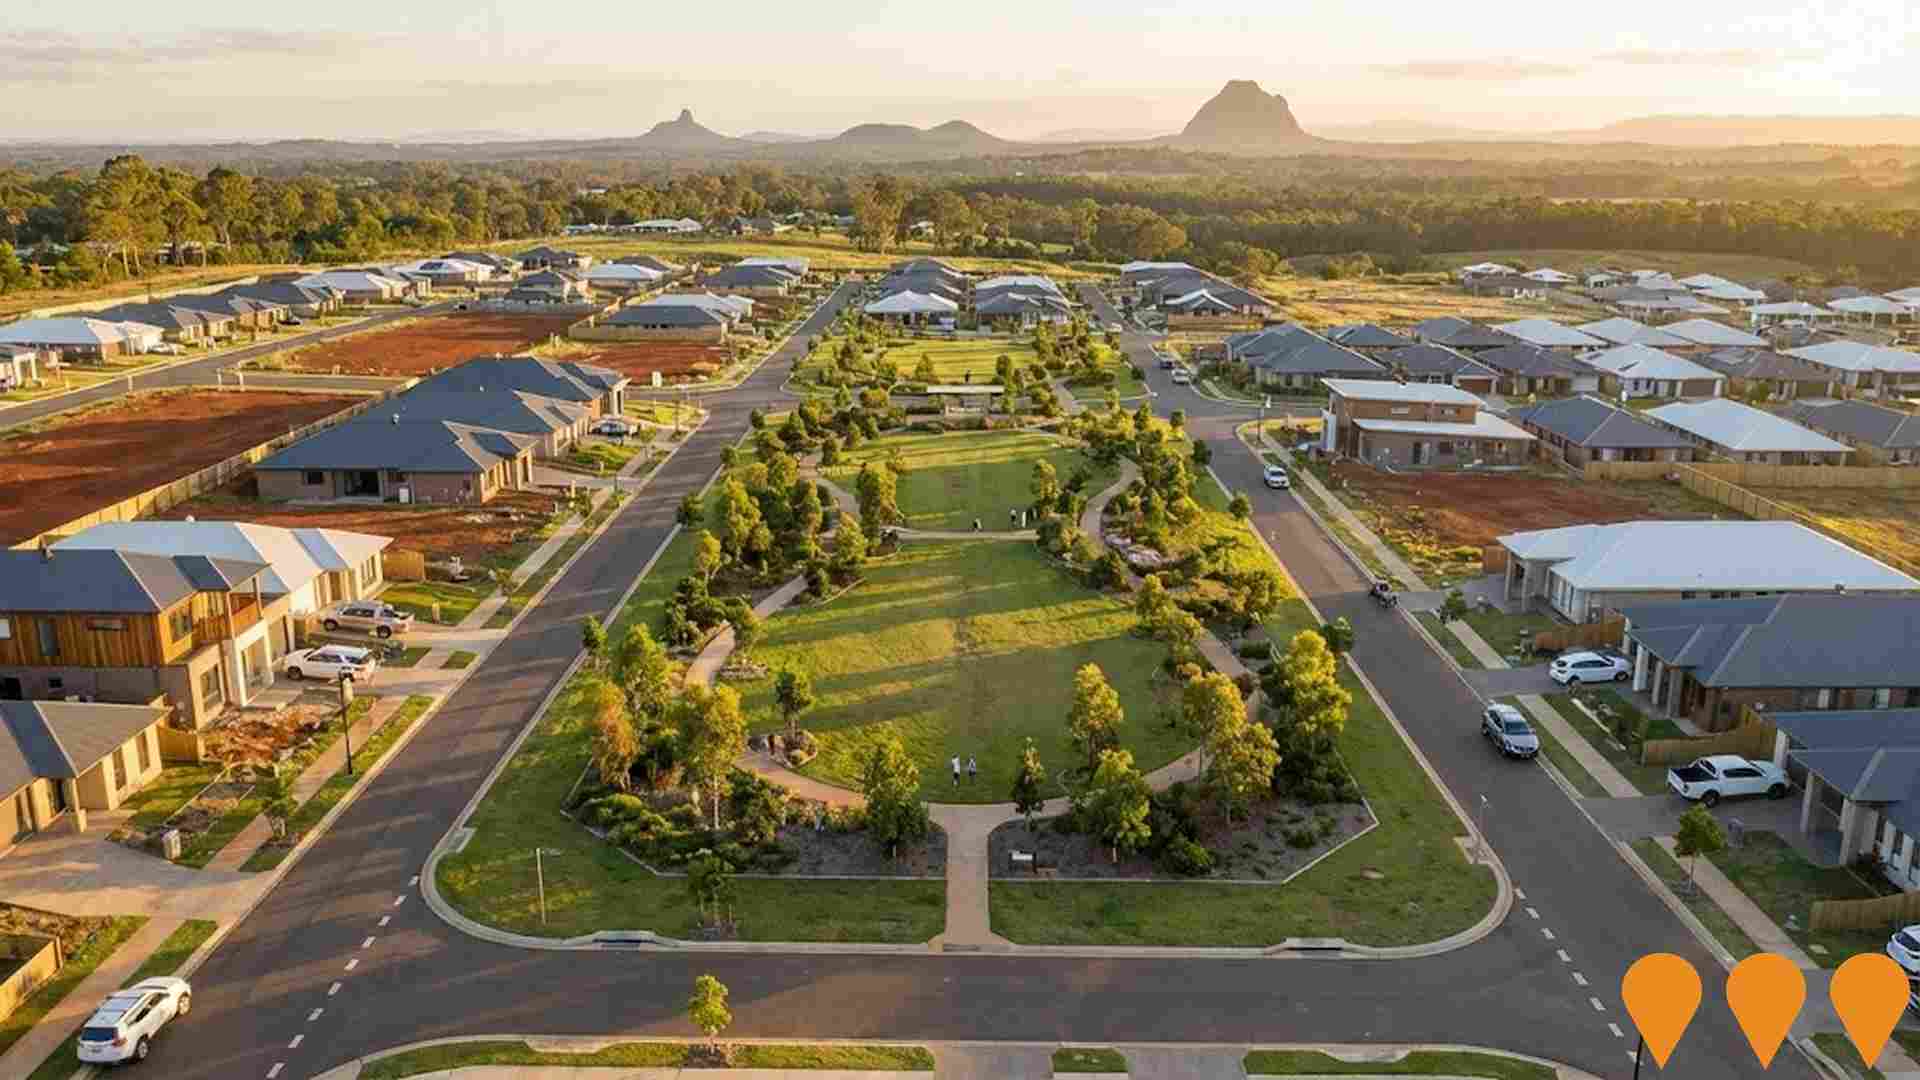
Highfields Estate
134 lot master planned residential community with 1.8 hectare central parkland. Gently sloping site with north-east orientation offering views of Glass House Mountains. One of the largest new estates in Bridgeman Downs.
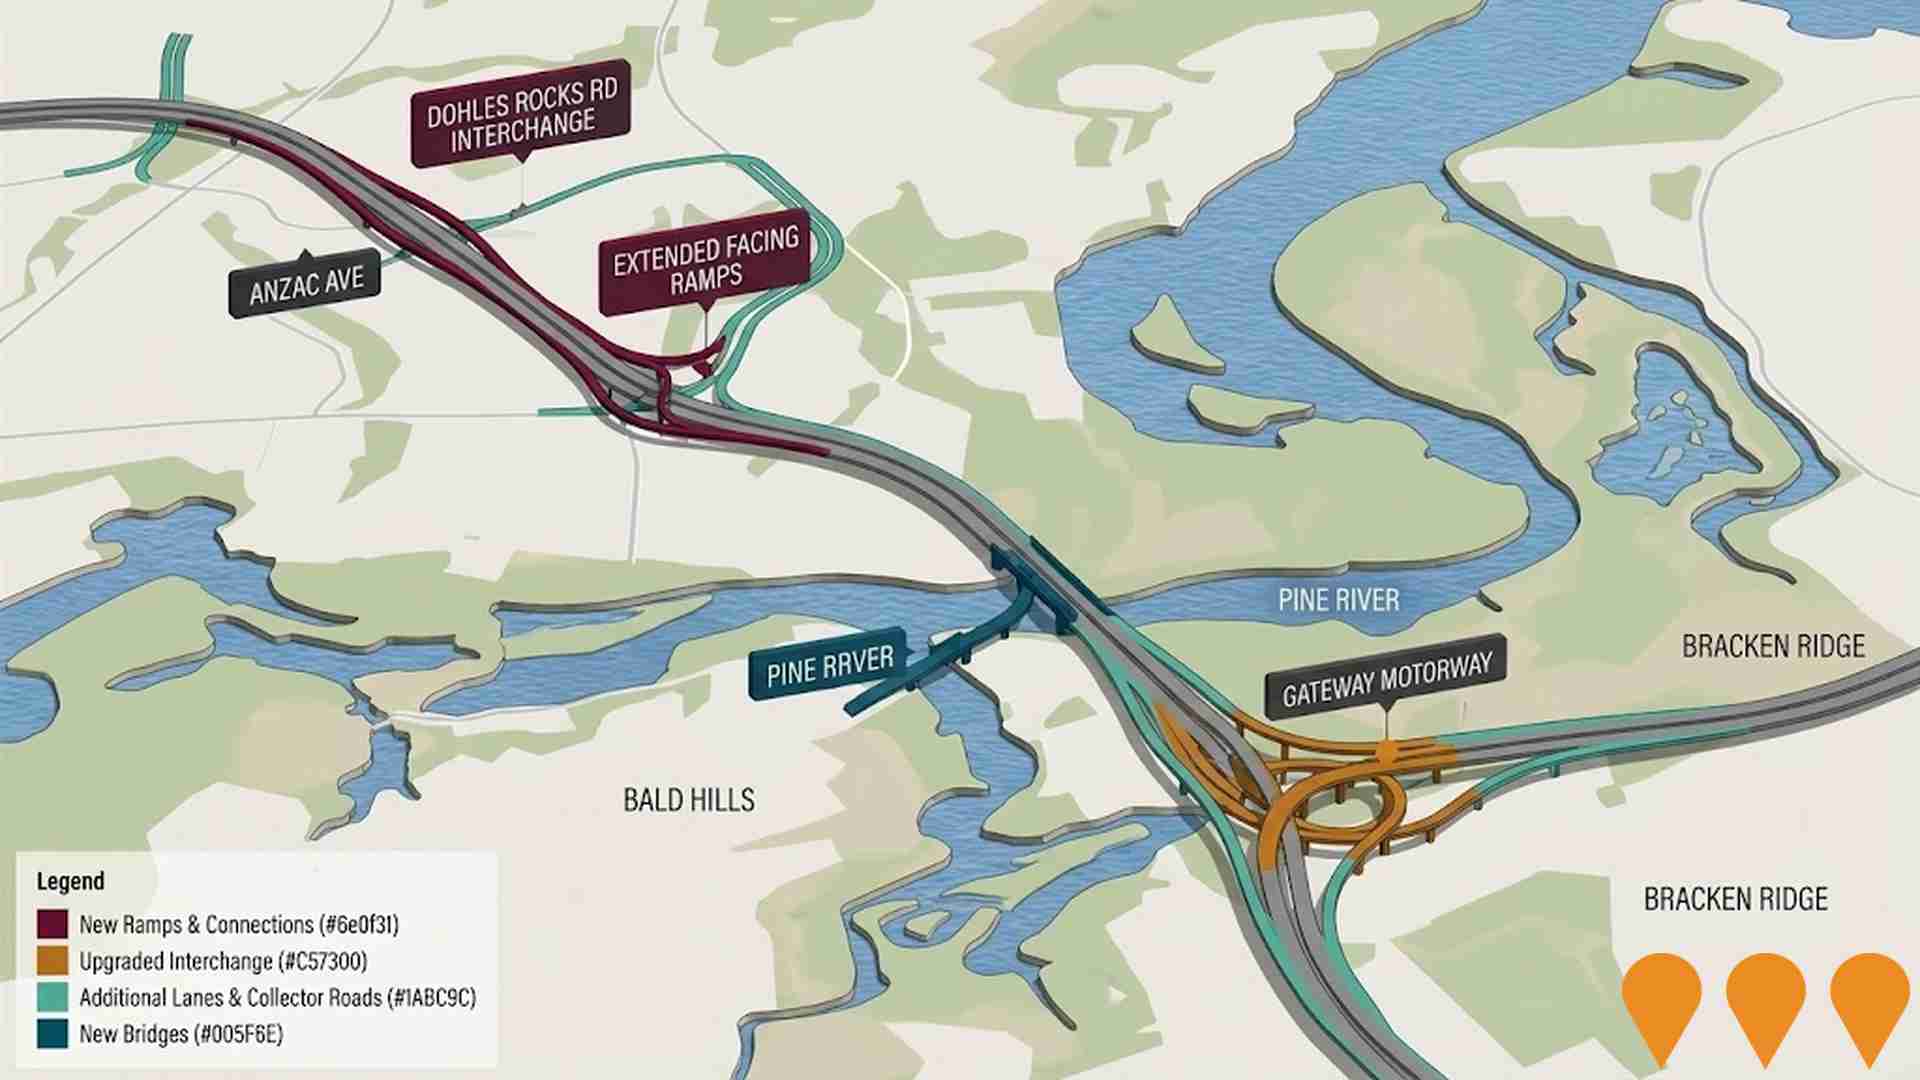
Bruce Highway Gateway Motorway to Dohles Rocks Road Upgrade Stage 1
Major upgrade of Bruce Highway including extended north-facing ramps from Dohles Rocks Road to Anzac Avenue, collector-distributor roads, additional lanes, and improved interchange at Gateway Motorway/Bruce Highway/Gympie Arterial Road. Joint funded by Australian and Queensland governments to enhance traffic flow and capacity along one of Queensland's key transport corridors.
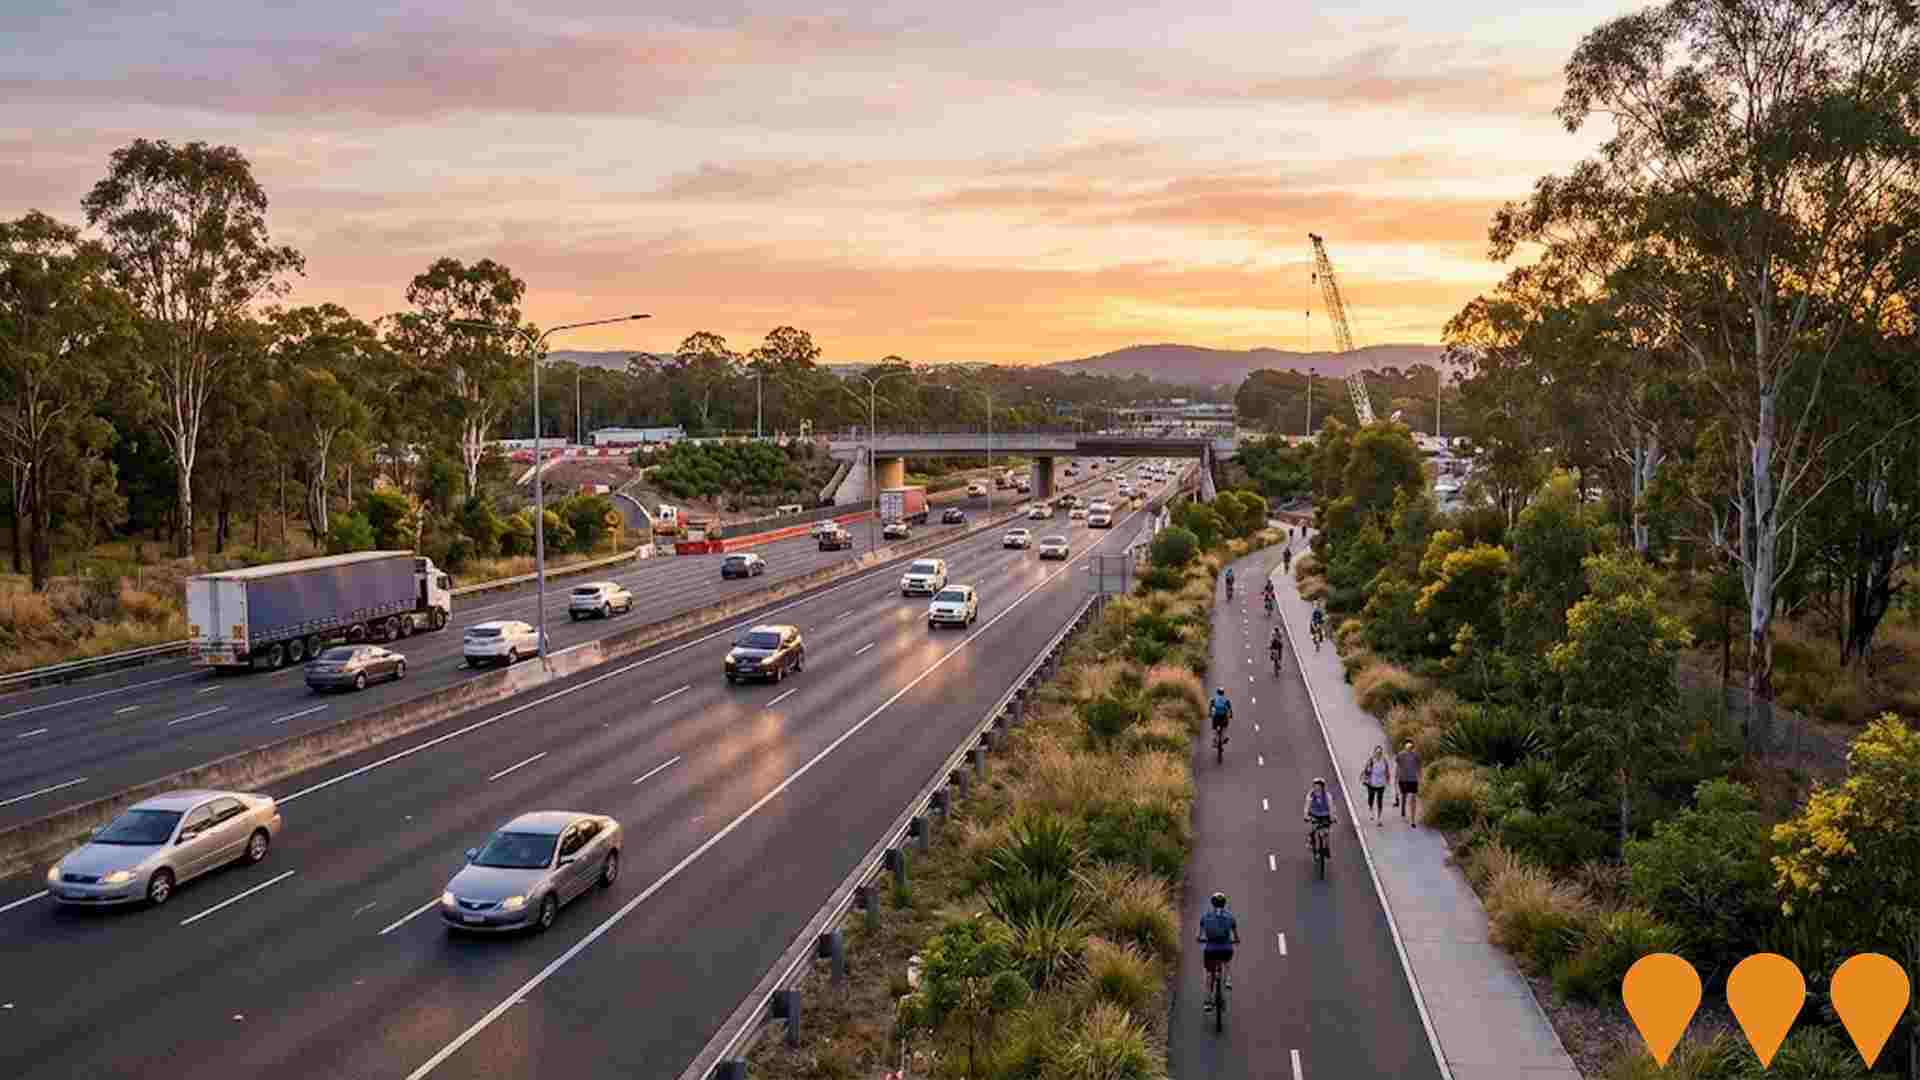
Gateway Motorway, Bracken Ridge to Pine River Upgrade
Upgrade of the Gateway Motorway between Bracken Ridge and the Pine River interchange to improve capacity, safety and network reliability. This section is being packaged and delivered with the Bruce Highway (Gateway Motorway to Dohles Rocks Road, Stage 1) as the Gateway to Bruce Upgrade (G2BU). TMR indicates procurement for a design-and-construct contractor is underway, with design activities preceding a construction start targeted from 2026.
Beams Road Upgrade Carseldine
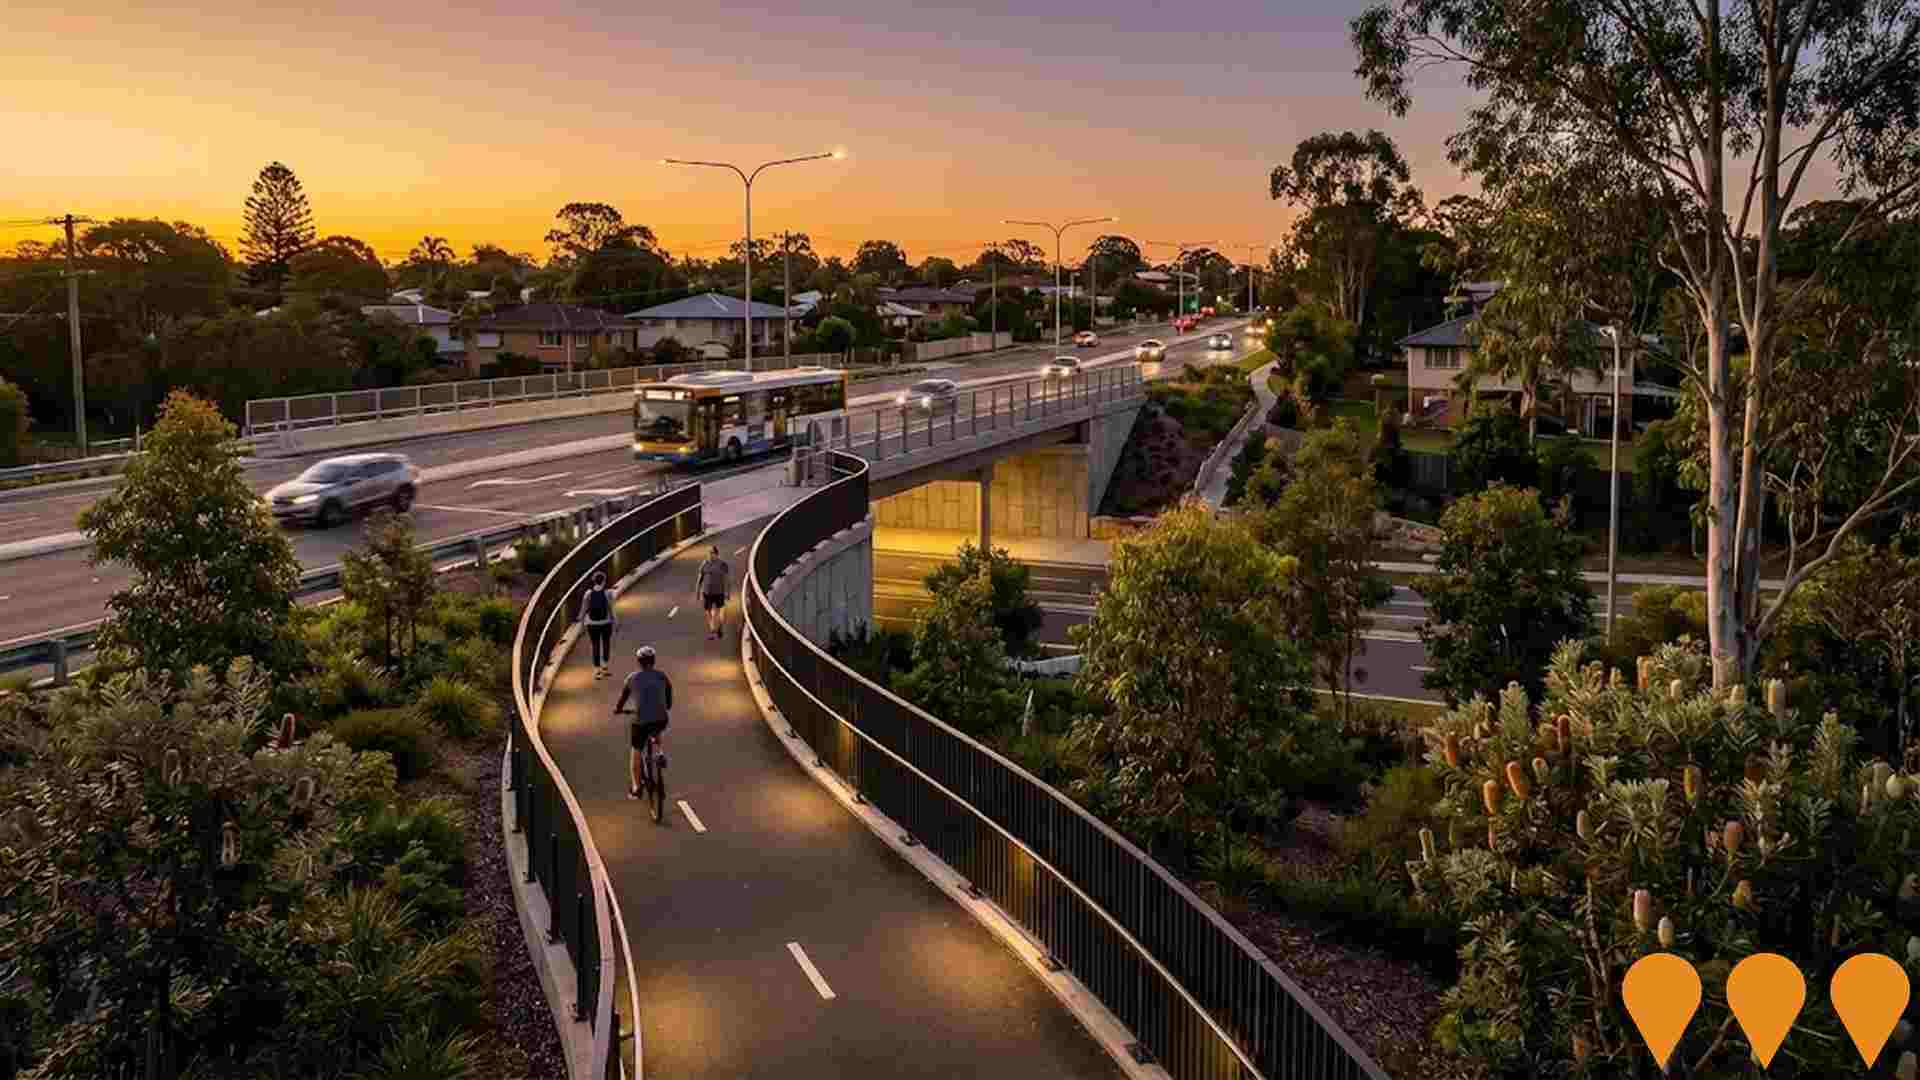
Road upgrade and widening of Beams Road in Carseldine to improve traffic flow and safety. Project included intersection improvements and enhanced pedestrian and cycling facilities.
Employment
Employment conditions in Sandgate - Shorncliffe remain below the national average according to AreaSearch analysis
Sandgate-Shorncliffe has an educated workforce with notable representation in essential services sectors. The area's unemployment rate was 5.3% as of September 2025, with estimated employment growth of 11.8% over the past year.
In September 2025, 3728 residents were employed while the unemployment rate stood at 6.3%, 1.3% higher than Greater Brisbane's rate of 4%. Workforce participation was lower at 58.4% compared to Greater Brisbane's 64.5%. Key employment sectors for residents include health care & social assistance, education & training, and professional & technical services. The area specializes in education & training with an employment share 1.3 times the regional level, but retail trade shows lower representation at 7.5% versus the regional average of 9.4%.
Employment levels increased by 11.8% and labour force grew by 10.7% during the year to September 2025, reducing the unemployment rate by 0.9 percentage points. In contrast, Greater Brisbane experienced employment growth of 3.8% and labour force growth of 3.3%, with a drop in unemployment rate of 0.5 percentage points. As of 25-November state-level data shows Queensland's employment contracted by 0.01% (losing 1210 jobs), with the state unemployment rate at 4.2%, closely aligned with the national rate of 4.3%. National employment forecasts from May-25 project growth of 6.6% over five years and 13.7% over ten years, but growth rates vary significantly between industry sectors. Applying these projections to Sandgate-Shorncliffe's employment mix suggests local employment should increase by approximately 6.9% over five years and 14.1% over ten years, assuming constant population projections for illustrative purposes.
Frequently Asked Questions - Employment
Income
Income analysis reveals strong economic positioning, with the area outperforming 60% of locations assessed nationally by AreaSearch
AreaSearch's latest postcode level ATO data for financial year 2022 shows Sandgate - Shorncliffe SA2 had a median income among taxpayers of $55,441 and an average of $66,345. This is slightly above the national average, with Greater Brisbane having a median of $55,645 and an average of $70,520. Based on Wage Price Index growth of 13.99% since financial year 2022, estimated incomes as of September 2025 would be approximately $63,197 (median) and $75,627 (average). Census 2021 income data reveals that household, family, and personal incomes in Sandgate - Shorncliffe cluster around the 55th percentile nationally. Income analysis indicates that the largest segment comprises 23.4% earning $1,500 - 2,999 weekly (1,630 residents), mirroring the metropolitan region where 33.3% occupy this bracket. A substantial proportion of high earners, 33.3% above $3,000/week, indicates strong economic capacity throughout the suburb. After housing expenses, 86.1% of income remains for other expenses. The area's SEIFA income ranking places it in the 7th decile.
Frequently Asked Questions - Income
Housing
Sandgate - Shorncliffe is characterized by a predominantly suburban housing profile, with above-average rates of outright home ownership
In Sandgate-Shorncliffe, as per the latest Census evaluation, 74.9% of dwellings were houses, with the remaining 25.1% comprising semi-detached homes, apartments, and other types. Brisbane metropolitan area had a slightly higher proportion of houses at 75.4%, with 24.6% being other dwelling types. Home ownership in Sandgate-Shorncliffe stood at 34.0%, compared to the remainder that were either mortgaged (35.5%) or rented (30.5%). The median monthly mortgage repayment in the area was $2,167, higher than Brisbane's average of $1,800. Weekly rent in Sandgate-Shorncliffe was recorded at $288, lower than Brisbane's $375. Nationally, Sandgate-Shorncliffe's mortgage repayments were significantly higher than the Australian average of $1,863, while rents were substantially below the national figure of $375.
Frequently Asked Questions - Housing
Household Composition
Sandgate - Shorncliffe features high concentrations of lone person households, with a lower-than-average median household size
Family households account for 66.6% of all households, including 31.7% couples with children, 25.4% couples without children, and 8.8% single parent families. Non-family households constitute the remaining 33.4%, with lone person households at 31.0% and group households comprising 2.6%. The median household size is 2.4 people, which is smaller than the Greater Brisbane average of 2.5.
Frequently Asked Questions - Households
Local Schools & Education
Sandgate - Shorncliffe shows strong educational performance, ranking in the upper quartile nationally when assessed across multiple qualification and achievement indicators
The area's university qualification rate is 35.2%, exceeding Queensland's average of 25.7%. This figure surpasses the SA3 area's rate of 28.2%. The community's emphasis on higher education is evident in the prevalence of bachelor degrees (22.0%), postgraduate qualifications (8.1%), and graduate diplomas (5.1%).
Trade and technical skills are also prominent, with 30.8% of residents aged 15+ holding vocational credentials. This includes advanced diplomas (11.1%) and certificates (19.7%). Educational participation is high, with 27.5% of residents currently enrolled in formal education. This includes secondary education (9.4%), primary education (8.4%), and tertiary education (5.4%).
Frequently Asked Questions - Education
Schools Detail
Nearby Services & Amenities
Transport
Transport servicing is high compared to other areas nationally based on assessment of service frequency, route connectivity and accessibility
Sandgate-Shorncliffe has 50 active public transport stops serving a mix of train and bus routes. These are covered by 25 individual routes, offering 3,150 weekly passenger trips in total. Transport accessibility is rated excellent, with residents on average located 185 meters from the nearest stop.
Service frequency averages 450 trips per day across all routes, equating to approximately 63 weekly trips per individual stop.
Frequently Asked Questions - Transport
Transport Stops Detail
Health
Health performance in Sandgate - Shorncliffe is well below average with prevalence of common health conditions notable across both younger and older age cohorts
Sandgate-Shorncliffe faces significant health challenges, as indicated by health data.
Both younger and older age groups have high prevalence rates of common health conditions. The area has a private health cover rate of approximately 52%, slightly higher than the average SA2 region (~3650 people). Mental health issues and arthritis are the most prevalent medical conditions, affecting 10.2% and 8.4% of residents respectively. However, 63.4% of residents report having no medical ailments, compared to 67.8% in Greater Brisbane. The area has a higher proportion of seniors aged 65 and over at 24.1%, with 1676 people falling into this category, compared to 18.5% in Greater Brisbane. Health outcomes among seniors present similar challenges as those faced by the general population.
Frequently Asked Questions - Health
Cultural Diversity
Sandgate - Shorncliffe ranks below the Australian average when compared to other local markets across a number of language and cultural background related metrics
Sandgate-Shorncliffe had a cultural diversity index below average, with 81.0% of its population born in Australia, 92.0% being citizens, and 94.1% speaking English only at home. The predominant religion was Christianity, practiced by 53.7% of the population, compared to 50.1% across Greater Brisbane. Regarding ancestry, the top three groups were English (31.0%), Australian (26.4%), and Irish (12.2%).
Notable differences included Scottish representation at 9.4%, New Zealand at 1.0%, and French at 0.7%.
Frequently Asked Questions - Diversity
Age
Sandgate - Shorncliffe hosts an older demographic, ranking in the top quartile nationwide
Sandgate-Shorncliffe's median age is 48 years, significantly higher than Greater Brisbane's average of 36 years and exceeding the national average of 38 years. The 55-64 age group comprises 15.6%, compared to Greater Brisbane, while the 25-34 cohort is less prevalent at 5.5%. Post-2021 Census data shows that the 15-24 age group has grown from 10.4% to 13.0%, and the 75-84 cohort increased from 7.4% to 8.8%. Conversely, the 45-54 cohort declined from 17.8% to 16.0%, and the 85+ group dropped from 4.8% to 3.4%. Demographic modeling suggests Sandgate-Shorncliffe's age profile will change significantly by 2041, with the 75-84 cohort projected to grow by 46%, adding 279 residents to reach 893. Senior residents aged 65 and above will drive 99% of population growth, highlighting demographic aging trends. Meanwhile, population declines are projected for the 0-4 and 25-34 cohorts.
