Chart Color Schemes
This analysis uses ABS Statistical Areas Level 2 (SA2) boundaries, which can materially differ from Suburbs and Localities (SAL) even when sharing similar names.
SA2 boundaries are defined by the Australian Bureau of Statistics and are designed to represent communities for statistical reporting (e.g., census and ERP).
Suburbs and Localities (SAL) represent commonly-used suburb/locality names (postal-style areas) and may use different geographic boundaries. For comprehensive analysis, consider reviewing both boundary types if available.
est. as @ -- *
ABS ERP | -- people | --
2021 Census | -- people
Sales Activity
Curious about local property values? Filter the chart to assess the volume and appreciation (including resales) trends and regional comparisons, or scroll to the map below view this information at an individual property level.
Find a Recent Sale
Sales Detail
Population
Murrumba Downs - Griffin lies within the top 10% of areas nationally in terms of population growth performance according to AreaSearch analysis of short and medium-term trends
Murrumba Downs - Griffin's population was around 27,338 as of Nov 2025. This figure reflects an increase of 4,249 people since the 2021 Census, which recorded a population of 23,089. The change is inferred from the estimated resident population of 26,616 in June 2024 and an additional 664 validated new addresses since the Census date. This results in a density ratio of 1,213 persons per square kilometer, above the national average assessed by AreaSearch. The area's 18.4% growth since the 2021 census exceeded the national average (8.9%). Population growth was primarily driven by interstate migration contributing approximately 52.6% of overall population gains.
AreaSearch adopts ABS/Geoscience Australia projections for each SA2 area, released in 2024 with a base year of 2022. For areas not covered and years post-2032, Queensland State Government's SA2 area projections released in 2023 based on 2021 data are used. These state projections do not provide age category splits, so AreaSearch applies proportional growth weightings from ABS Greater Capital Region projections released in 2023 based on 2022 data for each age cohort. By 2041, the area is forecast to increase by 12,303 persons, reflecting a total increase of 42.4% over the 17 years.
Frequently Asked Questions - Population
Development
The level of residential development activity in Murrumba Downs - Griffin was found to be higher than 90% of real estate markets across the country
Murrumba Downs - Griffin has granted approximately 255 residential property approvals annually over the past five financial years, totalling 1,278 homes. As of FY-26, 66 approvals have been recorded. On average, 3.8 people move to the area each year for every dwelling built between FY-21 and FY-25, indicating high demand outstripping supply. New properties are constructed at an average cost of $168,000, below the regional average, suggesting more affordable housing options.
Commercial approvals this financial year amount to $23.9 million, reflecting steady commercial investment activity. Compared to Greater Brisbane, Murrumba Downs - Griffin has 51.0% higher new home approvals per person, offering greater choice for buyers despite a recent slowdown in building activity. New development consists of 79.0% detached houses and 21.0% attached dwellings, maintaining the area's suburban identity with a focus on family homes. The location has approximately 217 people per dwelling approval, leaving room for growth. According to AreaSearch's latest quarterly estimate, Murrumba Downs - Griffin is projected to add 11,581 residents by 2041.
At current development rates, housing supply may struggle to keep pace with population growth, potentially intensifying buyer competition and supporting price increases.
Frequently Asked Questions - Development
Infrastructure
Murrumba Downs - Griffin has moderate levels of nearby infrastructure activity, ranking in the top 50% nationally
Changes to local infrastructure significantly influence an area's performance. AreaSearch has identified 40 projects likely impacting the area. Notable ones include Redcliffe Peninsula Rail Line Upgrades, River Cove Residences, Moreton Bay Central, and Moreton Bay Marine Education and Discovery Centre. The following list details those most relevant.
Professional plan users can use the search below to filter and access additional projects.
INFRASTRUCTURE SEARCH
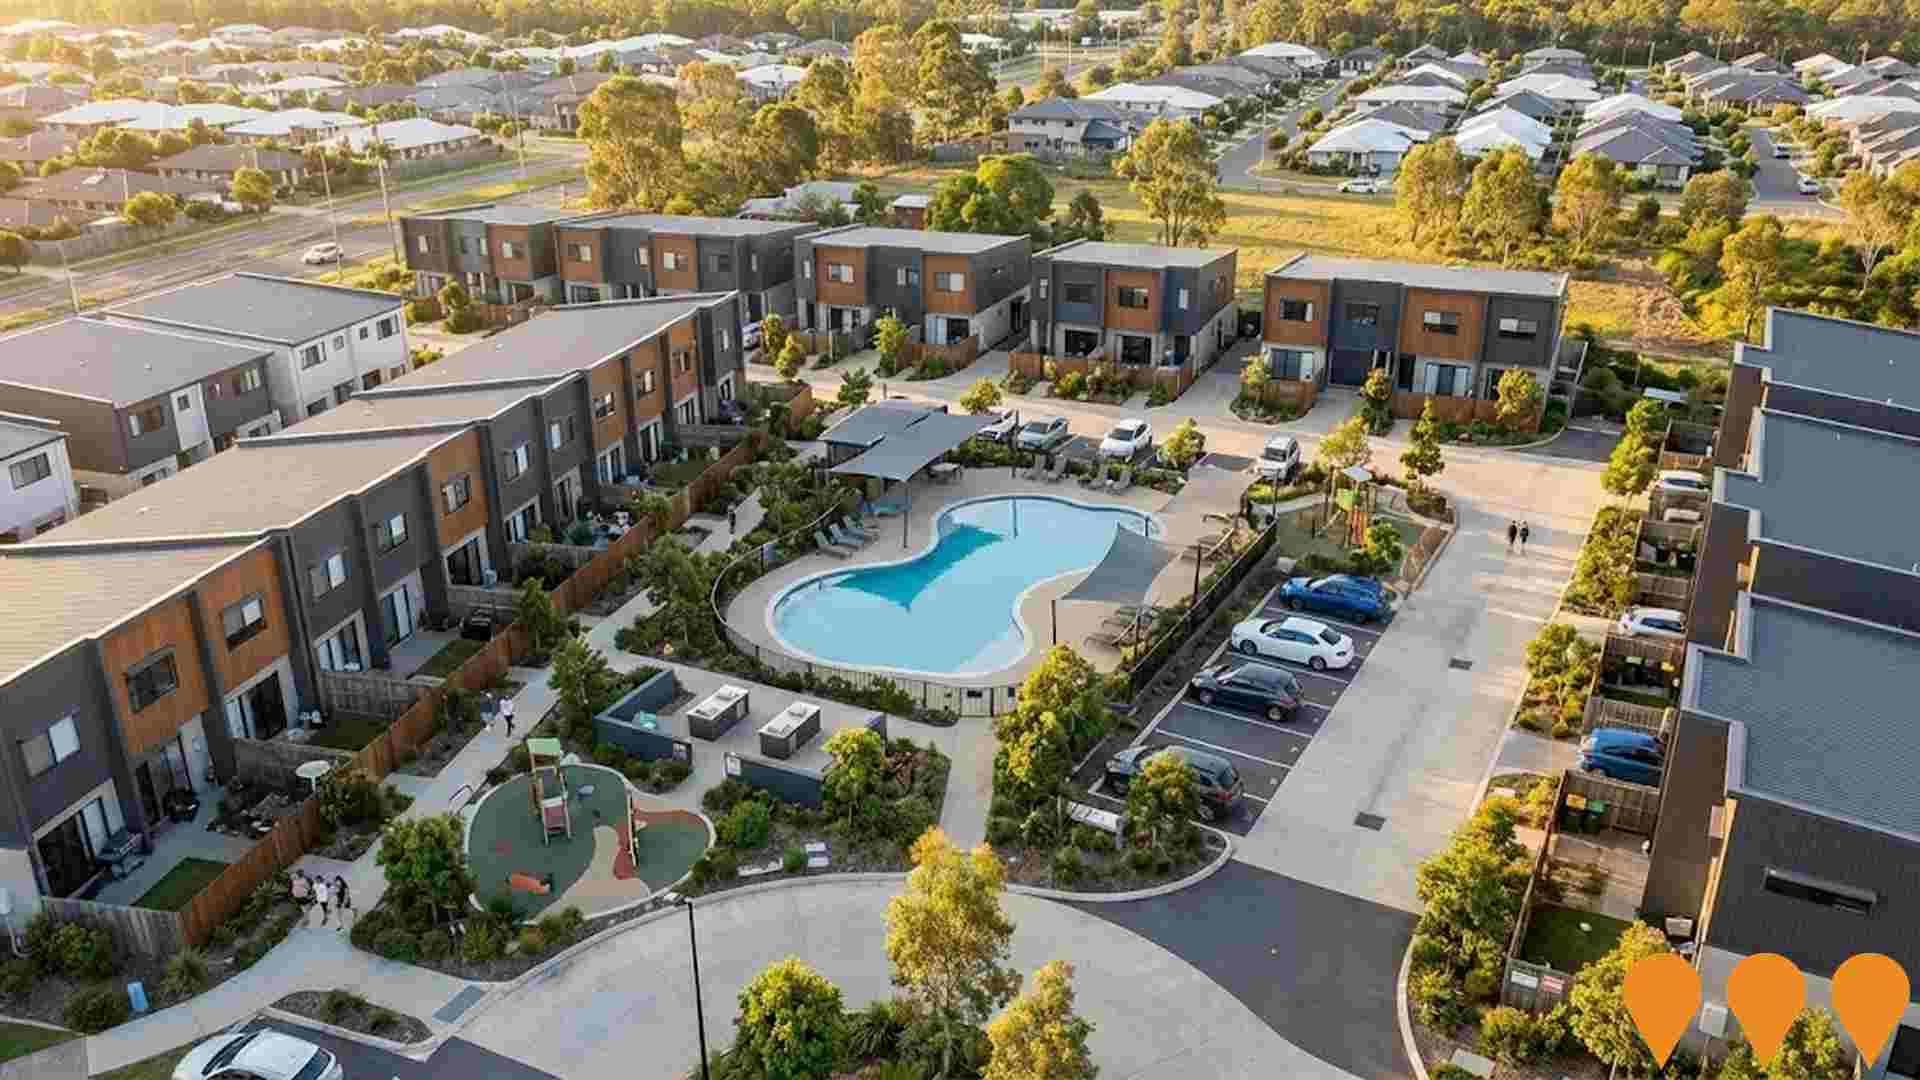
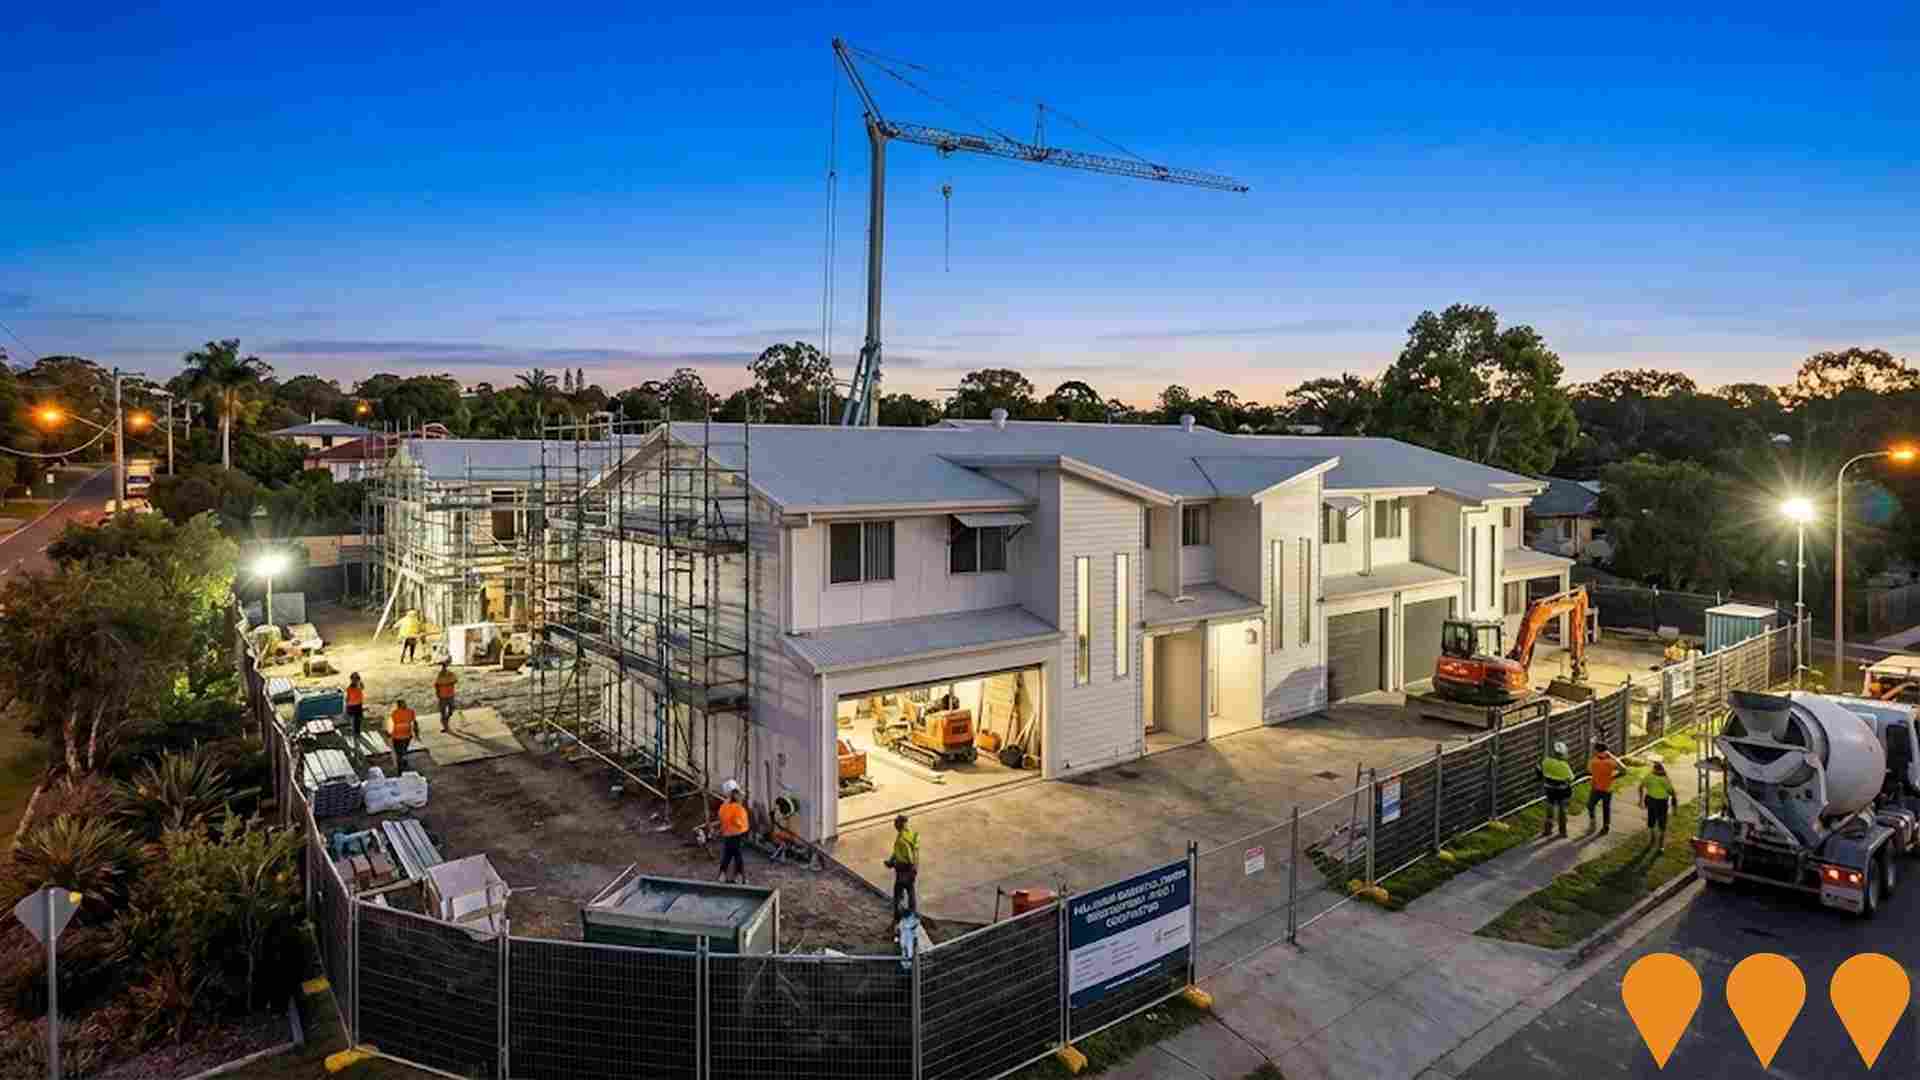
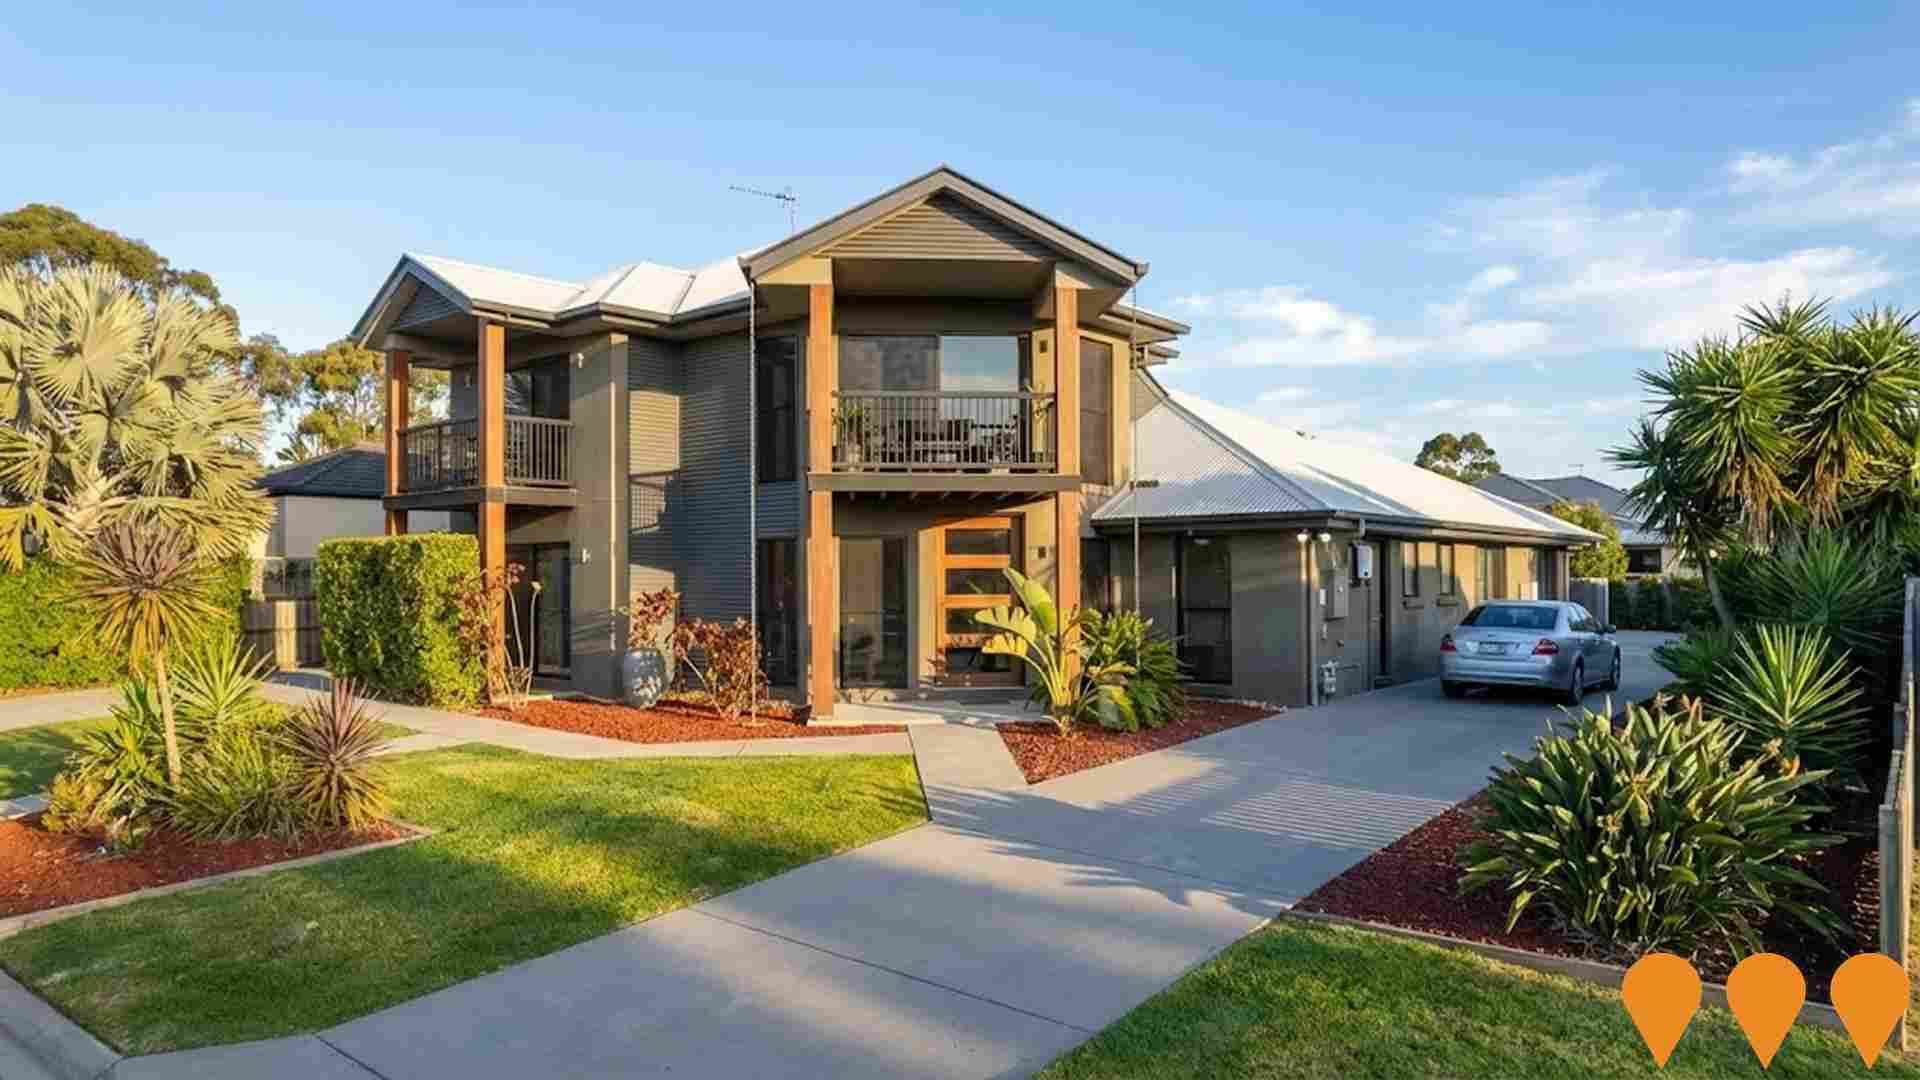
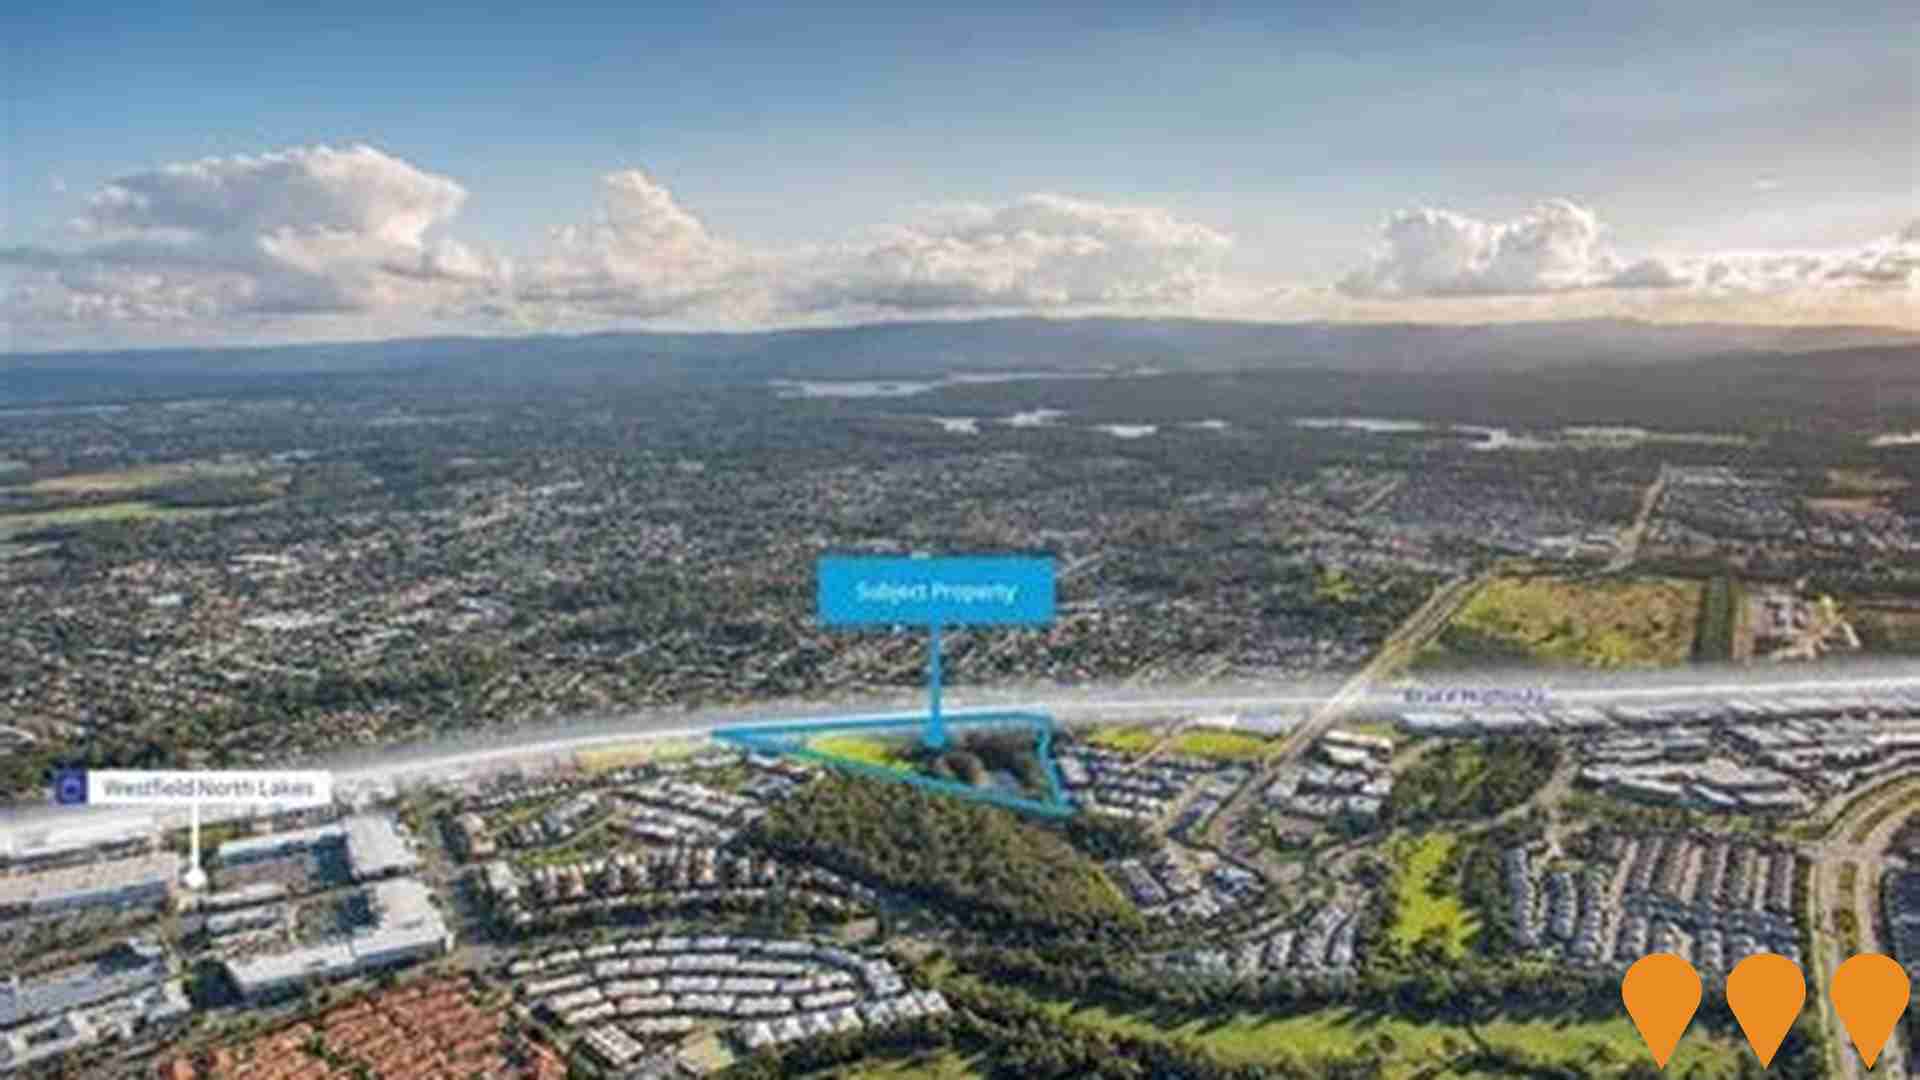
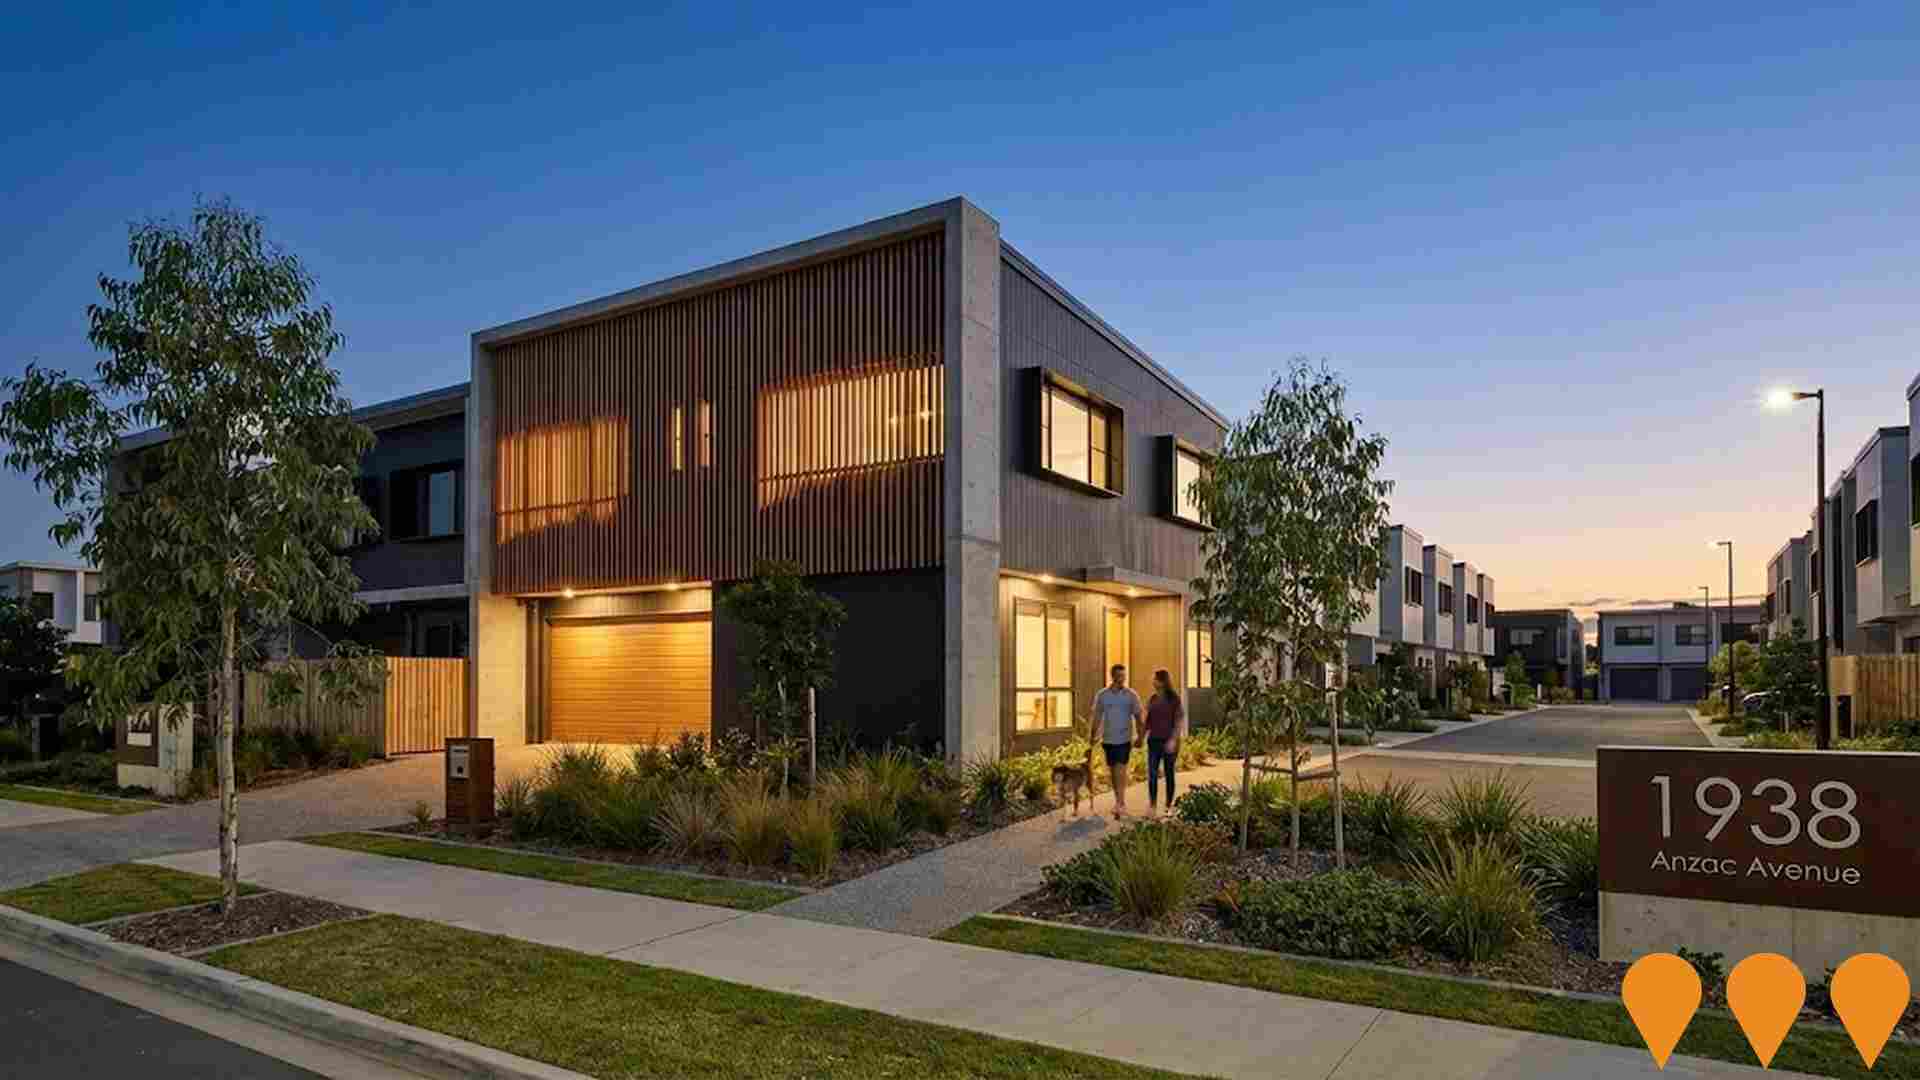
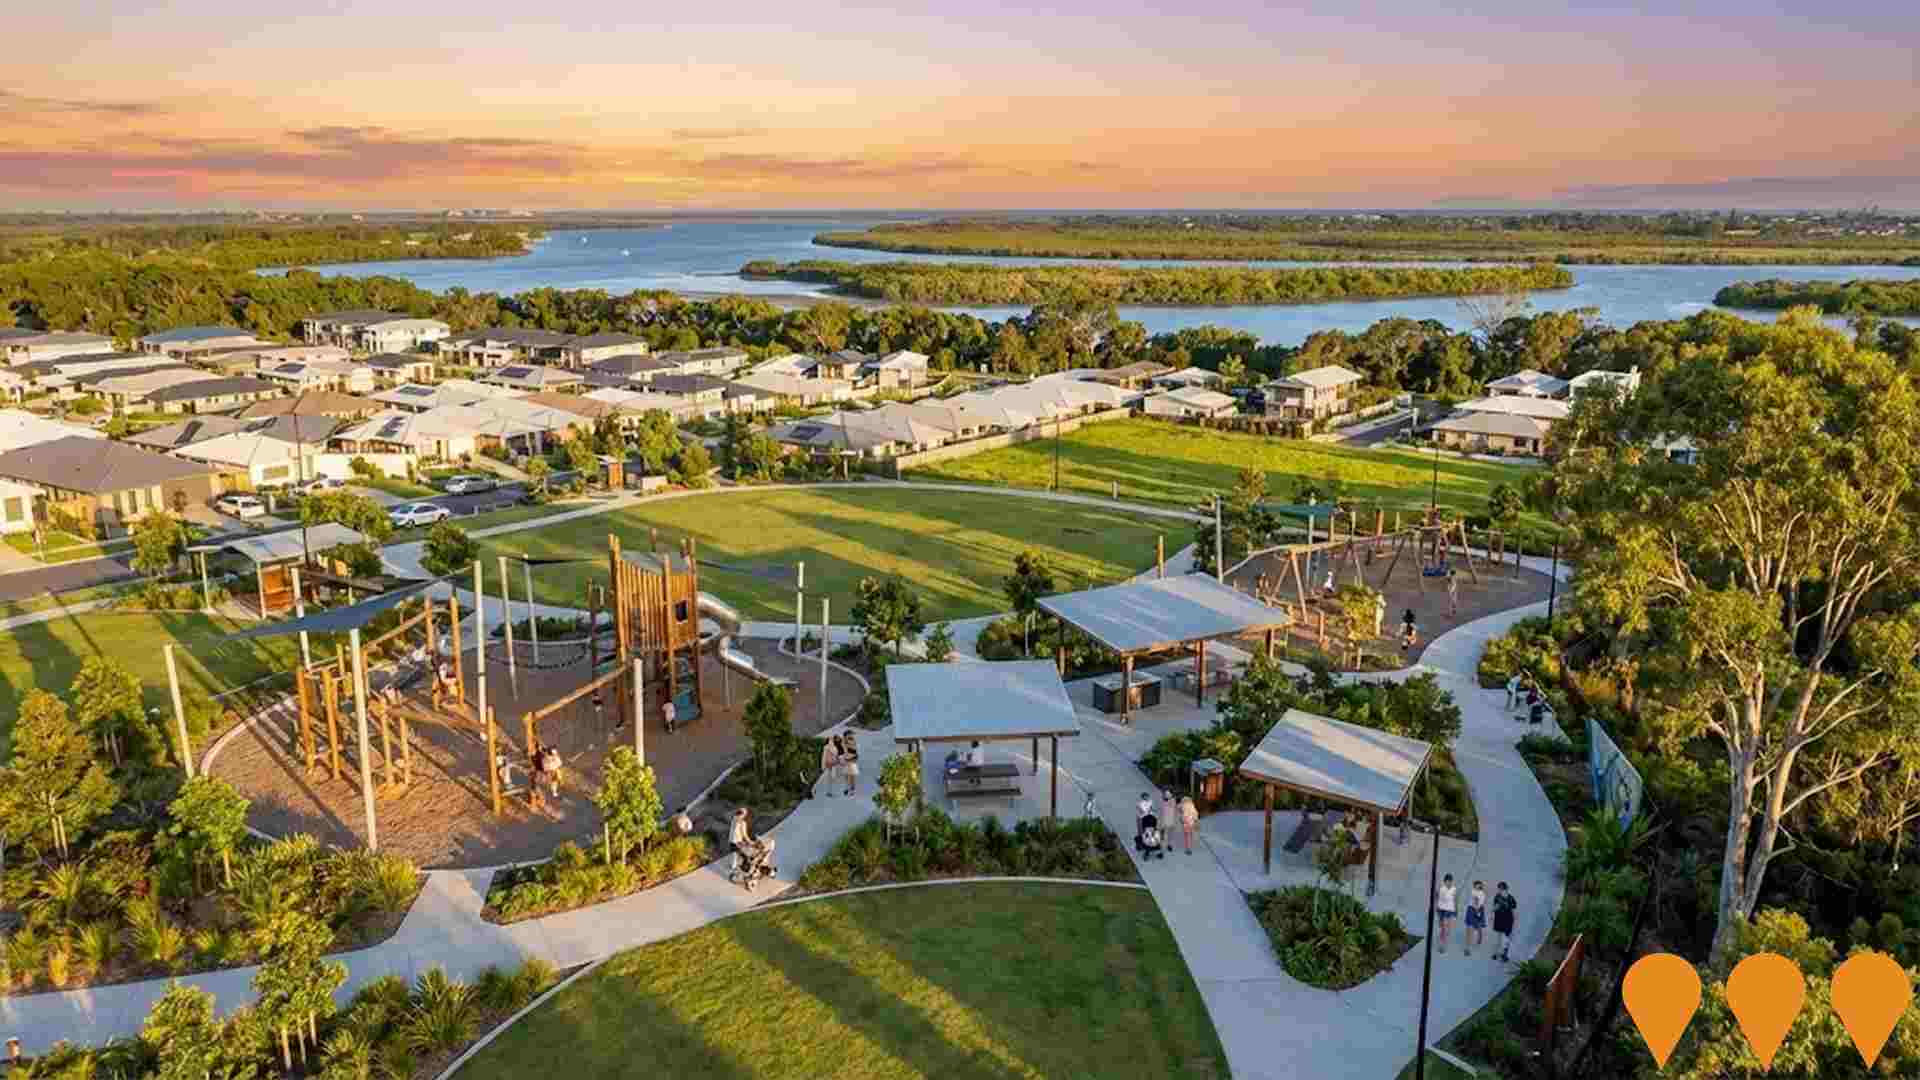
 Denotes AI-based impression for illustrative purposes only, not to be taken as definitive under any circumstances. Please follow links and conduct other investigations from the project's source for actual imagery. Developers and project owners wishing us to use original imagery please Contact Us and we will do so.
Frequently Asked Questions - Infrastructure
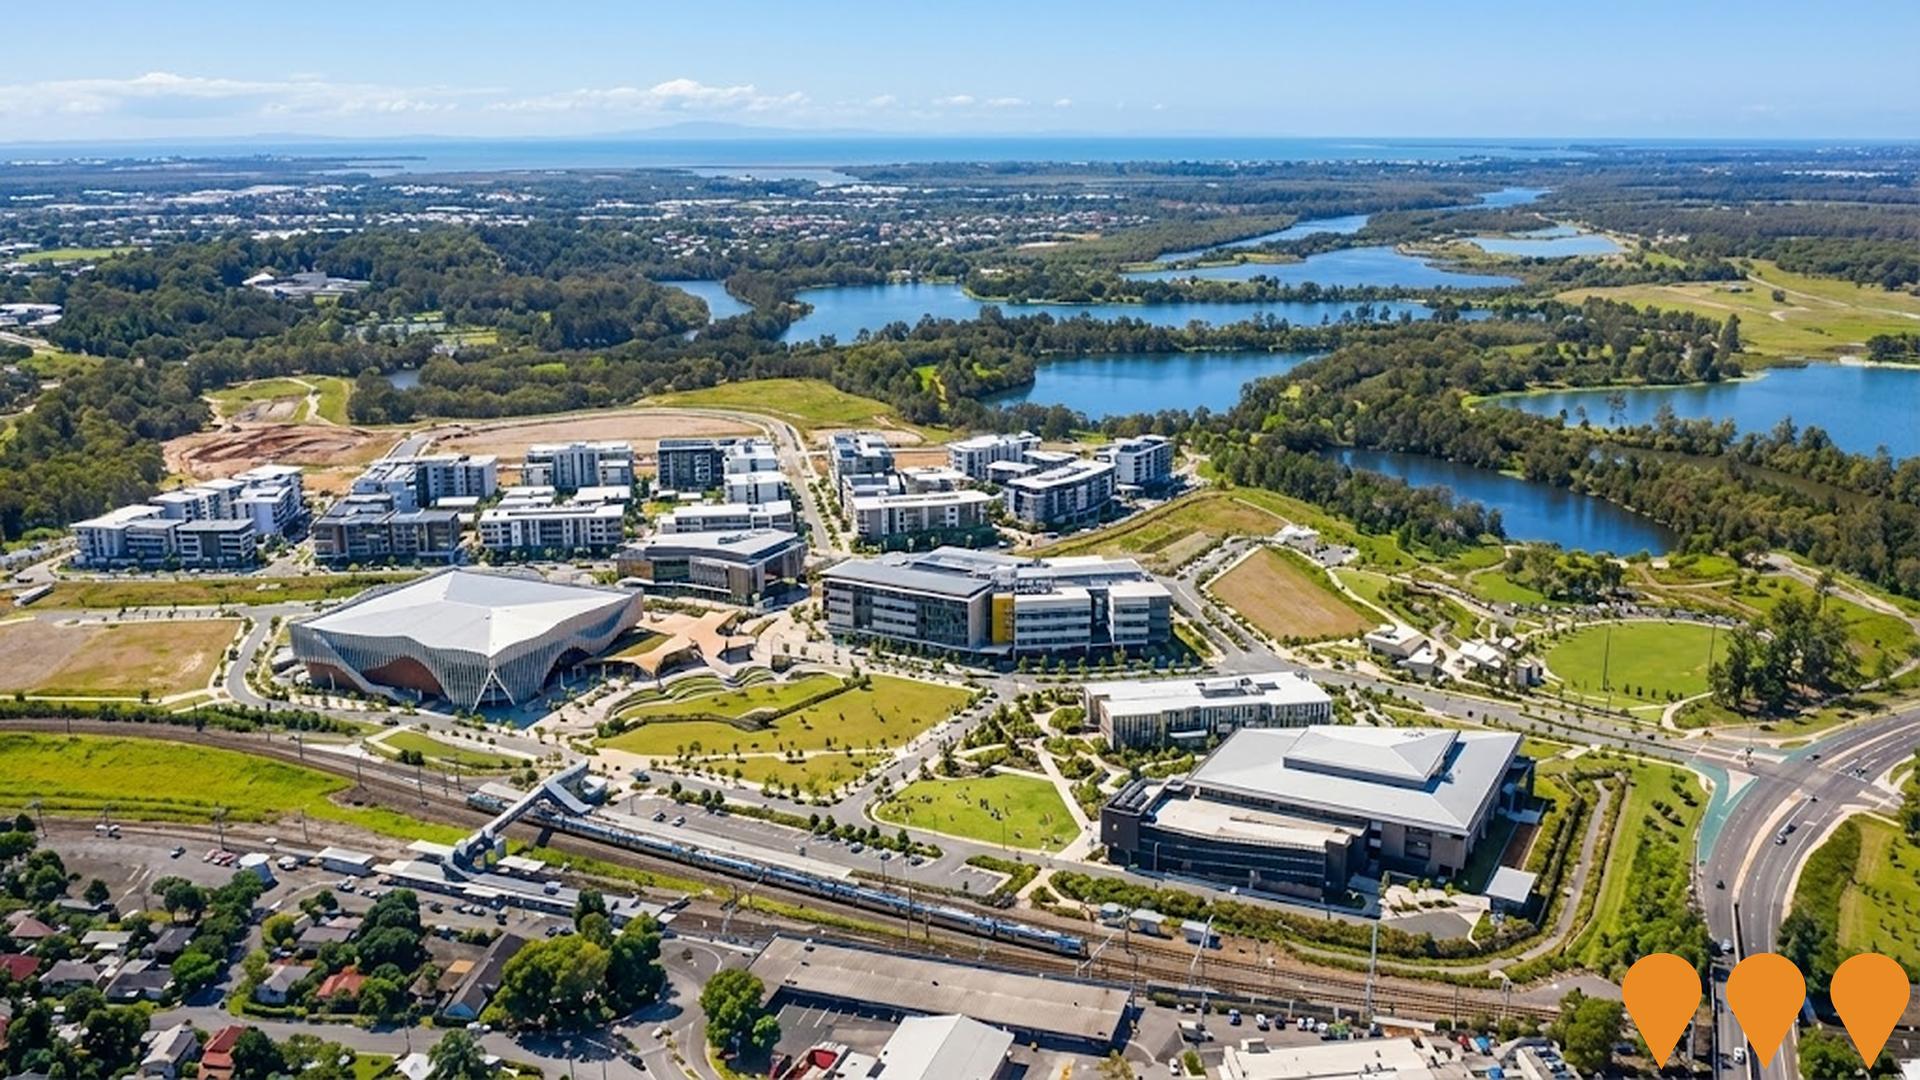
Moreton Bay Central
460-hectare Priority Development Area (formerly The Mill at Moreton Bay, renamed Moreton Bay Central on 30 July 2025) redeveloping the former Petrie paper mill site. Anchored by the University of the Sunshine Coast Moreton Bay campus (opened 2020, expanded 2024, 5,300+ students). Includes up to 3,400 dwellings, innovation and advanced manufacturing hubs, major private health precinct, transit-oriented development, retail/commercial spaces, and the $205.5m Moreton Bay Indoor Sports Centre (Brisbane 2032 Olympics boxing venue, 10,000 seats, 12 courts). Features 110 hectares of conserved koala habitat and green space. Expected to create 6,000 jobs and deliver ~$950-1,200 million in annual economic benefits upon maturity.
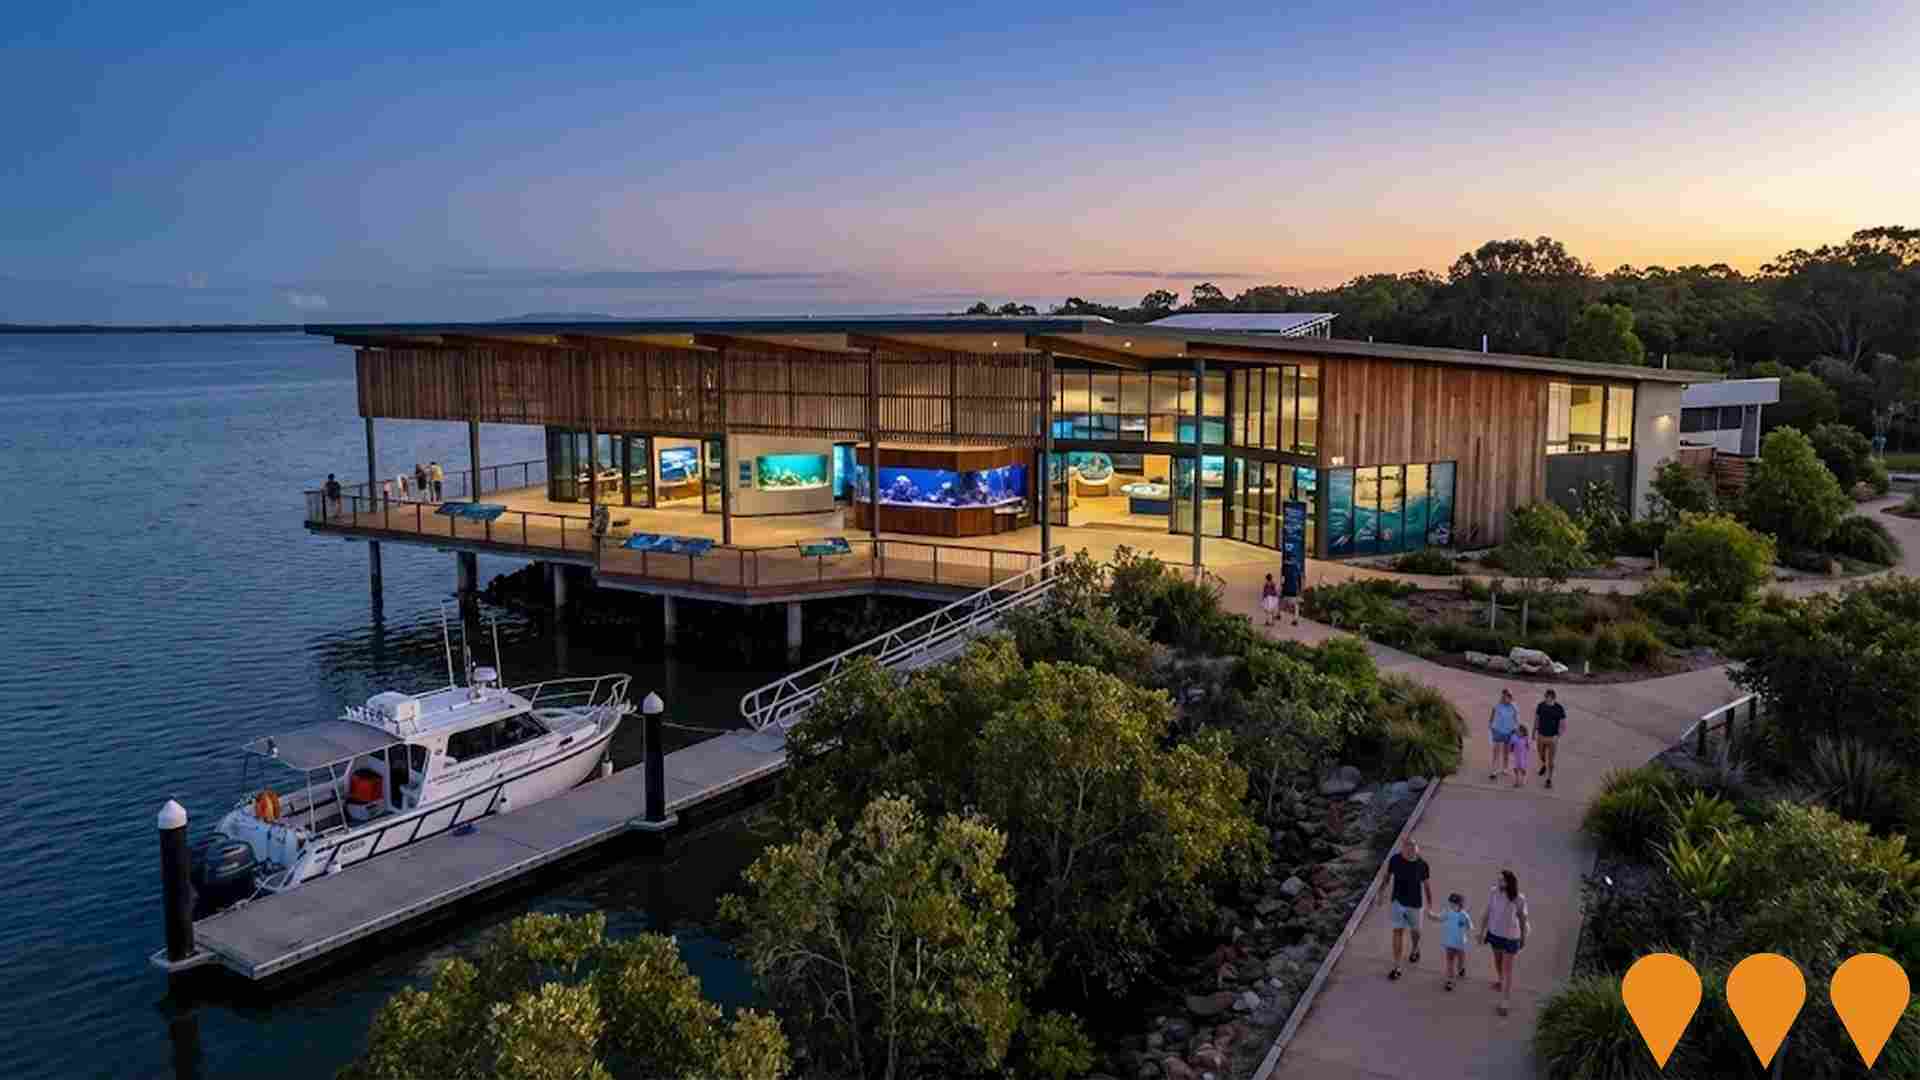
Moreton Bay Marine Education and Discovery Centre
New state-of-the-art marine education and discovery centre at the Osprey House Environmental Centre site in Griffin, featuring interactive exhibits, aquaria, research and education facilities, and eco-tourism experiences focused on Quandamooka (Moreton Bay) marine ecosystems and conservation.
UniSC Moreton Bay Campus
University campus at The Mill at Moreton Bay. Foundation building opened in March 2020. Stage 2 opened on 4 April 2024 with three new mass timber buildings adding about 12,500 sqm of facilities (labs, industry hub and event space, gym and sports hall, sports science, student spaces and parking), bringing total floorspace to about 28,500 sqm. Project value totals about $240m to date.

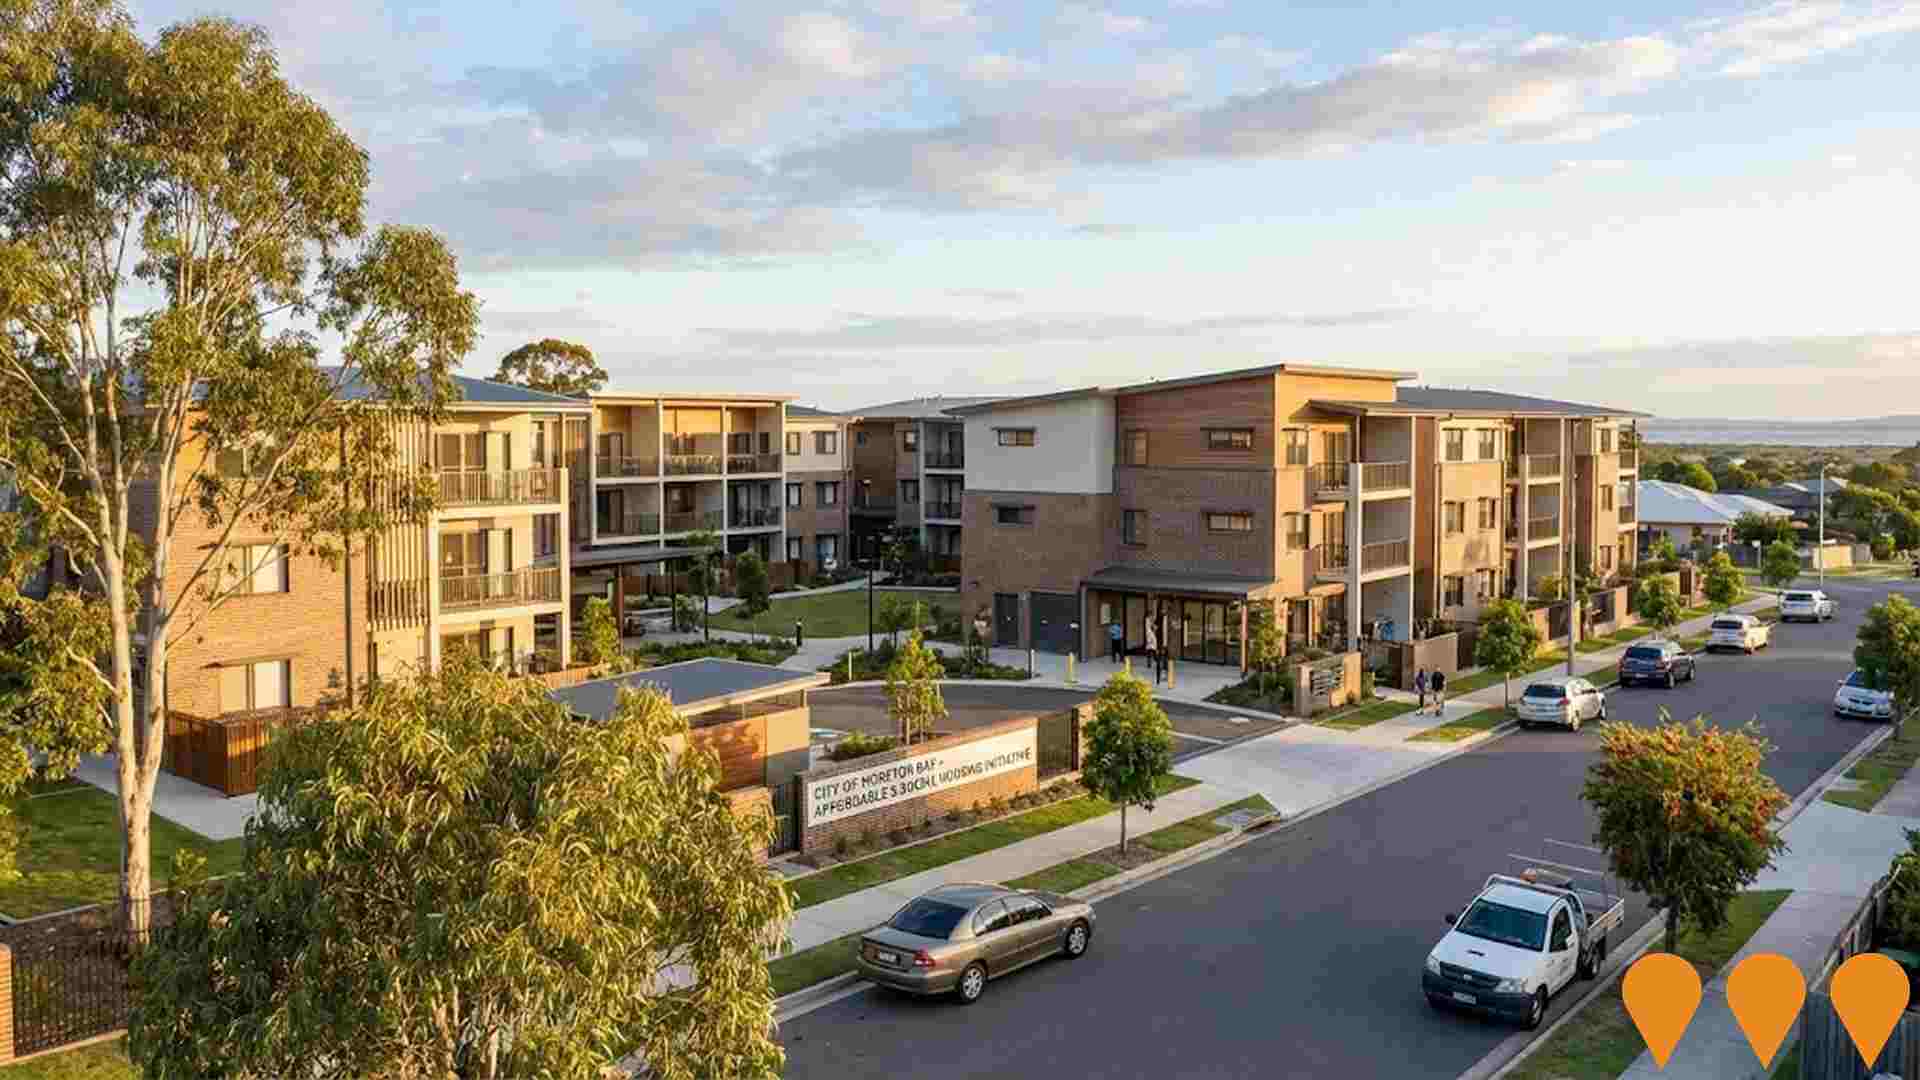
Attraction of Affordable Social Housing Development Policy (City of Moreton Bay)
Council policy to attract and accelerate delivery of affordable and social housing across the City of Moreton Bay by waiving or reducing infrastructure charges and development application fees for eligible projects in priority areas. The policy is implemented alongside the Housing and Homelessness Action Plan 2023-2028 and supported by Queensland Government social housing delivery in the region.
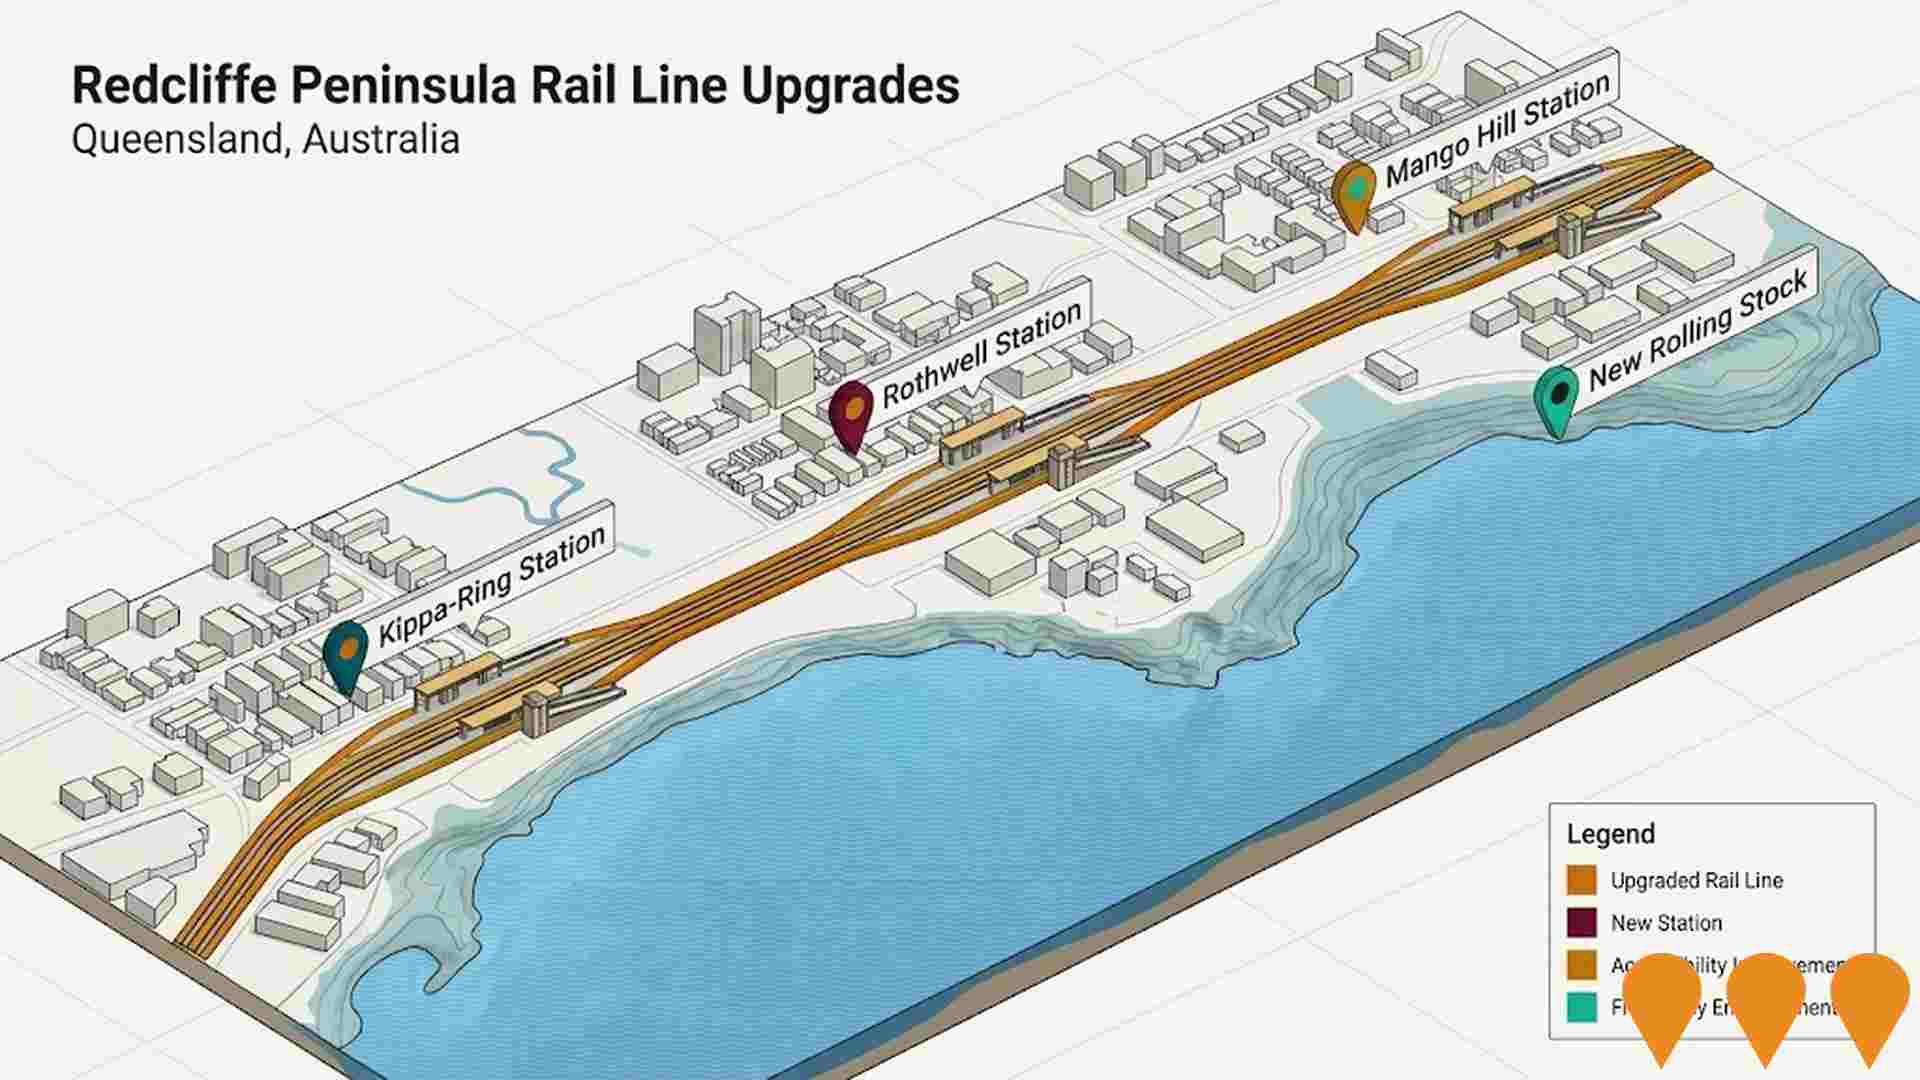
Redcliffe Peninsula Rail Line Upgrades
Major rail infrastructure upgrades along the Redcliffe Peninsula rail line including track improvements, station upgrades, new rolling stock, improved accessibility, and enhanced frequency services. Project aims to improve public transport connectivity for peninsula residents.
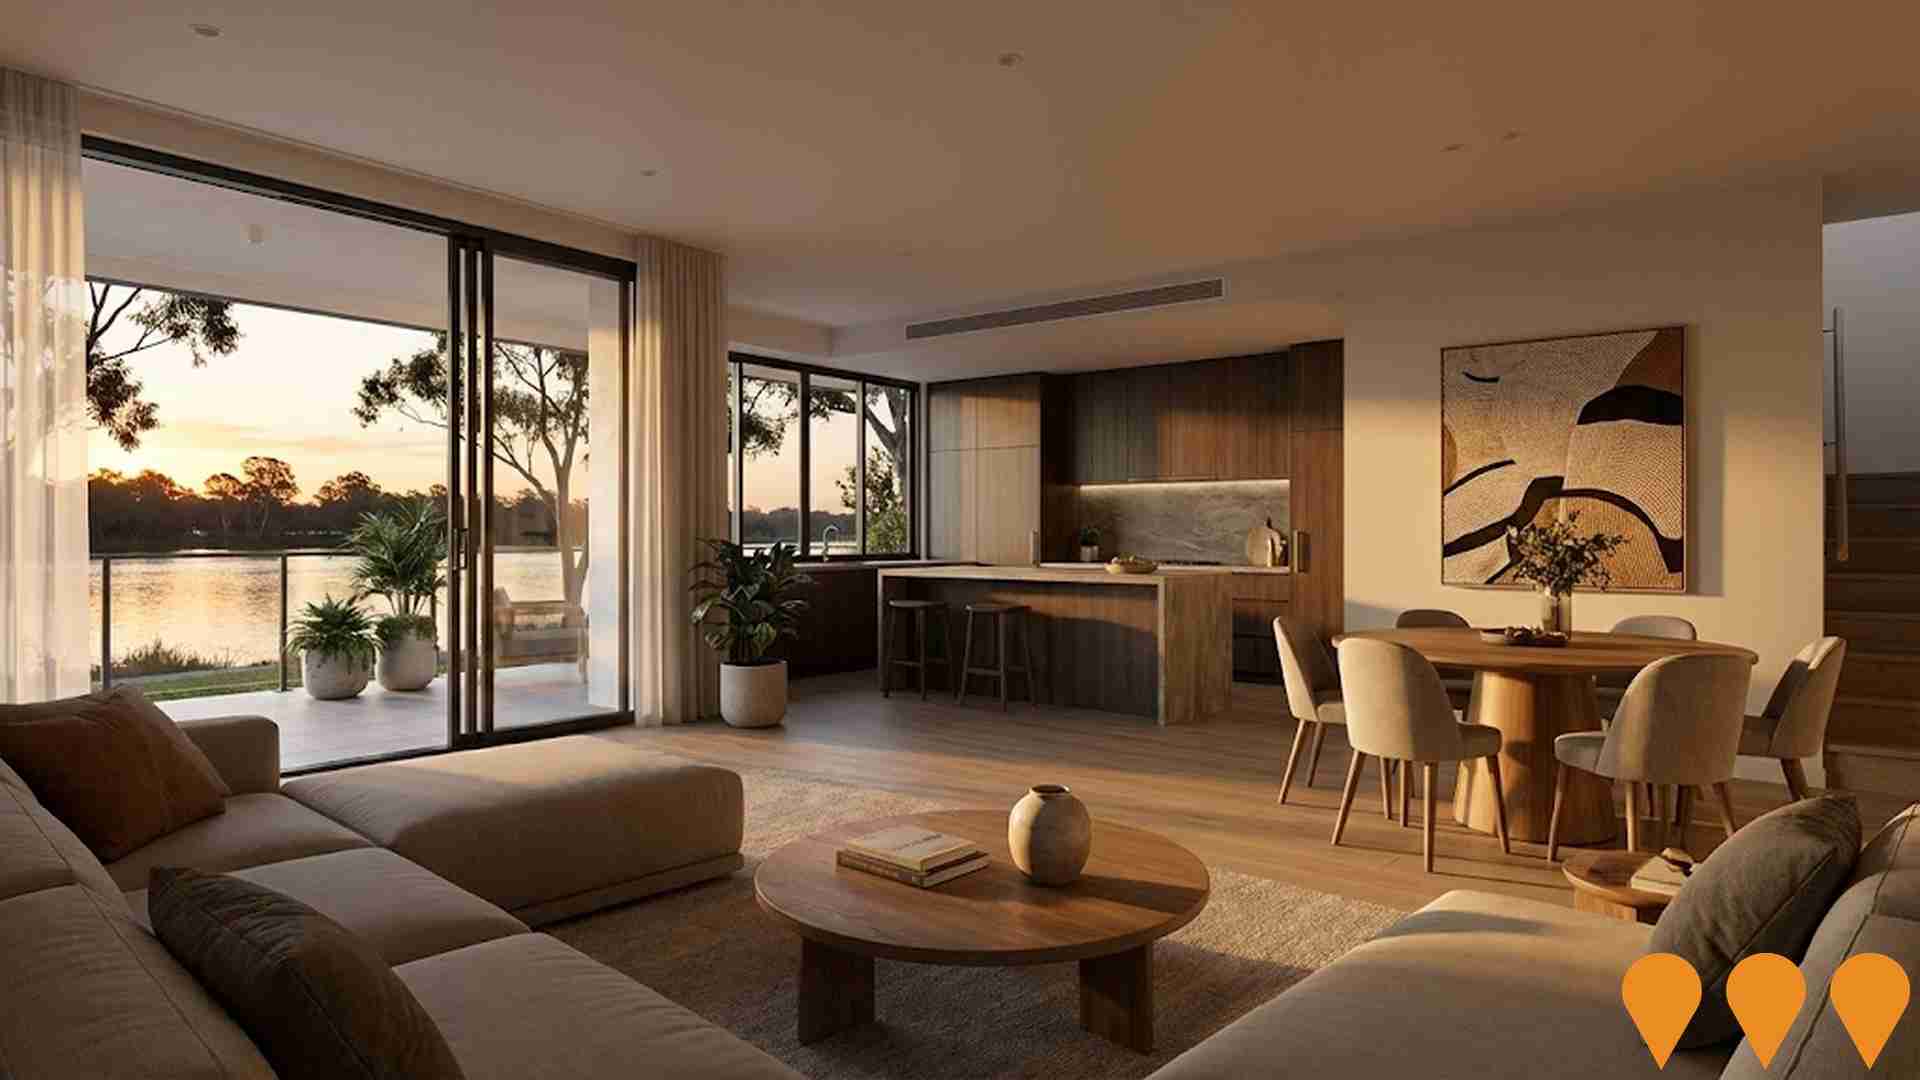
River Cove Residences
Boutique riverside estate delivering 81 terrace home and land packages along the North Pine River. Land is registered, civil works complete, and home construction is underway with final Stage 9 now selling and over 95% of lots reportedly sold. Partner developers are Thompson Sustainable Homes and Avon Estates.
Griffin Crest Estate
Masterplanned house-and-land estate in Griffin (near Brisbane), marketed by Oxmar Properties. The estate includes parks, play areas, and walking/cycle paths, with easy access to Dohles Rocks boat ramp and Moreton Bay. Active releases indicate ongoing construction and titling across multiple stages.
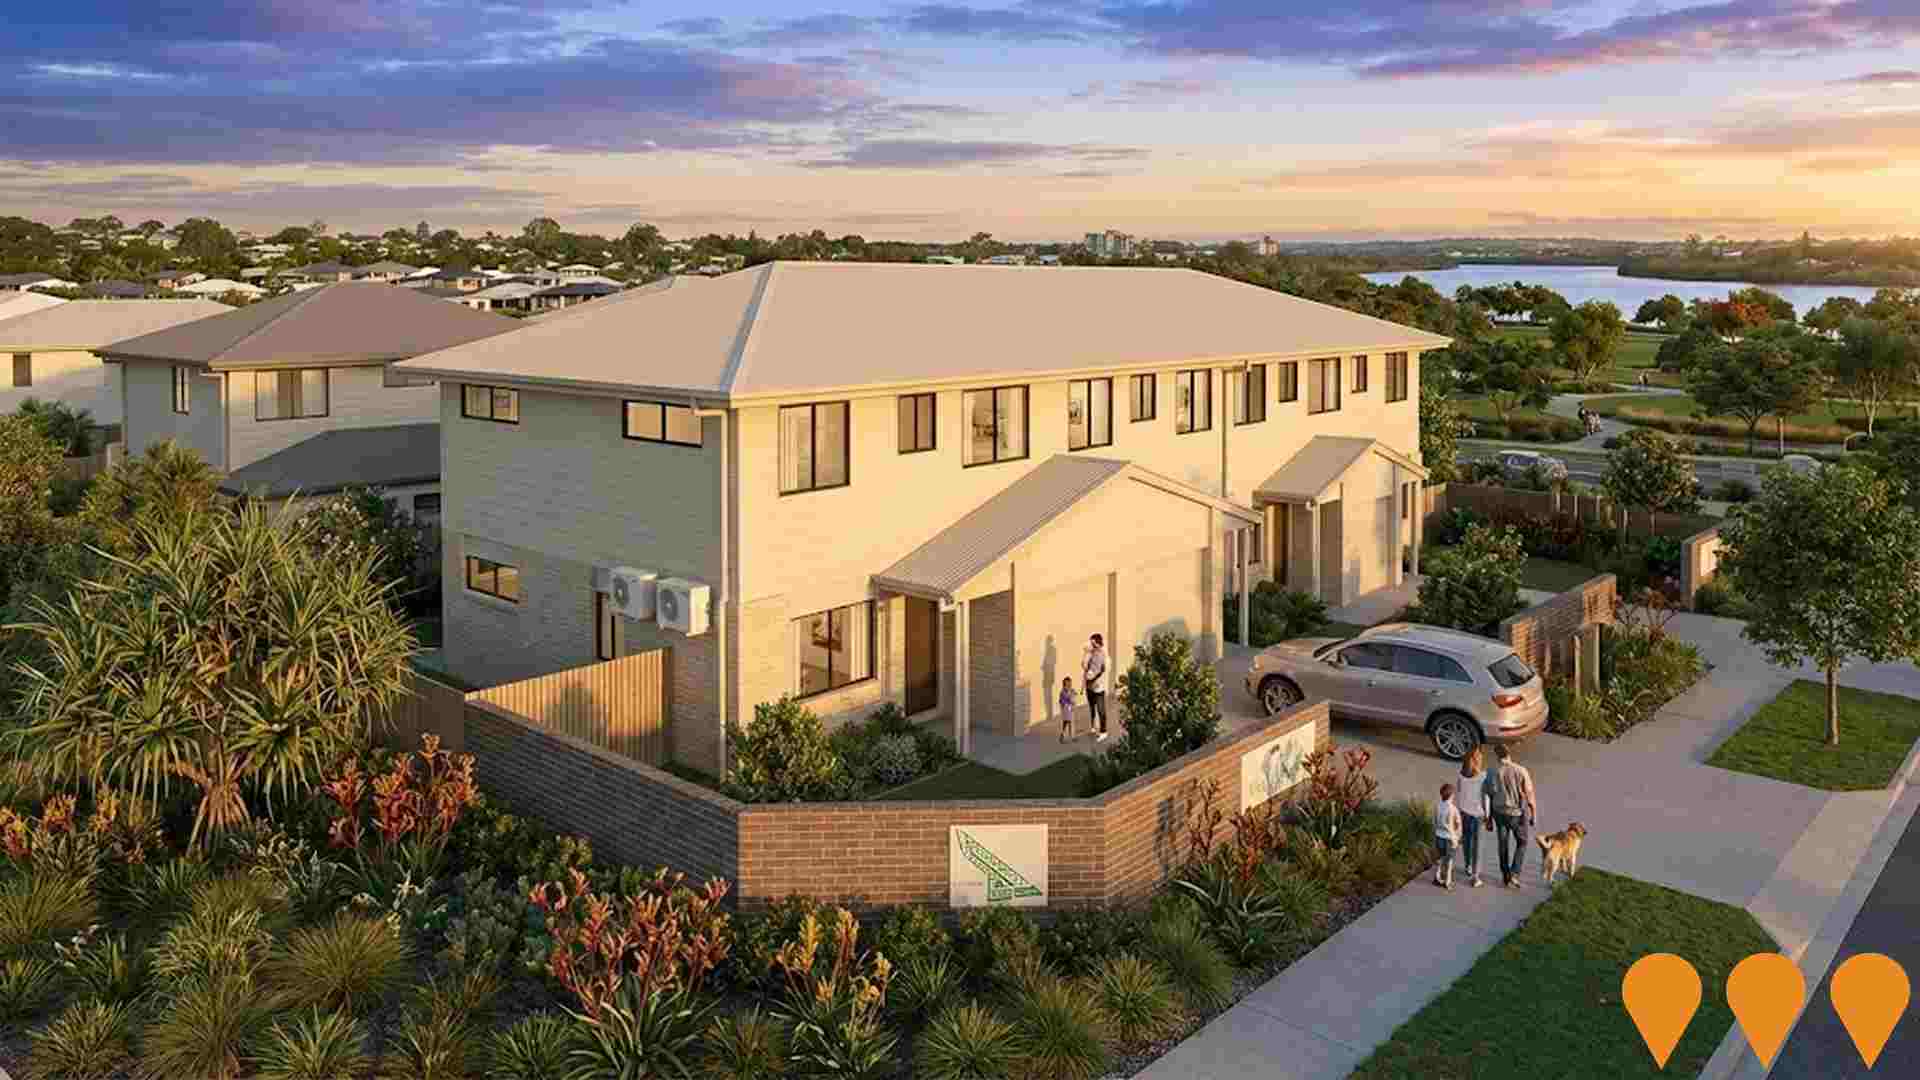
Griffin Pocket Estate
Residential estate development featuring modern homes with contemporary design, landscaped streetscapes, and community amenities. Part of Griffin's ongoing urban development providing affordable housing options for families and first home buyers in the fast-growing Moreton Bay region.
Employment
Employment performance in Murrumba Downs - Griffin exceeds national averages across key labour market indicators
Murrumba Downs - Griffin has a skilled workforce with essential services sectors well represented. Its unemployment rate is 4.2%.
Over the past year, there was an estimated employment growth of 4.7%. As of September 2025, 15,812 residents are employed while the unemployment rate is 0.2% higher than Greater Brisbane's rate of 4.0%. Workforce participation in Murrumba Downs - Griffin is 71.7%, compared to Greater Brisbane's 64.5%. Key industries of employment among residents include health care & social assistance, retail trade, and construction.
The area shows strong specialization in transport, postal & warehousing, with an employment share 1.5 times the regional level. However, professional & technical employs only 5.4% of local workers, below Greater Brisbane's 8.9%. Employment opportunities locally may be limited as indicated by Census data comparing working population to resident population. Between September 2024 and September 2025, employment levels increased by 4.7%, while labour force grew by 5.3%, causing the unemployment rate to rise by 0.6 percentage points in Murrumba Downs - Griffin. In contrast, Greater Brisbane saw employment rise by 3.8%, labour force grow by 3.3%, and unemployment fall by 0.5 percentage points during the same period. State-level data from Queensland as of 25-Nov shows employment contracted by 0.01% (losing 1,210 jobs), with the state unemployment rate at 4.2%, broadly in line with the national rate of 4.3%. National employment forecasts from Jobs and Skills Australia, published in May-25, project a 6.6% expansion over five years and 13.7% over ten years. Applying these projections to Murrumba Downs - Griffin's current employment mix suggests local employment should increase by 6.6% over five years and 13.7% over ten years.
Frequently Asked Questions - Employment
Income
Income analysis reveals strong economic positioning, with the area outperforming 60% of locations assessed nationally by AreaSearch
AreaSearch's aggregation of latest postcode level ATO data released for financial year 2022 shows Murrumba Downs - Griffin SA2 had a median taxpayer income of $59,225 and an average income of $66,137. These figures are slightly above the national averages of $55,645 and $70,520 respectively for Greater Brisbane. Based on Wage Price Index growth of 13.99% since financial year 2022, estimated current incomes as of September 2025 would be approximately $67,511 (median) and $75,390 (average). Census data indicates that household, family, and personal incomes in Murrumba Downs - Griffin cluster around the 66th percentile nationally. Income distribution shows that 41.3% of individuals (11,290 people) fall within the $1,500 - $2,999 earnings band, consistent with broader regional trends where 33.3% are in the same category. High housing costs consume 17.6% of income, but strong earnings place disposable income at the 59th percentile nationally. The area's SEIFA income ranking places it in the 5th decile.
Frequently Asked Questions - Income
Housing
Murrumba Downs - Griffin is characterized by a predominantly suburban housing profile, with ownership patterns similar to the broader region
Dwelling structure in Murrumba Downs - Griffin, as per the latest Census, consisted of 72.9% houses and 27.1% other dwellings (semi-detached, apartments, 'other' dwellings). Brisbane metro had 75.0% houses and 25.0% other dwellings. Home ownership in Murrumba Downs - Griffin was at 16.5%, similar to Brisbane metro's level. Mortgaged dwellings were 41.7% and rented ones were 41.8%. The median monthly mortgage repayment in the area was $1,901, higher than Brisbane metro's average of $1,820. Median weekly rent was $380, matching Brisbane metro's figure. Nationally, Murrumba Downs - Griffin's mortgage repayments were higher at $1,901 compared to Australia's average of $1,863, while rents were also higher at $380 against the national figure of $375.
Frequently Asked Questions - Housing
Household Composition
Murrumba Downs - Griffin features high concentrations of family households, with a fairly typical median household size
Family households constitute 79.7% of all households, including 38.7% couples with children, 26.2% couples without children, and 14.0% single parent families. Non-family households account for the remaining 20.3%, with lone person households at 17.6% and group households comprising 2.8% of the total. The median household size is 2.8 people, matching the Greater Brisbane average.
Frequently Asked Questions - Households
Local Schools & Education
The educational profile of Murrumba Downs - Griffin exceeds national averages, with above-average qualification levels and academic performance metrics
Educational qualifications in Murrumba Downs show that 22.8% of residents aged 15 and above have university degrees, compared to Greater Brisbane's 30.5%. Bachelor degrees are the most common at 16.4%, followed by postgraduate qualifications at 4.1% and graduate diplomas at 2.3%. Vocational credentials are also prevalent, with 42.0% of residents holding them - advanced diplomas at 13.6% and certificates at 28.4%. Educational participation is high, with 31.2% of residents currently enrolled in formal education.
This includes 11.8% in primary education, 7.9% in secondary education, and 4.5% pursuing tertiary education.
Frequently Asked Questions - Education
Schools Detail
Nearby Services & Amenities
Transport
Transport servicing is low compared to other areas nationally based on assessment of service frequency, route connectivity and accessibility
Public transport analysis shows 40 active transport stops operating within Murrumba Downs - Griffin. These comprise a mix of train and bus services. They are serviced by 29 individual routes, collectively providing 2111 weekly passenger trips.
Transport accessibility is rated as good, with residents typically located 341 meters from the nearest transport stop. Service frequency averages 301 trips per day across all routes, equating to approximately 52 weekly trips per individual stop.
Frequently Asked Questions - Transport
Transport Stops Detail
Health
The level of general health in Murrumba Downs - Griffin is notably higher than the national average with prevalence of common health conditions low among the general population though higher than the nation's average across older, at risk cohorts
Murrumba Downs demonstrates above-average health outcomes with a low prevalence of common health conditions among its general population compared to national averages.
However, the prevalence is higher among older, at-risk cohorts. The area has approximately 14,325 people, with around 52% having private health cover, slightly higher than the average SA2 area. Mental health issues and asthma are the most common medical conditions in the area, affecting 9.1 and 8.2% of residents respectively. About 71.7% of residents declare themselves completely clear of medical ailments, compared to 69.9% across Greater Brisbane. The area has 10.6% of residents aged 65 and over, totaling 2,903 people. Health outcomes among seniors present some challenges that require more attention than the broader population.
Frequently Asked Questions - Health
Cultural Diversity
The level of cultural diversity witnessed in Murrumba Downs - Griffin was found to be slightly above average when compared nationally for a number of language and cultural background related metrics
Murrumba Downs - Griffin had a higher cultural diversity than most local markets, with 17.6% of its population speaking a language other than English at home and 27.5% born overseas. Christianity was the predominant religion in Murrumba Downs - Griffin, making up 45.9% of the population there. Notably, the 'Other' religious category comprised 4.6%, higher than the regional average of 2.7%.
The top three ancestry groups were English (27.3%), Australian (25.2%), and Other (10.3%). There were notable differences in the representation of certain ethnic groups: New Zealand was overrepresented at 1.4% compared to the regional average of 1.5%, Maori at 1.8% versus 1.7%, and Samoan at 1.2% versus 1.3%.
Frequently Asked Questions - Diversity
Age
Murrumba Downs - Griffin hosts a very young demographic, ranking in the bottom 10% of areas nationwide
Murrumba Downs - Griffin has a median age of 32 years, which is lower than the Greater Brisbane average of 36 and significantly below the Australian median of 38. Compared to Greater Brisbane, Murrumba Downs - Griffin has a higher proportion of residents aged 35-44 (17.7%) but fewer residents aged 65-74 (5.5%). Between 2021 and present, the proportion of residents aged 35-44 increased from 15.8% to 17.7%, while the proportion of those aged 25-34 decreased from 18.4% to 16.5%. By 2041, demographic modeling suggests that Murrumba Downs - Griffin's age profile will change significantly, with the 45-54 age cohort projected to grow by 72%, expanding from 3,083 people in 2021 to 5,299 people.
