Chart Color Schemes
This analysis uses ABS Statistical Areas Level 2 (SA2) boundaries, which can materially differ from Suburbs and Localities (SAL) even when sharing similar names.
SA2 boundaries are defined by the Australian Bureau of Statistics and are designed to represent communities for statistical reporting (e.g., census and ERP).
Suburbs and Localities (SAL) represent commonly-used suburb/locality names (postal-style areas) and may use different geographic boundaries. For comprehensive analysis, consider reviewing both boundary types if available.
est. as @ -- *
ABS ERP | -- people | --
2021 Census | -- people





Sales Activity


Curious about local property values? Filter the chart to assess the volume and appreciation (including resales) trends and regional comparisons, or scroll to the map below view this information at an individual property level.

Find a Recent Sale

Sales Detail
Population
East Arm lies within the top 10% of areas nationally in terms of population growth performance according to AreaSearch analysis of short and medium-term trends
Based on AreaSearch's analysis, East Arm's population is around 21 as of Nov 25. This reflects an increase of 0 people (0.0%) since the 2021 Census, which reported a population of 21 people. The change is inferred from the estimated resident population of 23 from the ABS as of June 2024 and an additional 1 validated new addresses since the Census date. This level of population equates to a density ratio of 0.80 persons per square kilometer, a level providing ample space per person. Over the past decade, East Arm has demonstrated resilient growth patterns with a 8.7% compound annual growth rate, outpacing the SA3 area. Population growth for the area was primarily driven by balanced factors across natural increase and migration patterns.
AreaSearch is adopting ABS/Geoscience Australia projections for each SA2 area, as released in 2024 with 2022 as the base year. For any SA2 areas not covered by this data, and to estimate growth across all areas in the years post-2032, AreaSearch is applying growth rates by age cohort to each area, as provided by the ABS in its latest Greater Capital Region projections (released in 2023, based on 2022 data). As we examine future population trends, a significant population increase in the top quartile of statistical areas across the nation is forecast, with the area expected to grow by 6 persons to 2041 based on the latest population numbers, recording a gain of 38.1% in total over the 17 years.
Frequently Asked Questions - Population
Development
The level of residential development activity in East Arm is very low in comparison to the average area assessed nationally by AreaSearch
Development activity data is being compiled for this area.
East Arm naturally has much lower development activity compared to Greater Darwin. The development pattern is also well below national averages.
Frequently Asked Questions - Development
Infrastructure
East Arm has limited levels of nearby infrastructure activity, ranking in the 5thth percentile nationally
Nothing can influence an area's performance as much as changes to local infrastructure, major projects and planning initiatives. In total 14 projects have been identified by AreaSearch that are likely to have an impact on the area. Key projects include Darwin Ship Lift Facility & Port Expansion, Marine Industry Park, Roystonea Avenue Duplication, and Mitchell Creek Green, with the below list detailing those likely to be of most relevance.
East Arm has limited levels of nearby infrastructure activity, ranking in the 5thth percentile nationally
Professional plan users can use the search below to filter and access additional projects.
INFRASTRUCTURE SEARCH
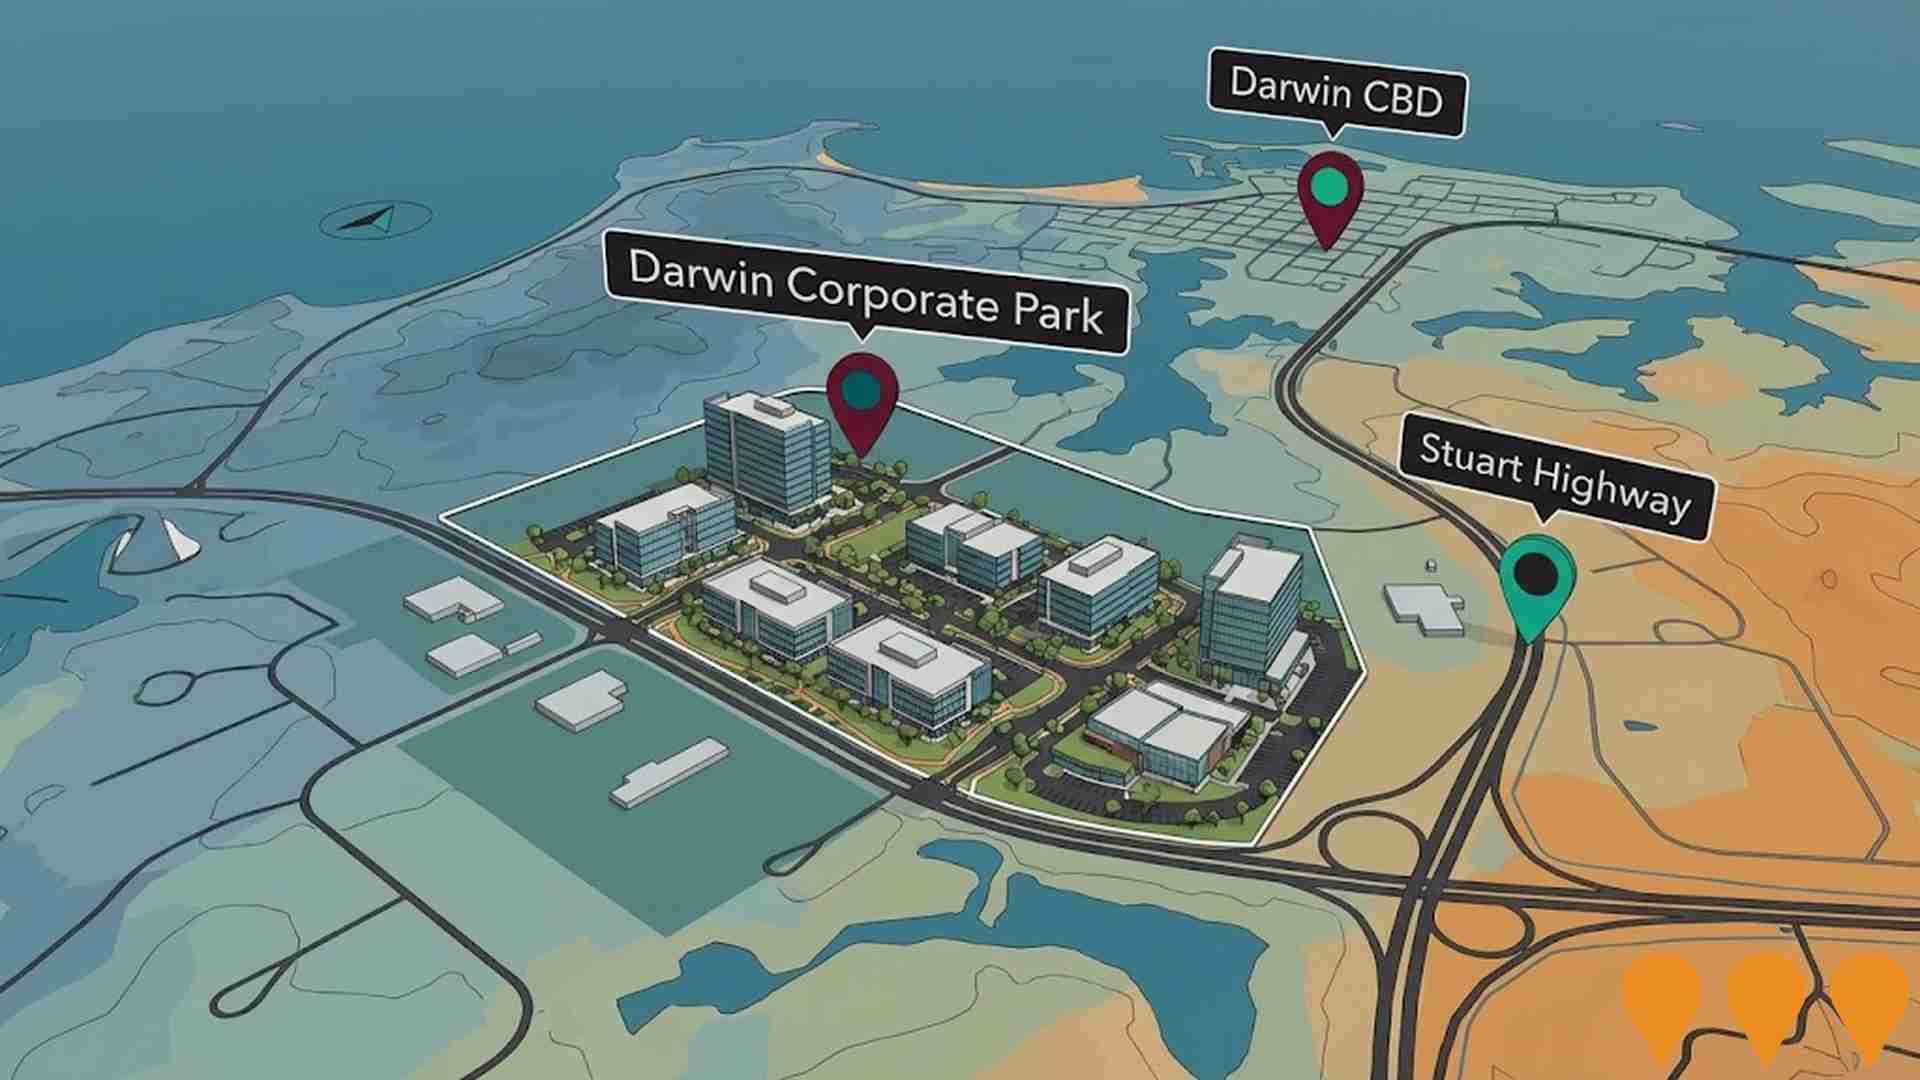
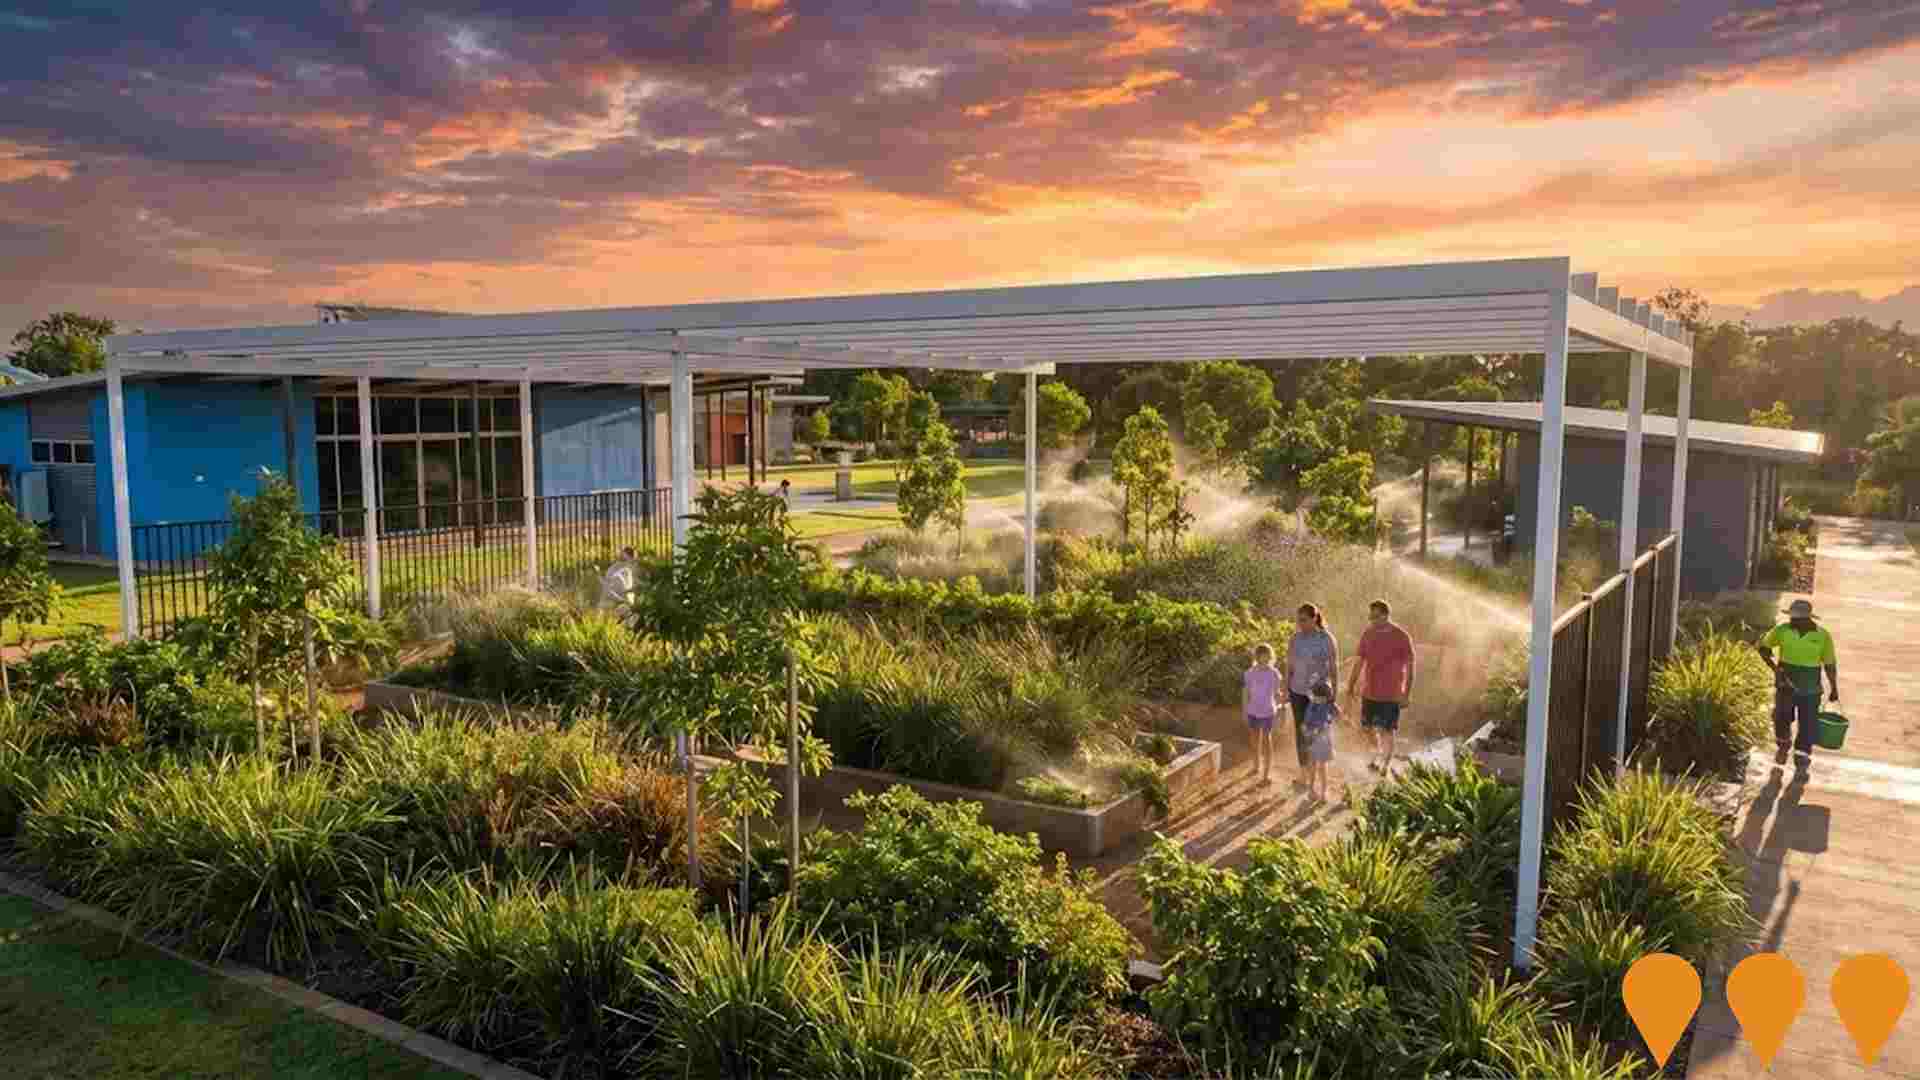
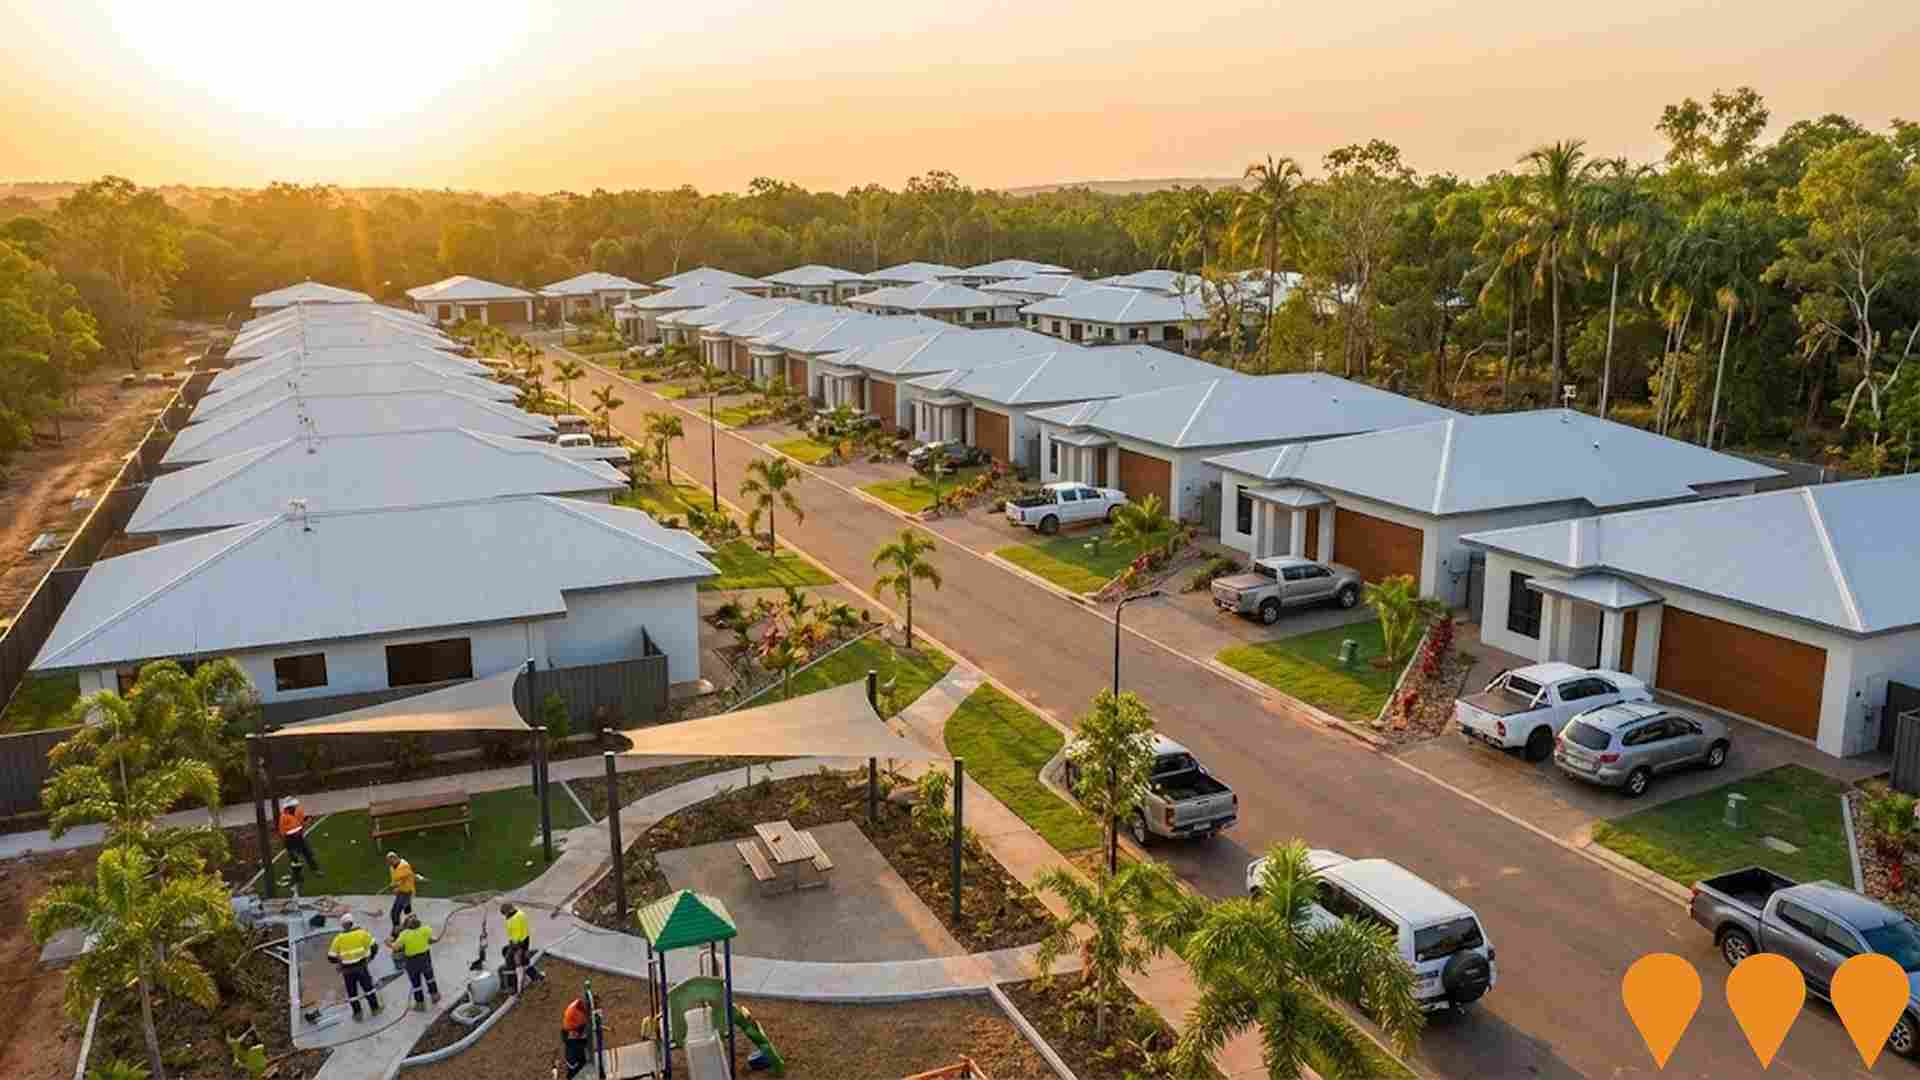
 Denotes AI-based impression for illustrative purposes only, not to be taken as definitive under any circumstances. Please follow links and conduct other investigations from the project's source for actual imagery. Developers and project owners wishing us to use original imagery please Contact Us and we will do so.
Frequently Asked Questions - Infrastructure
Middle Arm Sustainable Development Precinct
1,500-hectare sustainable industrial precinct in Darwin Harbour focused on low-carbon industries including renewable hydrogen, carbon capture and storage, critical minerals processing, green metal manufacturing and advanced manufacturing. Joint initiative between the Australian and Northern Territory Governments. Expected to support up to 20,000 jobs during construction and operation.

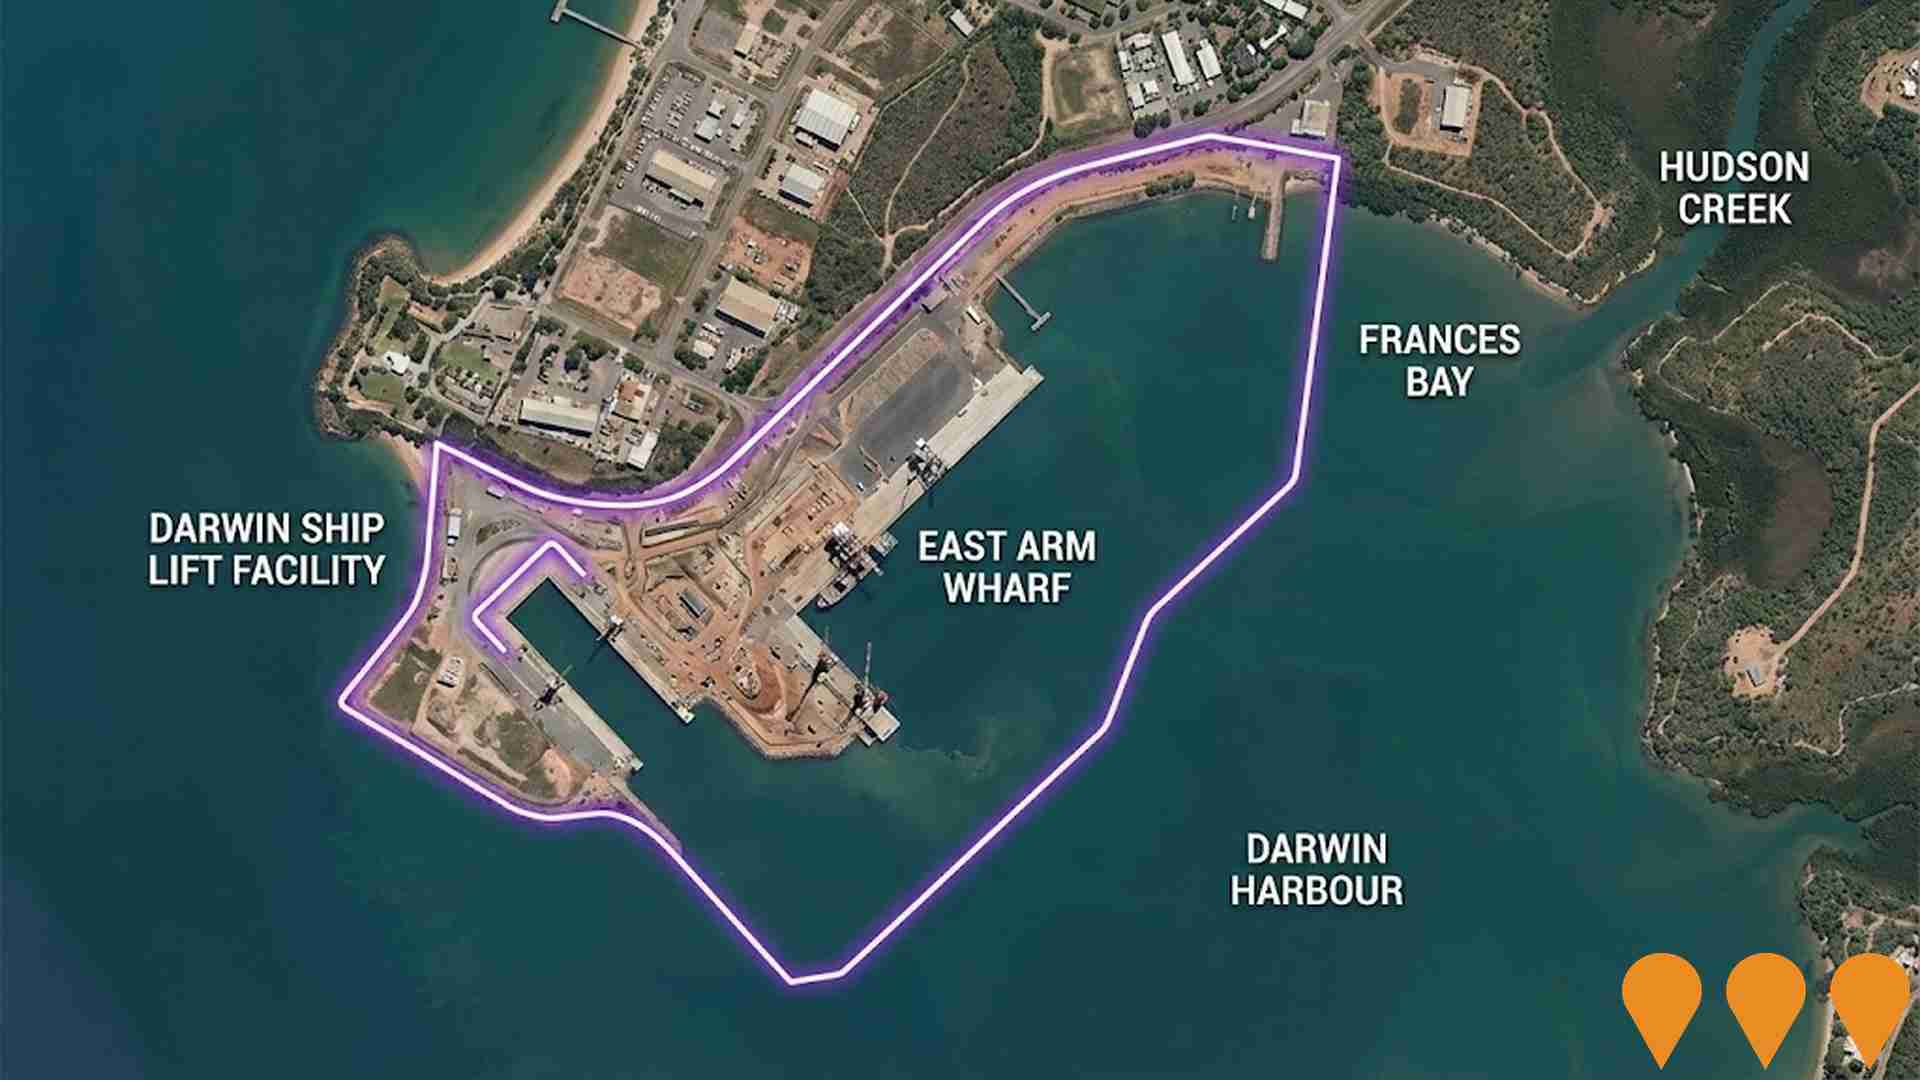
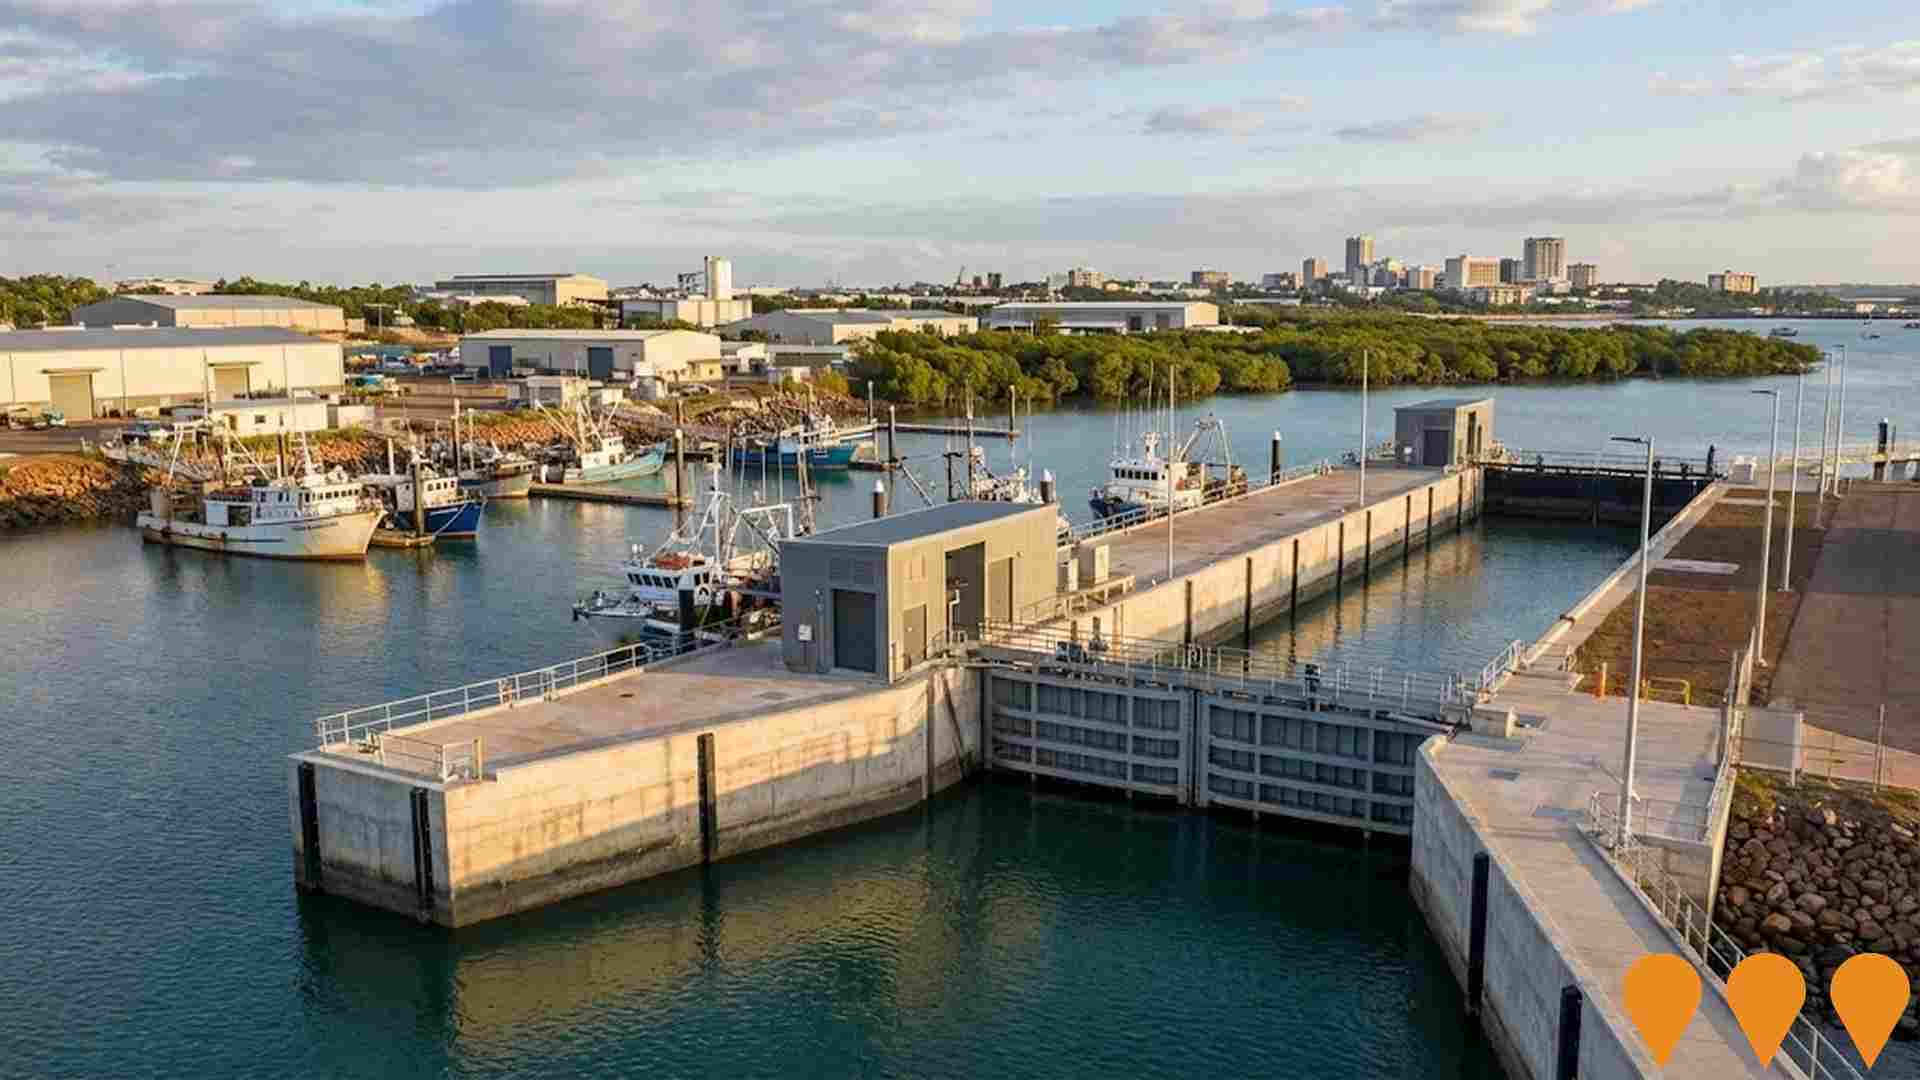
Darwin Ship Lift Facility & Port Expansion
Major infrastructure expansion featuring the $820 million Darwin Ship Lift Facility currently under construction, designed to lift vessels up to 5,500 tonnes. The project aligns with the Darwin Port 2050 Master Plan, which includes future development of a new container terminal, deepwater berths, and a Marine Industry Park to support defence, energy, and logistics sectors.
Darwin Light Rail Stage 1
A proposed mass transit system, likely light rail or rapid bus, connecting Darwin CBD to Palmerston via the Stuart Highway corridor. The project aims to manage future population growth, reduce congestion, and improve connectivity between the two major population centres as part of the long-term Darwin Regional Transport Plan. While currently in the strategic planning phase with no immediate construction funding, the corridor has been identified for future preservation to support a '30-minute city' concept.

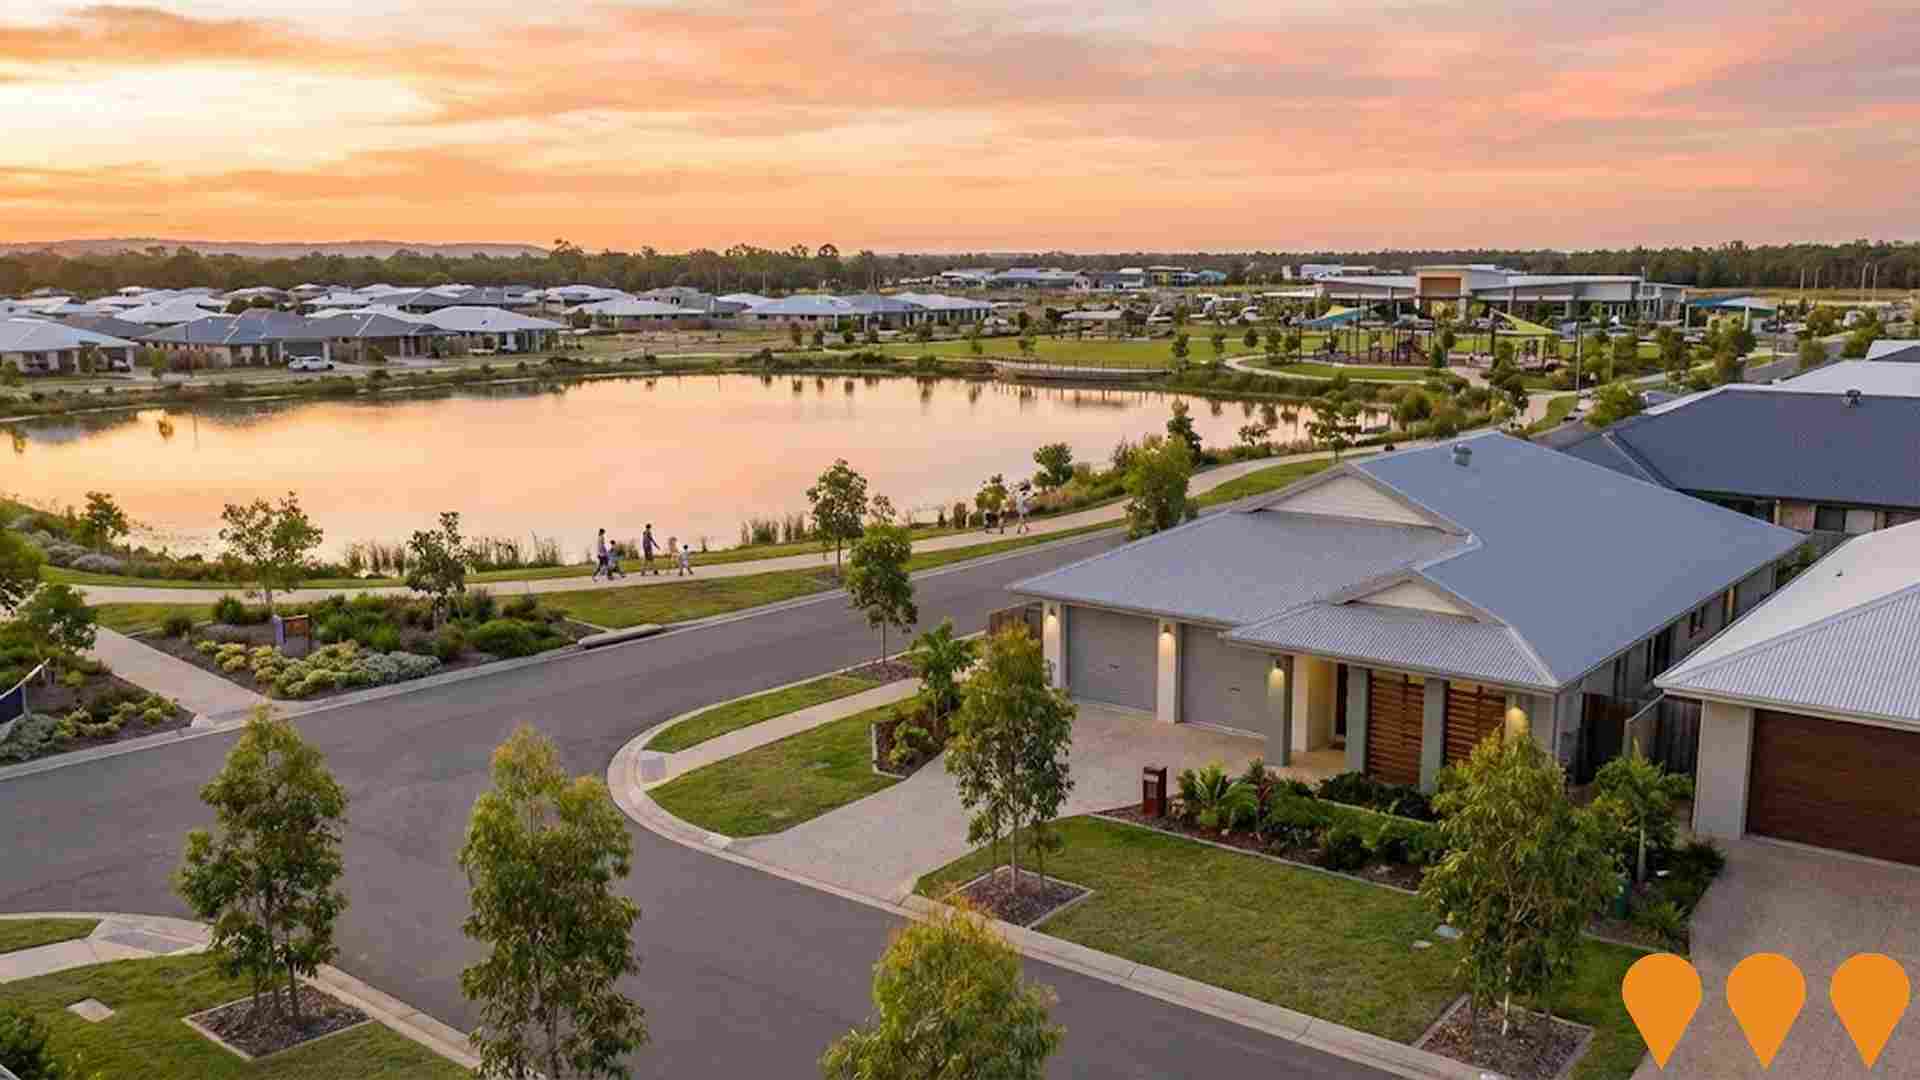
Zuccoli Aspire
A 12-stage residential land development featuring over 1,500 homes for approximately 5,000 residents. Includes lakes, parks, schools, childcare centres, and a planned town centre with a supermarket. Features the Lotuslily lakeside release in Stage 4A with 66 lots, integrating natural surroundings and community amenities.
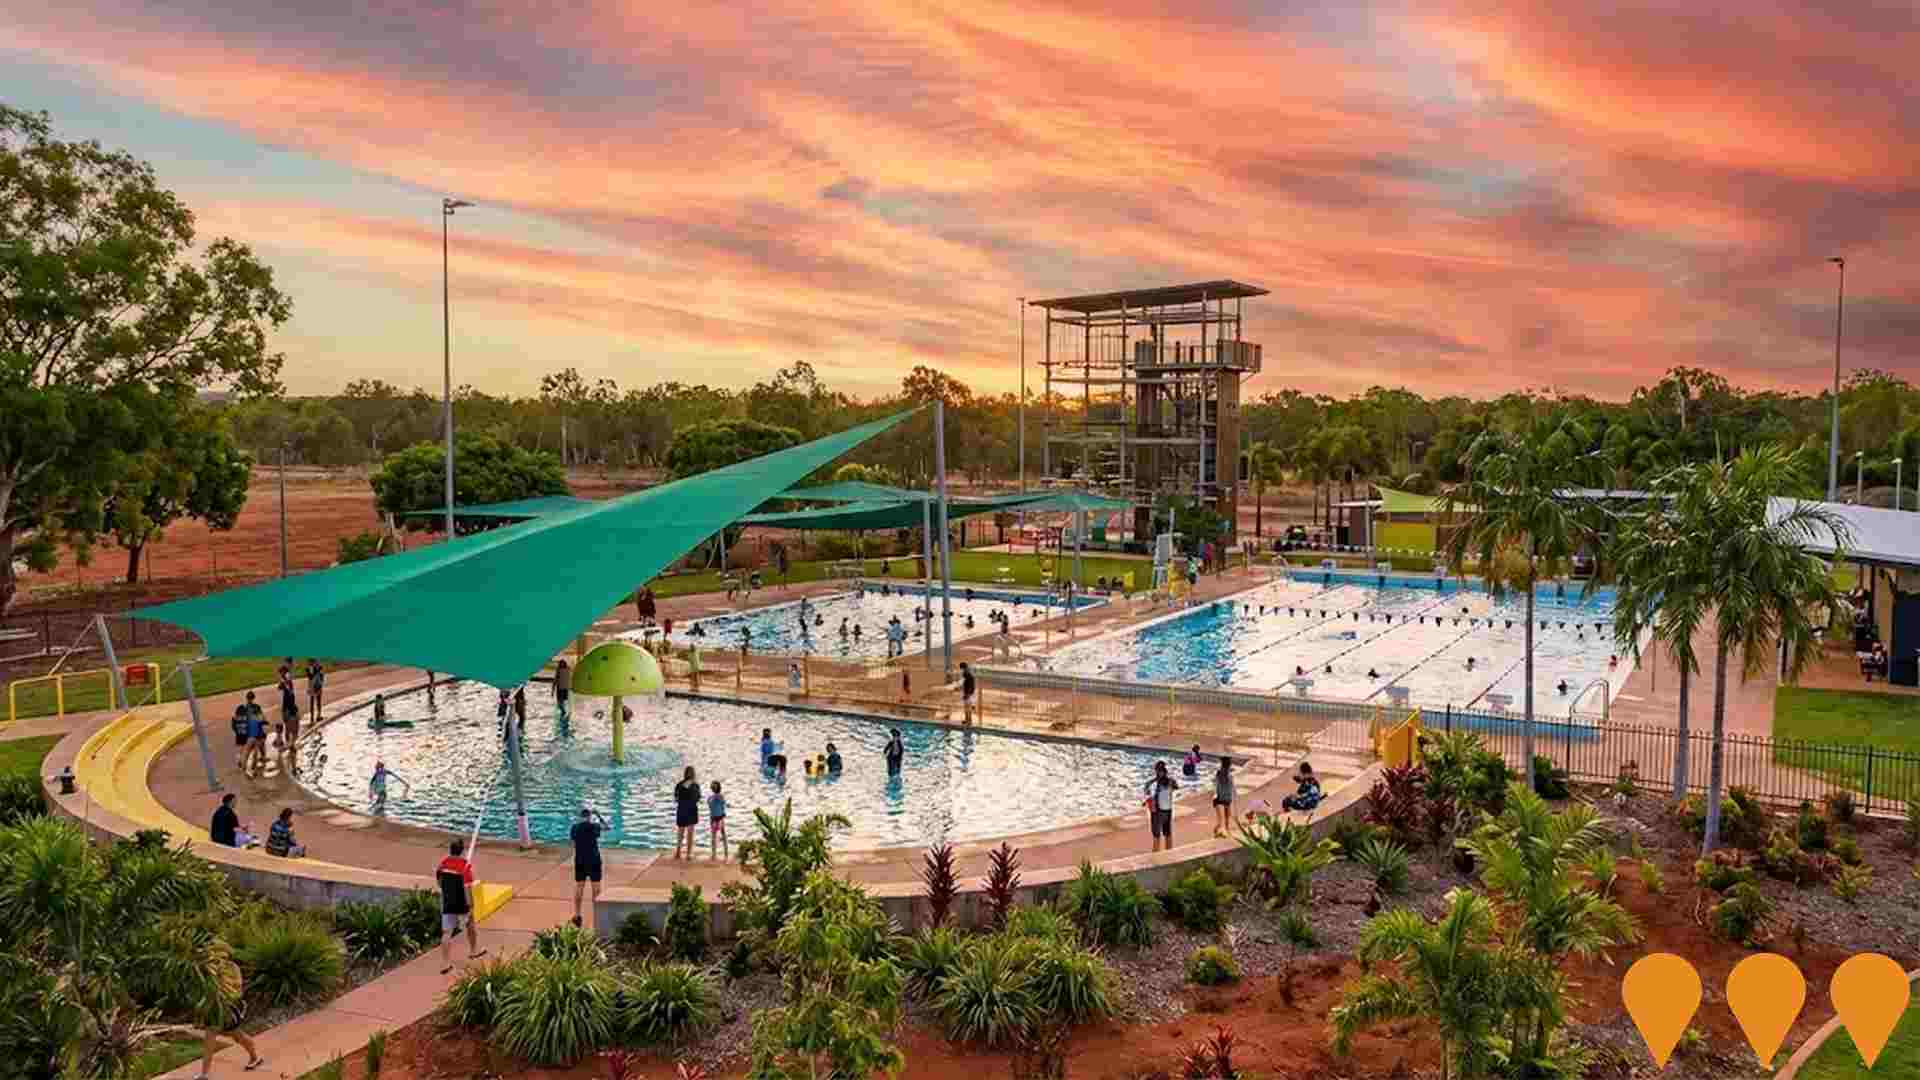
Palmerston Swimming and Fitness Centre Upgrade (SWELL)
$19.4M redevelopment of the Palmerston Swimming and Fitness Centre into the SWELL (Swimming, Wellness, Events, Leisure and Lifestyle) precinct. The upgrade delivers a 50m competition pool, 20m heated program/wellness pool, splash pad, 3-storey Adventure Play course and a health club. Funded by City of Palmerston with support from the Australian Government and Northern Territory Government. Facility operations are managed by Belgravia Leisure.
Marine Industry Park
Marine and offshore industries servicing hub at East Arm, Darwin. Stage 1 planning approval is secured for a purpose-built industrial subdivision near the new Darwin Ship Lift, with expressions of interest open for serviced lots. Existing common-user facilities include an all-tide barge ramp (first point of entry) and a secure hardstand supporting storage and fabrication activities.

Hudson Creek Power Station
12MW natural gas-fired power plant, NT's first privately owned grid-connected gas generation facility. Features 25% lower emissions than average NT gas generators. Part of dual project with Batchelor Solar Farm, creating 162 construction jobs and providing vital grid stability to Darwin-Katherine network.

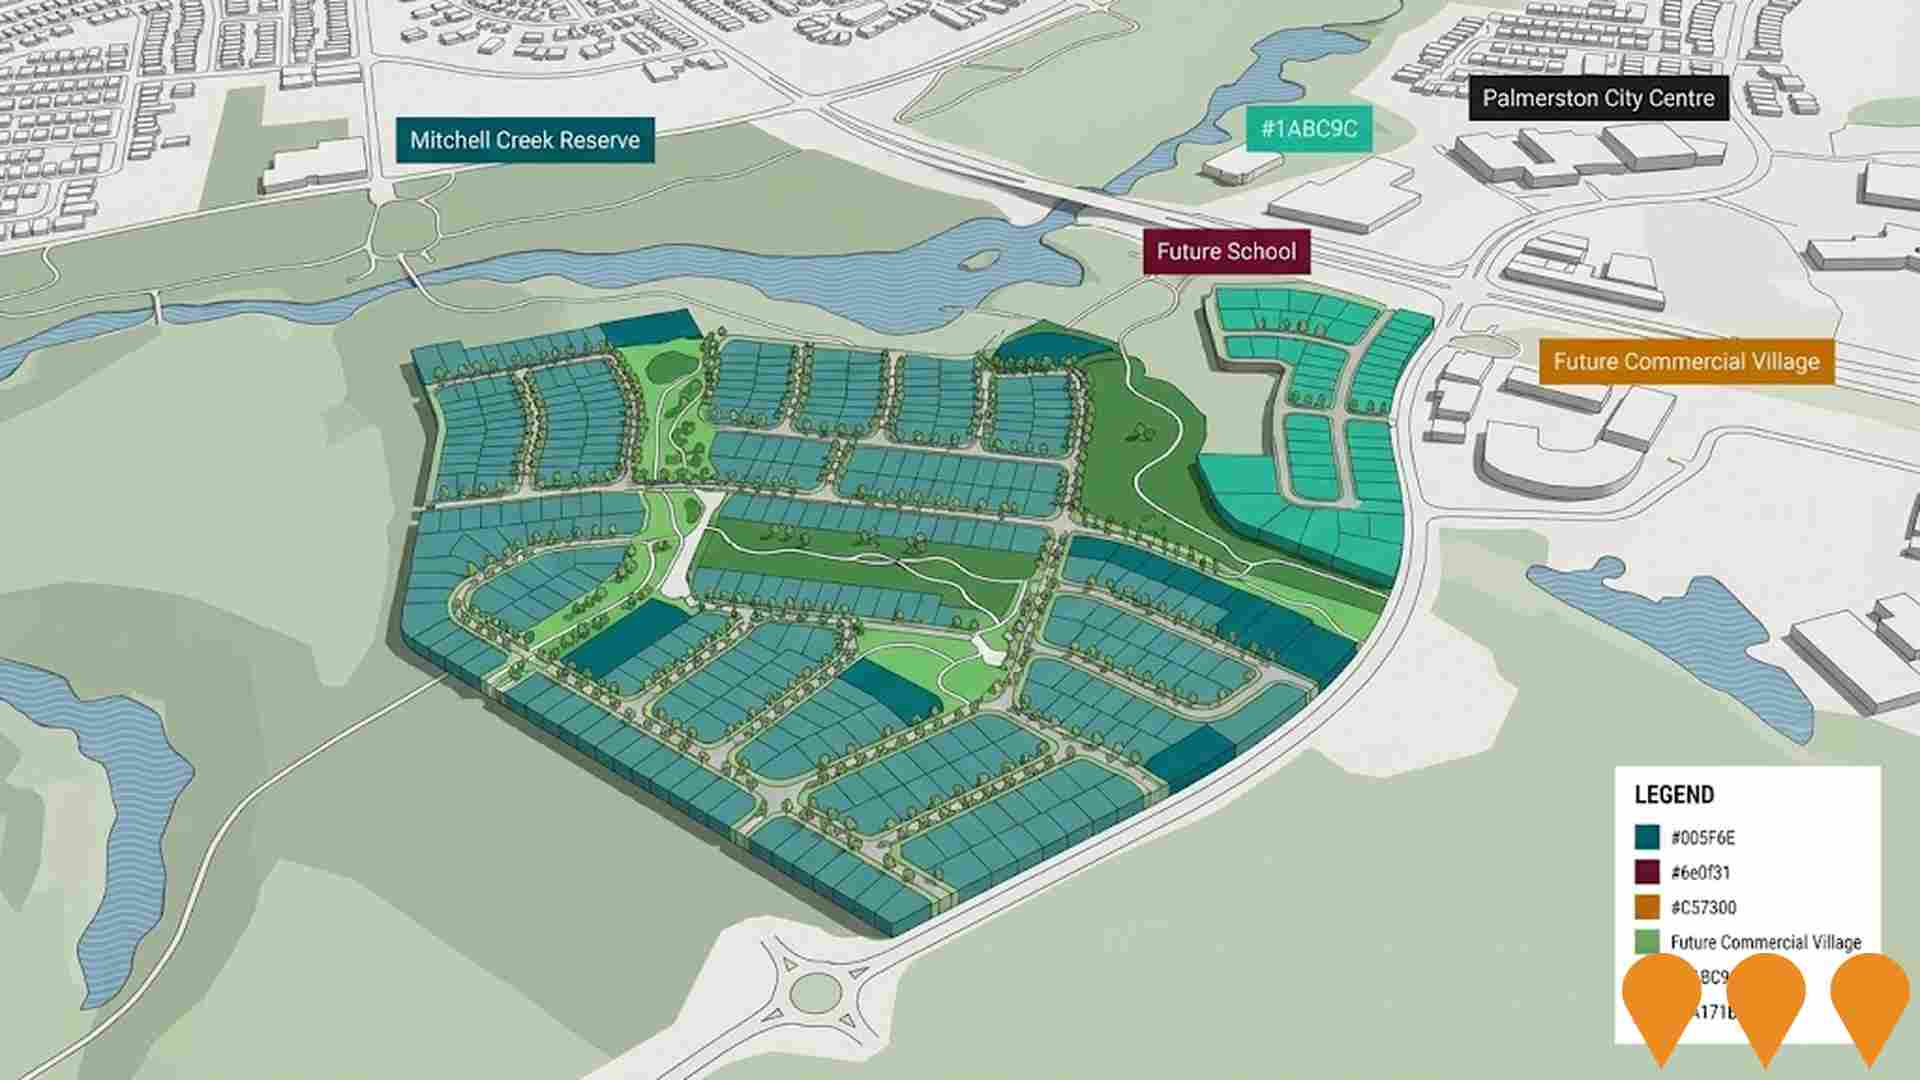
Mitchell Creek Green
50-hectare master-planned development by Territory Life, housing 500+ homes. Located along Mitchell Creek with conservation corridor. 70% complete with natural environment integration and affordable housing options. Features walking trails and wildlife preservation.

Employment
Employment conditions in East Arm face significant challenges, ranking among the bottom 10% of areas assessed nationally
East Arm possesses a balanced workforce spanning white and blue collar employment, with lifestyle and retail sectors notably represented, an unemployment rate of just 0.0%, and relative employment stability over the past year. As of June 2025, 0 residents are in work, and workforce participation is well beyond standard (90.5% compared to Greater Darwin's 69.7%).
Employment among residents is concentrated in retail trade, education & training, and agriculture, forestry & fishing. The area shows particularly strong specialization in retail trade, with an employment share of 10.5 times the regional level. On the other hand, public administration & safety is under-represented, with only 0.0% of East Arm's workforce compared to 19.5% in Greater Darwin. With 105.6 workers for every resident, as at the Census, the area functions as an employment hub, hosting more jobs than residents and attracting workers from surrounding areas.
Employment trend data is currently being compiled for East Arm. Jobs and Skills Australia's national employment forecasts from May 2025 can offer further insight into potential future demand within East Arm. These projections, covering five and ten-year periods, have been mapped against the local employment profile to estimate growth patterns. While national employment is forecast to expand by 6.6% over five years and 13.7% over ten years, growth rates differ significantly between industry sectors. Applying these industry-specific projections to East Arm's employment mix suggests local growth of approximately increase by 4.0%% over five years and 8.6% over ten years (please note this is a simple weighting extrapolation for illustrative purposes and does not take into account localised population projections).
Frequently Asked Questions - Employment
Income
Income analysis reveals strong economic positioning, with the area outperforming 60% of locations assessed nationally by AreaSearch
According to AreaSearch's aggregation of the latest postcode level ATO data released for FY-22, East Arm had a median income among taxpayers of $187,354 with the average level standing at $250,091. This is exceptionally high nationally and compares to levels of $65,522 and $75,260 across Greater Darwin respectively. Based on Wage Price Index growth of 12.01% since FY-22, current estimates would be approximately $209,855 (median) and $280,127 (average) as of September 2025. Census data reveals individual earnings stand out at the 88th percentile nationally ($1,145 weekly), though household income ranks lower at the 40th percentile. Income brackets indicate the $0 - 399 earnings band captures 0.0% of the community (0 individuals), unlike trends the region where 36.7% fall within the $1,500 - 2,999 range. Housing affordability pressures are severe, with only 59.7% of income remaining, ranking at the 10th percentile.
Frequently Asked Questions - Income
Housing
East Arm is characterized by a predominantly suburban housing profile, with a higher proportion of rental properties than the broader region
Dwelling structure within East Arm, as evaluated at the latest Census, comprised 100.0% houses and 0.0% other dwellings (semi-detached, apartments, 'other' dwellings), in comparison to Darwin metro's 68.4% houses and 31.6% other dwellings. Meanwhile, the level of home ownership within East Arm was lagging that of Darwin metro, at 0.0%, with the remainder of dwellings either mortgaged (0.0%) or rented (100.0%). The median monthly mortgage repayment in the area was well below the Darwin metro average at $0, while the median weekly rent figure was recorded at $635, compared to Darwin metro's $2,028 and $350. Nationally, East Arm's mortgage repayments are significantly lower than the Australian average of $1,863, while rents are substantially above the national figure of $375.
Frequently Asked Questions - Housing
Household Composition
East Arm has a typical household mix, with a lower-than-average median household size
Family households dominate at 42.9% of all households, comprising 0.0% couples with children, 0.0% couples without children, and 0.0% single parent families. Non-family households make up the remaining 57.1%, with lone person households at 0.0% and group households comprising 0.0% of the total. The median household size of 2.0 people is smaller than the Greater Darwin average of 2.7.
Frequently Asked Questions - Households
Local Schools & Education
East Arm faces educational challenges, with performance metrics placing it in the bottom quartile of areas assessed nationally
The area faces educational challenges, with university qualification rates (0.0%) substantially below the SA3 area average of 36.1%. This represents both a challenge and an opportunity for targeted educational initiatives. Bachelor degrees lead at 0.0%, followed by postgraduate qualifications (0.0%) and graduate diplomas (0.0%). Trade and technical skills feature prominently, with 84.2% of residents aged 15+ holding vocational credentials – advanced diplomas (0.0%) and certificates (84.2%).
Formal education enrollment stands at 0.0% of residents. This includes 0.0% in primary education, 0.0% in secondary education, and 0.0% pursuing tertiary education. Educational facilities appear to be located outside the immediate catchment boundaries, requiring families to access schools in neighboring areas.
Frequently Asked Questions - Education
Schools Detail
Nearby Services & Amenities
Transport
No public transport data available for this catchment area.
No transport stops were observed in the latest assessment of GTFS data for this area.
Frequently Asked Questions - Transport
Transport Stops Detail
Health
East Arm's residents are extremely healthy with both young and old age cohorts seeing low prevalence of common health conditions
Analysis of health metrics shows strong performance throughout East Arm with both young and old age cohorts seeing low prevalence of common health conditions , and the rate of private health cover found to be exceptionally high at approximately 95% of the total population (19 people). This compares to 56.7% across Greater Darwin. The national average is 55.3%.
The most common medical conditions in the area were found to be mental health issues and diabetes, impacting 21.1 and 15.8% of residents, respectively, while 68.2% declared themselves as completely clear of medical ailments compared to 77.0% across Greater Darwin. The area has 18.0% of residents aged 65 and over (3 people), which is higher than the 12.3% in Greater Darwin. Health outcomes among seniors are particularly strong, performing even better than the general population in health metrics.
Overall 0.0% of the total population registered as requiring assistance with day to day activities, which is well below average. In Greater Darwin, 4.3% require assistance. Nationally, 5.8% require assistance.
Frequently Asked Questions - Health
Cultural Diversity
East Arm was found to be more culturally diverse than the vast majority of local markets in Australia, upon assessment of a range of language and cultural background related metrics
East Arm was found to be more culturally diverse than the vast majority of local markets, with 14.3% of its population speaking a language other than English at home and 28.6% born overseas. The main religion in East Arm was found to be Christianity, which makes up 53.3% of people in East Arm. This compares to 44.4% across Greater Darwin.
In terms of ancestry (country of birth of parents), the top three represented groups in East Arm are Australian, comprising 26.7% of the population, which is substantially higher than the regional average of 19.4%, English, comprising 26.7% of the population, which is substantially higher than the regional average of 18.4%, and Other, comprising 26.7% of the population, which is substantially higher than the regional average of 16.3%. Additionally, there are notable divergences in the representation of certain other ethnic groups: Irish is notably overrepresented at 20.0% of East Arm (vs 6.2% regionally).
Frequently Asked Questions - Diversity
Age
East Arm hosts an older demographic, ranking in the top quartile nationwide
The 42-year median age in East Arm is considerably higher than Greater Darwin's average of 34 similarly substantially exceeding the 38-year national average. Compared to the Greater Darwin average, the 65 - 74 cohort is notably over-represented (18.0% locally), while 15 - 24 year-olds are under-represented (0.0%). This 65 - 74 concentration is well above the national 9.4%. Post-2021 Census data shows the area has become younger, with median age dropping 3.4 years to 42 from 45. Notable shifts include the 25 to 34 age group has grown from 21.1% to 25.7% of the population, while the 5 to 14 cohort increased from 0.0% to 4.5%. Conversely, the 65 to 74 cohort has declined from 26.3% to 18.0% and the 55 to 64 group dropped from 15.8% to 9.0%. By 2041, East Arm is expected to see notable shifts in its age composition. Leading the demographic shift, the 35 to 44 group will grow by 175% (8 people), reaching 13 from 4. In contrast, the 55 to 64 cohort is projected to decline by 0 people.