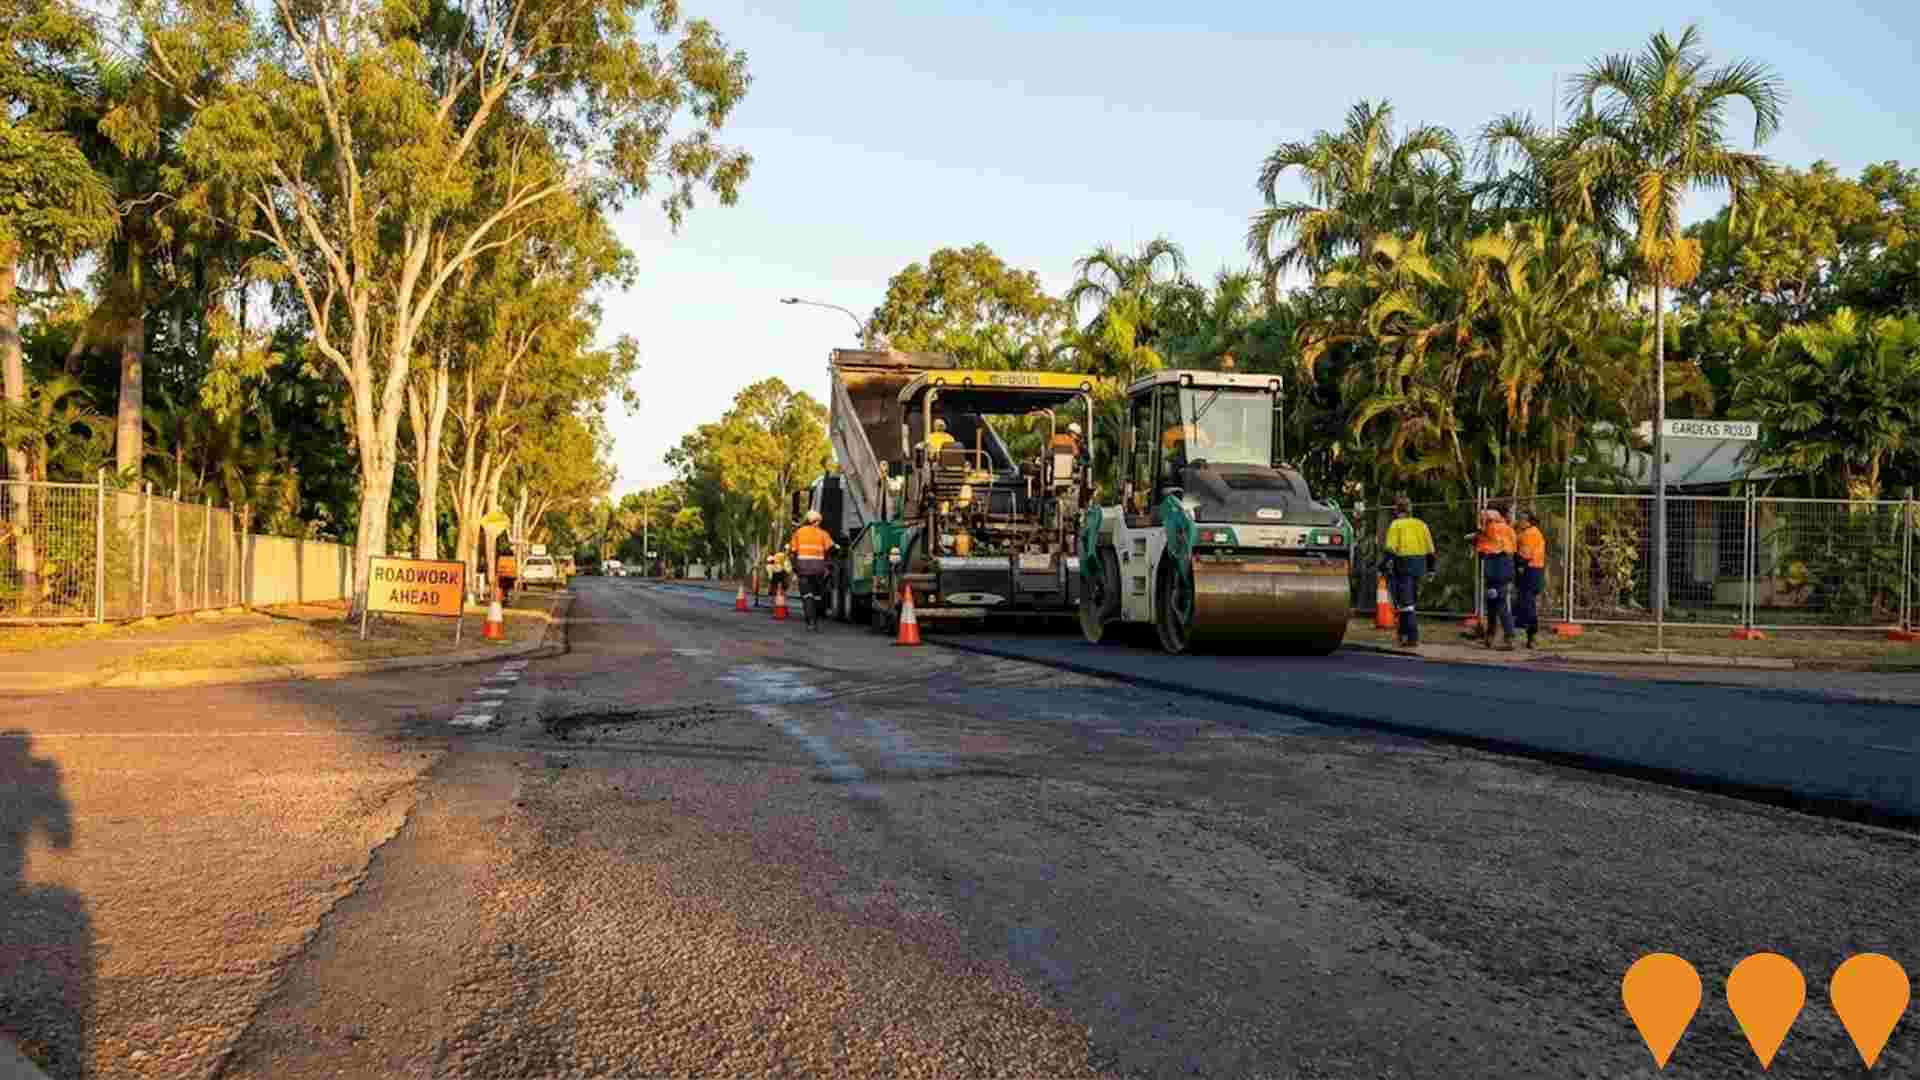
Larrakeyah

SA2

Greater Darwin / Darwin City

Updated 10 Apr 2026 ABS 2021 701011005
Chart Color Schemes
Loading map data ...
Statistical Area (SA2) Boundary Analysis

This analysis uses ABS Statistical Areas Level 2 (SA2) boundaries, which can materially differ from Suburbs and Localities (SAL) even when sharing similar names.

SA2 boundaries are defined by the Australian Bureau of Statistics and are designed to represent communities for statistical reporting (e.g., census and ERP).

Suburbs and Localities (SAL) represent commonly-used suburb/locality names (postal-style areas) and may use different geographic boundaries. For comprehensive analysis, consider reviewing both boundary types if available.

0 People

est. as @ -- *

ABS ERP | -- people | --

2021 Census | -- people

Land Area
--
Land Area
Population Density
--
Density
Unemployment Rate
--
Unemployment
Development
--
Resi Approvals
Get My Report

Sales Activity

Table Chart PROFILE FAQ

Curious about local property values? Filter the chart to assess the volume and appreciation (including resales) trends and regional comparisons, or scroll to the map below view this information at an individual property level.

House icon
Median Price
$0
Key icon
1yr Sales Volume
0
Find a Recent Sale
Type Specified (1) | Limit 50

Sales Detail

Population

Table Chart PROFILE FAQ

Population growth drivers in Larrakeyah are strong compared to national averages based on AreaSearch's ranking of recent, and medium to long-term trends

Based on AreaSearch's analysis, Larrakeyah's population is around 4,400 as of Feb 2026. This reflects an increase of 457 people (11.6%) since the 2021 Census, which reported a population of 3,943 people. The change is inferred from the estimated resident population of 4,389 from the ABS as of June 2024 and address validation since the Census date. This population level equates to a density ratio of 2,256 persons per square kilometer, which is above the average seen across national locations assessed by AreaSearch. Larrakeyah's 11.6% growth since the 2021 census exceeded the SA3 area (8.2%) and the SA4 region, marking it as a growth leader in the region. Population growth for the area was primarily driven by overseas migration, which contributed approximately 81.6% of overall population gains during recent periods.

AreaSearch is adopting ABS/Geoscience Australia projections for each SA2 area, as released in 2024 with 2022 as the base year. For any SA2 areas not covered by this data, and to estimate growth across all areas in the years post-2032, AreaSearch is applying growth rates by age cohort to each area, as provided by the ABS in its latest Greater Capital Region projections (released in 2023, based on 2022 data). Considering the projected demographic shifts, an above-median population growth compared to national areas is projected, with the area expected to increase by 729 persons by 2041 based on the latest annual ERP population numbers, reflecting an increase of 16.3% in total over the 17 years.

Frequently Asked Questions - Population

What is the latest population estimate for the Larrakeyah SA2?
Total population for the Larrakeyah SA2 was estimated to be approximately 4,400 as at Feb 26. This is based upon an estimated resident population of 4,389 from the ABS up to June 2024.
How has the population in the Larrakeyah SA2 changed since 2021?
The larrakeyah sa2 has added approximately 457 people and shown a 11.59% increase from the 3,943 people recorded at the 2021 Census period.
What is the population density in the Larrakeyah SA2?
The population density in the Larrakeyah SA2 is estimated at 2,256 persons per square kilometer based on the latest population estimate.
How much has the population grown over the past 10 years in the Larrakeyah SA2?
Over the past 10 years, the population in the Larrakeyah SA2 has shown a compound annual growth rate of 1.1% per annum.
What are the main drivers of population growth in the Larrakeyah SA2?
Population growth in the Larrakeyah SA2 is driven by: Overseas migration (81.6%), Natural increase (18.4%), Interstate migration (0.0%). The primary driver is Overseas migration, contributing 81.6% of overall population gains.

Development

Table Chart PROFILE FAQ

Residential development activity is lower than average in Larrakeyah according to AreaSearch's national comparison of local real estate markets

Larrakeyah has averaged around 2 new dwelling approvals annually, totalling 13 homes over the past 5 financial years. So far in FY-26, 0 approvals have been recorded. Given an average of 24.5 new residents per year arriving per dwelling constructed over the past 5 financial years (between FY-21 and FY-25), supply is substantially lagging demand, which generally means heightened buyer competition and pricing pressures, while new homes are being built at an average construction cost of $795,000, showing that developers are focusing on the premium market with high-end developments. Additionally, $10.5 million in commercial development approvals have been recorded this financial year, suggesting balanced commercial development activity.

Compared to Greater Darwin, Larrakeyah shows approximately 75% of the construction activity per person and ranks in the 8th percentile of areas assessed nationally, resulting in relatively constrained buyer choice and supporting interest in existing dwellings. This is below the national average, indicating the area's established nature and suggesting potential planning limitations. New development consists of 50.0% standalone homes and 50.0% townhouses or apartments. This focus on higher-density living creates more affordable entry points and suits downsizers, investors, and first-home buyers. Interestingly, developers are building more traditional houses than the current mix suggests (22.0% at Census), indicating continued strong demand for family homes despite density pressures.

Future projections show Larrakeyah adding 718 residents by 2041 (from the latest AreaSearch quarterly estimate). At current development rates, housing supply may struggle to match population growth, potentially heightening buyer competition and supporting price increases.

Frequently Asked Questions - Development

How many dwelling approvals have occurred in the Larrakeyah SA2 recently?
Dwelling approval activity in the the Larrakeyah SA2 area has seen 4 residential approvals over the past two financial years, based on AreaSearch's SA2 aggregation method. The Larrakeyah SA2's current population of 4,400 has been supported by 2 approvals on average over recent years.
How does the Larrakeyah SA2's development activity compare to the broader region?
The Larrakeyah SA2 has seen 0.06 approvals per 100 people in recent years, compared to 0.25 approvals in the broader region. This means that one dwelling has been approved for every 0 people in the Larrakeyah SA2, compared to one for every 466 in the broader region.
Is the Larrakeyah SA2 keeping up with housing demand?
With the population expected to increase by 718 people by 2041, around 359 new dwellings will be necessary. Recent approval levels may be insufficient to meet these forecasts, considering the census average of 2.0 persons per dwelling. This indicates potential housing shortages if current approval trends continue.
What has been the trend in development approvals over the past five years in the Larrakeyah SA2?
Looking at development activity over the past five years, the Larrakeyah SA2's approval levels have been significantly below the yearly average of 2, showing a notable downturn in recent development.
How many dwellings will be needed to accommodate future population growth in the Larrakeyah SA2?
The population in the Larrakeyah SA2 is expected to grow by 718 people by 2041, necessitating approximately 359 new dwellings. This calculation is based on the current census average of 2.0 persons per dwelling in the area.
How does recent development compare to population growth in the Larrakeyah SA2?
Over the past five years, the population in the Larrakeyah SA2 has grown by approximately 1,088 people, while 13 residential approvals were recorded. This equates to a ratio of 83.7 people added for each new dwelling approval. This high ratio suggests strong population growth relative to housing supply, potentially indicating unmet housing demand.
Are there opportunities for residential developers in the Larrakeyah SA2?
With dwelling approval activity running at an average of 2 approvals per year and a population of 4,400, there appears to be a supply shortfall relative to projected demand, presenting strong opportunities for residential developers. With the population expected to increase by 718 people by 2041, around 359 new dwellings will be necessary. Current approval trends may be insufficient to meet forecast demand, indicating strong development opportunities.

Infrastructure

PROFILE FAQ

Larrakeyah has limited levels of nearby infrastructure activity, ranking in the 1stth percentile nationally

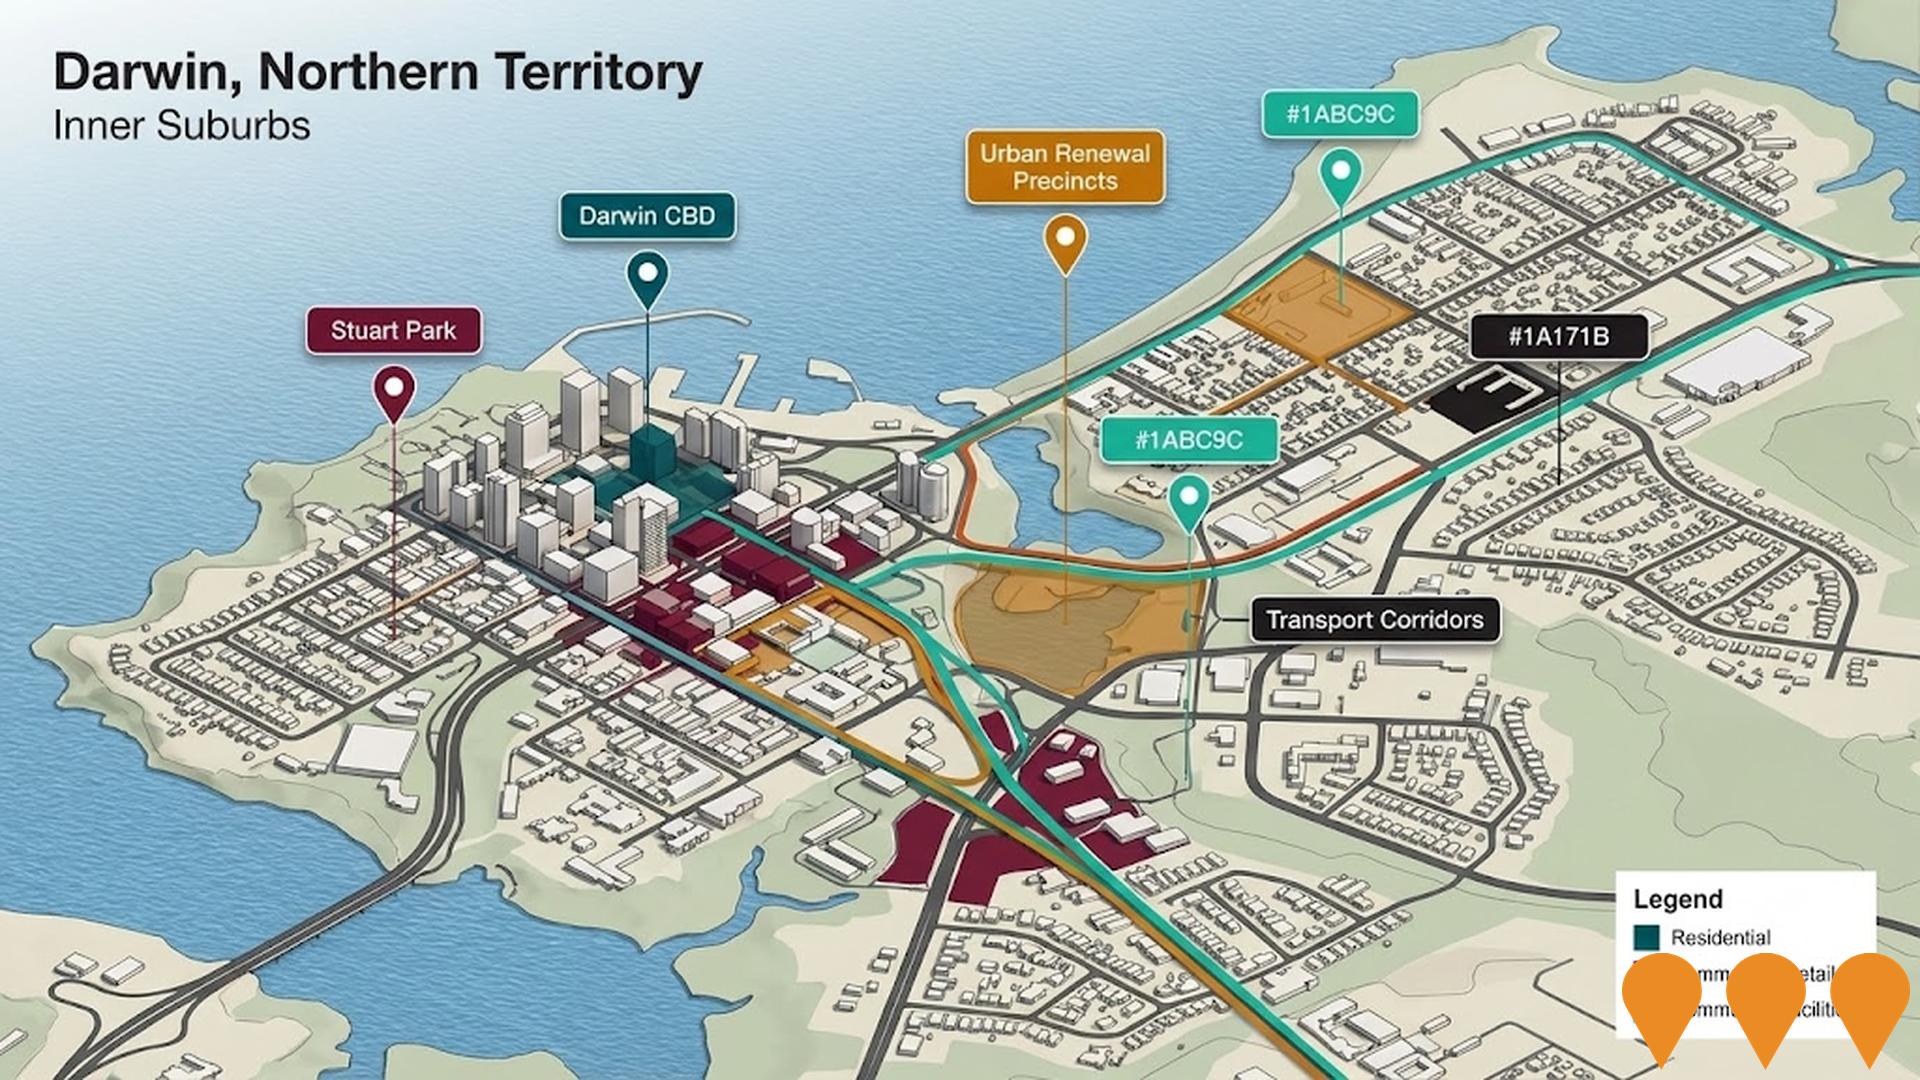
Nothing can influence an area's performance as much as changes to local infrastructure, major projects, and planning initiatives. In total, 13 projects have been identified by AreaSearch that are likely to have an impact on the area. Key projects include the Larrakeyah Defence Precinct Redevelopment, The Avenue Larrakeyah, Darwin Digital Hub, and Darwin Youth Centre, with the list below detailing those likely to be of most relevance.

Professional plan users can use the search below to filter and access additional projects.

INFRASTRUCTURE SEARCH

All Selected

AI Generated Denotes AI-based impression for illustrative purposes only, not to be taken as definitive under any circumstances. Please follow links and conduct other investigations from the project's source for actual imagery. Developers and project owners wishing us to use original imagery please Contact Us and we will do so.

Frequently Asked Questions - Infrastructure

What are some of the major infrastructure and planning changes likely to influence the Larrakeyah SA2?
Key infrastructure and planning changes likely to influence the Larrakeyah SA2 include: Larrakeyah Defence Precinct Redevelopment (Construction); The Avenue Larrakeyah (Construction); Darwin Digital Hub (Construction); Darwin Youth Centre (Construction); and Asti Motel Redevelopment, Packard Place (Proposed). These projects represent significant developments that will shape the area's future infrastructure landscape.
What types of infrastructure projects are impacting the Larrakeyah SA2?
Infrastructure development impacting the Larrakeyah SA2 spans multiple sectors including Residential Development, Sports & Recreation, and Communities, Precincts & Urban Renewal, among others.
What is the scale of infrastructure investment impacting the Larrakeyah SA2?
Infrastructure investment analysis indicates substantial capital deployment exceeding $1.1 billion in projects that will impact the extended area, with a notable concentration of investment within the immediate the Larrakeyah SA2 vicinity.
How does the Larrakeyah SA2's infrastructure development compare to other areas?
Infrastructure development activity impacting the Larrakeyah SA2 currently ranks below national averages at the 1stth percentile.
Darwin City Stadium
Category: Sports & Recreation
Stage: Planning | Est. Comp: 2034
Source / Links: Link 1   Link 2  

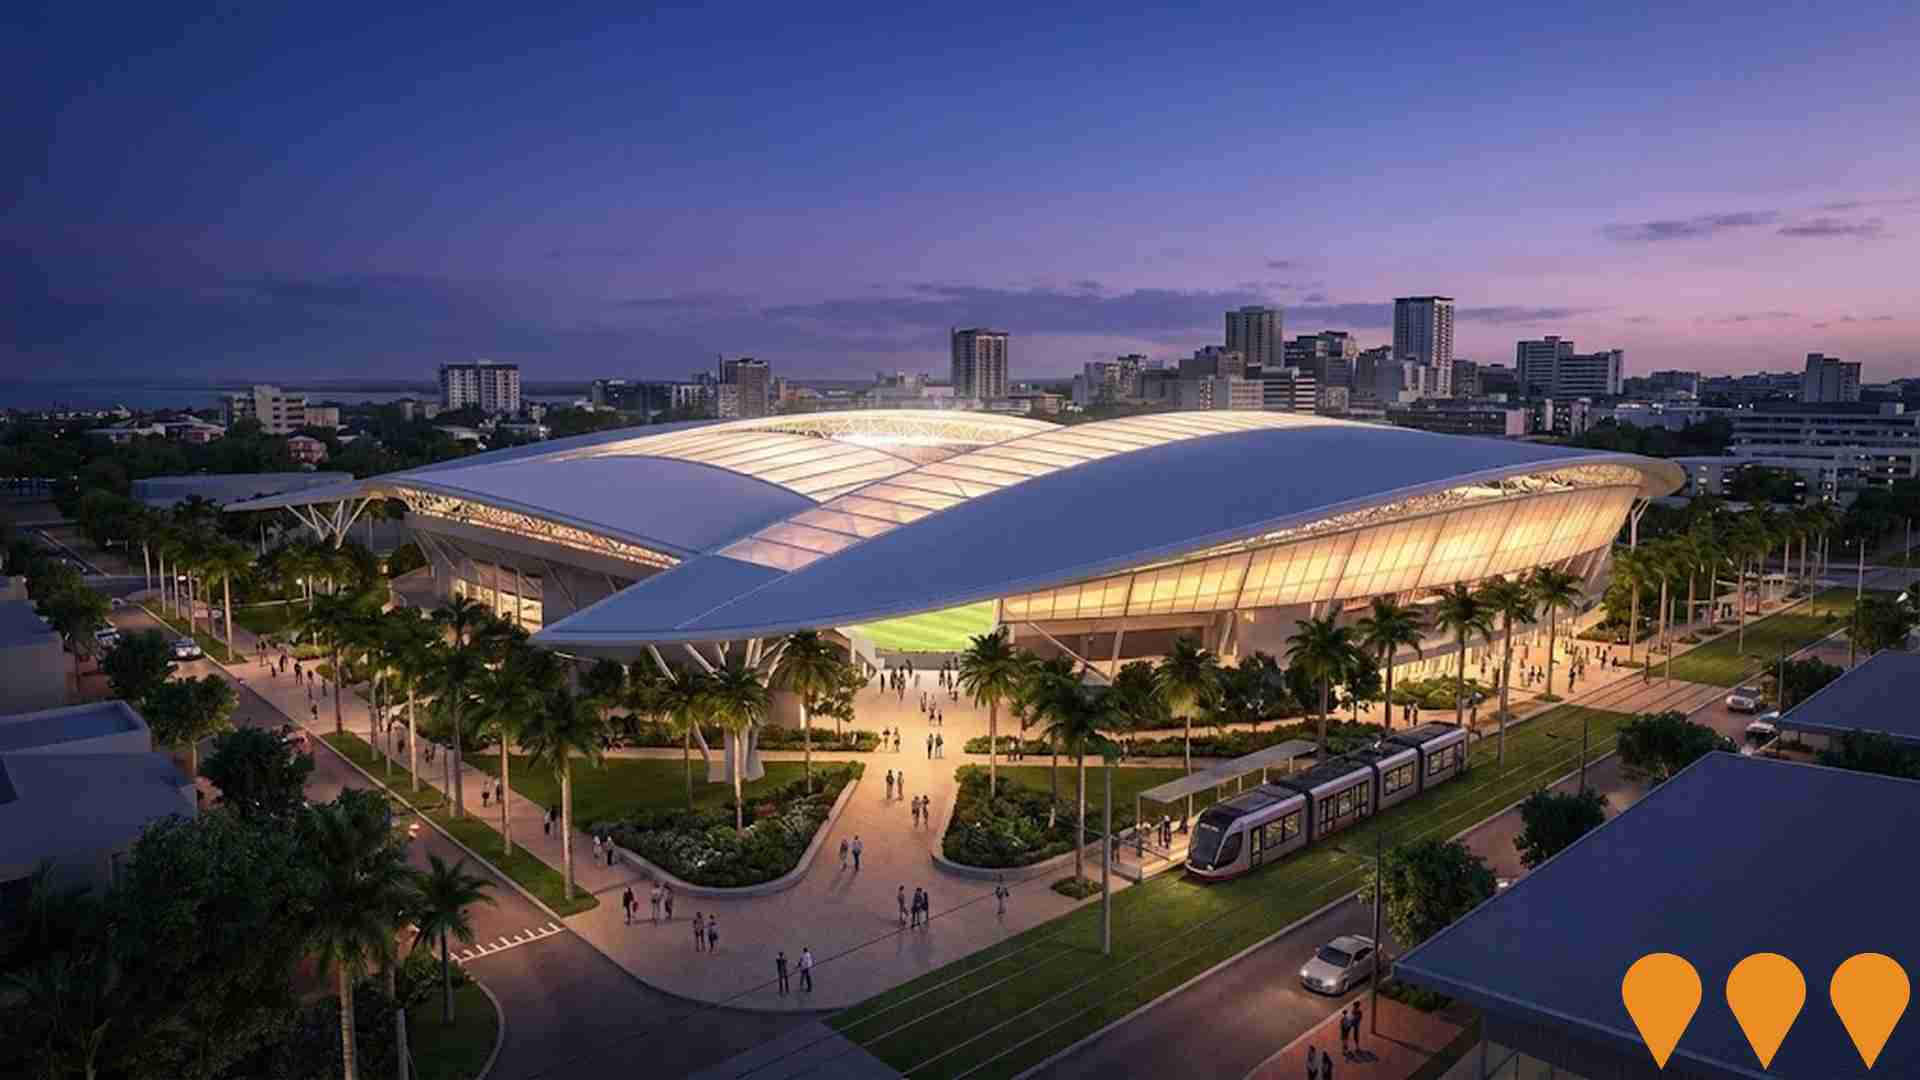
The Darwin City Stadium is a proposed 25,000-seat multi-purpose venue designed to anchor the Northern Territory's bid for the 20th AFL license. Located at the former Shell fuel tank site on Garramilla Boulevard, the stadium is intended to host multiple sporting codes including AFL, Cricket, Rugby League, and Soccer. The project is a key component of the NT's Strategic Business Plan to enhance regional liveability and economic growth, with a business case released in May 2024 estimating construction within a 7 to 10-year timeframe.

Sports & Recreation

Darwin City Deal - Cavenagh Street Redevelopment
Category: Communities, Precincts & Urban Renewal
Stage: Completed | Est. Comp: 2024
Source / Links: Link 1   Link 2  

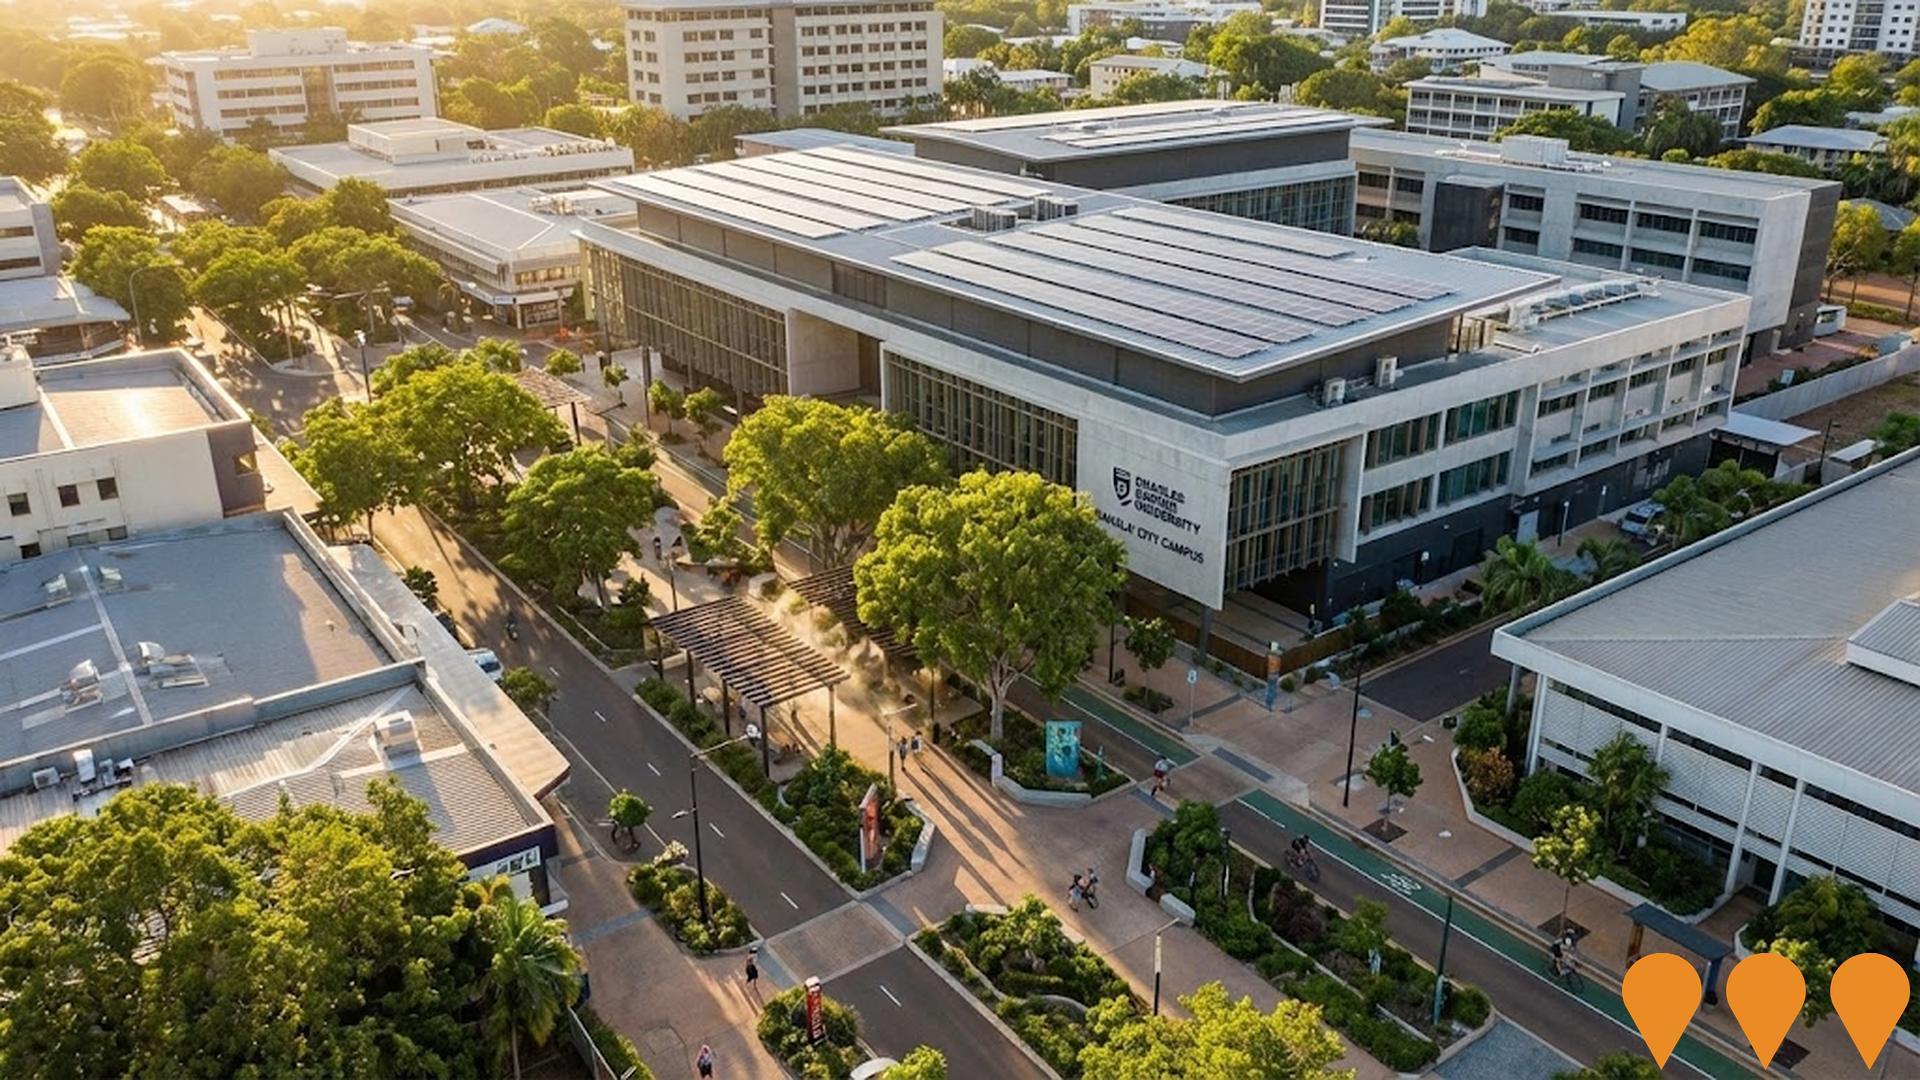
Comprehensive revitalisation of Cavenagh Street anchored by the newly completed $250 million Charles Darwin University 'Danala' City Campus and extensive streetscape upgrades. The project delivered a cooling, pedestrian-friendly civic spine with the 'Greening and Cooling' enhancement works completed in May 2024, featuring heat mitigation infrastructure and improved public realm connectivity. While the main Cavenagh Street precinct works are complete, the adjacent $30 million Civic Centre redevelopment on Harry Chan Avenue is progressing through planning.
Communities, Precincts & Urban Renewal

Darwin Digital Hub
Category: Business Parks & Technology Hubs
Stage: Construction | Est. Comp: 2026
Source / Links: Link 1   Link 2  

$55 million technology and innovation hub providing startup incubation, co-working spaces, and digital skills training to position Darwin as a regional tech center.
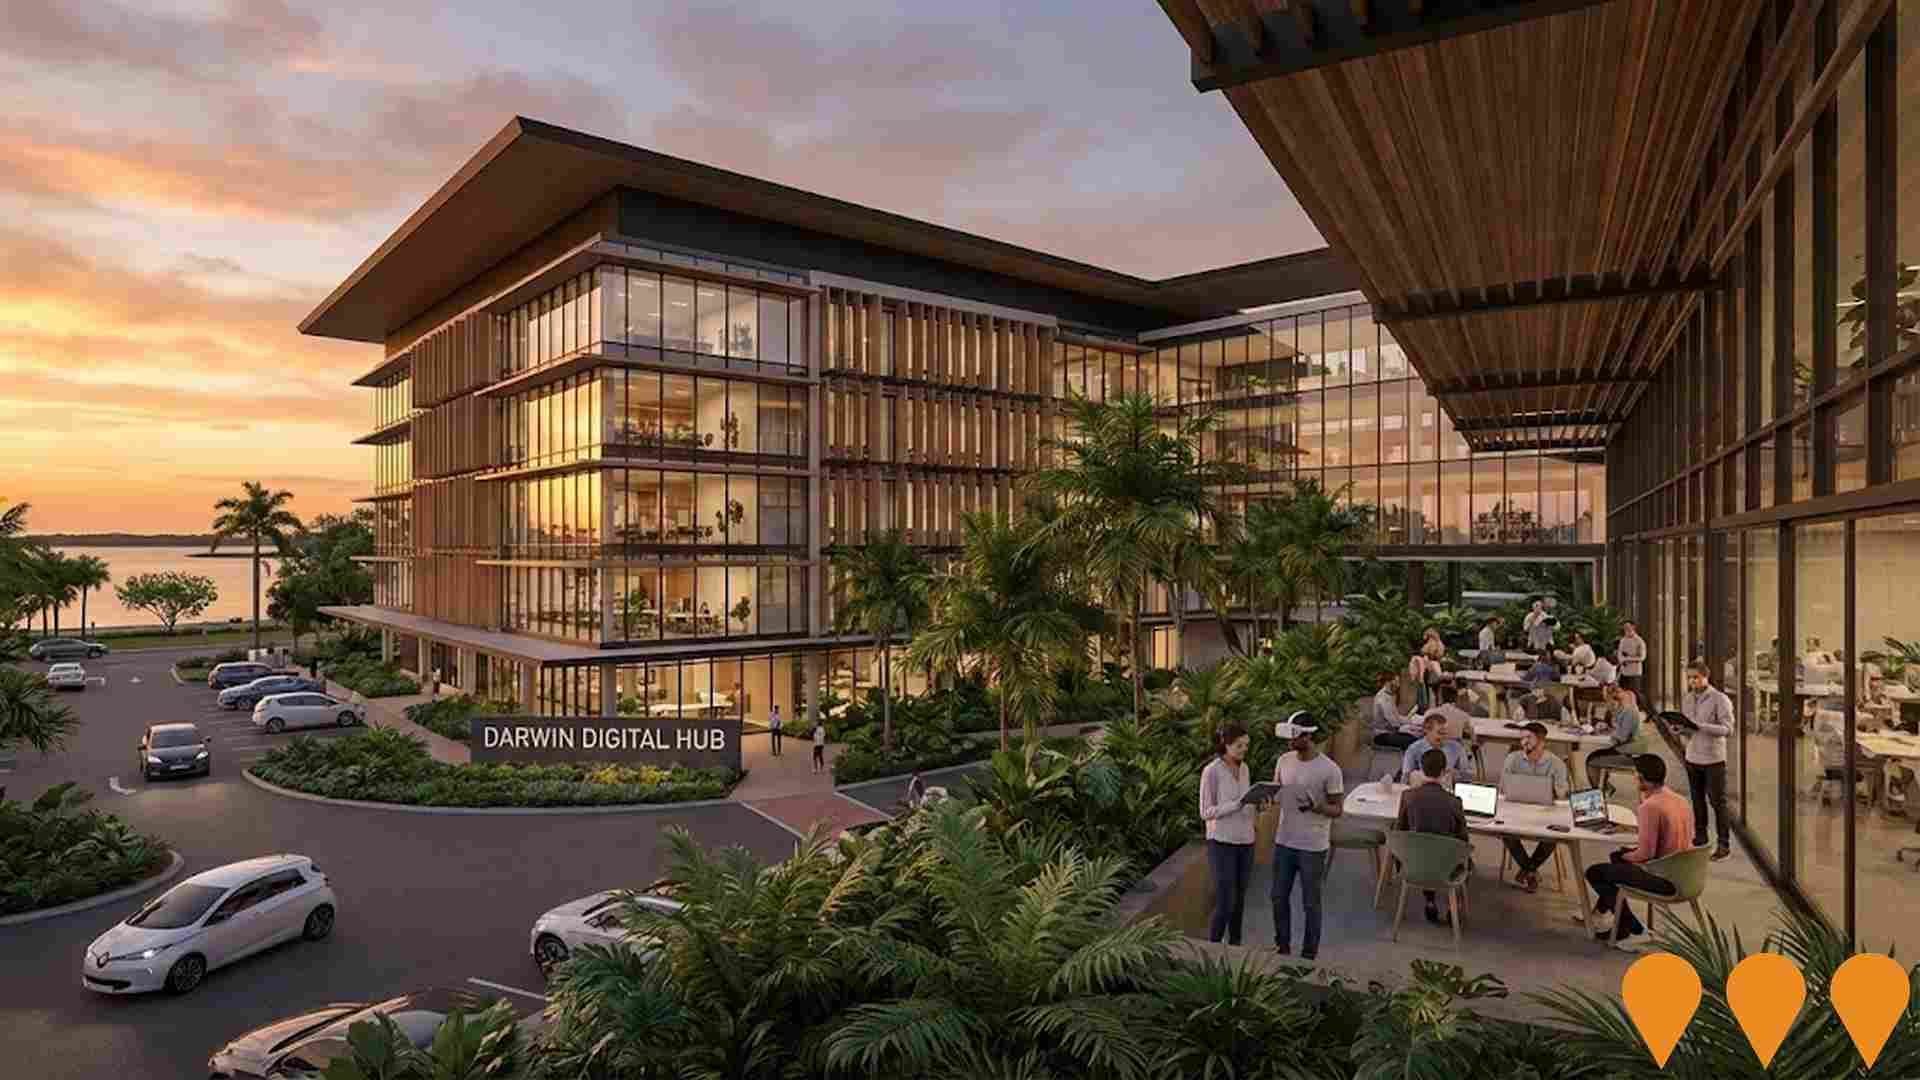
Business Parks & Technology Hubs

Darwin Youth Centre
Category: Sports & Recreation
Stage: Construction | Est. Comp: 2025
Source / Links: Link 1   Link 2  

$18 million multipurpose youth facility offering sports courts, creative studios, mentorship programs, and educational support services for young people.
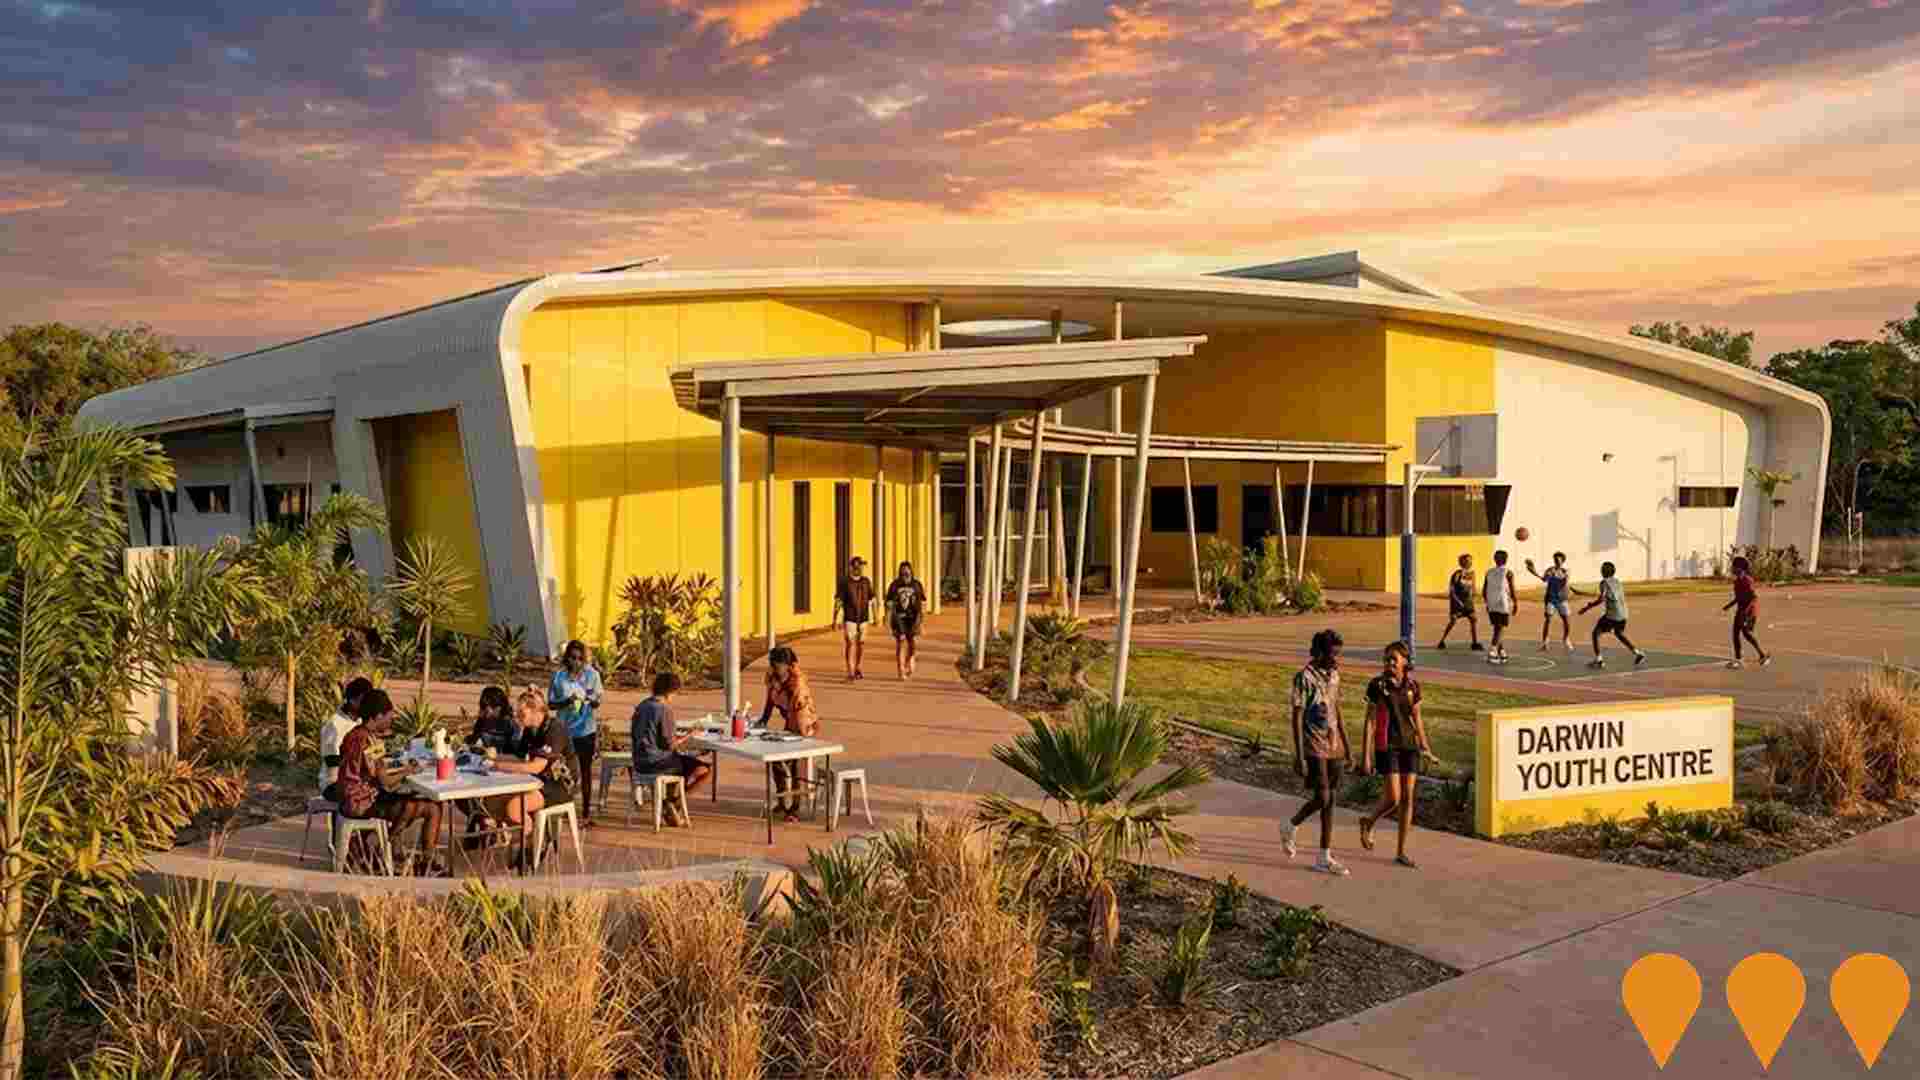
Sports & Recreation

The Avenue Larrakeyah
Category: Residential Development
Stage: Construction | Est. Comp: 2025
Source / Links: Link 1   Link 2  

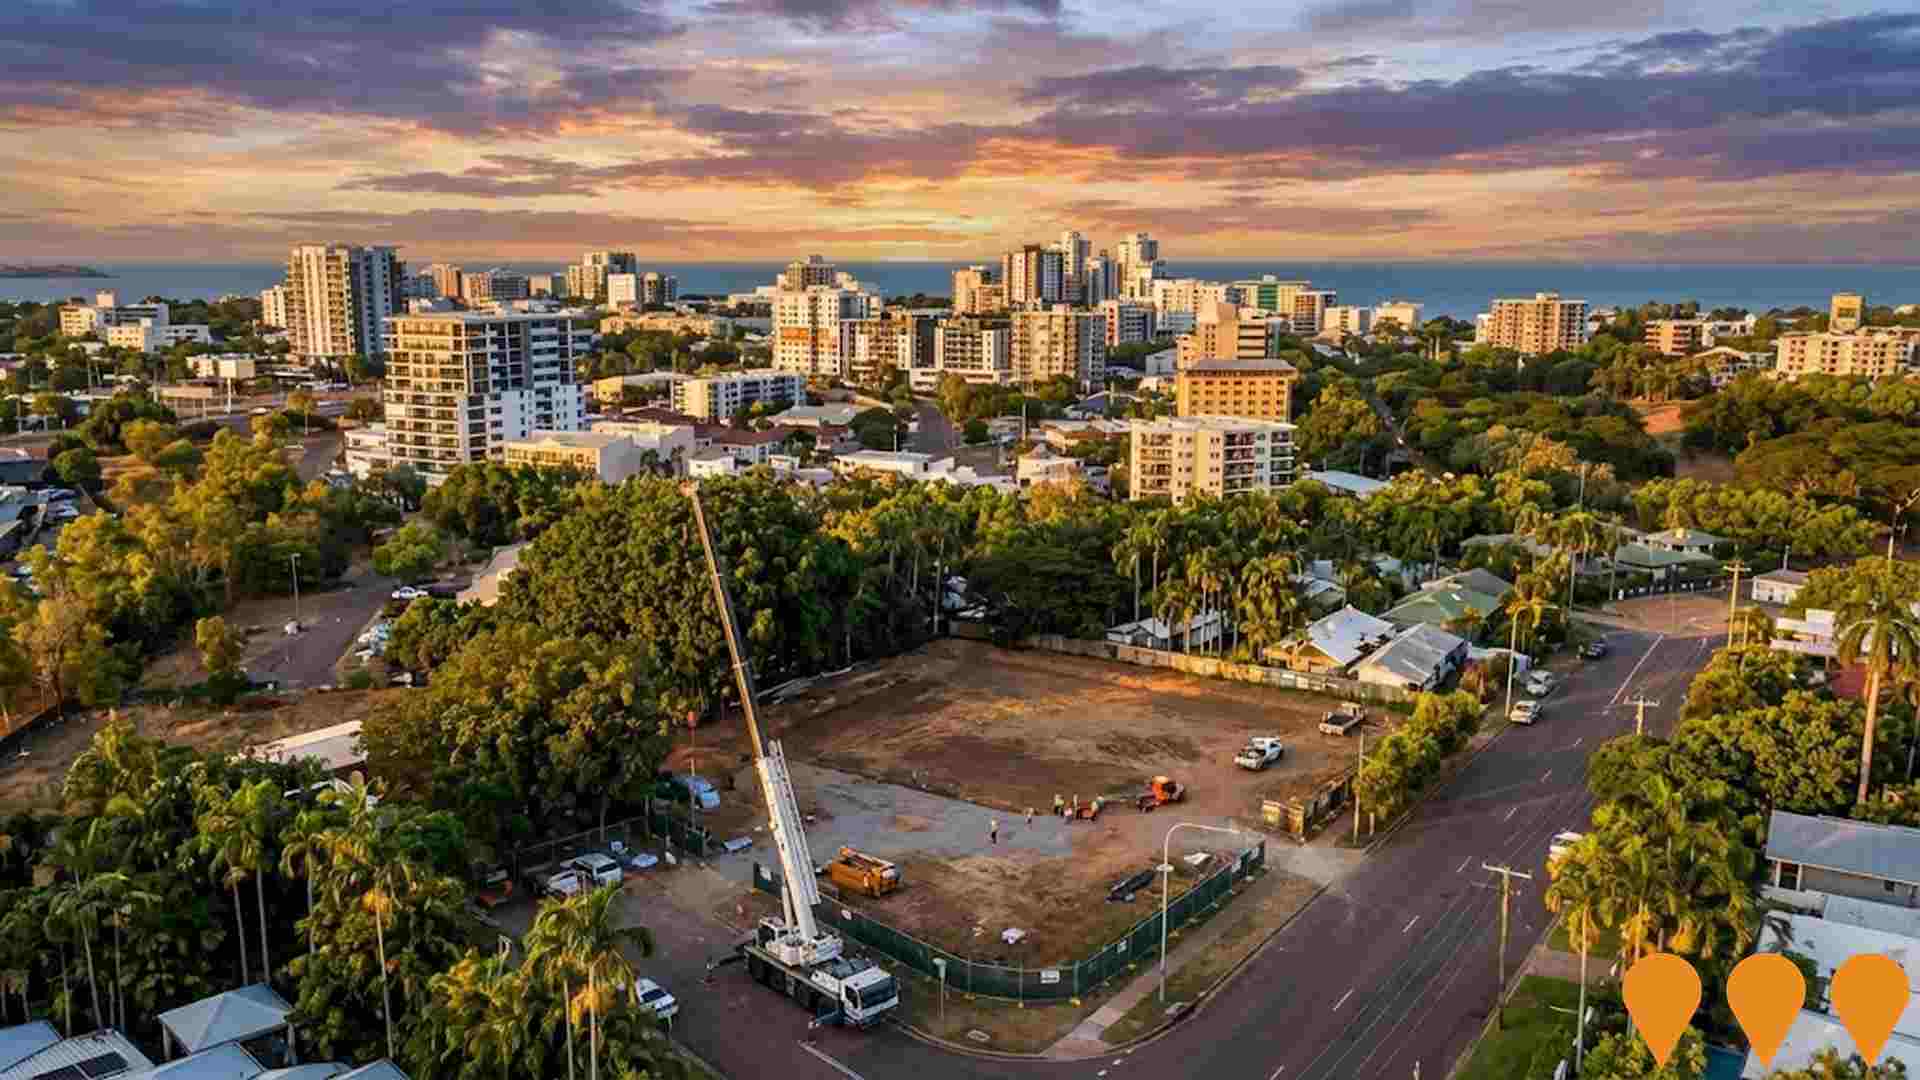
A luxury residential development featuring 54 premium apartments with 1, 2, and 3-bedroom configurations, designed for modern coastal living. The project includes high-end amenities like a rooftop terrace and is located close to Darwin CBD.
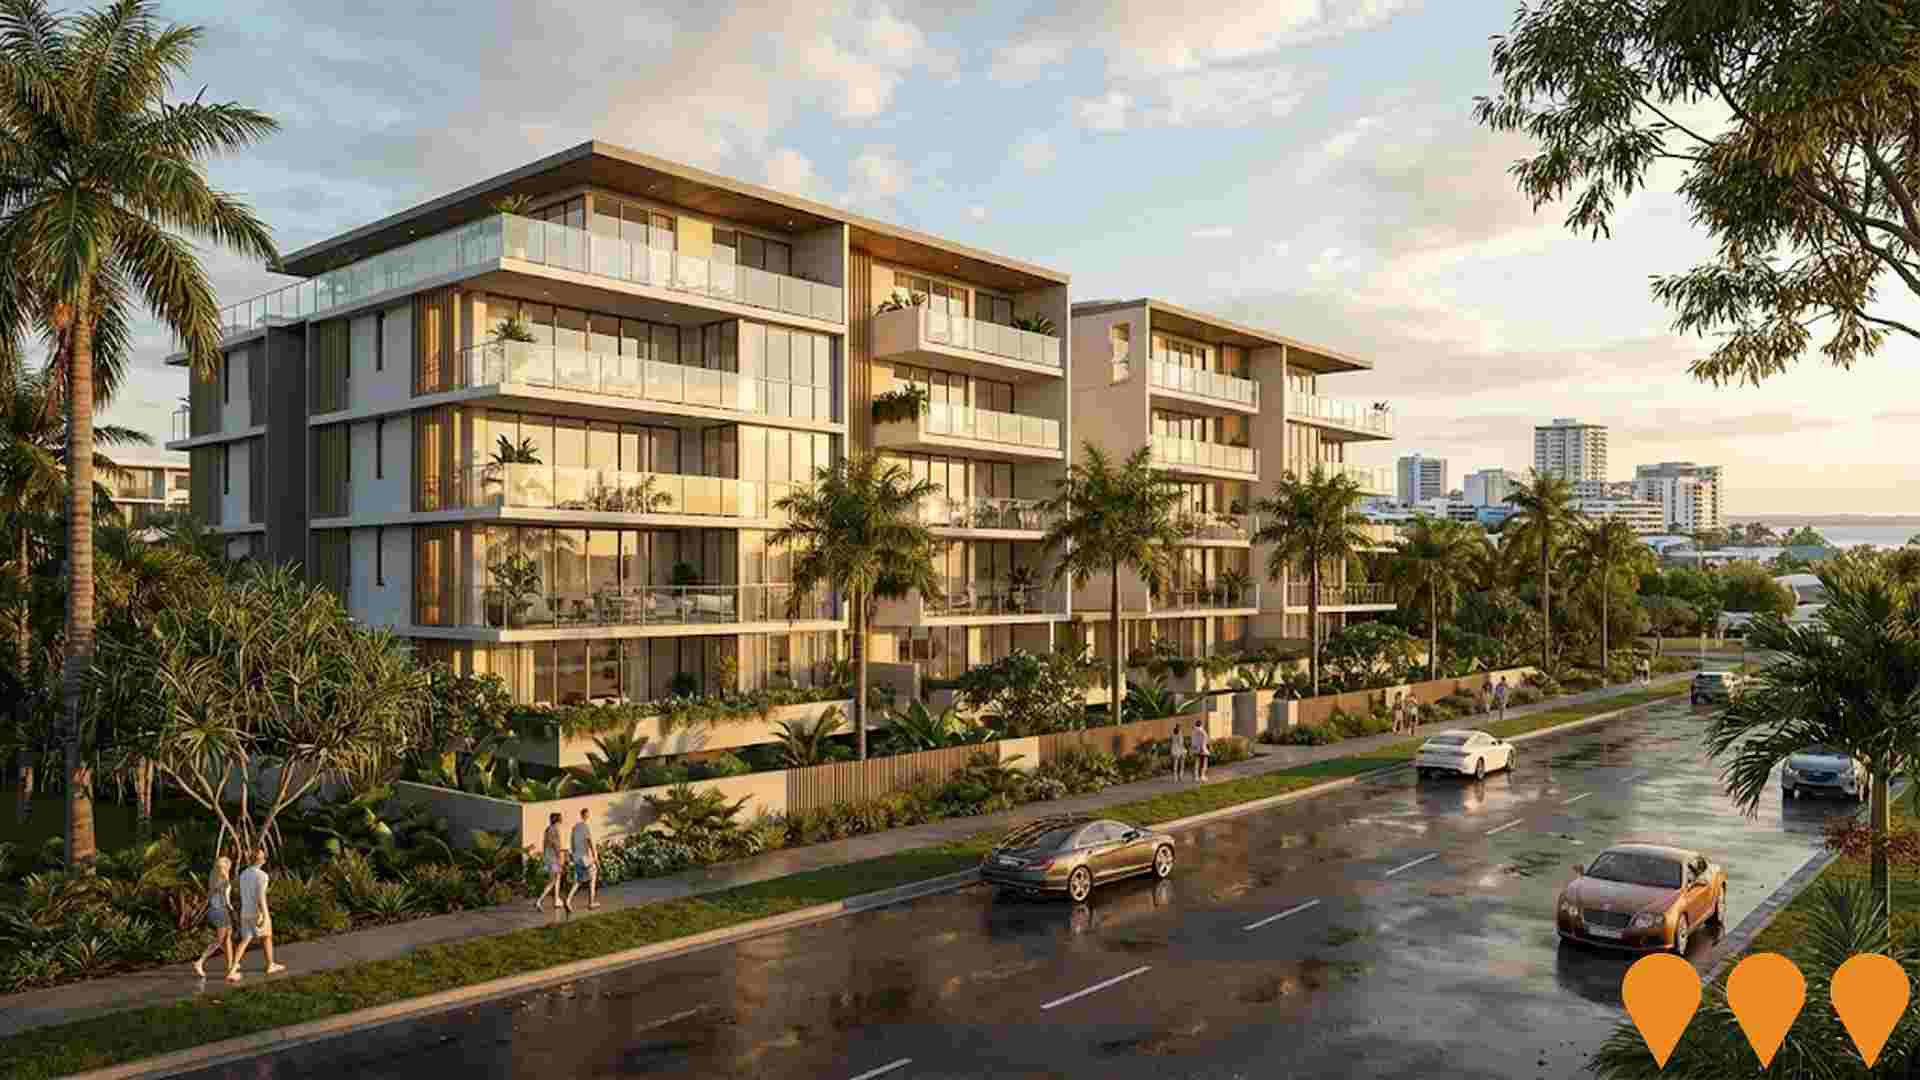
Residential Development

Frances Bay Mooring Basin lock upgrade
Category: Ports, Marinas, Fisheries & Aquaculture
Stage: Completed | Est. Comp: 2023
Source / Links: Link 1   

The Northern Territory Government has completed a $20 million upgrade of the Frances Bay Mooring Basin lock. The upgrade includes delivering new lock doors, modernising mechanical and electrical systems, and extending the life of the asset to ensure long-term sustainability, efficiency, and safety for industries such as seafood, pearling, and charter vessels.

Ports, Marinas, Fisheries & Aquaculture

Larrakeyah Defence Precinct Redevelopment
Category: National Security
Stage: Construction | Est. Comp: N/A
Source / Links: Link 1   Link 2  

The Larrakeyah Defence Precinct Redevelopment in Darwin is a comprehensive $602 million program that includes upgrades to both Larrakeyah Barracks and HMAS Coonawarra. The project features new facilities, wharves including the new Kuru Wharf, hardstand areas, buildings, fuel facilities, and comprehensive infrastructure upgrades to support enhanced naval operations and joint military capabilities. This critical upgrade enhances the ADF's capacity to conduct operations in northern Australia and provides fuel storage and refuelling capabilities for current and projected demands.

National Security

Asti Motel Redevelopment, Packard Place
Category: Residential Development
Stage: Proposed | Est. Comp: N/A
Source / Links: Link 1   Link 2  

The project involves the development of 119 serviced apartments and residential units, reducing the number of buildings from three to two, across two buildings of 10 and 11 storeys, at the site of the demolished Asti Motel.

Residential Development

Employment

Table Chart PROFILE FAQ

Employment conditions in Larrakeyah rank among the top 10% of areas assessed nationally

Larrakeyah features a highly educated workforce, with essential services sectors well represented, an unemployment rate of just 0.6%, and 1.5% in estimated employment growth over the past year. As of December 2025, 3,145 residents are in work while the unemployment rate is 2.5% below Greater Darwin's rate of 3.1%, and workforce participation is well beyond standard (83.5% compared to Greater Darwin's 76.1%). Based on Census responses, a low 5.6% of residents were found to work from home, though Covid-19 lockdown impacts should be considered.

The key industries of employment among residents are public administration & safety, accommodation & food, and health care & social assistance. The area demonstrates a particularly notable concentration in public administration & safety, with employment levels at 1.4 times the regional average. Meanwhile, construction has a limited presence with 5.1% employment compared to 9.2% regionally. While local employment opportunities exist in the area, it appears many residents commute elsewhere for work, based on the count of Census working population to local population.

Based on AreaSearch analysis of SALM and ABS data, during the year to December 2025, employment levels increased by 1.5% and the labour force increased by 1.3%, causing the unemployment rate to fall by 0.2 percentage points. This contrasts with Greater Darwin, where employment rose by 1.3%, the labour force grew by 1.2%, and unemployment fell marginally. Jobs and Skills Australia's national employment forecasts from May-25 can offer further insight into potential future demand within Larrakeyah. These projections, covering five and ten-year periods, have been mapped against the local employment profile to estimate growth patterns. While national employment is forecast to expand by 6.6% over five years and 13.7% over ten years, growth rates differ significantly between industry sectors. Applying these industry-specific projections to Larrakeyah's employment mix suggests local employment should increase by 6.3% over five years and 13.2% over ten years (please note this is a simple weighting extrapolation for illustrative purposes and does not take into account localised population projections).

Frequently Asked Questions - Employment

What is the employment situation in the Larrakeyah SA2?
As of December 2025, the Larrakeyah SA2 has approximately 3,145 employed residents with an unemployment rate of 0.6%. This very low unemployment rate indicates a tight labour market with strong demand for workers. The area ranks in the top 25% nationally for employment performance, indicating a robust job market.
How does the Larrakeyah SA2's unemployment rate compare to the broader region?
As of December 2025, the unemployment rate in the Larrakeyah SA2 stands at 0.6%, which is 2.5 percentage points below Greater Darwin's rate of 3.1%. This lower unemployment rate suggests stronger local employment conditions. For comparison, the national unemployment rate is 4.2%.
What are the major employment sectors in the Larrakeyah SA2?
The employment landscape in the Larrakeyah SA2 is dominated by several key sectors. The largest employers are public administration & safety (26.9% of employment), accommodation & food (13.0%), and health care & social assistance (13.0%). These three sectors alone account for 52.9% of local employment, indicating significant concentration. Other significant employers include professional & technical and retail trade.
How has employment changed recently in the Larrakeyah SA2?
Over the past year to December 2025, the Larrakeyah SA2 has experienced employment growth, with total employment increasing while the labour force increased. As a result, the unemployment rate has fall. By comparison, Greater Darwin saw employment increased and its unemployment rate dropped.
What is the workforce participation rate in the Larrakeyah SA2?
The workforce participation rate in the Larrakeyah SA2 is 83.5%, which represents the proportion of working-age residents who are either employed or actively seeking work. This high participation rate indicates strong workforce engagement and economic vitality. The local rate leading the Greater Darwin average of 76.1%, indicating stronger workforce attachment in the local area.
Which industries are over-represented in the Larrakeyah SA2's employment market?
The larrakeyah sa2 shows notable specialization in public administration & safety, which employs 26.9% of the local workforce compared to 19.5% regionally. This moderate specialization indicates some local strength in the sector. The area also shows above-average employment in 1 other sectors, contributing to a distinctive economic profile.
What are the employment growth prospects for the Larrakeyah SA2?
Based on Jobs and Skills Australia projections applied to the Larrakeyah SA2's industry mix, employment is expected to grow by 6.3% over the next five years and 13.2% over ten years. This compares to national growth expectations of 6.6% over five years. Steady growth is anticipated across multiple sectors, providing diverse employment opportunities.
How does the job market in the Larrakeyah SA2 compare nationally?
The larrakeyah sa2's employment market shows strong performance nationally, ranking in the top 25% of areas assessed by AreaSearch. This indicates robust employment conditions and economic vitality compared to other regions. Recent job advertisement trends show the broader employment region saw a 14.2% decline, ranking 36.0th out of 37 regions nationally.
What employment opportunities exist for skilled workers in the Larrakeyah SA2?
Skilled workers will find good opportunities in the Larrakeyah SA2, with skilled sectors accounting for 28.4% of employment. Key sectors for skilled workers include health care & social assistance (13.0%), professional & technical (7.2%), and education & training (5.7%). With projected employment growth of 6.3% over five years, demand for skilled workers is expected to remain strong.

Income

Table Chart PROFILE FAQ

The economic profile demonstrates exceptional strength, placing the area among the top 10% nationally based on comprehensive AreaSearch income analysis

The Larrakeyah SA2 shows a median taxpayer income of $73,028 and an average of $88,849 according to the latest postcode level ATO data aggregated by AreaSearch for FY-23. This is extremely high nationally, contrasting with Greater Darwin's median income of $66,956 and average income of $77,199. Based on Wage Price Index growth of 8.44% since FY-23, current estimates would be approximately $79,192 (median) and $96,348 (average) as of September 2025. Census 2021 income data shows household, family and personal incomes all rank highly in Larrakeyah, between the 86th and 94th percentiles nationally. The earnings profile shows the $1,500 - 2,999 bracket dominates with 41.1% of residents (1,808 people), reflecting patterns seen at regional levels where 36.7% similarly occupy this range. Economic strength emerges through 36.9% of households achieving high weekly earnings exceeding $3,000, supporting elevated consumer spending. Housing accounts for 14.2% of income while strong earnings rank residents within the 87th percentile for disposable income and the area's SEIFA income ranking places it in the 8th decile.

Frequently Asked Questions - Income

What is the median taxable income in the Larrakeyah SA2?
Based on Wage Price Index adjustments to September 2025, the estimated median taxable income in the Larrakeyah SA2 is approximately $79,192. The official ATO data from FY-23 recorded a median of $73,028.
What is the average taxable income in the Larrakeyah SA2?
Based on Wage Price Index adjustments to September 2025, the estimated average taxable income in the Larrakeyah SA2 is approximately $96,348. The official ATO data from FY-23 recorded an average of $88,849.
How does the median taxable income in the Larrakeyah SA2 compare to the region?
Based on Wage Price Index adjustments to September 2025, the estimated median taxable income in the Larrakeyah SA2 is approximately $79,192 compared to $72,607 in Greater Darwin. The official ATO data from FY-23 shows $73,028 and $66,956 respectively.
How does the average taxable income in the Larrakeyah SA2 compare to the region?
Based on Wage Price Index adjustments to September 2025, the estimated average taxable income in the Larrakeyah SA2 is approximately $96,348 compared to $83,715 in Greater Darwin. The official ATO data from FY-23 shows $88,849 and $77,199 respectively.
What are the main income cohorts in the Larrakeyah SA2 according to the 2021 Census?
As per the 2021 Census, the income bracket containing the largest proportion (~41.1% / 1,808 persons) of the Larrakeyah SA2's population is the $1,500 - 2,999 cohort.
How do the main income cohorts in the Larrakeyah SA2 compare to the region?
The largest income cohort in the Larrakeyah SA2 is the $1,500 - 2,999 group, representing about 41.1% of the population. In comparison, Greater Darwin's largest income cohort is the $1,500 - 2,999 group, representing 36.7% of its population, according to the 2021 Census.
What is the median household income in the Larrakeyah SA2 according to the 2021 Census?
The 2021 Census data indicates that the median household income in the Larrakeyah SA2 is $2,372/wk.
What is the median family income in the Larrakeyah SA2 according to the 2021 Census?
According to the 2021 Census, the median family income in the Larrakeyah SA2 is $2,695/wk.
What is the median personal income in the Larrakeyah SA2 according to the 2021 Census?
The 2021 Census shows that the median personal income in the Larrakeyah SA2 is $1,297/wk.
How does the Larrakeyah SA2's income rank nationally?
The Larrakeyah SA2 shows a median taxpayer income of $73,028 and an average of $88,849 according to the latest postcode level ATO data aggregated by AreaSearch for FY-23. This is among the highest in Australia, contrasting with Greater Darwin's median income of $66,956 and average income of $77,199. Based on Wage Price Index growth of 8.44% since FY-23, current estimates would be approximately $79,192 (median) and $96,348 (average) as of September 2025.
What is the disposable income in the Larrakeyah SA2?
The estimated disposable income in the Larrakeyah SA2 is $8,822 per year according to AreaSearch analysis.
How does the Larrakeyah SA2's disposable income compare to the region?
The larrakeyah sa2's disposable income is $8,822 compared to $8,044 for Greater Darwin, based on AreaSearch analysis.

Housing

Table Chart PROFILE FAQ

Larrakeyah features a more urban dwelling mix with significant apartment living, with a higher proportion of rental properties than the broader region

Dwelling structure within Larrakeyah, as evaluated at the latest Census, comprised 22.0% houses and 78.0% other dwellings (semi-detached, apartments, 'other' dwellings), in comparison to Darwin metro's 63.5% houses and 36.5% other dwellings. Meanwhile, the level of home ownership within Larrakeyah was lagging that of Darwin metro, at 15.9%, with the remainder of dwellings either mortgaged (17.1%) or rented (67.1%). The median monthly mortgage repayment in the area was well below the Darwin metro average at $1,800, while the median weekly rent figure was recorded at $395, compared to Darwin metro's $2,100 and $385. Nationally, Larrakeyah's mortgage repayments are lower than the Australian average of $1,863, while rents are exceeding the national figure of $375.

Frequently Asked Questions - Housing

What percentage of homes are owned vs rented in the Larrakeyah SA2?
In the Larrakeyah SA2, 15.9% of homes are owned outright, 17.1% are owned with a mortgage, and 67.1% are rented.
What percentage of dwellings in the Larrakeyah SA2 are houses?
According to the latest data, 22.0% of dwellings in the Larrakeyah SA2 are houses.
What percentage of dwellings in the Larrakeyah SA2 are apartments or units?
In the Larrakeyah SA2, 66.3% of dwellings are apartments or units, with an additional 11.5% being semi-detached dwellings.
What is the level of outright home ownership in the Larrakeyah SA2?
Outright home ownership in the Larrakeyah SA2 stands at 15.9%, compared to 17.9% in Greater Darwin.
What is the median monthly mortgage repayment in the Larrakeyah SA2?
The median monthly mortgage repayment in the Larrakeyah SA2 is $1,800, compared to $2,100 in Greater Darwin.
What is the median weekly rent in the Larrakeyah SA2?
The median weekly rent in the Larrakeyah SA2 is $395, compared to $385 in Greater Darwin.
What is the distribution of rental prices in the Larrakeyah SA2?
In the Larrakeyah SA2, 5.1% of rentals are $0-149/week, 27.2% are $150-349/week, 59.0% are $350-649/week, 7.0% are $650-949/week, and 1.6% are $950+/week.
What is the average monthly housing cost in the Larrakeyah SA2?
The aggregate monthly housing cost in the Larrakeyah SA2 is $1,456, which represents the average monthly cost across all housing types.
What percentage of income do residents spend on housing in the Larrakeyah SA2?
In the Larrakeyah SA2, households with mortgages typically spend 17.5% of their income on mortgage repayments, while renters spend 16.7% of their income on rent.
How crowded are homes in the Larrakeyah SA2?
The average persons per bedroom ratio in the Larrakeyah SA2 is 0.9, indicating the level of household density.
How does housing affordability in the Larrakeyah SA2 compare to the region?
Housing affordability in the Larrakeyah SA2 shows mortgage holders spending 17.5% of income on repayments (vs 21.9% regionally), while renters spend 16.7% of income on rent (vs 17.4% regionally).
What types of dwellings are most common in the Larrakeyah SA2?
The dwelling mix in the Larrakeyah SA2 consists of 22.0% detached houses, 11.5% semi-detached dwellings, 66.3% apartments, and 0.2% other dwelling types.
What is the weighted average housing cost based on tenure mix in the Larrakeyah SA2?
Based on the area's tenure composition, the weighted average monthly housing cost is approximately $1,455. This accounts for outright owners paying no housing costs, mortgage holders paying $1,800/month, and renters paying $1,710/month.
How affordable is housing in the Larrakeyah SA2 relative to local incomes?
Housing in Larrakeyah consumes approximately 14.2% of median household income ($10,271 monthly), indicating costs are highly affordable. The generally accepted benchmark is that housing should not exceed 30% of household income.
How do proposed developments compare to existing housing types in the Larrakeyah SA2?
Development activity remains minimal in this area with fewer than 5 recent applications recorded.

Household Composition

Table Chart PROFILE FAQ

Larrakeyah features high concentrations of group households, with a lower-than-average median household size

Family households dominate at 61.4% of all households, comprising 24.8% couples with children, 31.8% couples without children, and 4.2% single parent families. Non-family households make up the remaining 38.6%, with lone person households at 28.4% and group households comprising 10.1% of the total. The median household size of 2.3 people is smaller than the Greater Darwin average of 2.6.

Frequently Asked Questions - Households

How many households are in the Larrakeyah SA2?
As of the 2021 Census, the Larrakeyah SA2 had 1,439 households. Based on population growth patterns, this has grown by approximately 11.6% to an estimated 1,606 households today.
What is the typical household size?
The median household size in the Larrakeyah SA2 is 2.3 people. This compares to 2.6 in Greater Darwin and reflects the area's household composition mix.
What types of households are most common?
Family households dominate at 61.4% of all households. The remaining households consist of lone person households (28.4%), group households (10.1%), and other household types (0.0%).
How are families structured in the area?
Among the 883 family households, 24.8% are couples with children, 31.8% are couples without children at home, and 4.2% are single parent families. This mix shapes local demand for schools, family services, and housing types.
How does the Larrakeyah SA2 compare to regional household patterns?
Compared to Greater Darwin, the Larrakeyah SA2 shows distinct household patterns. Conversely, family households are under-represented at 61.4% compared to the regional 71.0%. This higher proportion of single-person households drives demand for smaller dwellings and different community services.
What is the average family size?
Families in the Larrakeyah SA2 have an average of 1.0 children, slightly below the Greater Darwin average of 1.4. This influences local demand for child-related services and larger family homes.
What are the marriage patterns in the Larrakeyah SA2?
Marriage patterns reveal 42.5% of the adult population are currently married, while 45.2% have never married. This compares to 42.3% married and 43.1% never married across Greater Darwin.
How significant are single-person households?
Single-person households represent 28.4% of all households in the Larrakeyah SA2, similar to the regional average of 23.4%. This affects demand for smaller dwellings and single-person accommodation.
Are shared living arrangements common?
Group households (unrelated people sharing) account for 10.1% of households, well below the Greater Darwin average of 5.6%. This low rate suggests limited student or young professional shared accommodation.
Loading household composition data...

Local Schools & Education

Table Chart PROFILE FAQ

Educational achievement in Larrakeyah places it within the top 10% nationally, reflecting strong academic performance and high qualification levels across the community

Educational attainment in Larrakeyah significantly surpasses broader benchmarks, with 48.9% of residents aged 15+ holding university qualifications compared to 27.3% in NT and 30.4% in Australia. This substantial educational advantage positions the area strongly for knowledge-based opportunities. Bachelor degrees lead at 29.7%, followed by postgraduate qualifications (14.6%) and graduate diplomas (4.6%). Trade and technical skills feature prominently, with 28.5% of residents aged 15+ holding vocational credentials, including advanced diplomas (11.7%) and certificates (16.8%).

Educational participation is notably high, with 32.3% of residents currently enrolled in formal education. This includes 9.4% in primary education, 9.3% in tertiary education, and 4.1% pursuing secondary education.

Frequently Asked Questions - Education

What percentage of people in the Larrakeyah SA2 have university qualifications?
48.9% of people aged 15 and over in the Larrakeyah SA2 have university qualifications, compared to 31.3% in the broader region.
What percentage of people in the Larrakeyah SA2 have no formal qualifications?
22.7% of people aged 15 and over in the Larrakeyah SA2 have no formal qualifications, compared to 32.6% regionally.
How does the Larrakeyah SA2's education level compare to national averages?
The larrakeyah sa2 ranks in the 94th percentile nationally for education based on AreaSearch's analysis of qualification and performance metrics.
What types of qualifications are most common in the Larrakeyah SA2?
The most common qualifications in the Larrakeyah SA2 are: Bachelor Degree (29.7%), Certificate (16.8%), Postgraduate (14.6%).
What proportion of the Larrakeyah SA2's population is currently attending educational institutions?
32.3% of the population in the Larrakeyah SA2 is currently engaged in formal education, with 9.4% in primary school, 4.1% in secondary school, 9.3% at university.
What is the ICSEA score for schools in the Larrakeyah SA2?
The average ICSEA (Index of Community Socio-Educational Advantage) score for schools in the Larrakeyah SA2 is 1083, indicating average socio-educational advantage (national average is 1000).
How many schools are located within the Larrakeyah SA2?
There are 1 schools within the Larrakeyah SA2, with a combined enrollment of approximately 465 students.
What types of schools are available in the Larrakeyah SA2?
The larrakeyah sa2 includes 1 primary school.

Schools Detail

Nearby Services & Amenities

PROFILE FAQ

Transport

Table Chart PROFILE FAQ

Transport servicing is moderate compared to other areas nationally based on assessment of service frequency, route connectivity and accessibility

Public transport analysis reveals 8 active transport stops operating within Larrakeyah, comprising a mix of buses. These stops are serviced by 30 individual routes, collectively providing 1,353 weekly passenger trips. Transport accessibility is rated as good, with residents typically located 202 meters from the nearest transport stop. As a primarily residential area, most residents commute outward; the car remains the dominant mode at 73%, with 10% walking and 6% by bus. Vehicle ownership averages 1.2 per dwelling, which is below the regional average. A relatively low 5.6% of residents work from home (2021 Census; may reflect COVID-19 conditions).

Service frequency averages 193 trips per day across all routes, equating to approximately 169 weekly trips per individual stop.

Frequently Asked Questions - Transport

How many public transport stops are in Larrakeyah?
There are 8 public transport stops within the Larrakeyah SA2.
How frequent are the transport services in Larrakeyah?
the Larrakeyah SA2 has 1,353 weekly trips across 30 routes, averaging 193 trips per day.
How far are residents from public transport in Larrakeyah?
On average, residential properties are 202 meters from the nearest transport stop.

Transport Stops Detail

Health

Table Chart PROFILE FAQ

Larrakeyah's residents boast exceedingly positive health performance metrics with very low prevalence of common health conditions across all age groups

Health outcomes data demonstrates outstanding results across Larrakeyah, based on AreaSearch's assessment of mortality rates and chronic condition prevalence. There is a very low prevalence of common health conditions across all age groups, and the rate of private health cover is exceptionally high at approximately 65% of the total population (2,868 people). This compares to 57.8% across Greater Darwin and a national average of 55.7%.

The most common medical conditions in the area were found to be arthritis and asthma, impacting 4.6% and 4.3% of residents, respectively, while 82.9% declared themselves as completely clear of medical ailments compared to 77.1% across Greater Darwin. The area has 10.8% of residents aged 65 and over (474 people). Health outcomes among seniors are particularly strong, with national rankings broadly in line with the general population.

Frequently Asked Questions - Health

How many people in the Larrakeyah SA2 have private health insurance?
Around 65.2% of people in the Larrakeyah SA2 are covered by private health insurance, which compares to 57.8% in the broader region of Greater Darwin.
What percentage of the population requires ongoing medical assistance in the Larrakeyah SA2?
In the Larrakeyah SA2, 1.6% of the population is identified as requiring ongoing medical assistance. This figure is slightly different from the regional average, where 3.7% of people in Greater Darwin require similar assistance.
How prevalent is asthma in the Larrakeyah SA2?
4.3% of people in the Larrakeyah SA2 are diagnosed with asthma. In comparison, 6.1% of the population across Greater Darwin is affected by asthma.
What percentage of people have diabetes in the Larrakeyah SA2?
Diabetes affects 2.6% of the the Larrakeyah SA2 population, while in the surrounding region, 3.7% of people are diagnosed with diabetes.
What is the percentage of people with heart disease in the Larrakeyah SA2?
2.1% of people in the Larrakeyah SA2 have heart disease. Across the region of Greater Darwin, 2.5% of the population is affected by heart disease.
How does the Larrakeyah SA2 compare to the region in terms of overall private health coverage?
In the Larrakeyah SA2, 65.2% of the population are estimated to have private health insurance. Comparatively, Greater Darwin sees an estimated private health coverage rate of 57.8%.

Cultural Diversity

Table Chart PROFILE FAQ

Larrakeyah was found to be more culturally diverse than the vast majority of local markets in Australia, upon assessment of a range of language and cultural background related metrics

Larrakeyah scores highly on cultural diversity, with 32.0% of its population speaking a language other than English at home and 40.0% born overseas. The main religion in Larrakeyah is Christianity, which makes up 38.2% of the population. However, the most apparent overrepresentation is in Hinduism, which comprises 11.6% of the population, substantially higher than the Greater Darwin average of 4.2%.

In terms of ancestry (country of birth of parents), the top three represented groups in Larrakeyah are English, comprising 23.6% of the population, Australian, comprising 18.5% of the population, and Other, comprising 17.3% of the population. Additionally, there are notable divergences in the representation of certain other ethnic groups: Filipino is notably overrepresented at 3.2% of Larrakeyah (vs 3.8% regionally), Vietnamese at 1.2% (vs 0.8%) and Korean at 0.6% (vs 0.2%).

Frequently Asked Questions - Diversity

What is the level of cultural diversity in the Larrakeyah SA2?
Larrakeyah scores quite highly on cultural diversity, with 32.0% of its population speaking a language other than English at home and 40.0% born overseas.
What is the most common religion in the Larrakeyah SA2?
The main religion in Larrakeyah was found to be Christianity, which makes up 38.2% of people in Larrakeyah. However, the most apparent overrepresentation was in Hinduism, which comprises 11.6% of the population, substantially higher than the Greater Darwin average of 4.2%.
What are the top countries of origin in the Larrakeyah SA2?
In terms of ancestry (country of birth of parents), the top three represented groups in Larrakeyah are English, comprising 23.6% of the population, Australian, comprising 18.5% of the population, and Other, comprising 17.3% of the population. Additionally, there are notable divergences in the representation of certain other ethnic groups: Filipino is notably overrepresented at 3.2% of Larrakeyah (vs 3.8% regionally), Vietnamese at 1.2% (vs 0.8%) and Korean at 0.6% (vs 0.2%).
How does the percentage of people born overseas compare to the regional average?
40.0% of the the Larrakeyah SA2 population was born overseas, compared to 30.3% regionally.
What percentage of the the Larrakeyah SA2 population speaks a language other than English at home?
32.0% of the population in the Larrakeyah SA2 speaks a language other than English at home, compared to 26.1% in the wider region.
How many people in the Larrakeyah SA2 identify as Australian Aboriginal?
2.2% of the the Larrakeyah SA2 population identifies as Australian Aboriginal, compared to 7.0% in the region.
What is the citizenship status of the population in the Larrakeyah SA2?
66.3% of the the Larrakeyah SA2 population holds citizenship, compared to 77.8% in the wider region.

Age

Table Chart PROFILE FAQ

Larrakeyah's young demographic places it in the bottom 15% of areas nationwide

At 33 years, Larrakeyah's median age is comparable to the Greater Darwin average of 34 and is substantially under the Australian median of 38. Relative to Greater Darwin, Larrakeyah has a higher concentration of 25 - 34 residents (25.6%) but fewer 5 - 14 year-olds (9.2%). This 25 - 34 concentration is well above the national 14.4%. Post-2021 Census data shows the 35 to 44 age group has grown from 16.2% to 18.3% of the population, while the 75 to 84 cohort increased from 2.4% to 3.7%. Conversely, the 15 to 24 cohort has declined from 13.7% to 11.9% and the 0 to 4 group dropped from 5.6% to 4.5%. Demographic modeling suggests Larrakeyah's age profile will evolve significantly by 2041. The 45 to 54 age cohort is projected to grow steadily, expanding by 162 people (34%) from 479 to 642. Meanwhile, the 0 to 4 cohort grows by a modest 6% (11 people).

Frequently Asked Questions - Age

What is the median age in the Larrakeyah SA2?
According to the latest data, the median age in the Larrakeyah SA2 is 33 years.
How does the Larrakeyah SA2's median age compare to broader areas?
At 33 years, Larrakeyah is comparable to the Greater Darwin average (34 years) and 5 years younger than the national average (38 years).
What age groups are over-represented in the Larrakeyah SA2?
The most over-represented age group in the Larrakeyah SA2 compared to the Greater Darwin region is the 25 - 34 group, making up 25.6% of the population.
What age groups are under-represented in the Larrakeyah SA2?
The most under-represented age group in the Larrakeyah SA2 compared to the Greater Darwin region is the 5 - 14 group, making up 9.2% of the population.
Are there age groups with notable population variances?
Yes, certain age groups in the Larrakeyah SA2 show significant variance compared to the Greater Darwin region. The most over-represented age group is 25-34 year-olds (25.6% vs 18.5%).
What is the percentage of children (0-14 years) in the Larrakeyah SA2?
The percentage of children aged 0-14 years in the Larrakeyah SA2 is 13.6%.
What is the percentage of older people (65+ years) in the Larrakeyah SA2?
The percentage of people aged 65 and over in the Larrakeyah SA2 is 10.8%.

Nearby Areas