Chart Color Schemes
This analysis uses Suburbs and Localities (SAL) boundaries, which can materially differ from Statistical Areas (SA2) even when sharing the same name.
SAL boundaries are defined by Australia Post and the Australian Bureau of Statistics to represent commonly-known suburb names used in postal addresses.
Statistical Areas (SA2) are designed for census data collection and may combine multiple suburbs or use different geographic boundaries. For comprehensive analysis, consider reviewing both boundary types if available.
est. as @ -- *
2021 Census | -- people





Sales Activity

Curious about local property values? Filter the chart to assess the volume and appreciation (including resales) trends and regional comparisons, or scroll to the map below view this information at an individual property level.
Find a Recent Sale

Sales Detail
Population
Darwin City lies within the top quartile of areas nationally for population growth performance according to AreaSearch analysis of recent, and medium to long-term trends
According to evaluations of ABS demographic releases for the wider region alongside newly verified residential addresses identified by AreaSearch post-Census, the suburb of Darwin City has a residency count estimated at 8,597 as of May 2026. This represents an expansion of 1,448 people (20.3%) from the 2021 Census, which documented a total of 7,149 individuals. The adjustment is determined from the current resident population of 8,597, calculated by AreaSearch using the most recent ABS ERP update (June 2025) and incorporating an additional 69 validated new addresses registered since the Census. This population volume translates to a density of 2,712 persons per square kilometer, placing the suburb of Darwin City in the top quartile of all Australian areas analyzed by AreaSearch. The suburb of Darwin City recorded a 20.3% expansion rate post-2021, outstripping the national benchmark of 9.3% and regional averages to stand out as a local growth pacesetter. This upward trajectory was largely fueled by net overseas migration, which accounted for roughly 86.0% of the aggregate demographic gains over recent timeframes.
Projections utilize ABS and Geoscience Australia forecasts for each SA2 zone published in 2024 with a 2022 baseline. For locations without specific data coverage, and to formulate growth trajectories past 2032, cohort-based growth rates by age are applied, sourced from the 2023 ABS Greater Capital Region projections built on 2022 data. Future trends point to an above-median expansion compared to national benchmarks, with the suburb of Darwin City expected to add 1,766 residents by 2041 based on compiled SA2 models, indicating an overall growth of 20.5% across the 16 years.
Frequently Asked Questions - Population
Development
Recent residential development output has been above average within Darwin City when compared nationally
An analysis of ABS building approvals allocated to the area shows that the suburb of Darwin City has averaged roughly 9 approved dwellings annually, totaling an estimated 48 residential approvals over the 5 financial years spanning FY-21 to FY-25, with no approvals recorded during the current FY-26 period. Because approximately 20.6 new residents relocated to the area for every completed dwelling during those 5 financial years (between FY-21 and FY-25), demand is running far ahead of supply, typically driving up purchase competition and pricing, while newly approved builds carry a mean estimated construction cost of $417,000—moderately higher than the regional baseline—pointing to a focus on premium projects. Furthermore, commercial approvals worth $93,000 have been logged in the current financial year, underlining a dominant focus on residential activity.
Relative to Greater Darwin, the suburb of Darwin City registers 56.0% higher per capita residential building activity, giving home buyers a broader range of options. Nevertheless, this rate remains below the national standard, reflecting the established state of the locality and pointing to potential zoning constraints. All newly approved residential units consisted of multi-residential formats like apartments or townhouses. This concentration on compact home designs provides cost-effective entry opportunities and appeals to down-sizers, real estate investors, and first home buyers. The ratio of approximately 343 people for every approved dwelling indicates capacity for future development.
Looking forward, the suburb of Darwin City is set to add 1,766 new residents by 2041, measured from the most recent AreaSearch quarterly release. If current building rates do not accelerate, residential supply is likely to fall behind population growth, which could increase buyer competition and support upward pressure on values.
Frequently Asked Questions - Development
Development applications around Darwin City
Loading development applications…
| Lodged | Address | Description | Type | Distance | Status |
|---|
SOURCE: Planning portals and council registers, compiled by AreaSearch. Distance & bearing measured from the suburb midpoint.
Infrastructure
Darwin City has emerging levels of nearby infrastructure activity, ranking in the 29thth percentile nationally
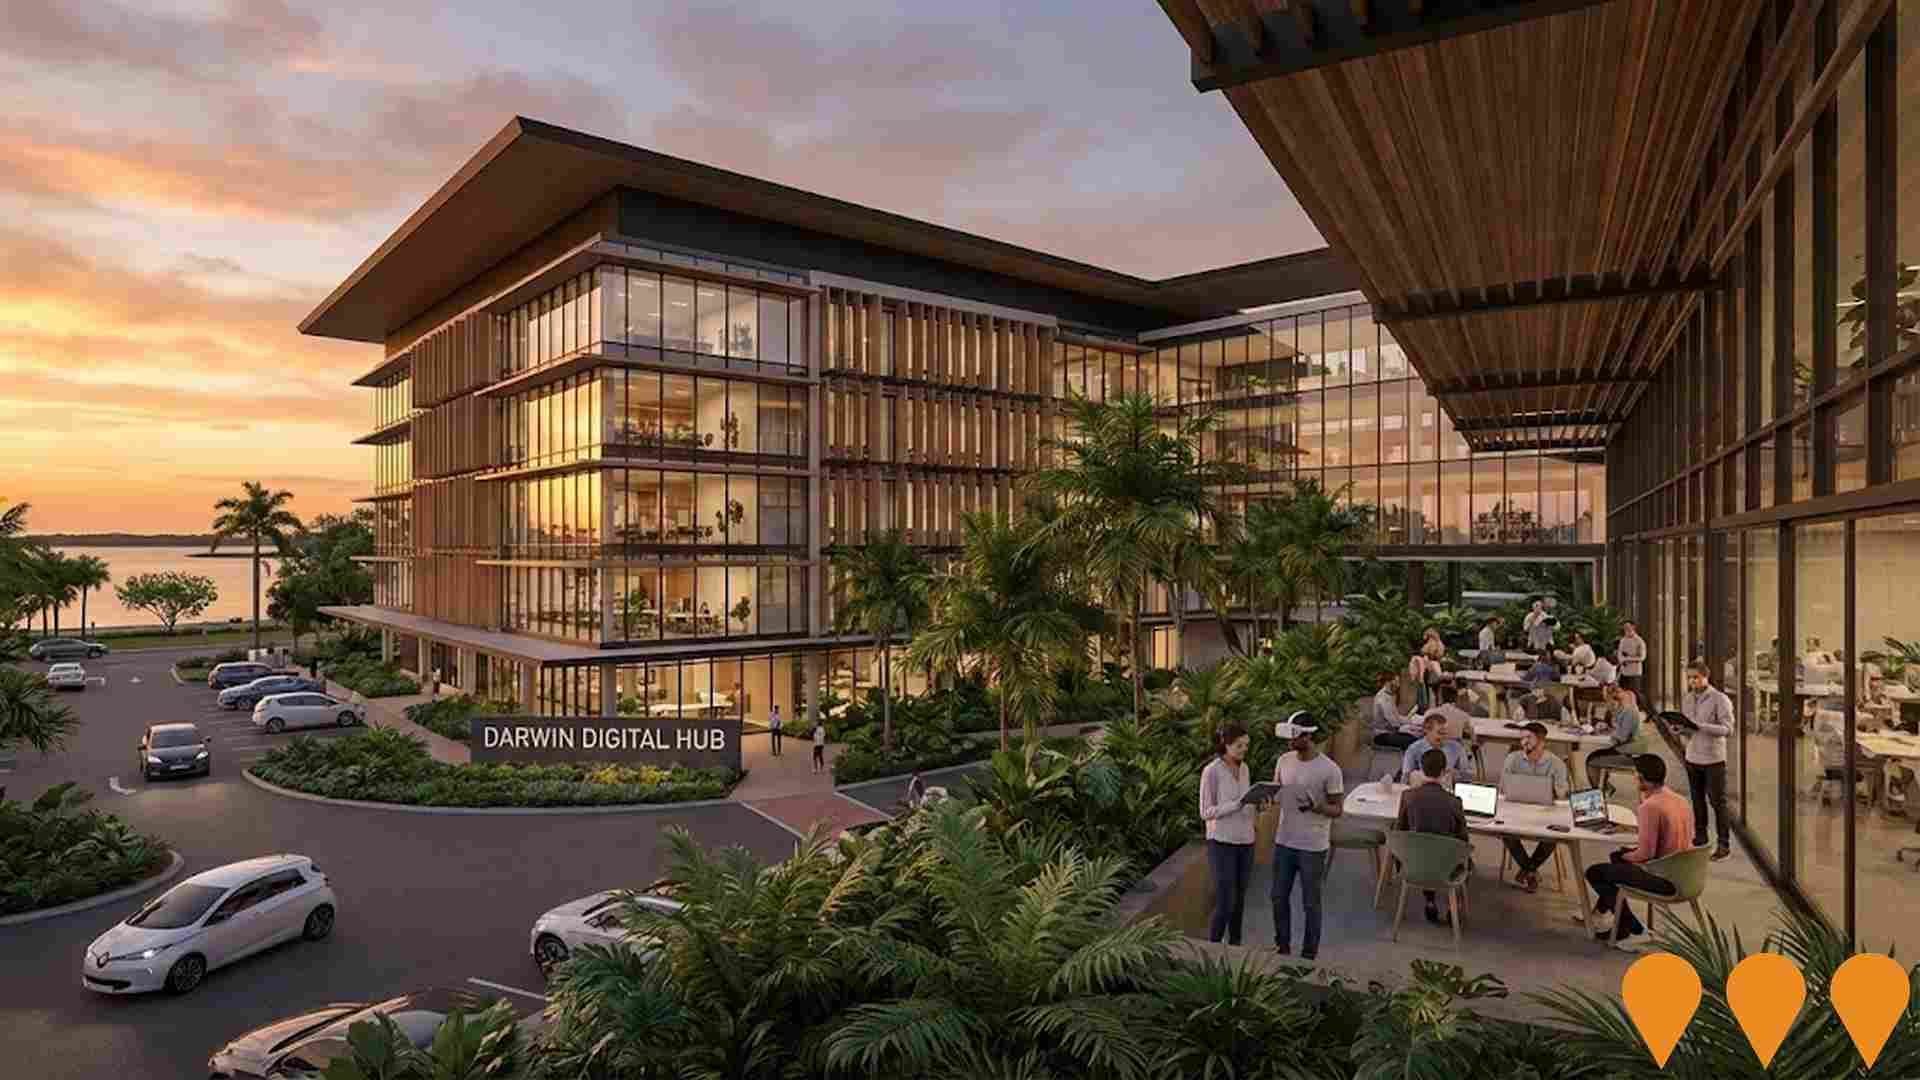
Local performance is strongly shaped by modifications to regional infrastructure, key projects, and local planning policies. AreaSearch has identified a total of 24 projects positioned to influence the area. Key developments include Darwin Galleria (Former Coles Site Redevelopment), Civic and State Square Precinct Revitalisation, Mantra on the Esplanade Hotel Refurbishment & Apartment Addition, and Darwin Digital Hub, with the list below detailing the most relevant undertakings.
Professional plan users can use the search below to filter and access additional projects.
INFRASTRUCTURE SEARCH
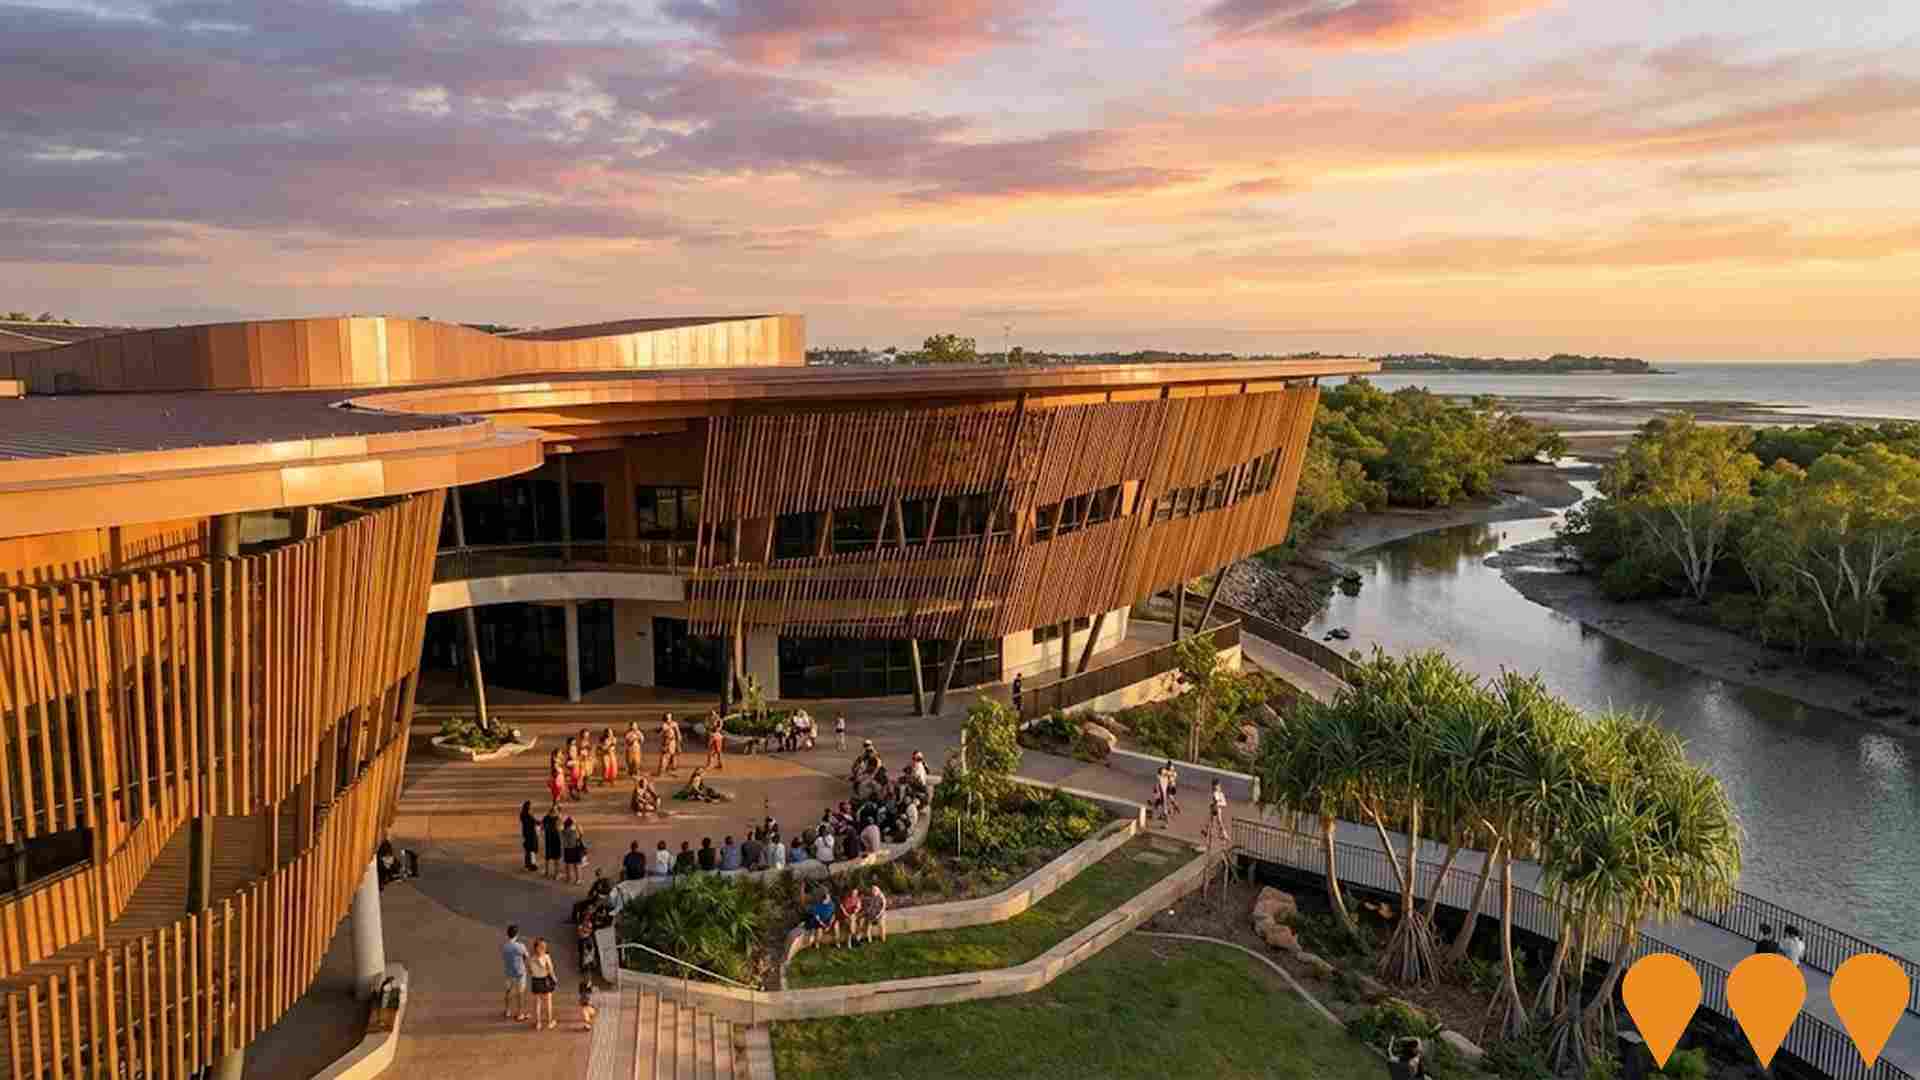
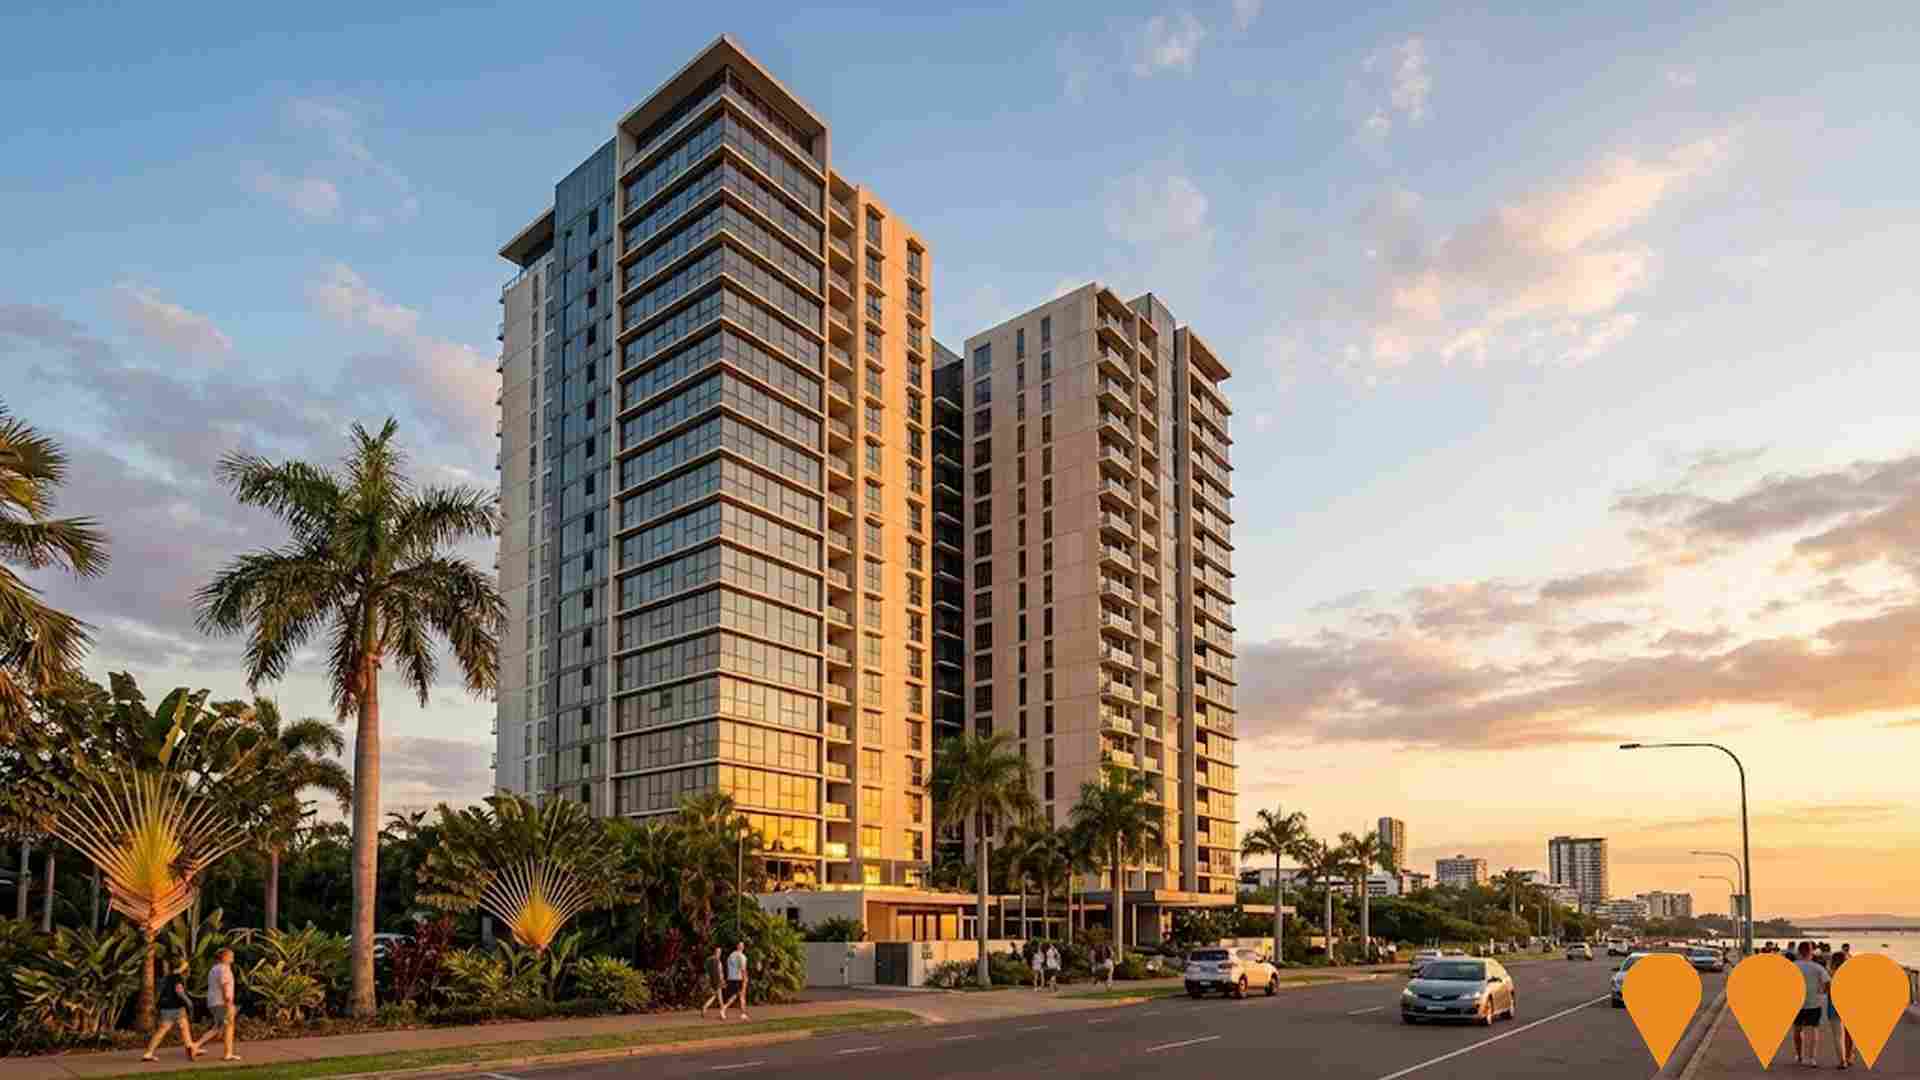
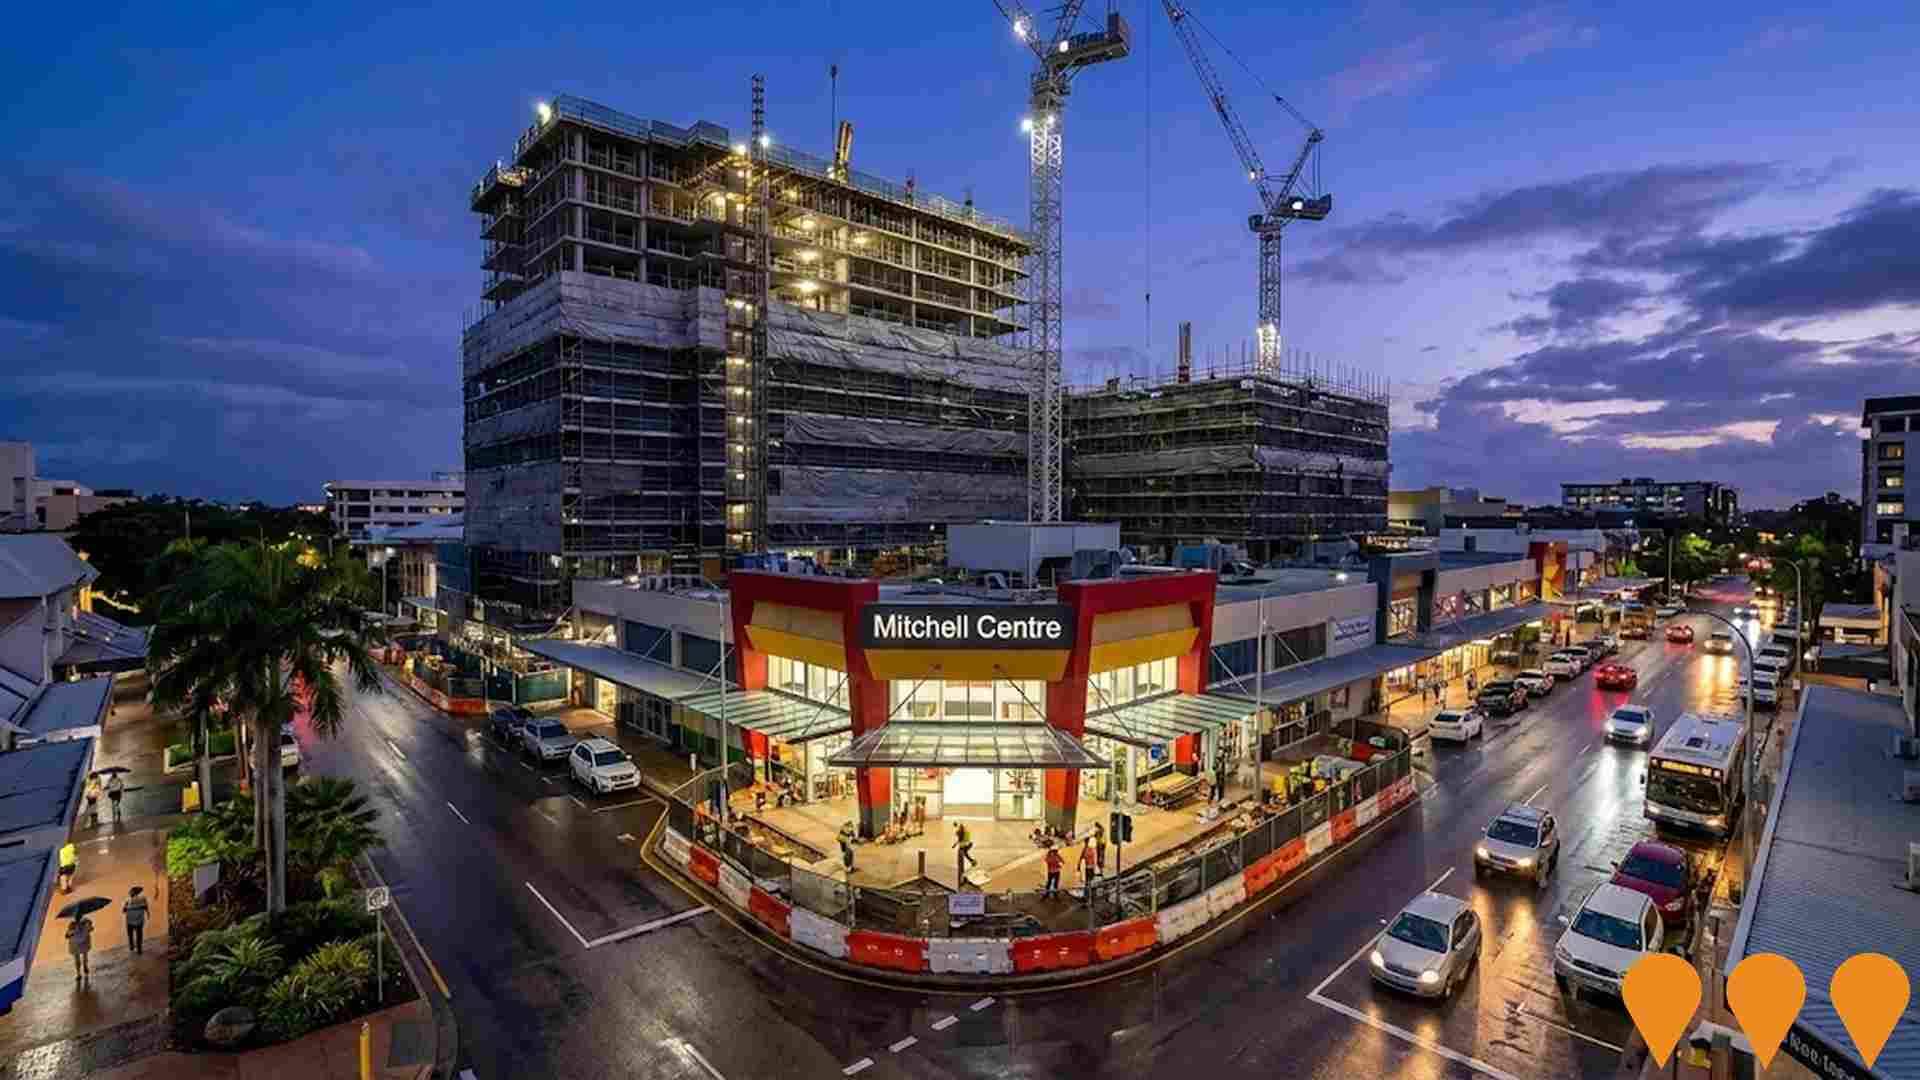
 Denotes AI-based impression for illustrative purposes only, not to be taken as definitive under any circumstances. Please follow links and conduct other investigations from the project's source for actual imagery. Developers and project owners wishing us to use original imagery please Contact Us and we will do so.
Frequently Asked Questions - Infrastructure
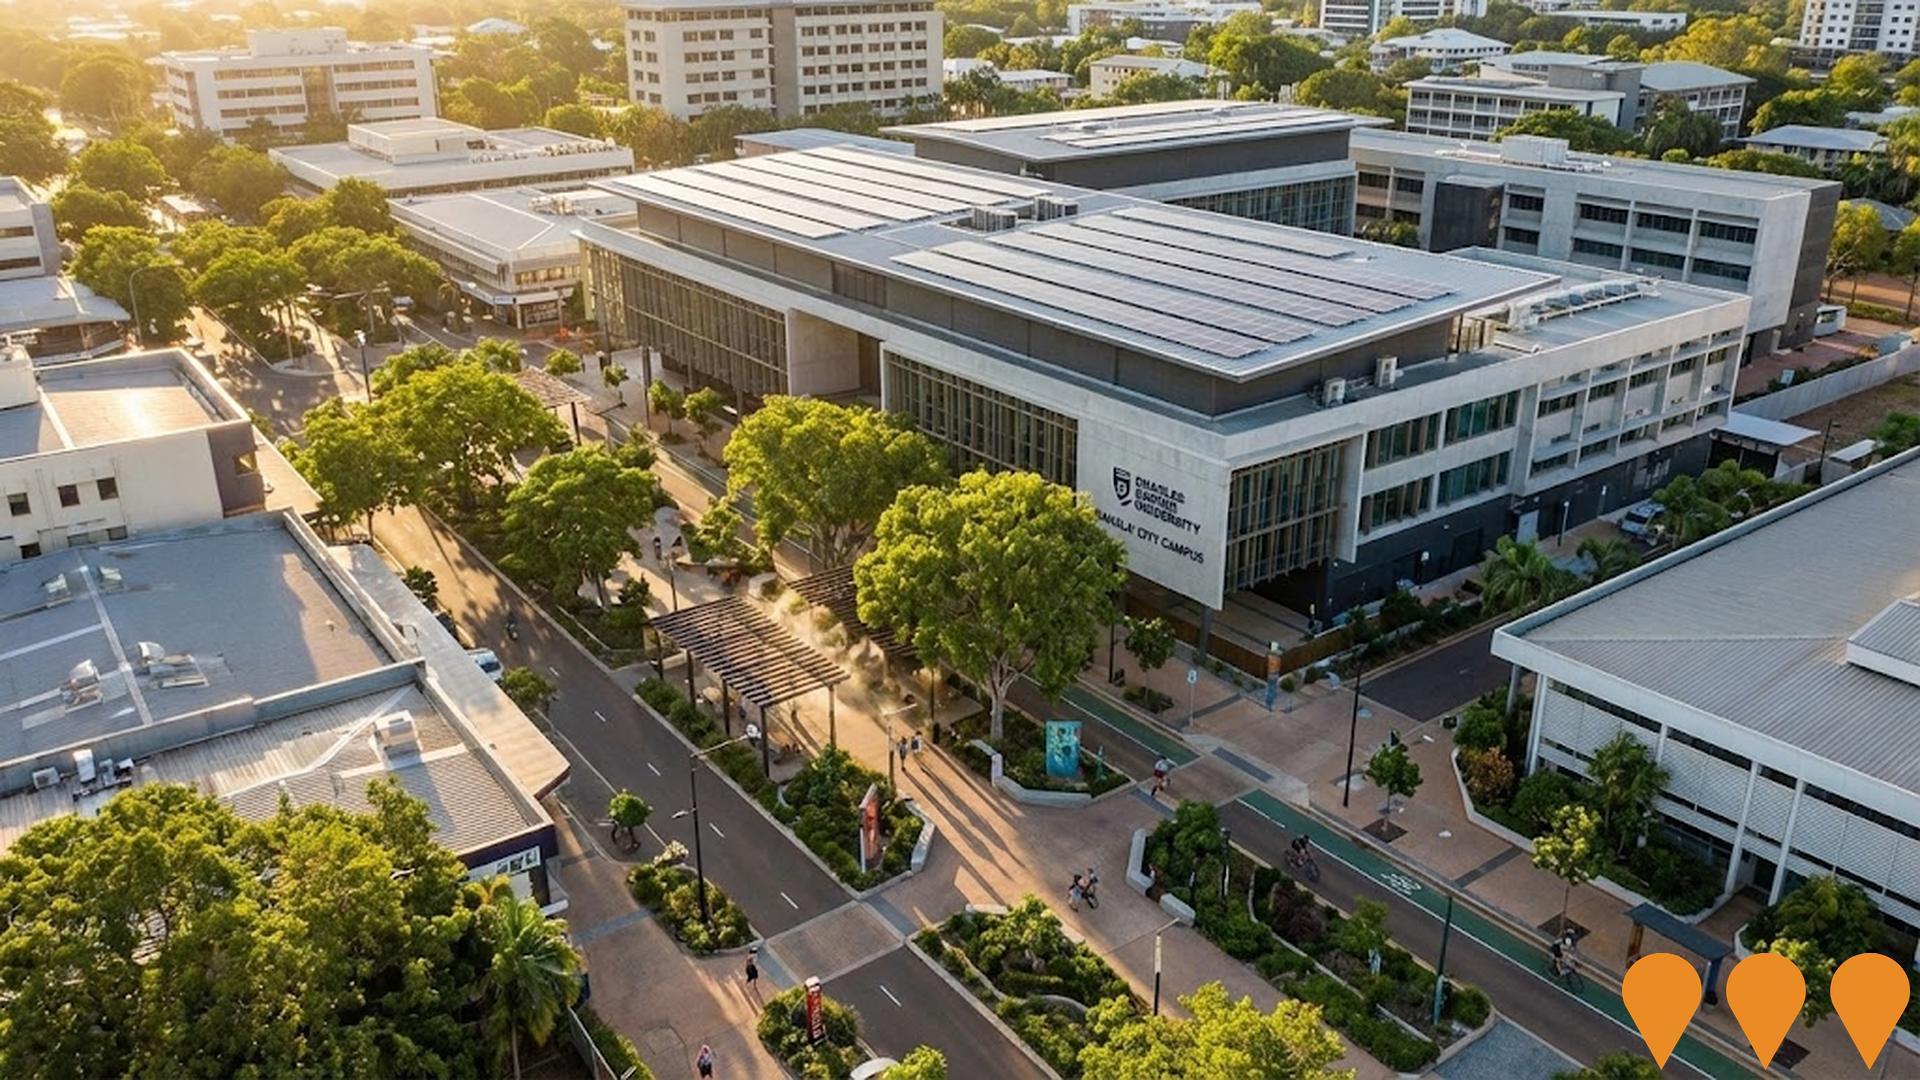
Darwin City Deal - Cavenagh Street Redevelopment
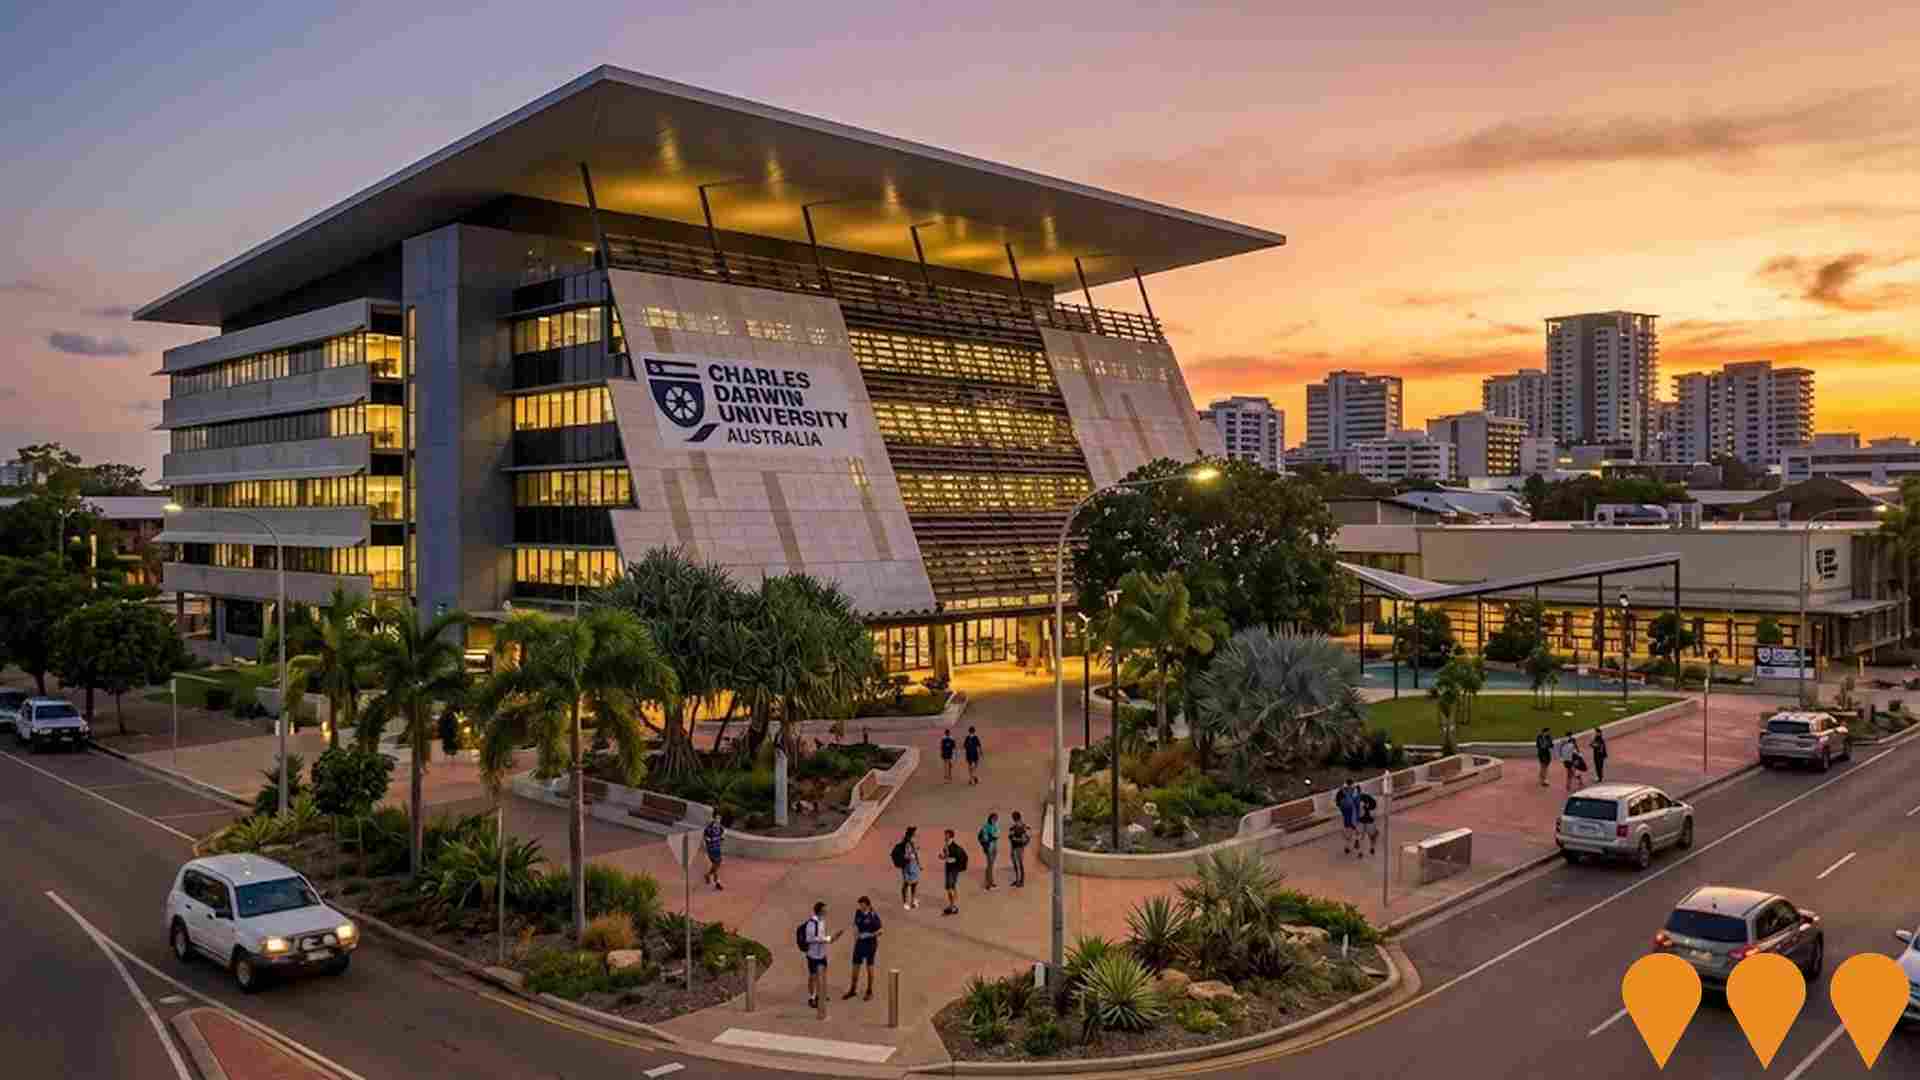
Comprehensive revitalisation of Cavenagh Street anchored by the newly completed $250 million Charles Darwin University 'Danala' City Campus and extensive streetscape upgrades. The project delivered a cooling, pedestrian-friendly civic spine with the 'Greening and Cooling' enhancement works completed in May 2024, featuring heat mitigation infrastructure and improved public realm connectivity. While the main Cavenagh Street precinct works are complete, the adjacent $30 million Civic Centre redevelopment on Harry Chan Avenue is progressing through planning.
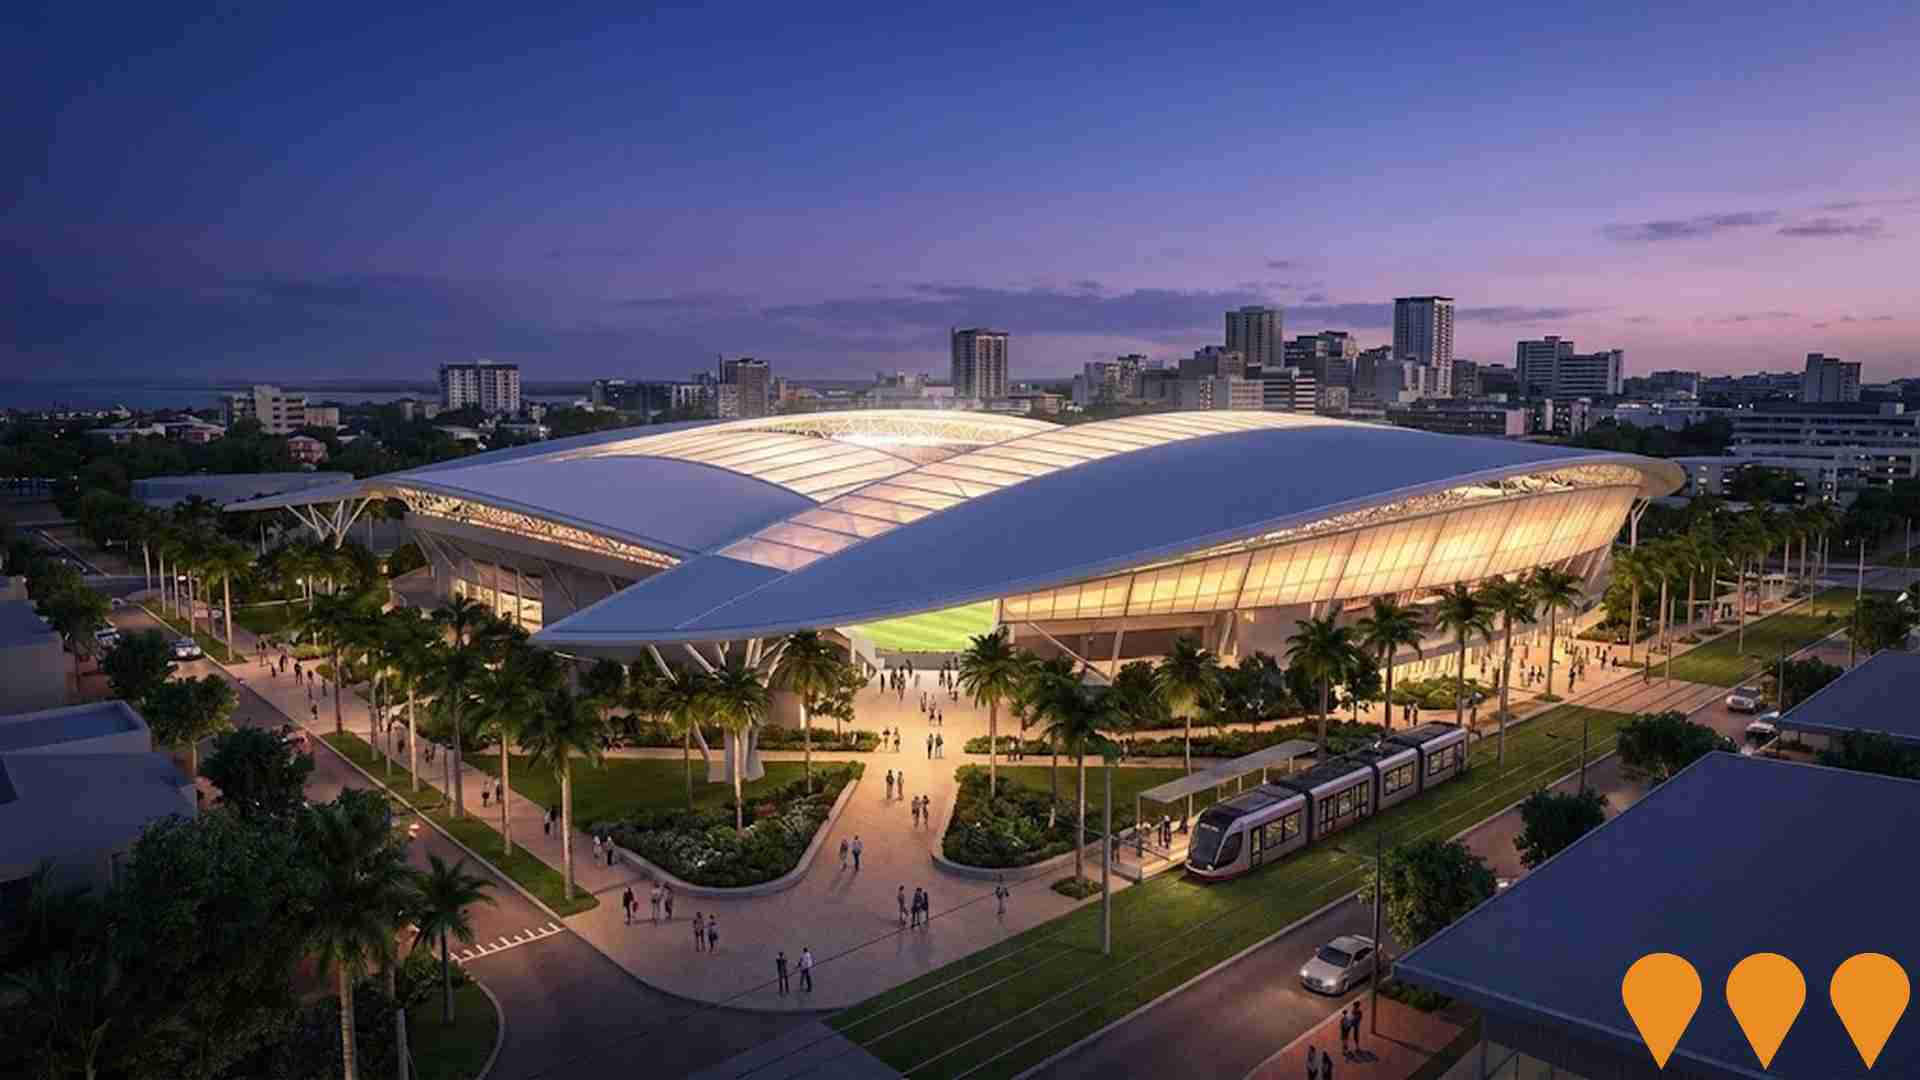
Darwin City Stadium
The Darwin City Stadium is a proposed 25,000-seat multi-purpose venue designed to anchor the Northern Territory's bid for the 20th AFL license. Following the May 2024 release of the strategic business case by the AFL Team NT Taskforce, the project remains a centerpiece of a 10-year roadmap to establish a local AFL club. The stadium is planned for the former Shell fuel tank site and is intended to host AFL, Cricket, Rugby, and Soccer, while supporting the NT Government's 2030 population growth and liveability targets.
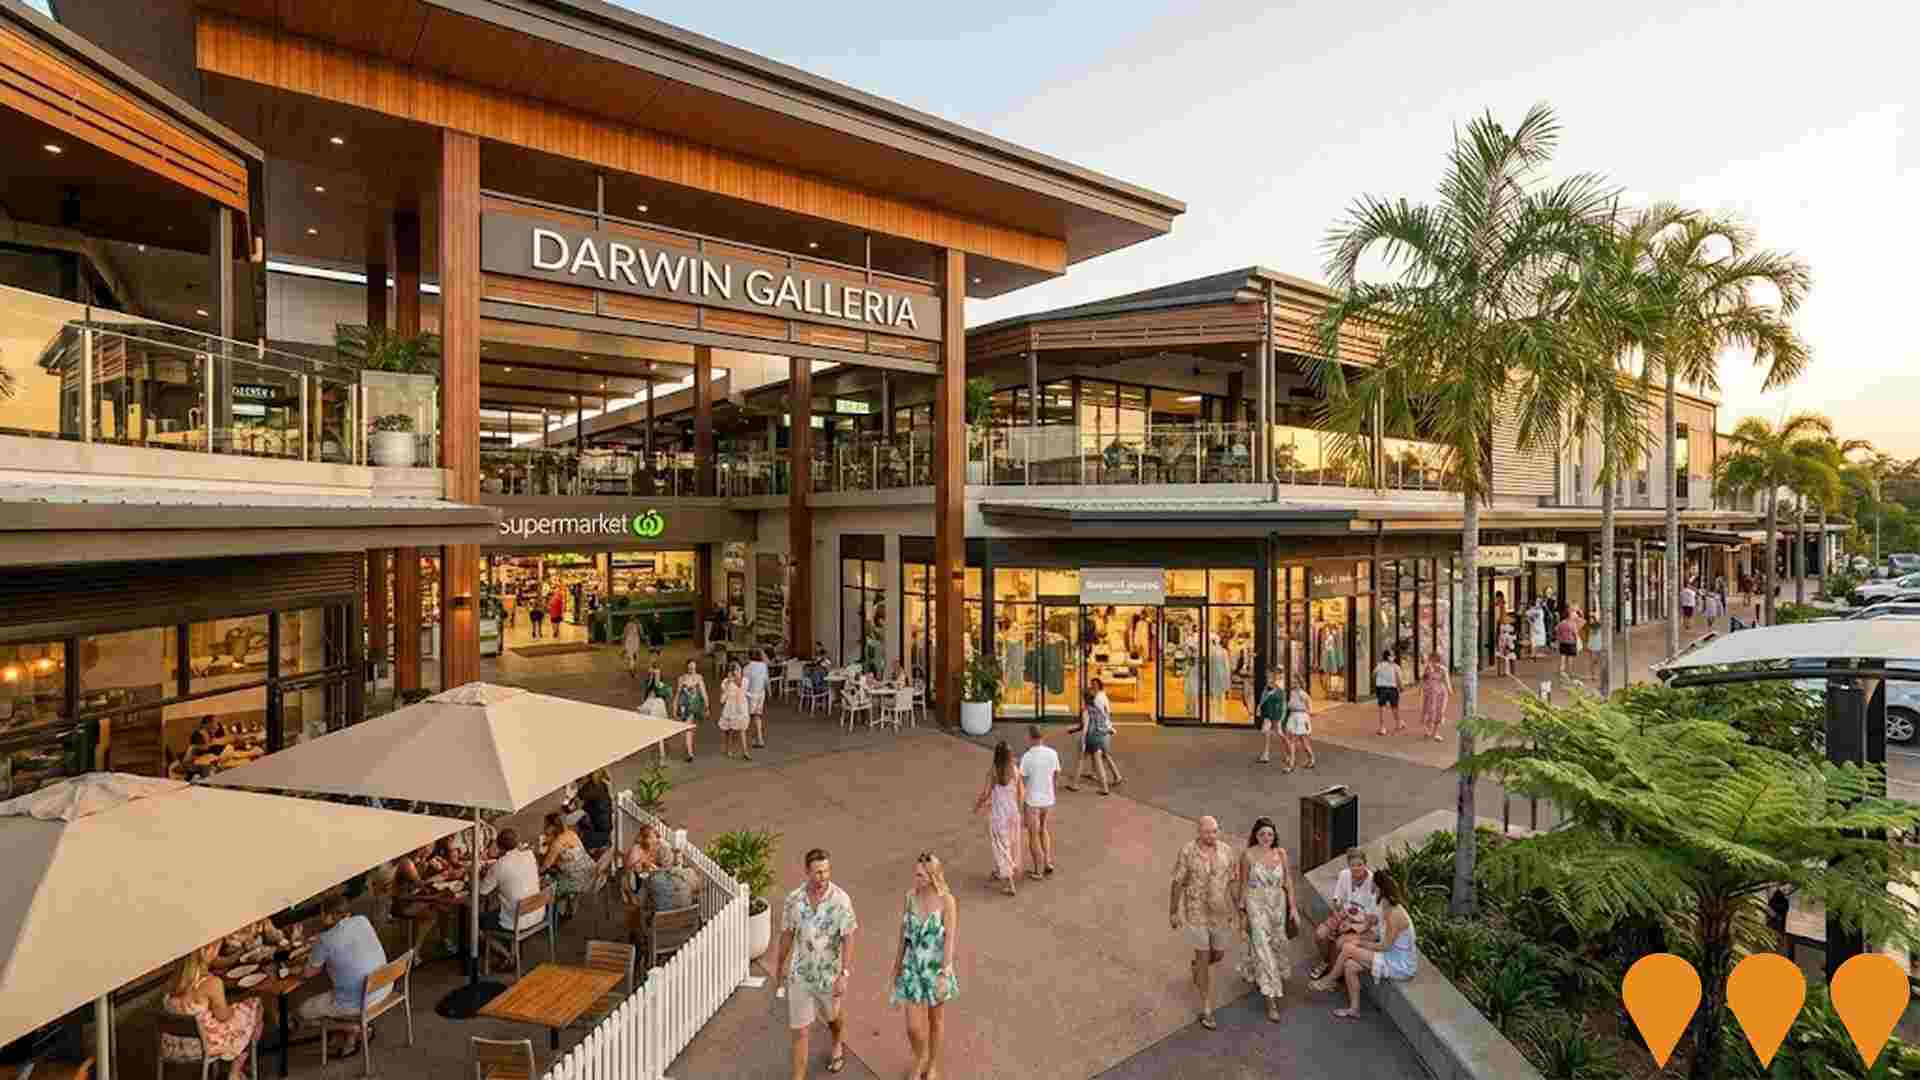
Darwin Galleria (Former Coles Site Redevelopment)
A major revitalisation of the former Coles site into a premium mixed-use precinct in the Darwin CBD. The project includes a multi-level retail podium with a flagship supermarket, specialty retail tenancies, and alfresco dining spaces. The redevelopment aims to integrate seamlessly with the Smith Street Mall improvements while providing modern office space and potential hospitality facilities in the upper levels to drive city center foot traffic.
Darwin Waterfront Central Precinct Redevelopment
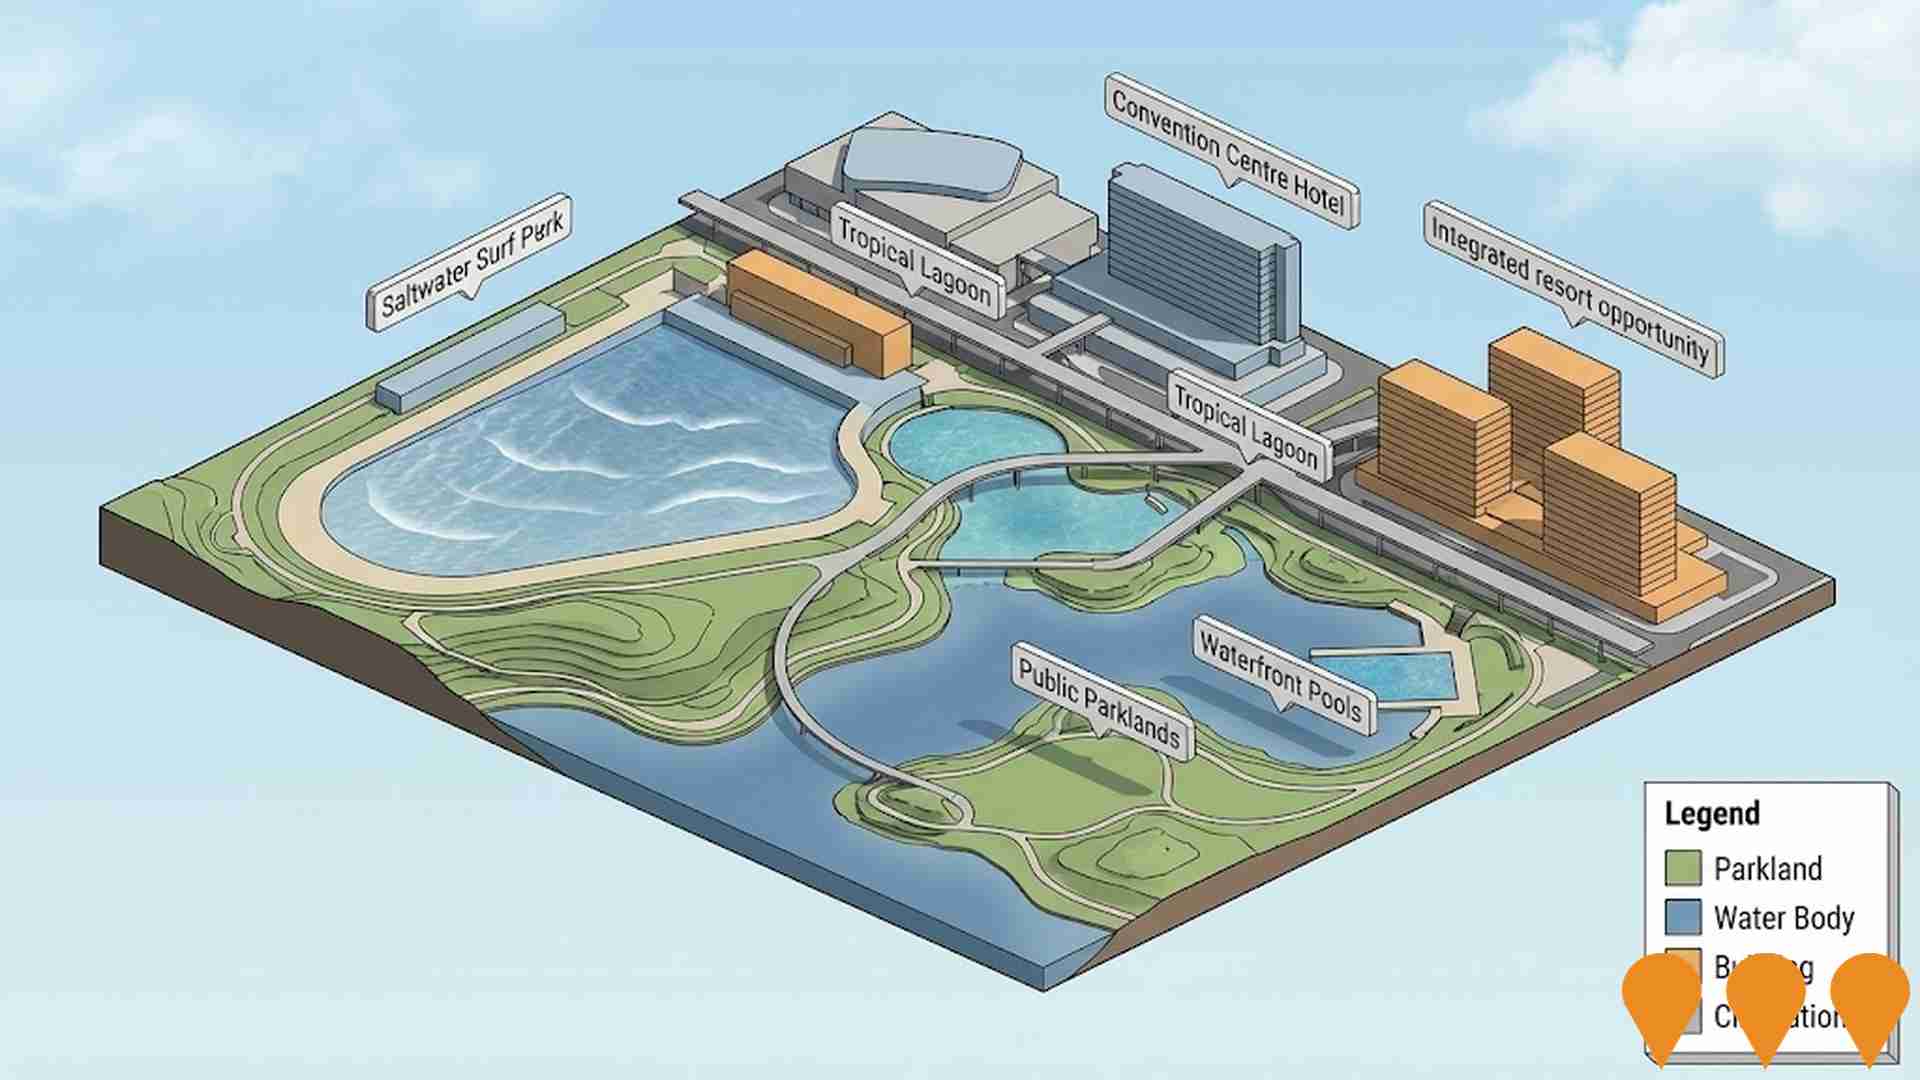
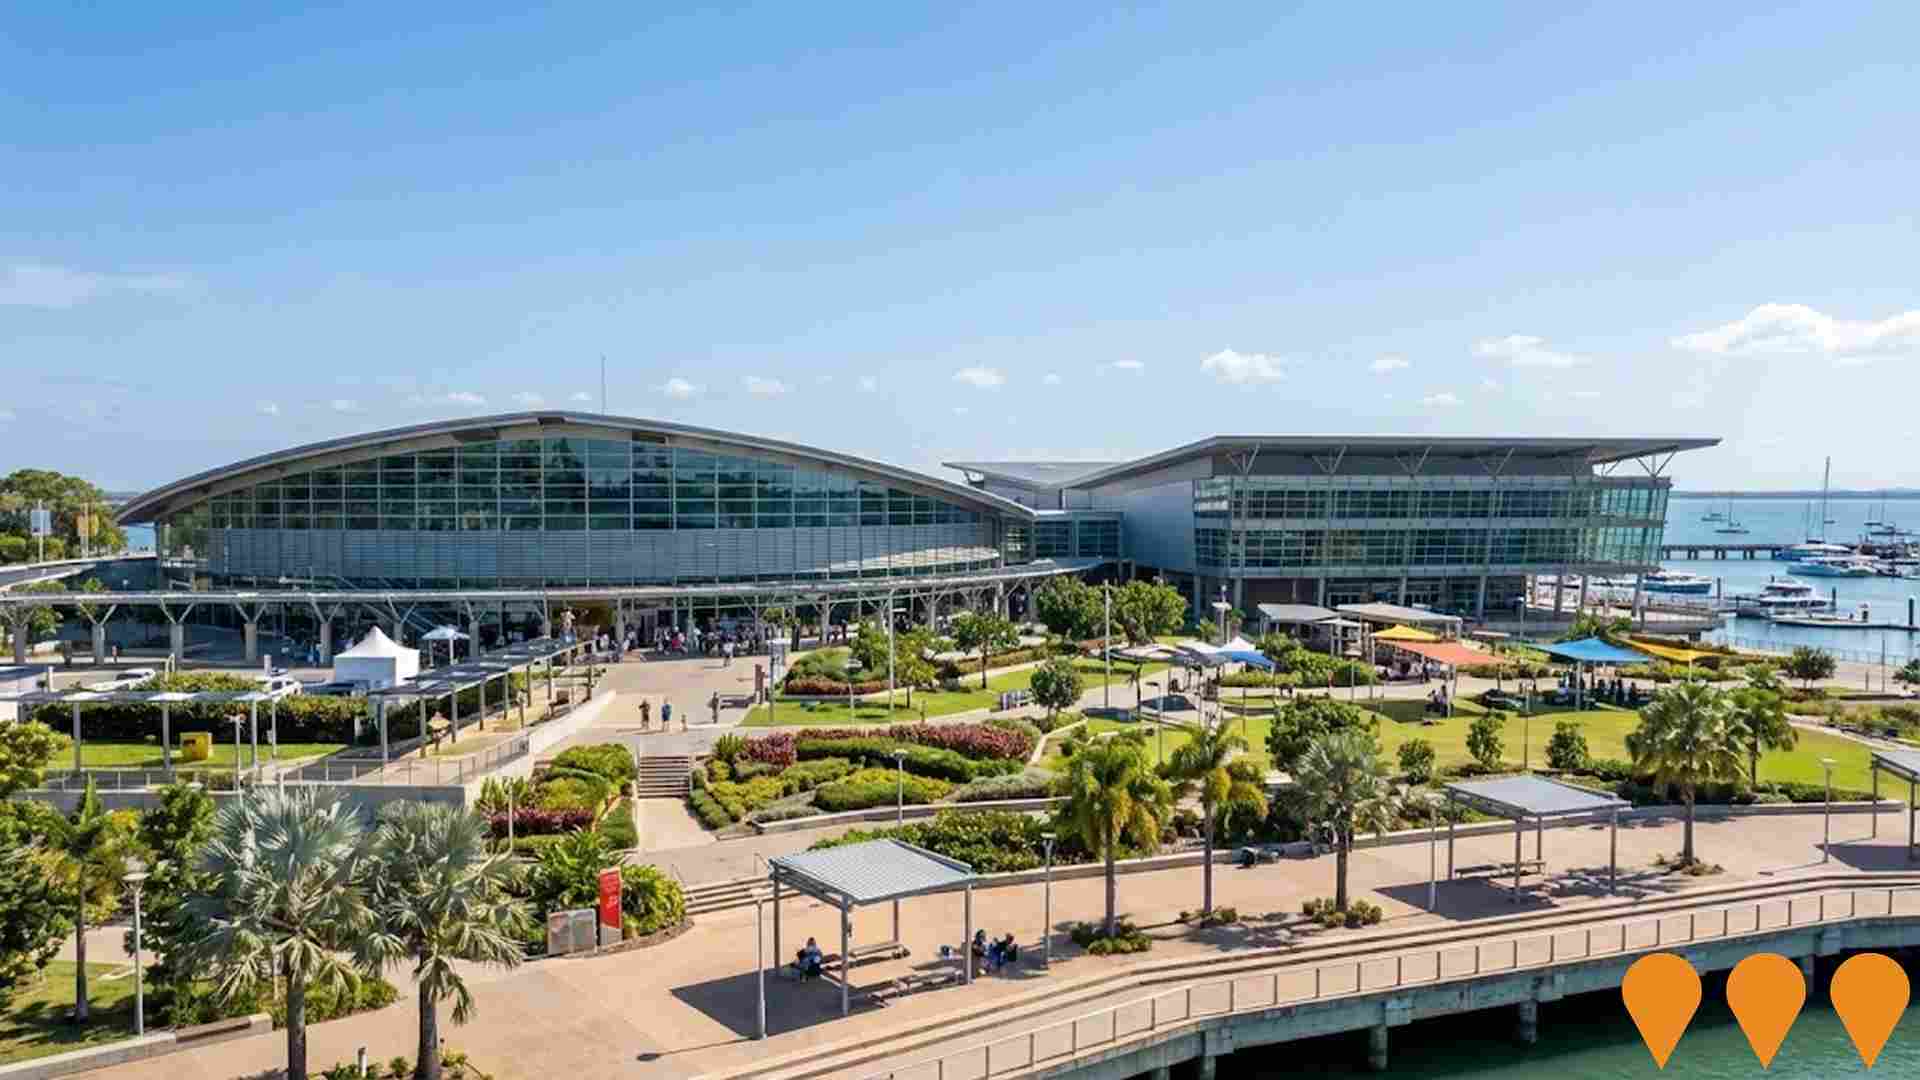
Major $250 million redevelopment featuring Australia's first saltwater surf park, tropical lagoon, new waterfront pools, Entry Plaza and Celebration Lawns, Convention Centre Hotel, and 2.8 hectares of additional public parklands.
Civic and State Square Precinct Revitalisation
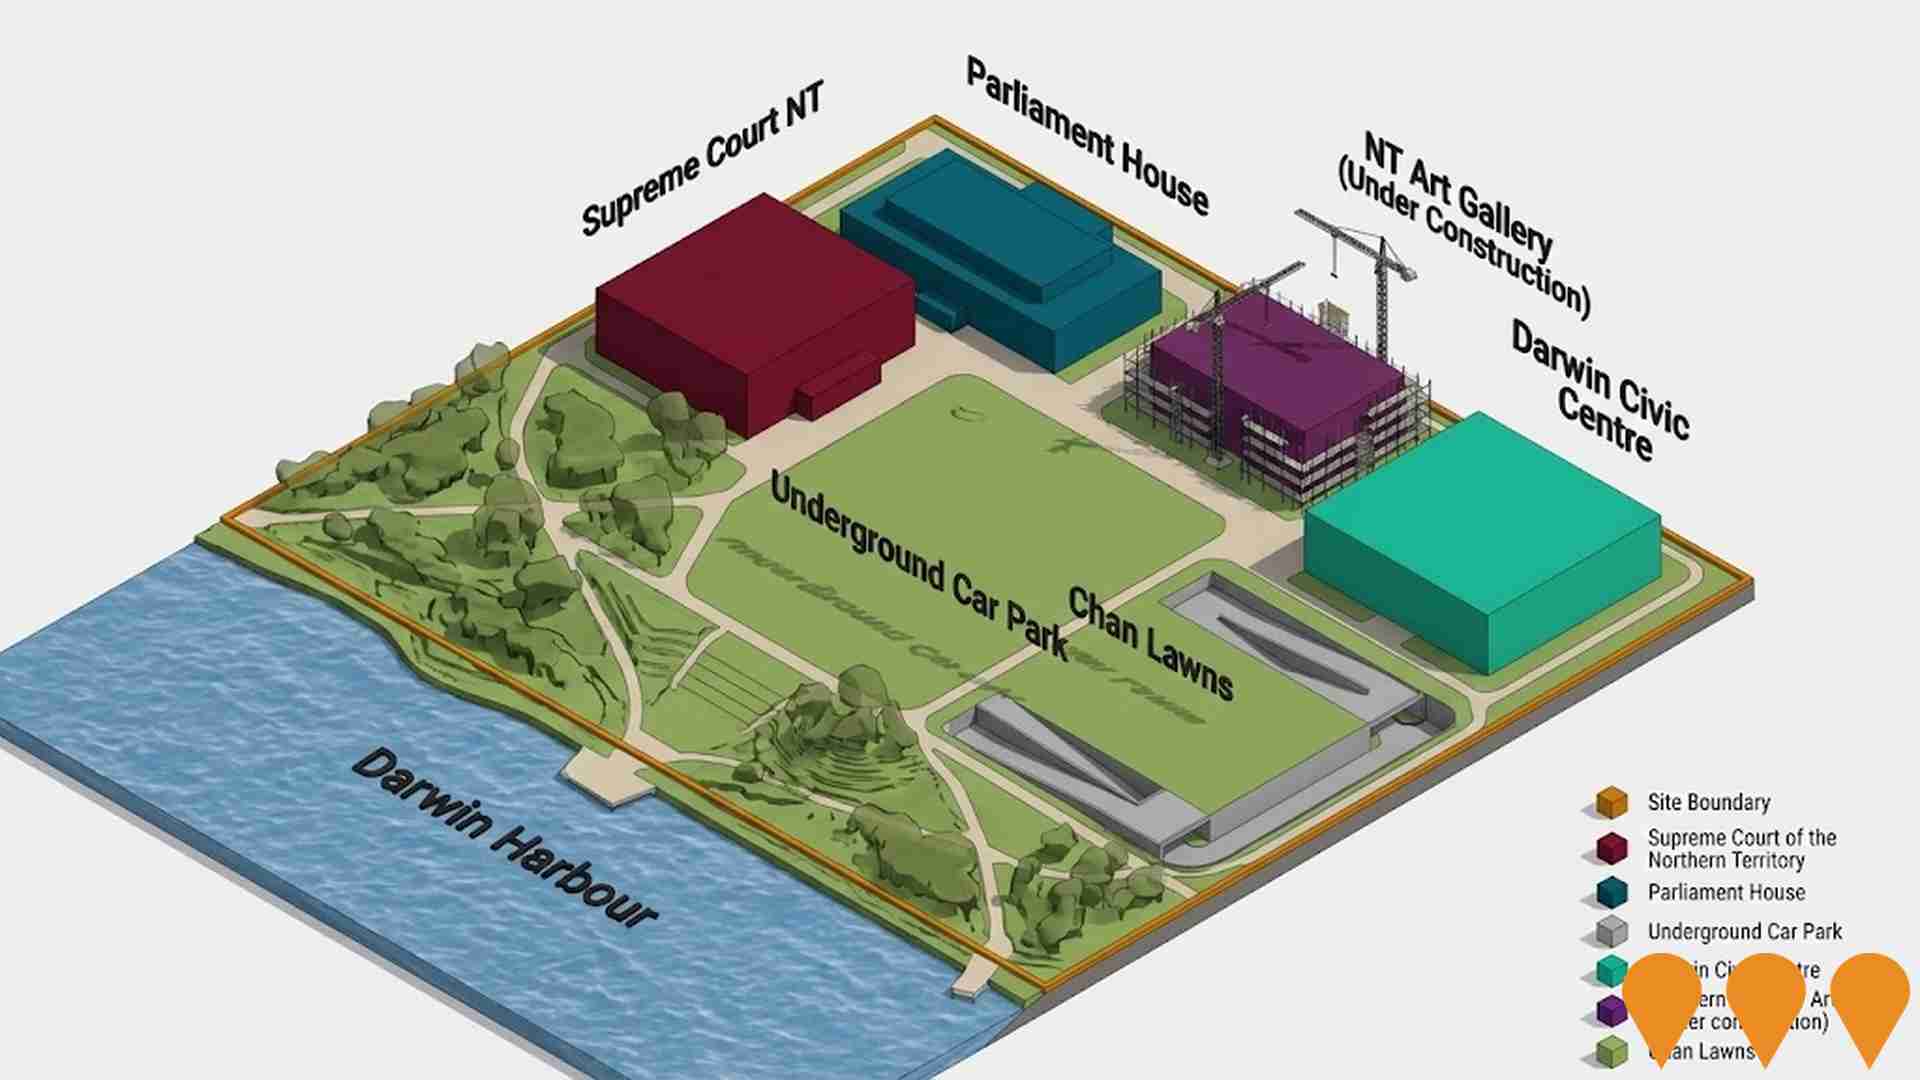
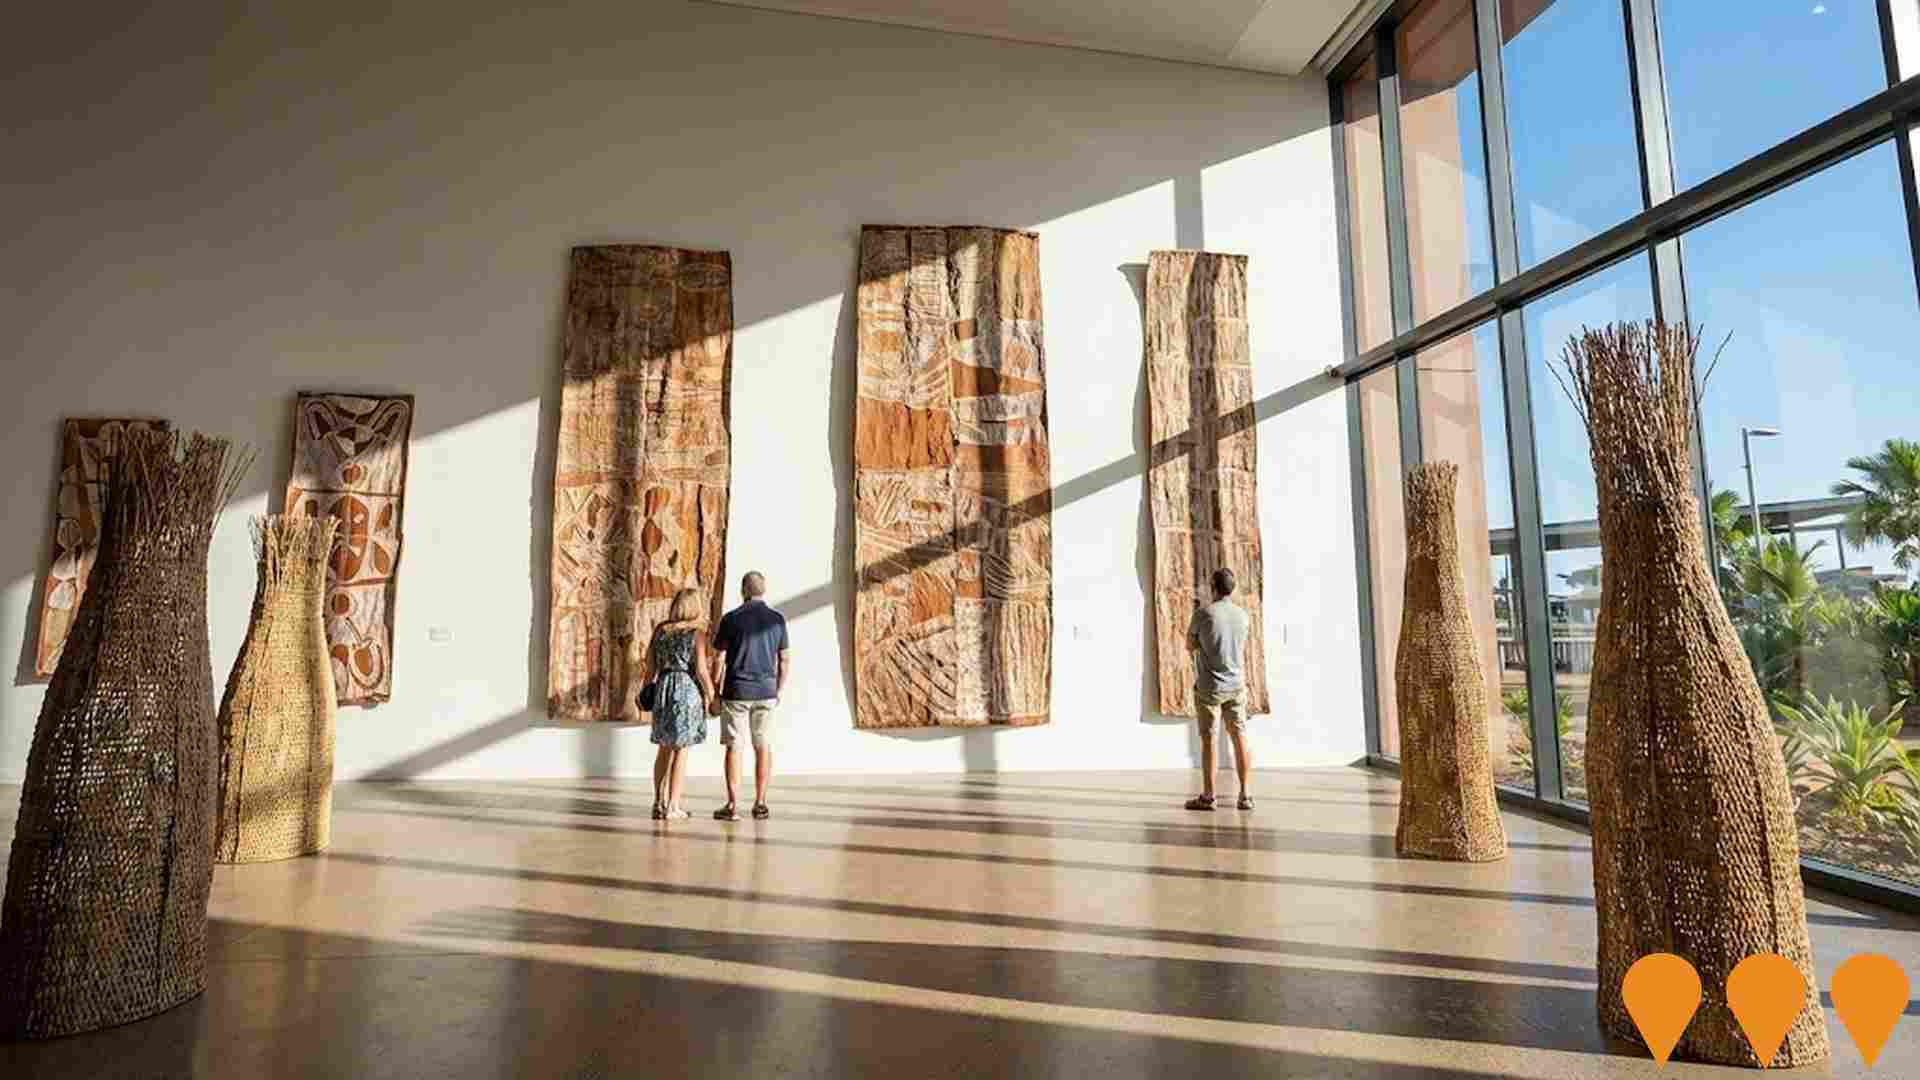
Revitalisation of the Civic and State Square Precinct in Darwin CBD to deliver shady parklands, public art, and better connections across Parliament House, Supreme Court and Government House. Works already completed include the 450-bay underground car park, native gardens and Chan Lawns, along with the former 90-bay parliamentary car park being converted to public lawns. The NT Art Gallery building has reached roof slab but the new government has put the gallery use under review via an EOI while construction activity on the building shell has progressed.
Charles Darwin University City Campus
$95 million new city campus featuring modern lecture halls, research facilities, and student accommodation to expand higher education access in Darwin CBD.
Stuart Highway Road Safety Improvements - Stuart Park
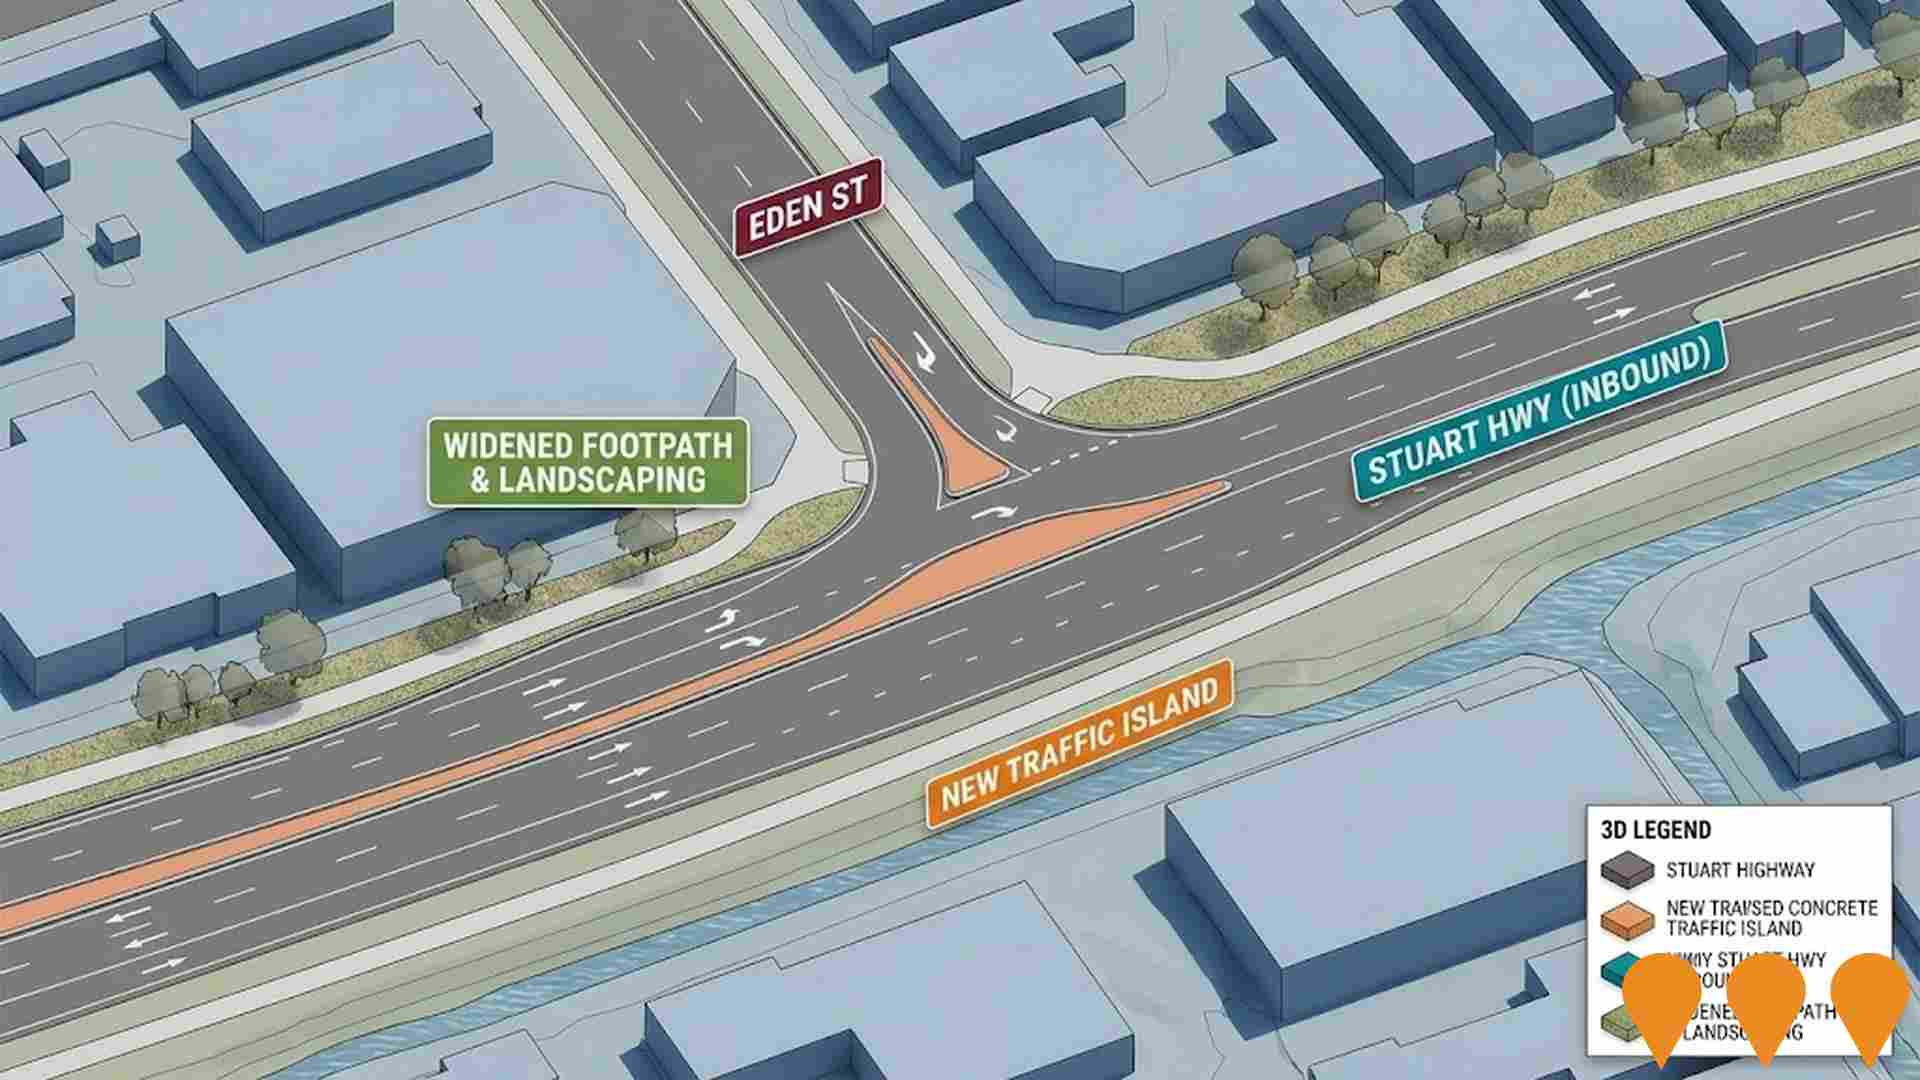
Road safety upgrades along Stuart Highway in Stuart Park to separate turning traffic from through traffic and provide full protection for pedestrians and cyclists at signals. Concept designs indicate dedicated left turn lanes at Armidale Street, Eden Street, Charles Street and Westralia Street, with improved line marking and signage. Project is in early design planning; construction subject to funding following detailed design.
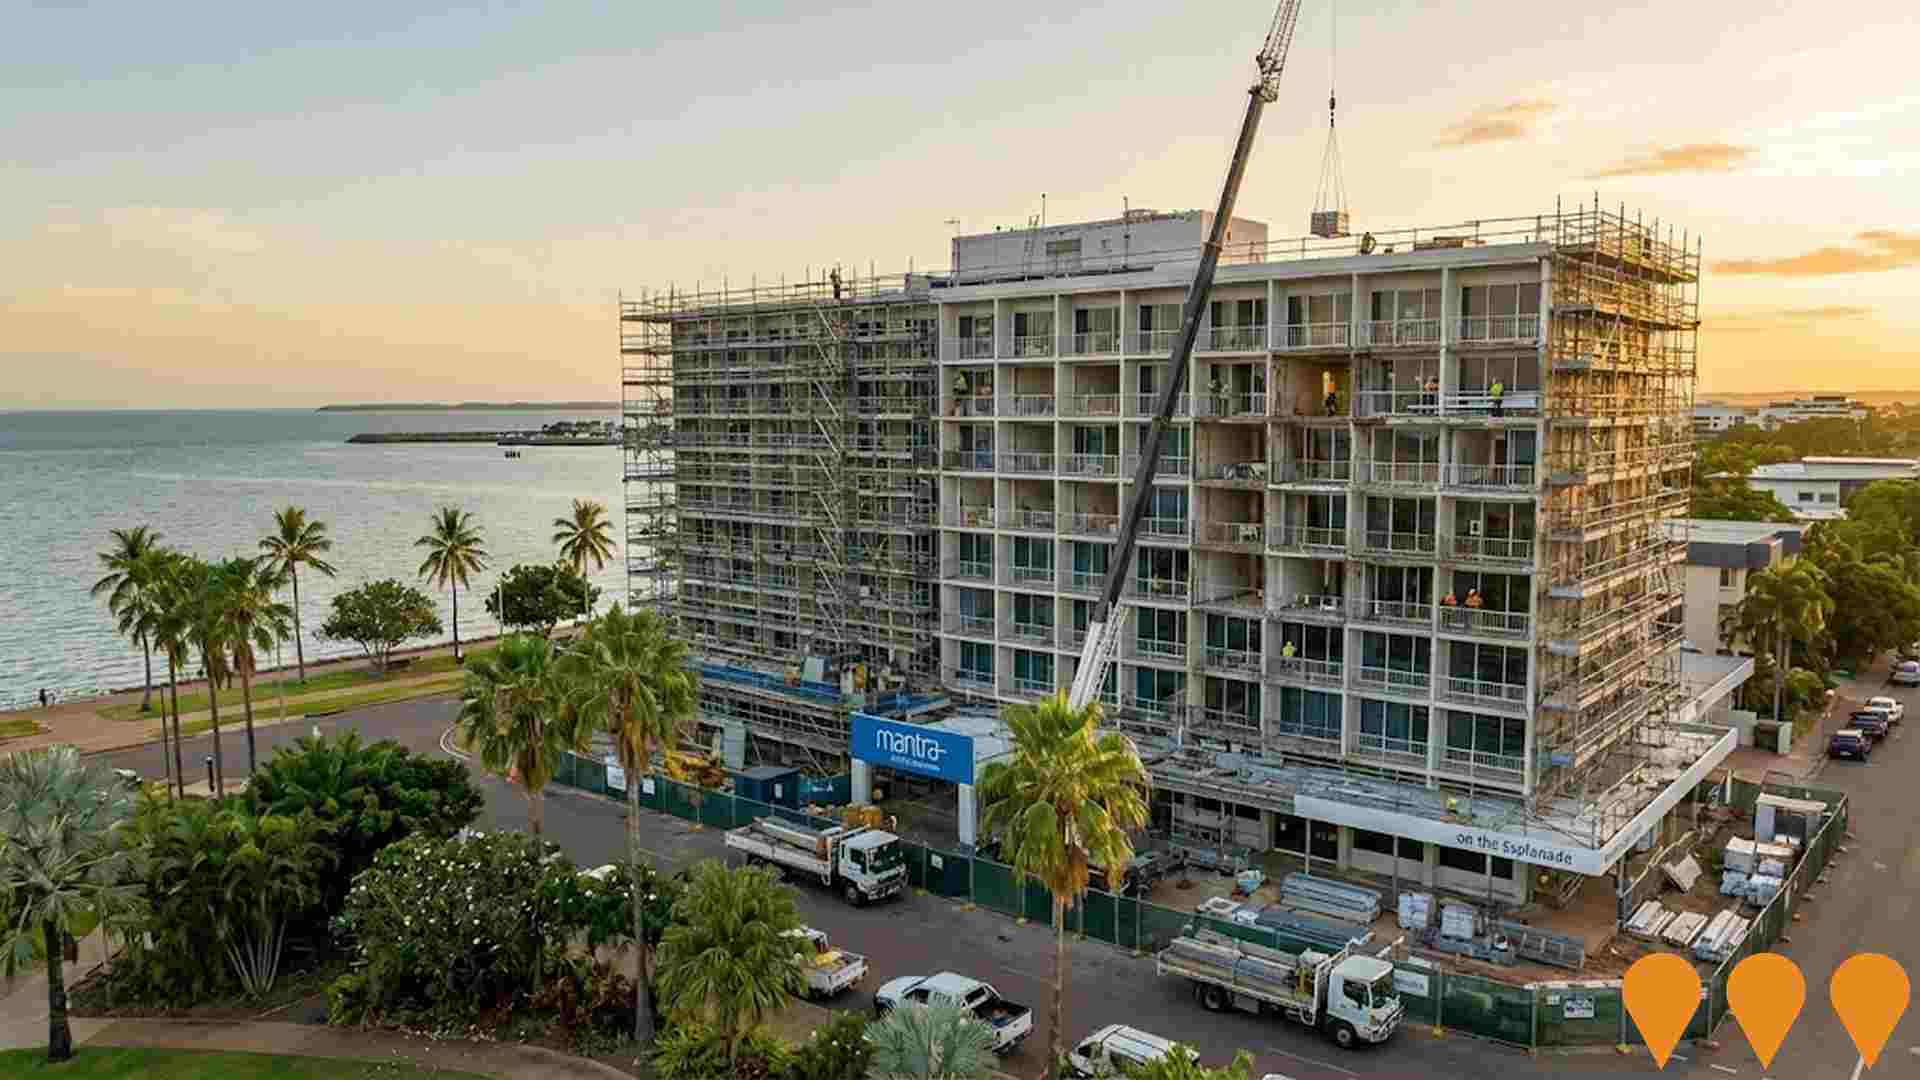
Mantra on the Esplanade Hotel Refurbishment & Apartment Addition
A major refurbishment and adaptive reuse project at the 88 The Esplanade site, involving the conversion of hotel rooms into private residential apartments ('Hotel-to-Home') and the refurbishment of remaining guest suites. The project includes upgrades to the penthouse suites and common areas, with active renovation works scheduled between November 2025 and April 2026.

Employment
AreaSearch analysis reveals Darwin City significantly outperforming the majority of regions assessed nationwide
Darwin City features a highly educated labor pool with essential services well represented, an unemployment rate of just 2.7%, and 0.7% in estimated employment growth over the past year, based on AreaSearch aggregation of statistical area data. As of March 2026, 5,977 residents are in work while the unemployment rate is 0.7% below Greater Darwin's rate of 3.5%, and workforce participation is well beyond standard (78.4% compared to Greater Darwin's 72.7%). Based on Census responses, a low 4.7% of residents were found to work from home, though Covid-19 lockdown impacts should be considered.
The major employment industries for locals are public administration & safety, accommodation & food, and health care & social assistance. The local workforce displays a high concentration in accommodation & food, employing a share that is 2.0 times the broader metropolitan average. On the other hand, the construction sector is less represented, accounting for 5.3% of local workers compared to the regional average of 9.2%. With a ratio of 1.9 jobs for every resident at the time of the Census, the suburb of Darwin City operates as a major employment center, importing workers from neighboring areas.
Based on AreaSearch analysis of SALM and ABS sources for the broader region, the latest 12-month cycle recorded a 0.7% lift in total employment alongside an 0.8% increase in the labor force, leaving the unemployment rate essentially unchanged. By comparison, Greater Darwin recorded a 0.4% rise in employment and an 0.8% expansion in the labor force, leading to a 0.3 percentage point increase in unemployment. National forecasts released by Jobs and Skills Australia in May-25 provide context for future workforce requirements in the suburb of Darwin City. These models project trends over five and ten-year horizons against the local industry makeup. Nationally, employment is anticipated to grow by 6.6% over five years and 13.7% over ten years, though trajectories differ widely by sector. Aligning these trends to the local industry distribution suggests that employment in the suburb of Darwin City is set to rise by 6.3% over five years and 13.0% over ten years, representing a simple weight-based projection rather than a localized population-driven model.
Frequently Asked Questions - Employment
Income
Income metrics indicate excellent economic conditions, with the area achieving higher performance than 75% of national locations assessed by AreaSearch
ATO records at the postcode level for the 2023 financial year show that personal earnings in the suburb of Darwin City exceed national benchmarks, with a median of $62,290 and an average of $73,761. This compares to a median of $66,956 and an average of $77,199 across Greater Darwin. Adjusted for a Wage Price Index expansion of 9.41% since the 2023 financial year, current local estimates would stand at approximately $68,151 for the median and $80,702 for the average as of March 2026. According to the Census, individual weekly earnings are high, placing in the 92nd percentile nationally at $1,236. Income distribution figures show the largest segment comprises 42.7% of residents (3,670 people) earning between $1,500 - 2,999, mirroring the metropolitan pattern where 36.7% fall into this bracket. Rent and mortgage commitments absorb 19.0% of local income, yet strong earnings keep overall disposable income in the 70th percentile, with a SEIFA economic index ranking in the 8th decile.
Frequently Asked Questions - Income
Housing
Darwin City features a more urban dwelling mix with significant apartment living, with a higher proportion of rental properties than the broader region
According to the last Census, the housing mix in the suburb of Darwin City was made up of 0.5% standalone houses and 99.4% alternative dwellings, such as apartments and semi-detached properties, contrasting with the wider Darwin metropolitan profile of 63.5% standalone houses and 36.5% alternative dwellings. Home ownership in the suburb of Darwin City was lower than the metropolitan benchmark at 7.9%, with the remaining properties occupied by households with a mortgage (15.1%) or renters (77.0%). The median monthly mortgage payment was $1,781, running below the Darwin metropolitan median of $2,100, while the median weekly rent was $450, compared to $385 across the metropolitan area. Nationally, mortgage payments in the suburb of Darwin City are lower than the Australian average of $1,863, whereas rental costs are notably higher than the national median of $375.
Frequently Asked Questions - Housing
Household Composition
Darwin City features high concentrations of group households and lone person households, with a lower-than-average median household size
Family units account for 51.4% of local households, consisting of 13.2% couples with children, 32.3% couples without children, and 4.3% single parent households. Non-family living arrangements make up the remaining 48.6% of households, with single person dwellings representing 38.4% and group share houses making up 10.2%. The average household size is 2.0 people, which is smaller than the Greater Darwin average of 2.6.
Frequently Asked Questions - Households
Local Schools & Education
Darwin City shows strong educational performance, ranking in the upper quartile nationally when assessed across multiple qualification and achievement indicators
The level of educational attainment in the suburb of Darwin City is high relative to broader benchmarks, with 51.1% of residents aged 15+ holding a university degree compared to 27.3% across the Northern Territory and 30.4% nationwide. This provides a strong foundation for knowledge-intensive sectors. Bachelor degrees represent the most common credential at 31.0%, followed by postgraduate degrees at 16.6% and graduate diplomas at 3.5%. Vocational education is also well represented, with 28.2% of individuals aged 15+ possessing technical qualifications, including advanced diplomas (12.5%) and certificates (15.7%).
A significant proportion of the population is engaged in study, with 31.5% of residents enrolled in an educational institution. This includes 13.1% attending university or higher education, 5.0% in primary school, and 3.4% in high school.
Frequently Asked Questions - Education
Schools Detail
Nearby Services & Amenities
Transport
Transport servicing is moderate compared to other areas nationally based on assessment of service frequency, route connectivity and accessibility
Public transport networks include 12 active transit stops in the suburb of Darwin City, comprising various bus services. These points of access are connected to 27 distinct routes, generating 1,368 passenger journeys each week. Local accessibility is rated favorably, with residents living an average of 219 meters from their nearest transit stop. Commuting patterns reflect the residential character of the area with most workers traveling outward; private vehicles are the primary mode of travel at 62%, while 25% of workers walk and 3% travel by bicycle. Car ownership stands at an average of 0.8 vehicles per household, which is below the regional median. A small proportion of 4.7% of the workforce worked from home, according to the 2021 Census, which may reflect the pandemic context.
Transit services average 195 runs per day across the network, translating to roughly 114 weekly services at each individual stop.
Frequently Asked Questions - Transport
Transport Stops Detail
Health
Darwin City's residents boast exceedingly positive health performance metrics with very low prevalence of common health conditions across all age groups
Based on AreaSearch's evaluation of mortality patterns and chronic illness rates, local health statistics indicate positive outcomes in the suburb of Darwin City, with low levels of common medical conditions across all age groups and a high rate of private health insurance held by approximately 56% of the population, representing about 4,807 individuals.
Mental health conditions and asthma were the most prevalent health issues reported, affecting 5.2% and 5.0% of the community respectively, while 82.6% of residents reported having no long-term medical conditions compared to 77.1% in Greater Darwin. Seniors aged 65 and older make up 9.4% of the population (808 people), which is lower than the Greater Darwin proportion of 11.0%. Health indicators among this older cohort are strong, with national comparative standings exceeding those of the general local population.
Frequently Asked Questions - Health
Cultural Diversity
Darwin City is among the most culturally diverse areas in the country based on AreaSearch assessment of a range of language and cultural background related metrics
The suburb of Darwin City exhibits high cultural diversity, with 40.4% of residents using a non-English language at home and 51.7% of the population born outside Australia. Christianity is the most common religious affiliation, represented by 31.7% of the local population. However, the most pronounced difference from the wider region is in Hinduism, which is practiced by 11.7% of residents, compared to the Greater Darwin average of 4.2%.
Regarding ancestral backgrounds, the three largest groups in the suburb of Darwin City are English at 20.9%, Other at 20.2% (exceeding the regional average of 13.1%), and Australian at 14.6% (lower than the regional baseline of 22.6%). There are also notable differences in other ethnic communities, with Sri Lankan backgrounds representing 0.7% (compared to 0.3% regionally), Korean backgrounds at 0.9% (compared to 0.2%), and Filipino backgrounds at 2.6% (compared to 3.8%).
Frequently Asked Questions - Diversity
Age
Darwin City's young demographic places it in the bottom 15% of areas nationwide
The median age in the suburb of Darwin City is 33 years, similar to the Greater Darwin average of 34 and younger than the Australian median of 38. Compared to the capital city average, the suburb of Darwin City contains a higher proportion of young adults aged 25 to 34 (32.5%) but a lower share of children aged 5 to 14 (5.1%). The concentration of residents aged 25 to 34 is higher than the national figure of 14.6%. Post-2021 Census data shows the 75 to 84 cohort increased from 1.4% to 2.6% of the population, while the 55 to 64 group decreased from 9.9% to 7.8% and the 25 to 34 bracket shifted from 33.6% to 32.5%. Projections indicate that the age profile in the suburb of Darwin City will change by 2041, with the 45 to 54 cohort expected to grow by 410 individuals (40%) from 1,014 to 1,425, while the 0 to 4 group is projected to rise by 9% (28 children).