Chart Color Schemes
This analysis uses ABS Statistical Areas Level 2 (SA2) boundaries, which can materially differ from Suburbs and Localities (SAL) even when sharing similar names.
SA2 boundaries are defined by the Australian Bureau of Statistics and are designed to represent communities for statistical reporting (e.g., census and ERP).
Suburbs and Localities (SAL) represent commonly-used suburb/locality names (postal-style areas) and may use different geographic boundaries. For comprehensive analysis, consider reviewing both boundary types if available.
est. as @ -- *
ABS ERP | -- people | --
2021 Census | -- people
Sales Activity
Curious about local property values? Filter the chart to assess the volume and appreciation (including resales) trends and regional comparisons, or scroll to the map below view this information at an individual property level.
Find a Recent Sale
Sales Detail
Population
Alligator is positioned among the lower quartile of areas assessed nationally for population growth based on AreaSearch's assessment of recent, and medium term trends
Alligator's population, as per AreaSearch's analysis, stood at 4,755 by November 2025. This figure represents an increase of 513 individuals (12.1%) since the 2021 Census, which reported a population of 4,242 people. The change is inferred from the estimated resident population of 4,733 in June 2024 and an additional 15 validated new addresses post-Census date. This results in a density ratio of 0.10 persons per square kilometer. Alligator's growth rate exceeded both national (8.9%) and state averages, marking it as a regional growth leader. Overseas migration contributed approximately 75.9% to population gains recently.
AreaSearch uses ABS/Geoscience Australia projections for each SA2 area, released in 2024 with a base year of 2022. For areas not covered and post-2032 estimations, growth rates by age cohort from the ABS's Greater Capital Region projections (released in 2023, based on 2022 data) are applied. Future population projections indicate an increase just below the median of national non-metropolitan areas, with Alligator expected to expand by 551 persons to 2041, reflecting a total increase of 11.1% over the 17-year period.
Frequently Asked Questions - Population
Development
The level of residential development activity in Alligator is very low in comparison to the average area assessed nationally by AreaSearch
Alligator has recorded approximately six residential properties granted approval each year. Over the past five financial years, from FY21 to FY25, 32 homes were approved, with an additional three approved so far in FY26. The population decline over recent years suggests that new supply has likely been keeping up with demand, providing good choice for buyers.
New properties are constructed at an average value of $224,000, which is under regional levels, indicating more accessible housing choices for buyers. In terms of commercial development, $6.3 million in approvals have been registered this financial year, suggesting limited focus on commercial development. When compared to the Rest of NT, Alligator shows comparable construction activity per person, supporting market stability aligned with regional patterns. However, building activity has slowed in recent years, reflecting market maturity and possible development constraints.
Recent development has consisted entirely of detached dwellings, maintaining the area's traditional low density character with a focus on family homes appealing to those seeking space. Notably, developers are constructing more detached housing than the existing pattern implies (82.0% at Census), indicating persistent strong demand for family homes despite densification trends. The estimated population count per dwelling approval is 1260 people, reflecting its quiet, low activity development environment. Future projections show Alligator adding 529 residents by 2041, based on the latest AreaSearch quarterly estimate. At current development rates, housing supply may struggle to match population growth, potentially heightening buyer competition and supporting price increases.
Frequently Asked Questions - Development
Infrastructure
Alligator has emerging levels of nearby infrastructure activity, ranking in the 27thth percentile nationally
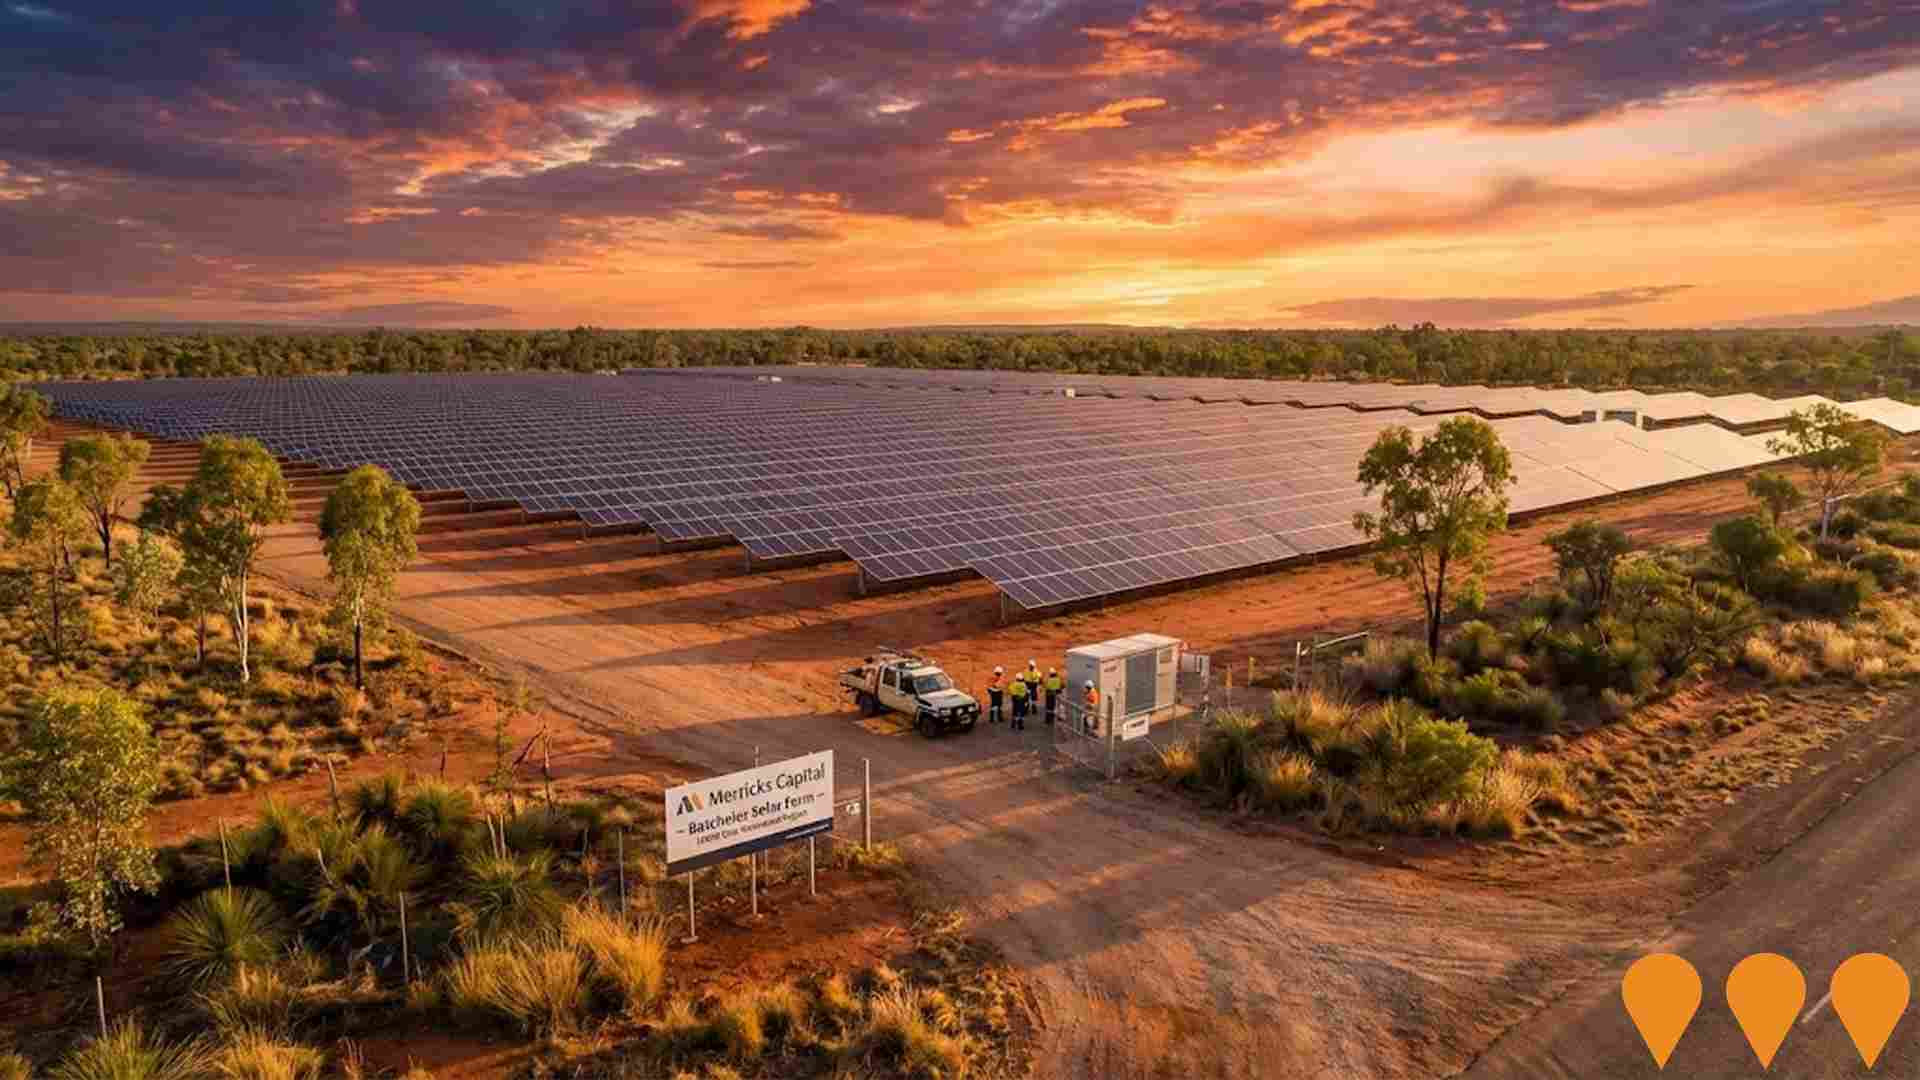
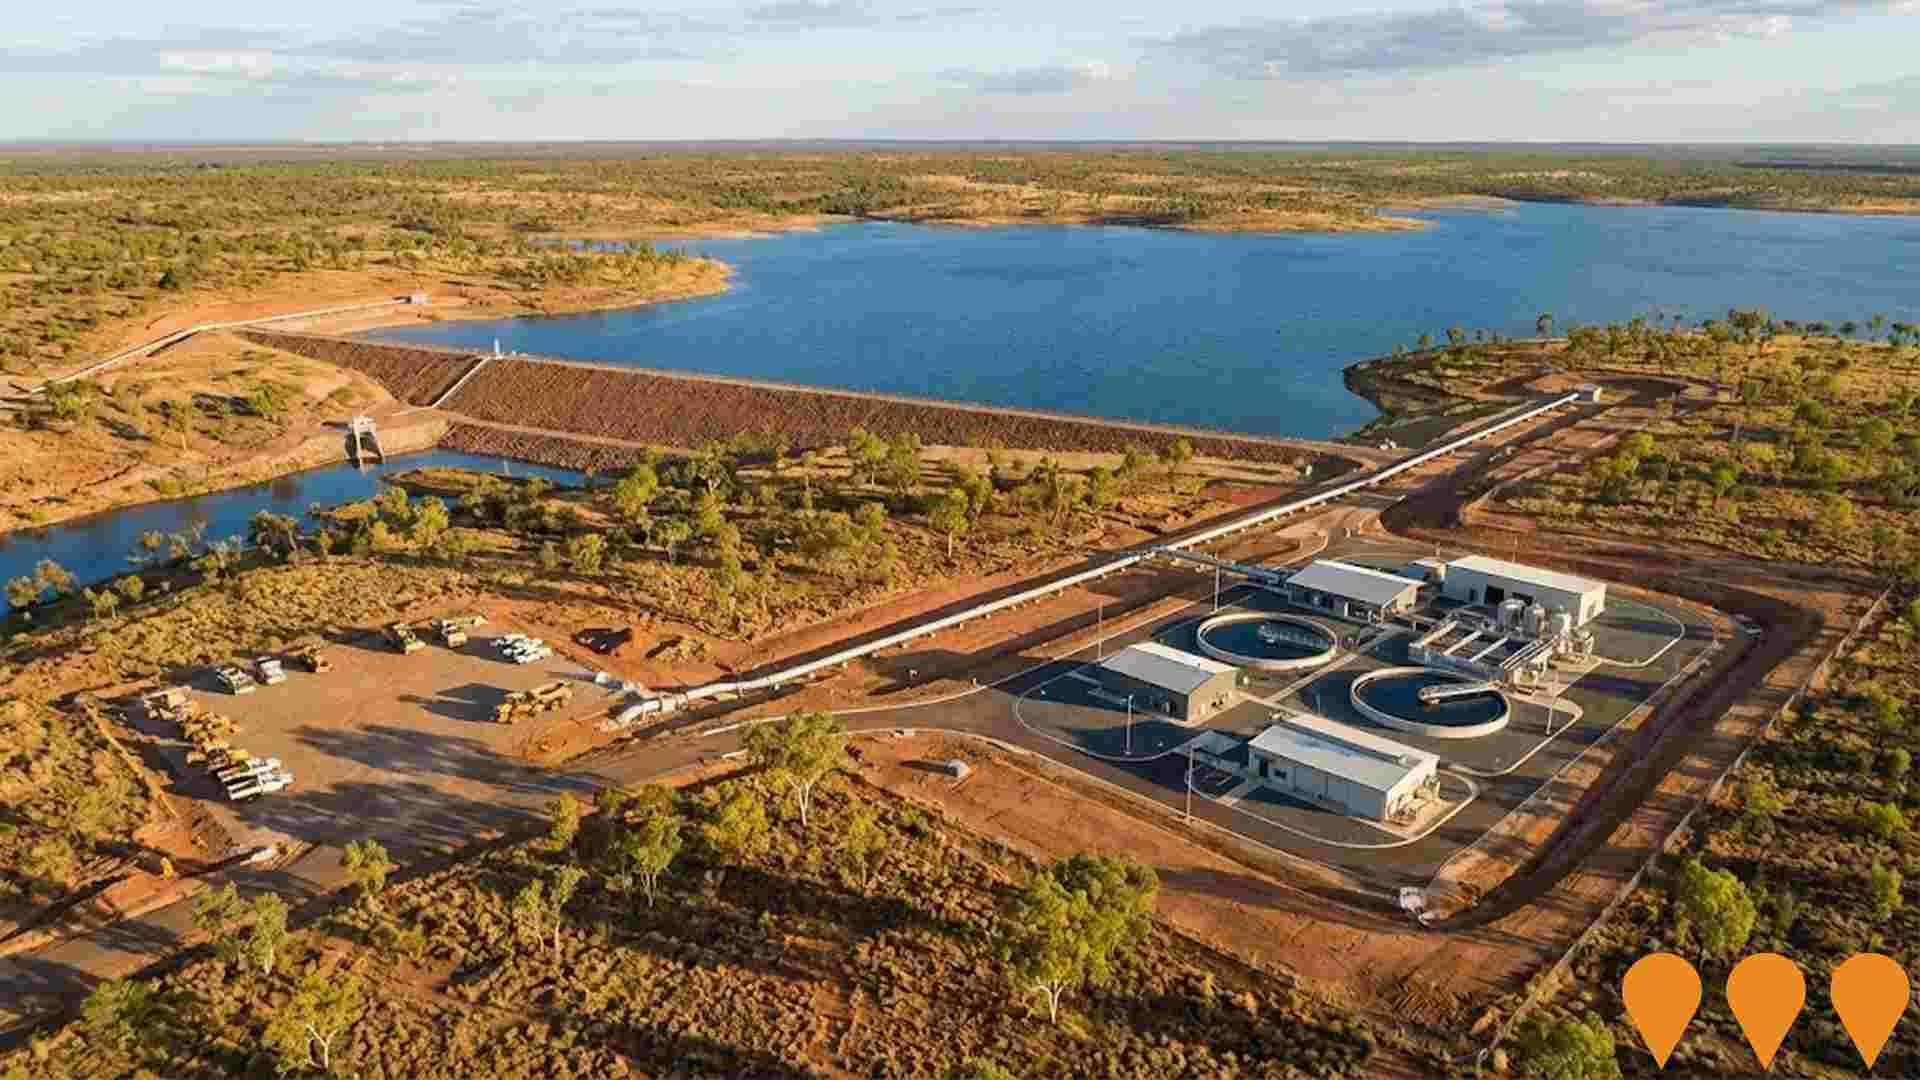
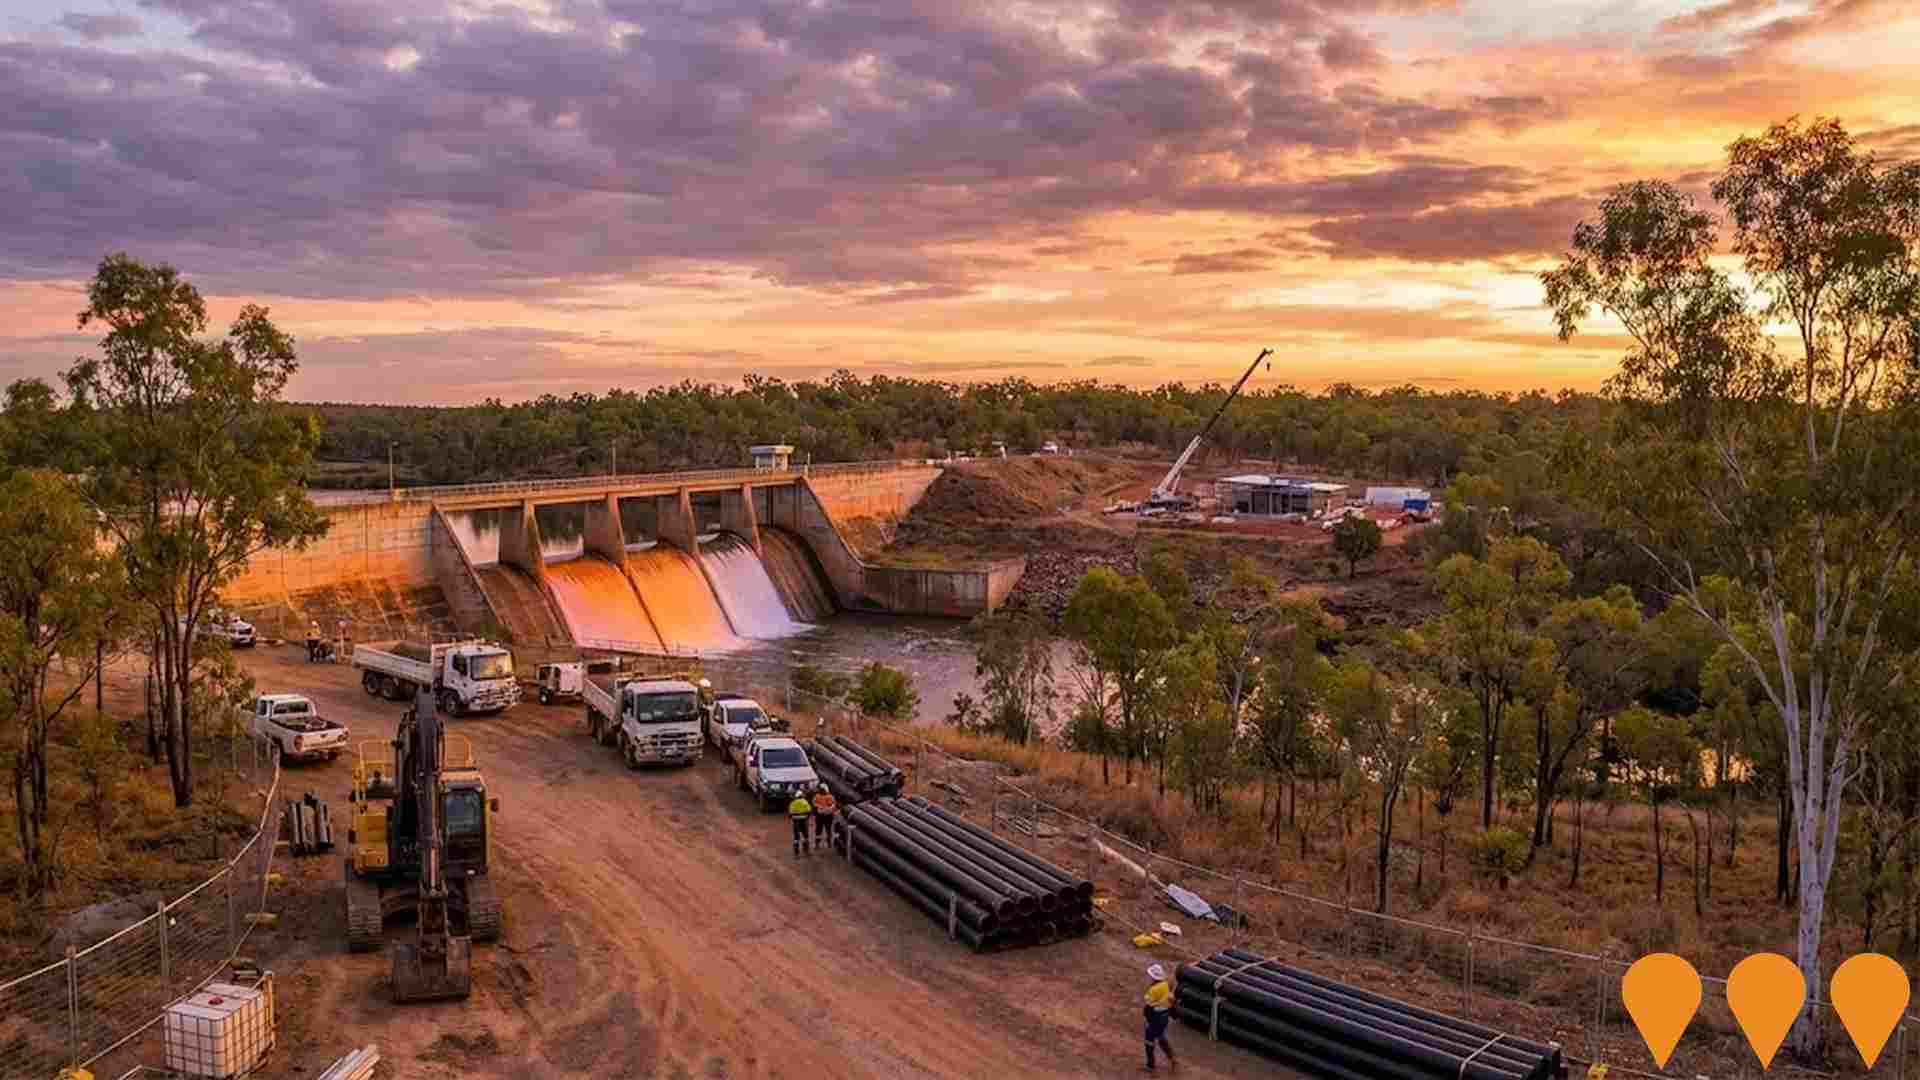
Changes to local infrastructure significantly impact an area's performance. AreaSearch identified 79 projects likely affecting the region. Notable ones include Adelaide River Off-Stream Water Storage, Manton Dam Return to Service, Batchelor Solar Farm (ENI), and Merricks Capital Batchelor Solar Farm. The following details those most relevant.
Professional plan users can use the search below to filter and access additional projects.
INFRASTRUCTURE SEARCH
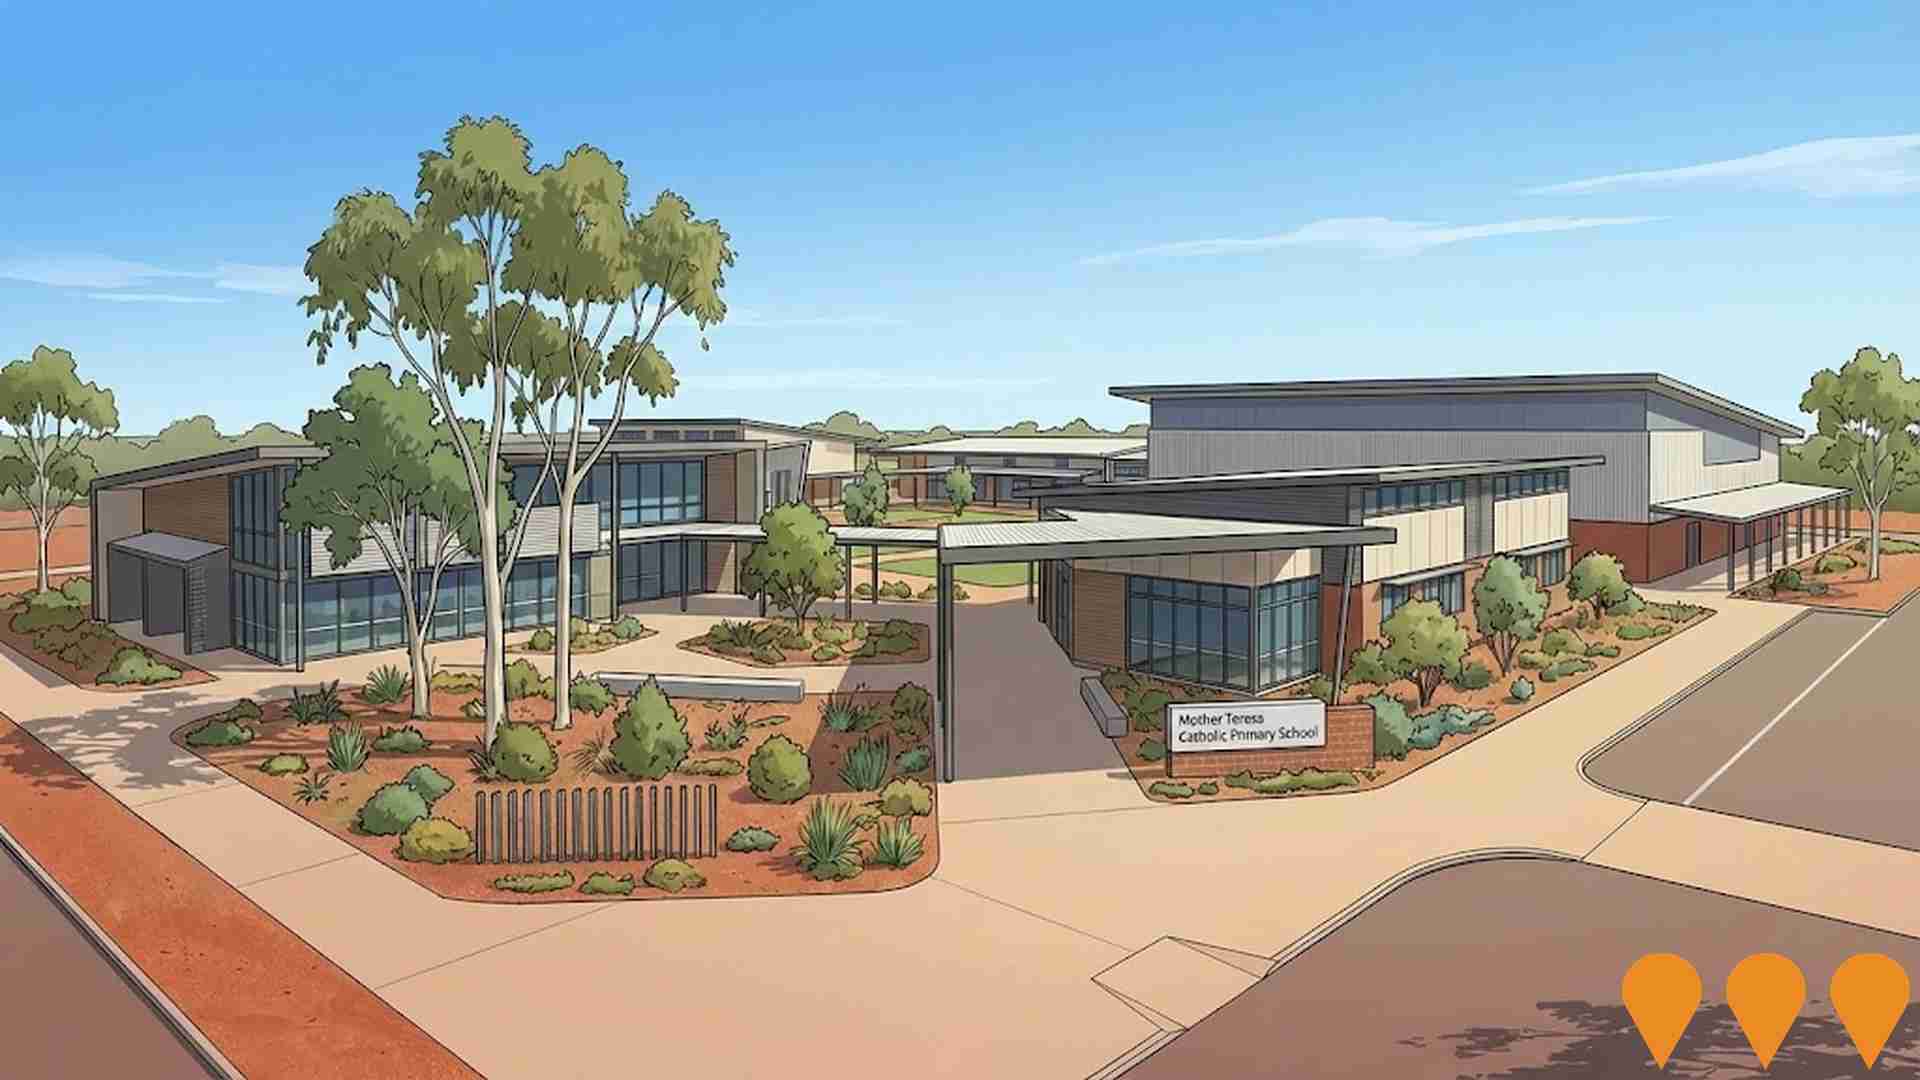
 Denotes AI-based impression for illustrative purposes only, not to be taken as definitive under any circumstances. Please follow links and conduct other investigations from the project's source for actual imagery. Developers and project owners wishing us to use original imagery please Contact Us and we will do so.
Frequently Asked Questions - Infrastructure
Darwin Light Rail Stage 1
A proposed mass transit system, likely light rail or rapid bus, connecting Darwin CBD to Palmerston via the Stuart Highway corridor. The project aims to manage future population growth, reduce congestion, and improve connectivity between the two major population centres as part of the long-term Darwin Regional Transport Plan. While currently in the strategic planning phase with no immediate construction funding, the corridor has been identified for future preservation to support a '30-minute city' concept.

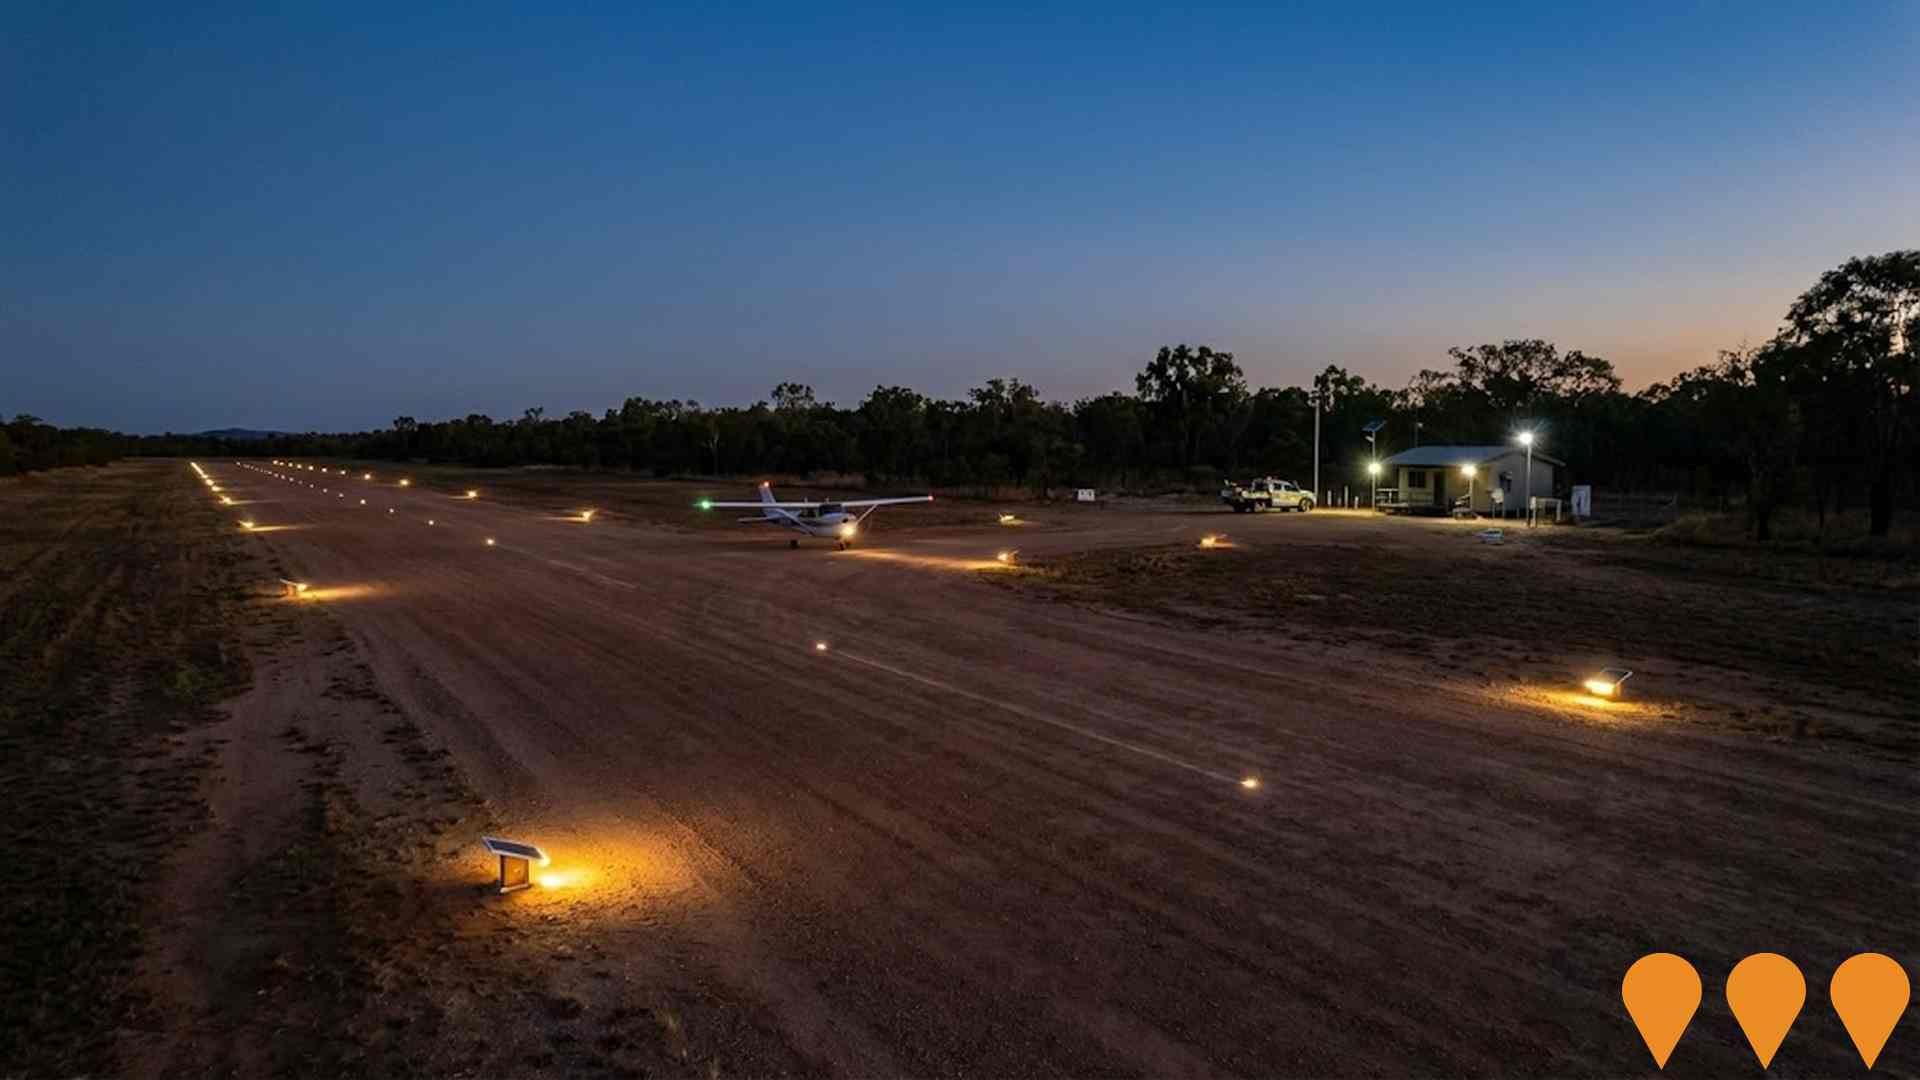
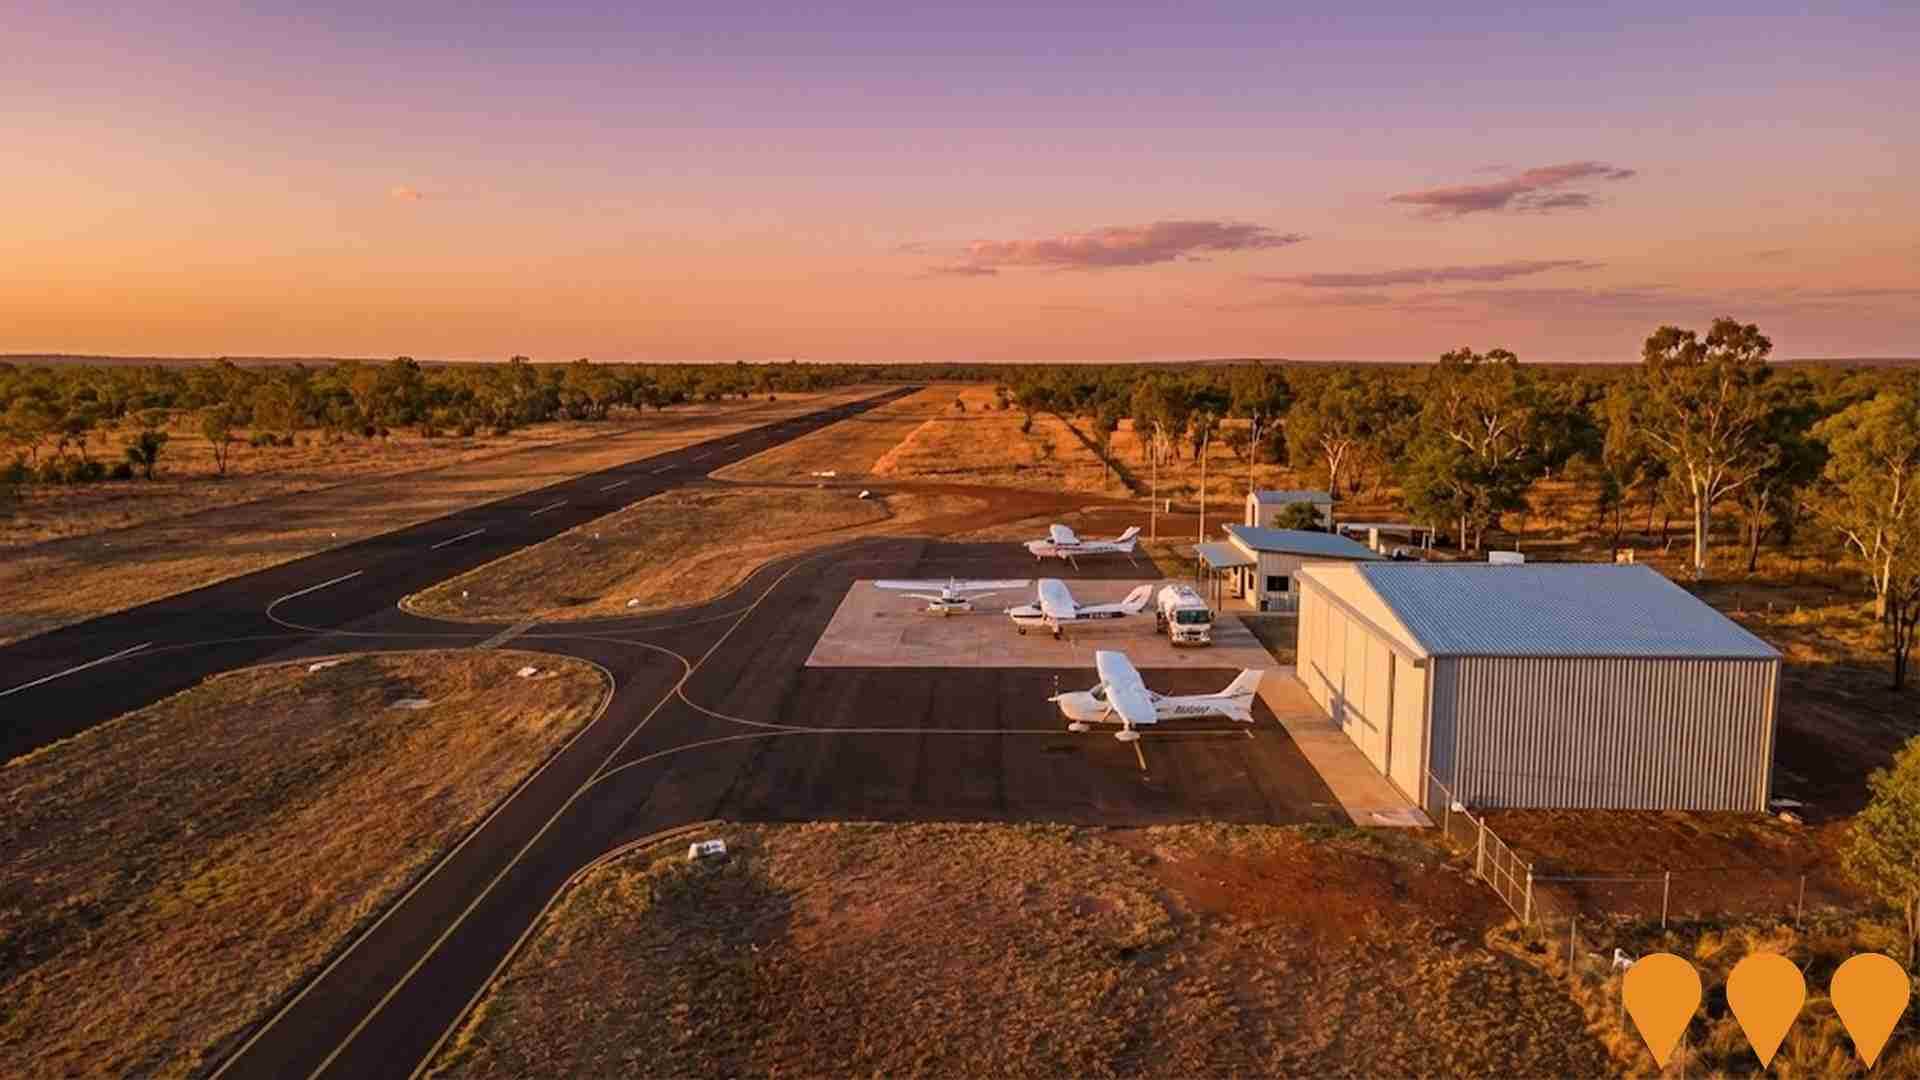
Batchelor Airport Master Plan
Comprehensive master plan to transform Batchelor Airport into an aviation hub supporting commercial general aviation activities. The development will be staged over 20+ years, with Stage 1 focusing on hangar facilities and infrastructure upgrades within 10 years. Stages 2 and 3 will involve incremental expansion of facilities to accommodate aircraft parking, movements and an increased number of hangar sites. Long term works will be subject to approvals as the project progresses.
Zuccoli Aspire
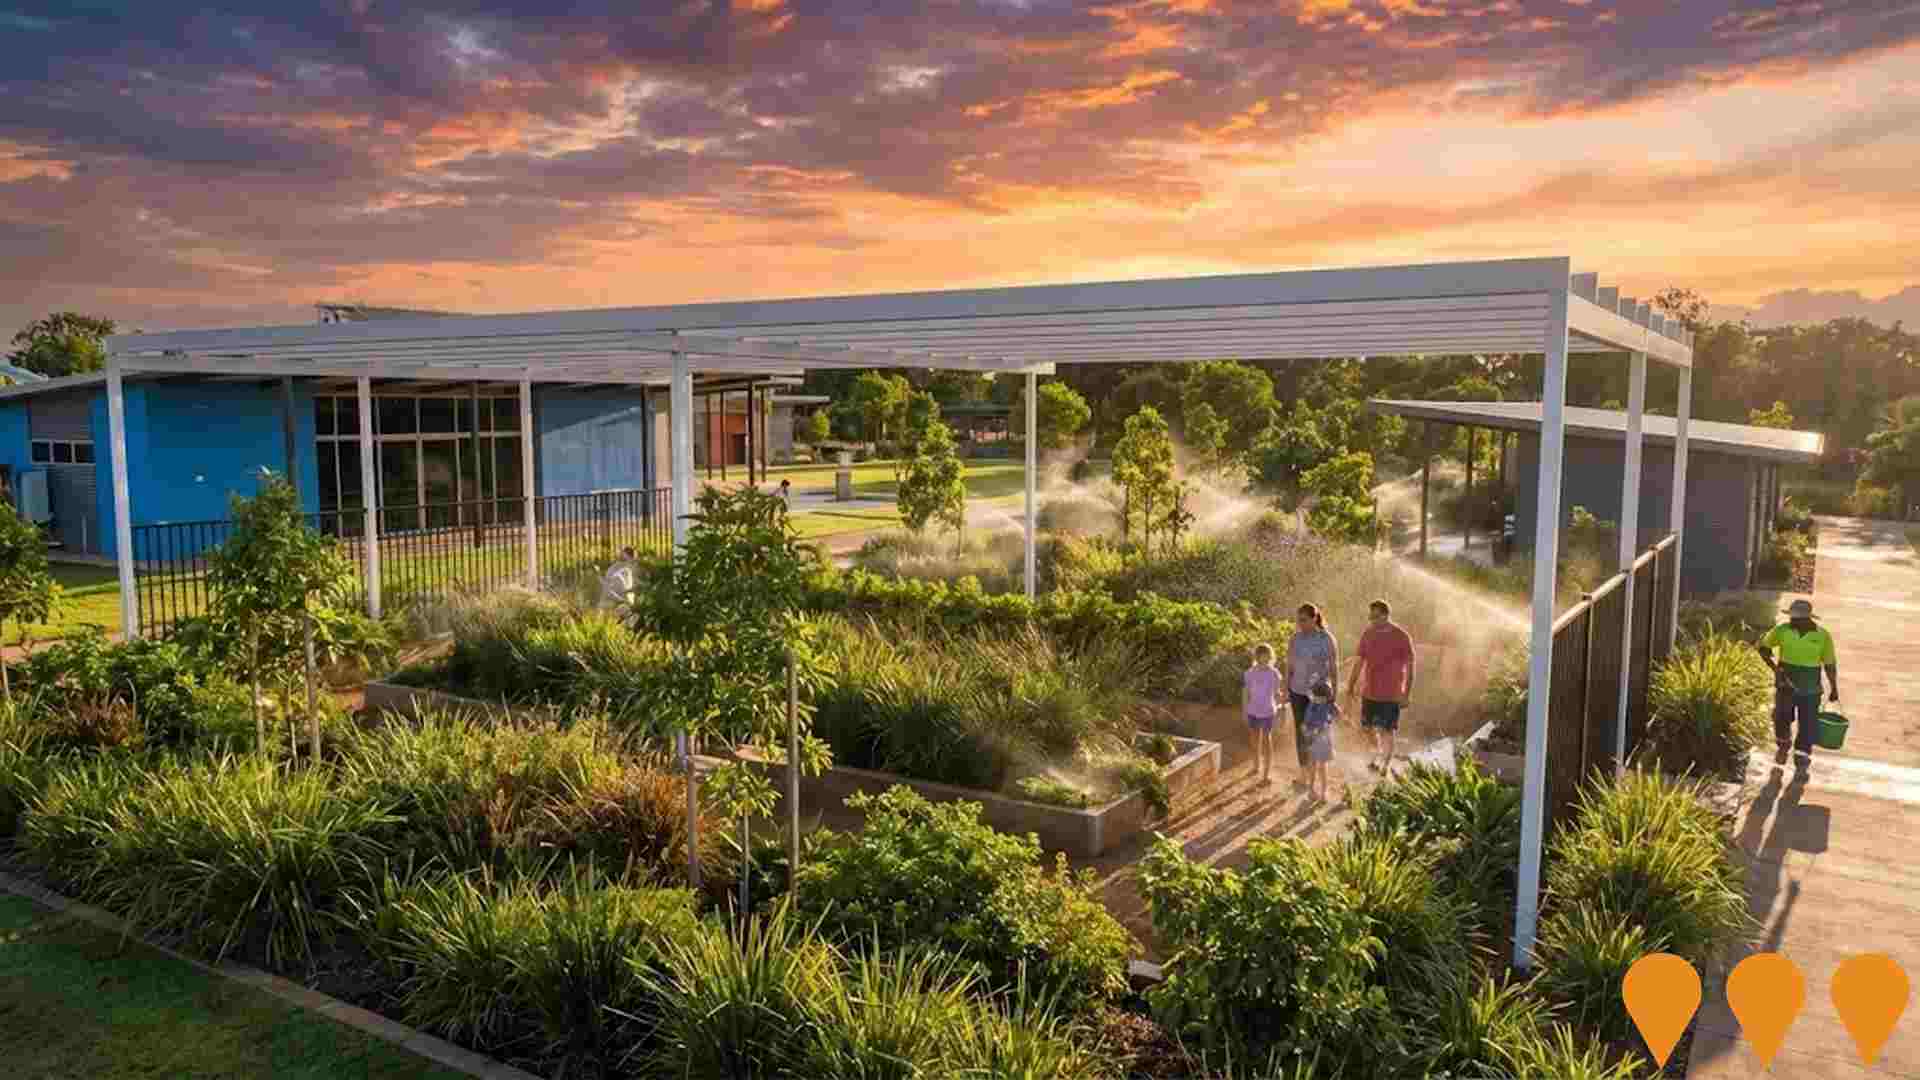
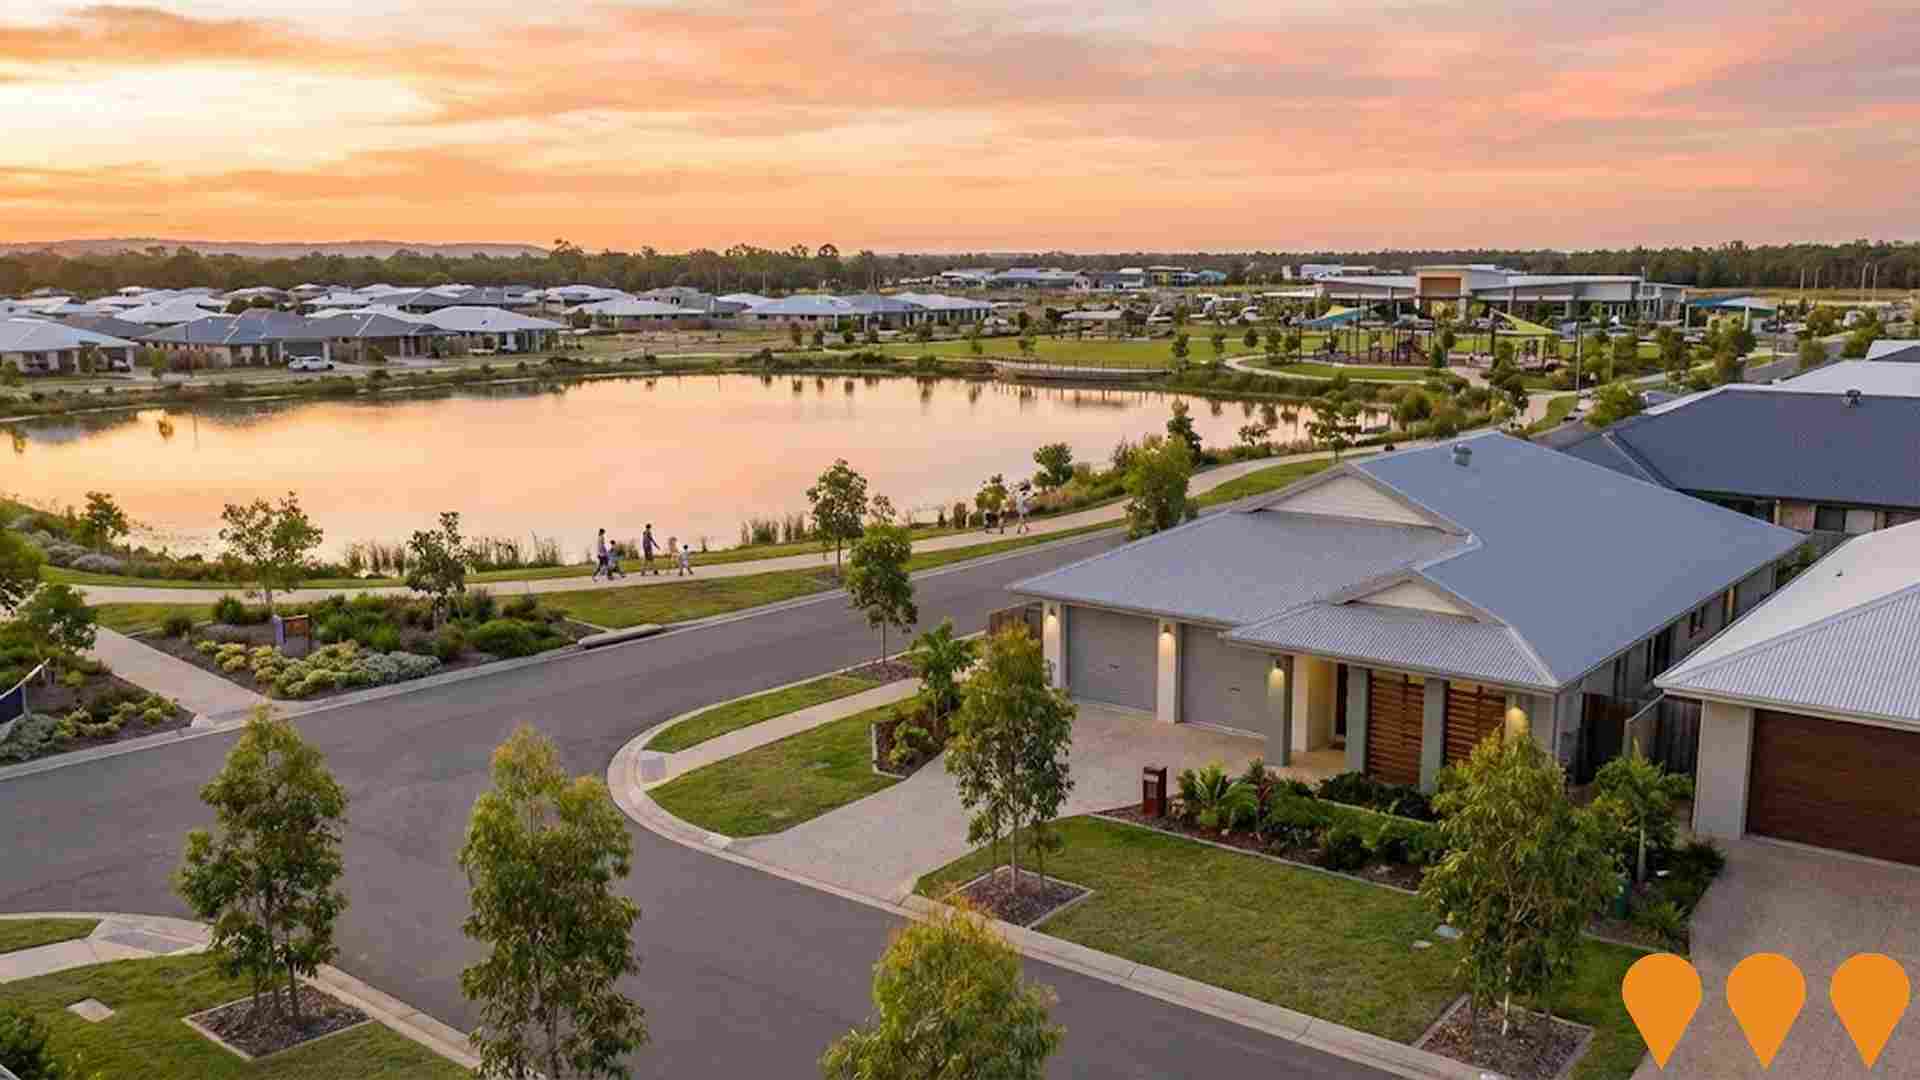
A 12-stage residential land development featuring over 1,500 homes for approximately 5,000 residents. Includes lakes, parks, schools, childcare centres, and a planned town centre with a supermarket. Features the Lotuslily lakeside release in Stage 4A with 66 lots, integrating natural surroundings and community amenities.
Darwin Renewable Energy Hub
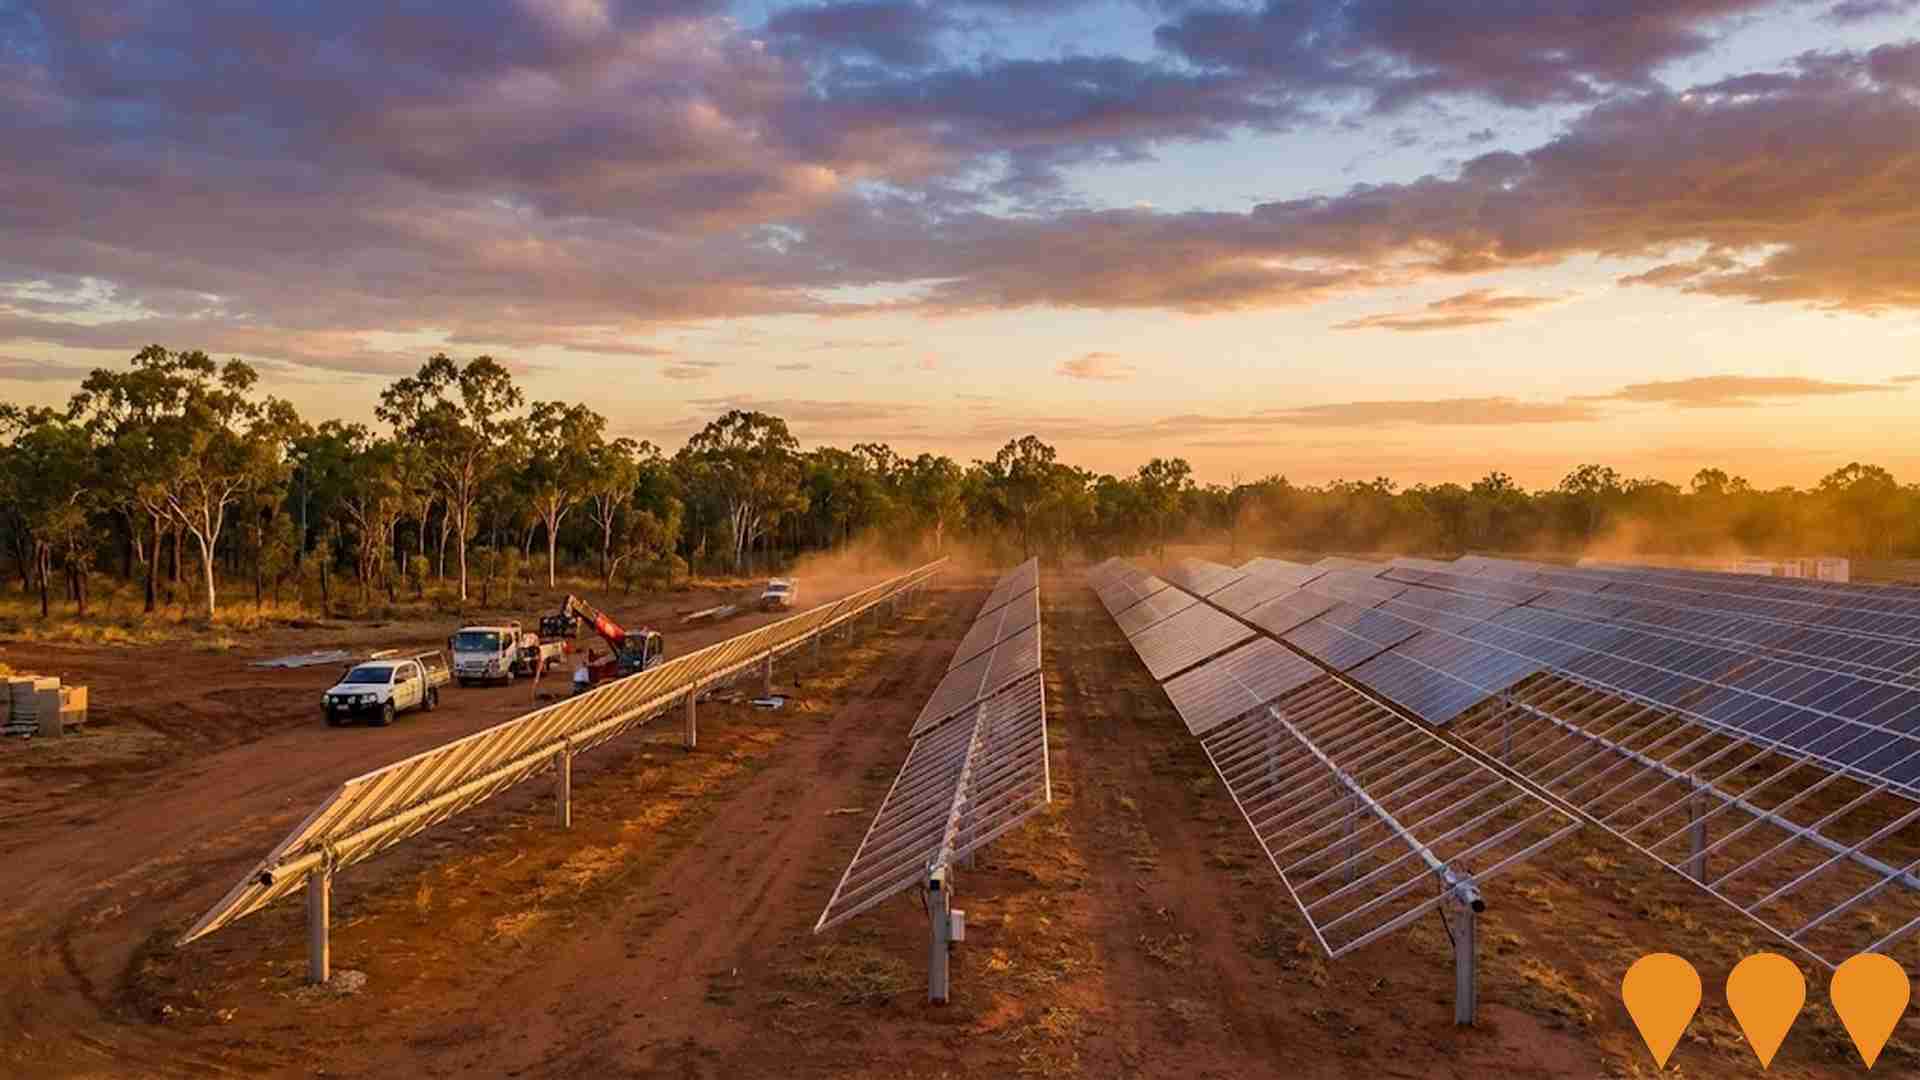
Northern Territory Government proposal to co-locate up to six utility-scale solar farms (total 180-210 MW) with a battery energy storage system on 940 ha of Crown Land west of Finn Road, feeding the Darwin-Katherine grid. Site identified for industry in regional land use plans; consultation held to February 28, 2025 and environmental assessment processes are underway.

Hudson Creek Power Station
12MW natural gas-fired power plant, NT's first privately owned grid-connected gas generation facility. Features 25% lower emissions than average NT gas generators. Part of dual project with Batchelor Solar Farm, creating 162 construction jobs and providing vital grid stability to Darwin-Katherine network.

Marine Industry Park
Marine and offshore industries servicing hub at East Arm, Darwin. Stage 1 planning approval is secured for a purpose-built industrial subdivision near the new Darwin Ship Lift, with expressions of interest open for serviced lots. Existing common-user facilities include an all-tide barge ramp (first point of entry) and a secure hardstand supporting storage and fabrication activities.

Batchelor Solar Farm (ENI)
12.5MW DC solar farm with approximately 28,756 PV modules and 324 Nextracker single-axis trackers, generating 53,000 MWh annually. Features single-axis tracking technology and cloud coverage prediction system. Supplies clean energy to power approximately 11,500 homes and reduces CO2 emissions equivalent to removing 14,700 cars from roads. Part of ENI's renewable energy portfolio in Australia, contributing to NT's 50% renewable target by 2030.
Mitchell Creek Green
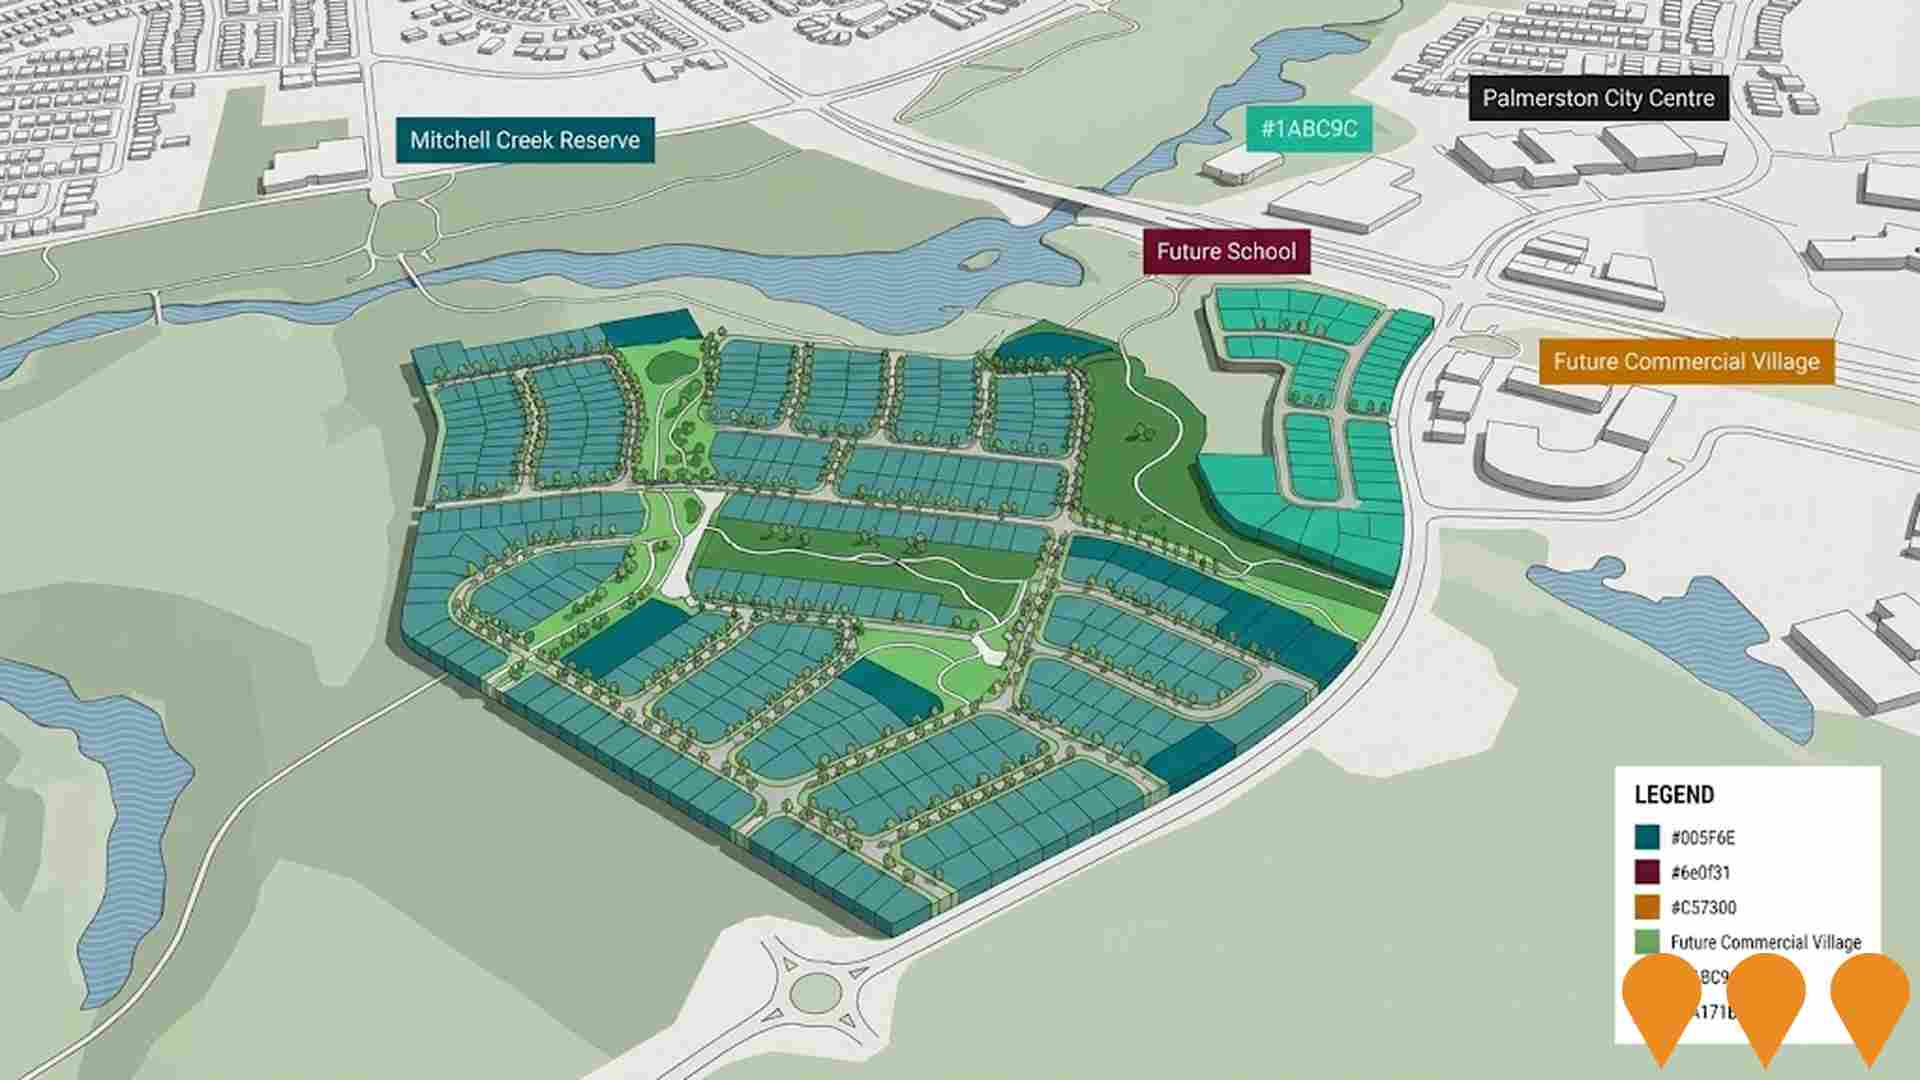
50-hectare master-planned development by Territory Life, housing 500+ homes. Located along Mitchell Creek with conservation corridor. 70% complete with natural environment integration and affordable housing options. Features walking trails and wildlife preservation.
Employment
Despite maintaining a low unemployment rate of 2.7%, Alligator has experienced recent job losses, resulting in a below average employment performance ranking when compared nationally
Alligator has a skilled workforce with prominent tourism and hospitality sectors. Its unemployment rate is 2.7%.
As of September 2025, 2,946 residents are employed at an unemployment rate of 3.2%, below Rest of NT's rate of 5.9%. Workforce participation is lower at 48.7% compared to Rest of NT's 50.7%. Dominant employment sectors include accommodation & food, public administration & safety, and education & training. Alligator specializes in accommodation & food with an employment share 2.1 times the regional level, but health care & social assistance shows lower representation at 7.2% versus the regional average of 18.8%.
The area offers limited local employment opportunities. From May 2024 to April 2025, labour force decreased by 1.2% and employment declined by 1.3%, keeping unemployment relatively stable. In contrast, Rest of NT saw employment contract by 1.3%, labour force fall by 1.2%, and unemployment rise marginally. Jobs and Skills Australia's national employment forecasts from May-25 project national employment growth of 6.6% over five years and 13.7% over ten years. Applying these projections to Alligator's employment mix suggests local employment should increase by 5.3% over five years and 11.6% over ten years, though this is a simple weighting extrapolation for illustrative purposes only.
Frequently Asked Questions - Employment
Income
Income figures position the area below 75% of locations analysed nationally by AreaSearch
AreaSearch's latest postcode level ATO data for financial year 2022 shows that income in Alligator SA2 is below the national average. The median assessed income is $44,687 and the average income stands at $56,966. This contrasts with Rest of NT's figures, where the median income is $51,655 and the average income is $61,577. Based on Wage Price Index growth of 12.01% since financial year 2022, current estimates would be approximately $50,054 (median) and $63,808 (average) as of September 2025. According to the 2021 Census, household, family and personal incomes in Alligator all fall between the 18th and 26th percentiles nationally. The data shows that 28.4% of the population (1,350 individuals) falls within the $1,500 - 2,999 income range, consistent with broader trends across the surrounding region showing 33.6% in the same category. While housing costs are modest with 90.5% of income retained, the total disposable income ranks at just the 27th percentile nationally.
Frequently Asked Questions - Income
Housing
Alligator is characterized by a predominantly suburban housing profile, with above-average rates of outright home ownership
The dwelling structure in Alligator, as per the latest Census data, consisted of 81.6% houses and 18.4% other dwellings such as semi-detached homes, apartments, and 'other' dwellings. This is compared to Non-Metro NT's figures of 83.6% houses and 16.4% other dwellings. The home ownership level in Alligator was recorded at 38.4%, with mortgaged dwellings making up 26.3% and rented dwellings accounting for 35.2%. The median monthly mortgage repayment in the area was $1,430, surpassing Non-Metro NT's average of $1,346. The median weekly rent figure in Alligator stood at $100, higher than Non-Metro NT's $80 but significantly lower than the national averages of $1,863 for mortgage repayments and $375 for rents.
Frequently Asked Questions - Housing
Household Composition
Alligator features high concentrations of lone person households and group households, with a lower-than-average median household size
Family households constitute 62.0% of all households, including 16.5% couples with children, 34.1% couples without children, and 10.4% single parent families. Non-family households account for the remaining 38.0%, with lone person households at 33.3% and group households making up 4.5%. The median household size is 2.2 people, smaller than the Rest of NT average of 3.5.
Frequently Asked Questions - Households
Local Schools & Education
Alligator faces educational challenges, with performance metrics placing it in the bottom quartile of areas assessed nationally
The area has university qualification rates of 18.2%, significantly lower than the Australian average of 30.4%. This presents both a challenge and an opportunity for targeted educational initiatives. Bachelor degrees are the most common at 11.8%, followed by postgraduate qualifications (4.1%) and graduate diplomas (2.3%). Trade and technical skills are prominent, with 43.1% of residents aged 15+ holding vocational credentials – advanced diplomas (10.1%) and certificates (33.0%).
Educational participation is high, with 32.5% of residents currently enrolled in formal education. This includes 14.5% in primary education, 7.8% in secondary education, and 4.0% pursuing tertiary education.
Frequently Asked Questions - Education
Schools Detail
Nearby Services & Amenities
Transport
No public transport data available for this catchment area.
Frequently Asked Questions - Transport
Transport Stops Detail
Health
Health outcomes in Alligator are marginally below the national average with common health conditions slightly more prevalent than average across both younger and older age cohorts
Alligator's health indicators show below-average results, with common health conditions slightly more prevalent than average across both younger and older age groups. The area has a very low rate of private health cover, at approximately 48% of its total population (~2,296 people), compared to the national average of 55.3%.
The most prevalent medical conditions are arthritis (affecting 8.3% of residents) and asthma (6.2%), while 69.8% report having no medical ailments, compared to 78.5% in the Rest of NT. The area has a higher proportion of seniors aged 65 and over at 22.5% (1,071 people), compared to 9.4% in the Rest of NT. Despite this, health outcomes among seniors are notably strong, even outperforming the general population in health metrics.
Frequently Asked Questions - Health
Cultural Diversity
In terms of cultural diversity, Alligator records figures broadly comparable to the national average, as found in AreaSearch's assessment of a number of language and cultural background related metrics
Alligator's population shows cultural diversity with 17.5% born overseas and 18.6% speaking a language other than English at home. Christianity is the predominant religion, comprising 40.6%. The 'Other' religious category stands at 1.7%, lower than the Rest of NT average of 6.9%.
In terms of ancestry, English (24.6%) and Australian (24.2%) are significantly higher than regional averages of 10.2% and 9.9% respectively. However, Australian Aboriginal ancestry is notably lower at 19.0%, compared to the region's 64.6%. Notable ethnic group representations include Vietnamese at 2.0%, Maori at 0.6%, and Filipino at 1.3%, all higher than regional averages.
Frequently Asked Questions - Diversity
Age
Alligator hosts an older demographic, ranking in the top quartile nationwide
Alligator's median age is 47 years, significantly higher than the Rest of NT average of 31 and considerably older than the Australian median of 38. Compared to the Rest of NT average, the 65-74 cohort is notably over-represented at 15.2% locally, while the 25-34 age group is under-represented at 11.6%. This 65-74 concentration is well above the national average of 9.4%. According to the 2021 Census, the 75 to 84 age group has grown from 3.9% to 6.5% of the population, while the 45 to 54 cohort has declined from 16.8% to 14.6%. By 2041, demographic modeling suggests Alligator's age profile will evolve significantly. The 75 to 84 cohort is projected to grow by 84%, adding 259 residents to reach 569. Residents aged 65 and older represent 76% of anticipated growth, while population declines are projected for the 35-44 and 5-14 cohorts.
