Chart Color Schemes
This analysis uses ABS Statistical Areas Level 2 (SA2) boundaries, which can materially differ from Suburbs and Localities (SAL) even when sharing similar names.
SA2 boundaries are defined by the Australian Bureau of Statistics and are designed to represent communities for statistical reporting (e.g., census and ERP).
Suburbs and Localities (SAL) represent commonly-used suburb/locality names (postal-style areas) and may use different geographic boundaries. For comprehensive analysis, consider reviewing both boundary types if available.
est. as @ -- *
ABS ERP | -- people | --
2021 Census | -- people
Sales Activity
Curious about local property values? Filter the chart to assess the volume and appreciation (including resales) trends and regional comparisons, or scroll to the map below view this information at an individual property level.
Find a Recent Sale
Sales Detail
Population
Deniliquin has shown very soft population growth performance across periods assessed by AreaSearch
Deniliquin's population, as of November 2025, is approximately 7,258, reflecting a growth of 3.1% since the 2021 Census which recorded 7,038 people. This increase is inferred from an estimated resident population of 7,054 in June 2024 and an additional 138 validated new addresses since the Census date. The population density is around 50 persons per square kilometer. Deniliquin's growth rate of 3.1% is within 2.0 percentage points of the non-metro area's growth rate of 5.1%. Overseas migration was the primary driver of population growth during recent periods. AreaSearch uses ABS/Geoscience Australia projections for each SA2 area, released in 2024 with a base year of 2022, and NSW State Government's SA2 level projections for areas not covered by this data, released in 2022 with a base year of 2021.
Growth rates by age group from these aggregations are applied to all areas for the years 2032 to 2041. According to these projections, Deniliquin's population is expected to decline by 48 persons by 2041, while specific age cohorts like the 75 to 84 group are projected to increase by 239 people.
Frequently Asked Questions - Population
Development
AreaSearch assessment of residential development drivers sees a low level of activity in Deniliquin, placing the area among the bottom 25% of areas assessed nationally
Deniliquin has seen approximately 14 new homes approved annually. Between FY2021 and FY2025, 74 homes were approved, with an additional 7 approved in FY2026 so far. This rate of approval may indicate that supply is keeping pace with demand despite population decline, providing good choice for buyers.
The average expected construction cost value of new homes is $433,000, which is higher than regional norms, reflecting quality-focused development. In FY2026, $6.8 million in commercial development approvals have been recorded, demonstrating the area's primarily residential nature. Compared to the Rest of NSW, Deniliquin shows significantly reduced construction activity, with 64.0% fewer approvals per person. This limited new supply generally supports stronger demand and values for established dwellings. The area is also under the national average for construction activity, indicating its established nature and suggesting potential planning limitations.
New development in Deniliquin consists of 92.0% detached houses and 8.0% medium to high-density housing, maintaining the area's traditional low density character with a focus on family homes appealing to those seeking space. The estimated population per dwelling approval is 516 people, reflecting its quiet, low activity development environment. With population expected to remain stable or decline, Deniliquin should see reduced pressure on housing, potentially creating opportunities for buyers in the future.
Frequently Asked Questions - Development
Infrastructure
Deniliquin has emerging levels of nearby infrastructure activity, ranking in the 37thth percentile nationally
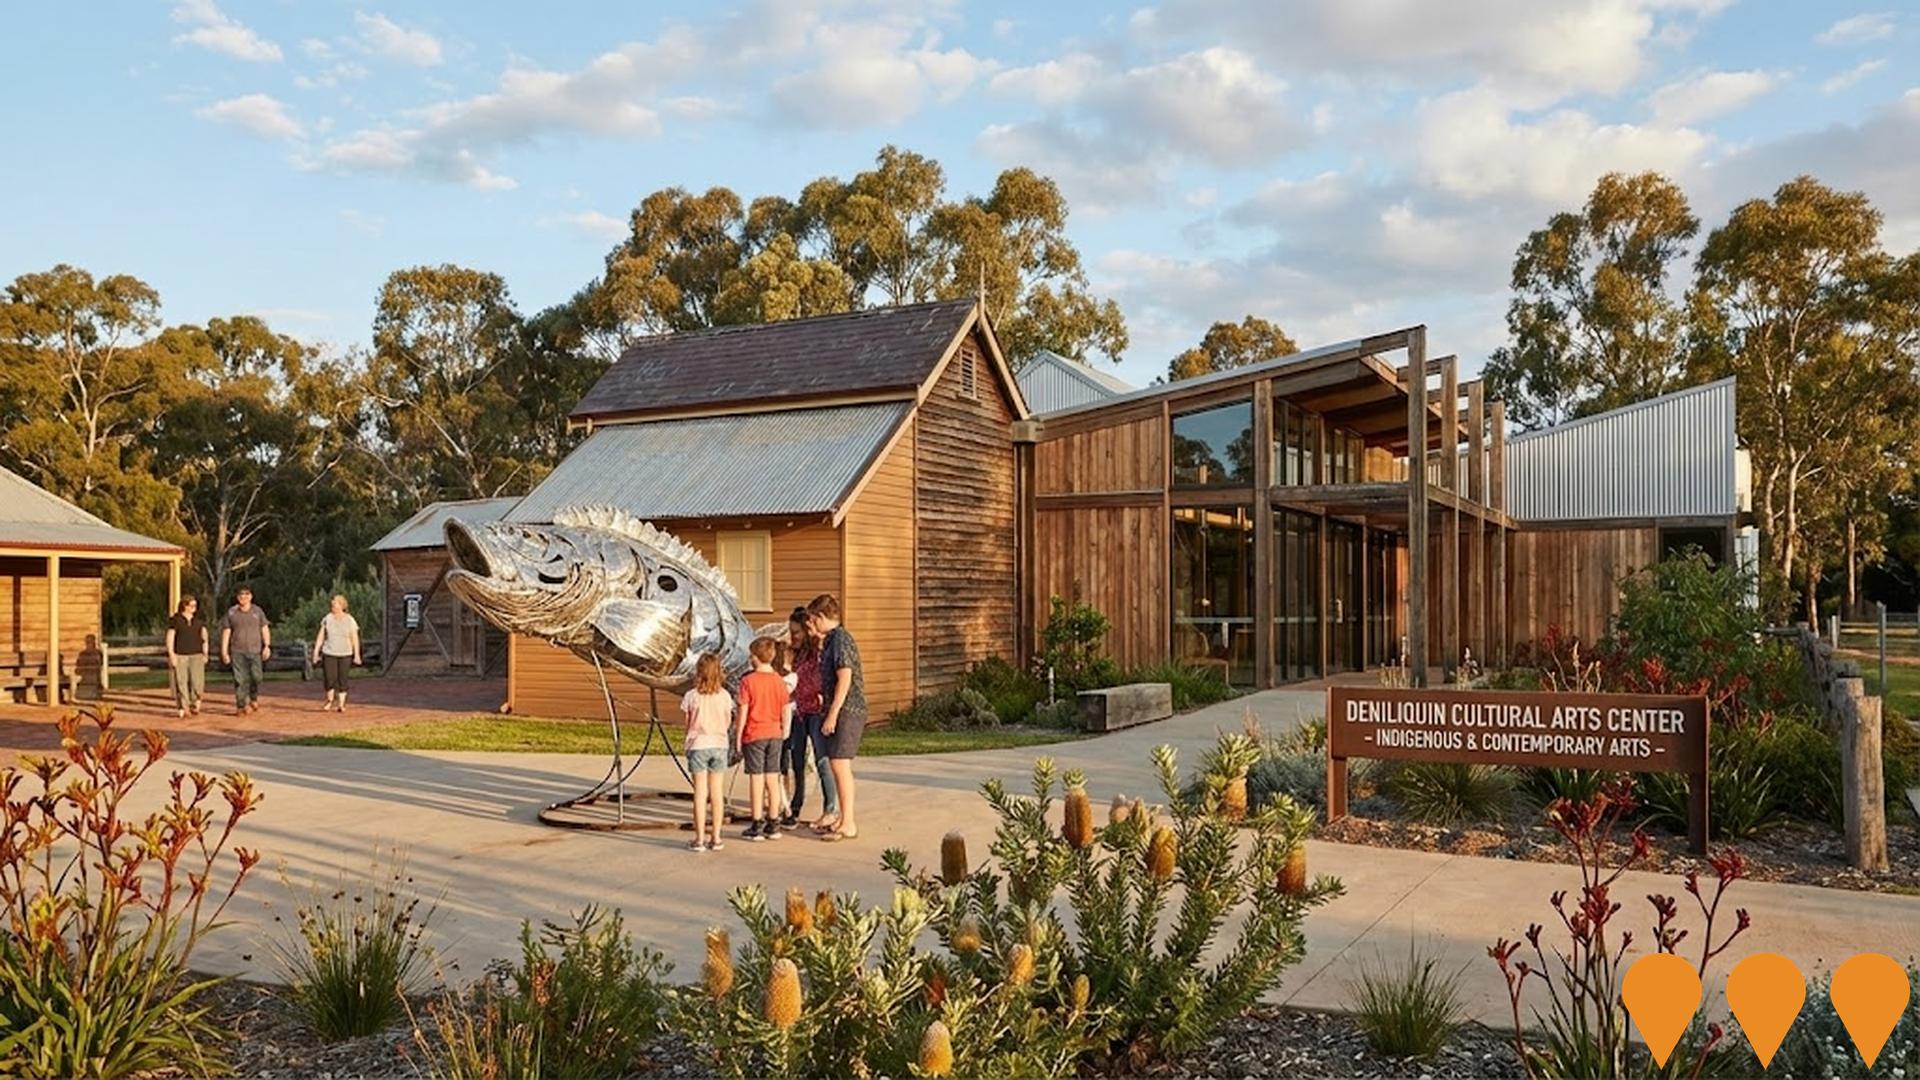
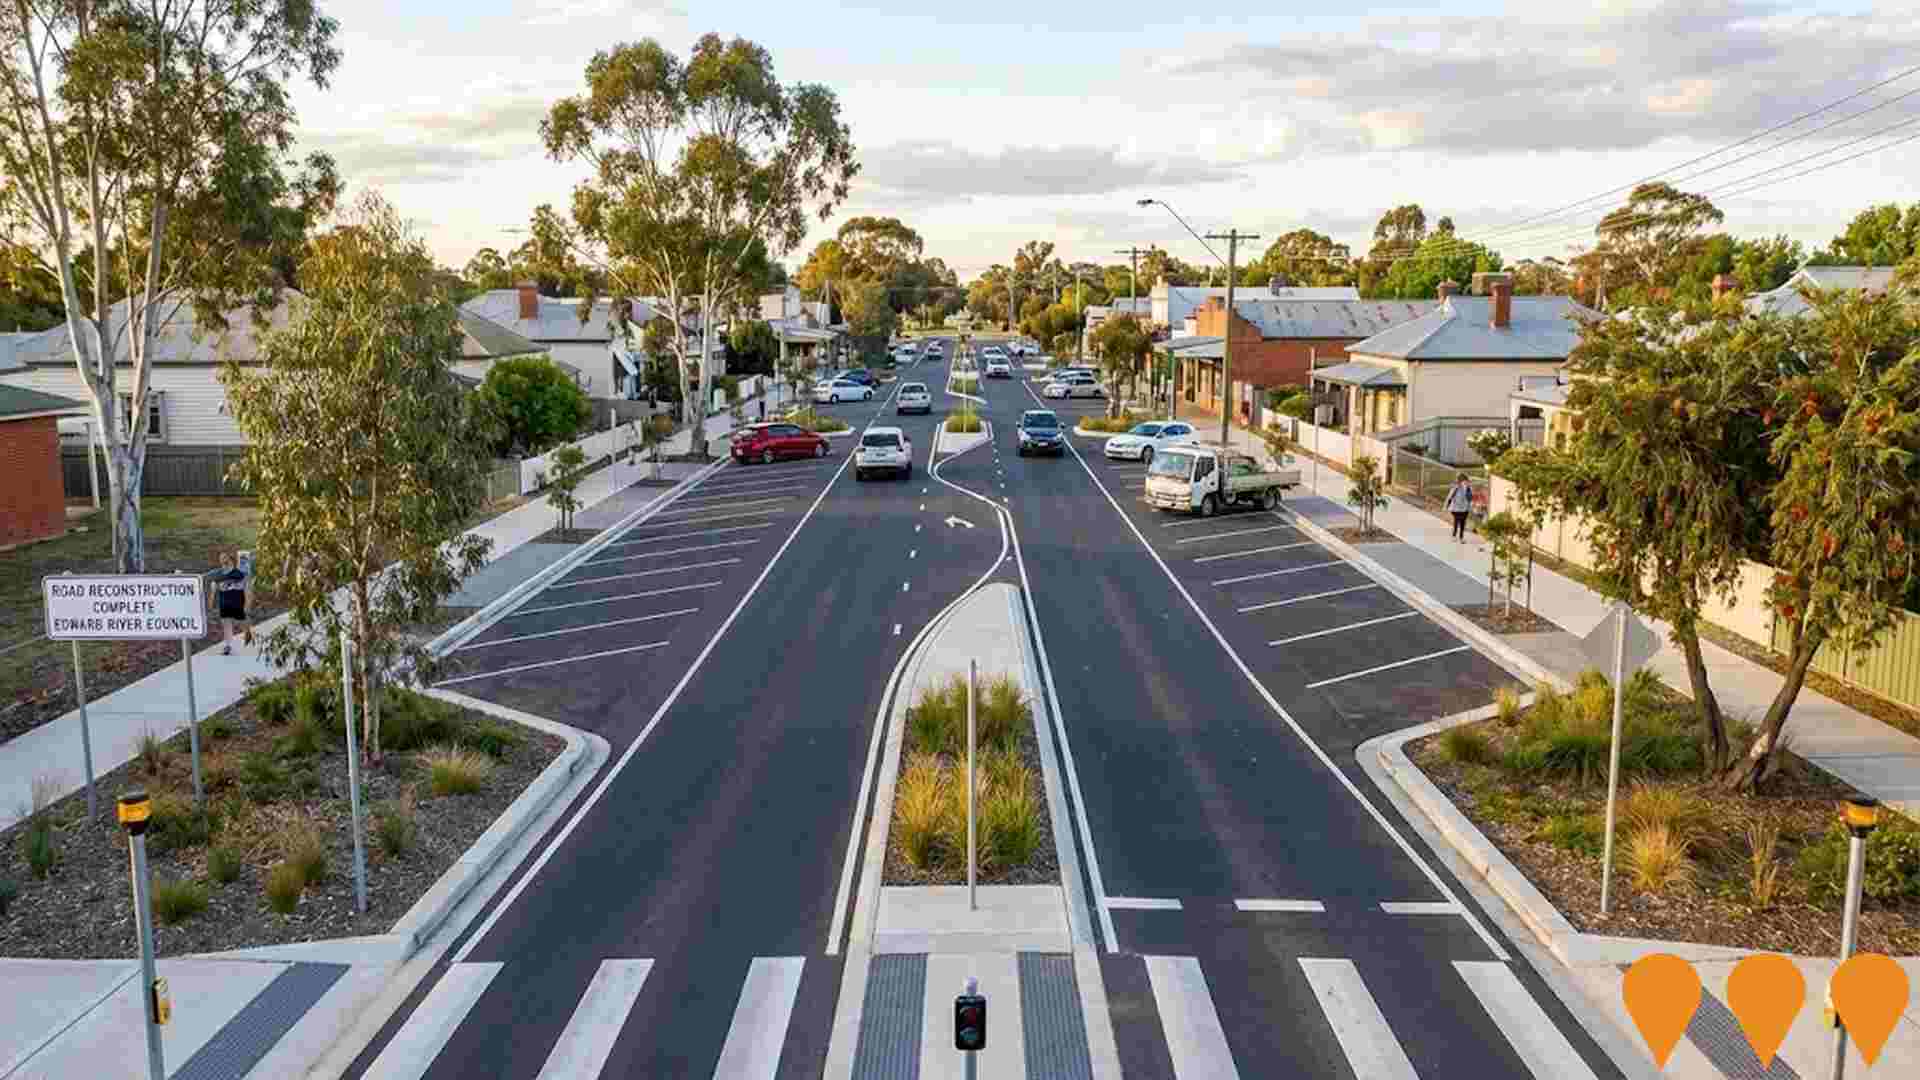
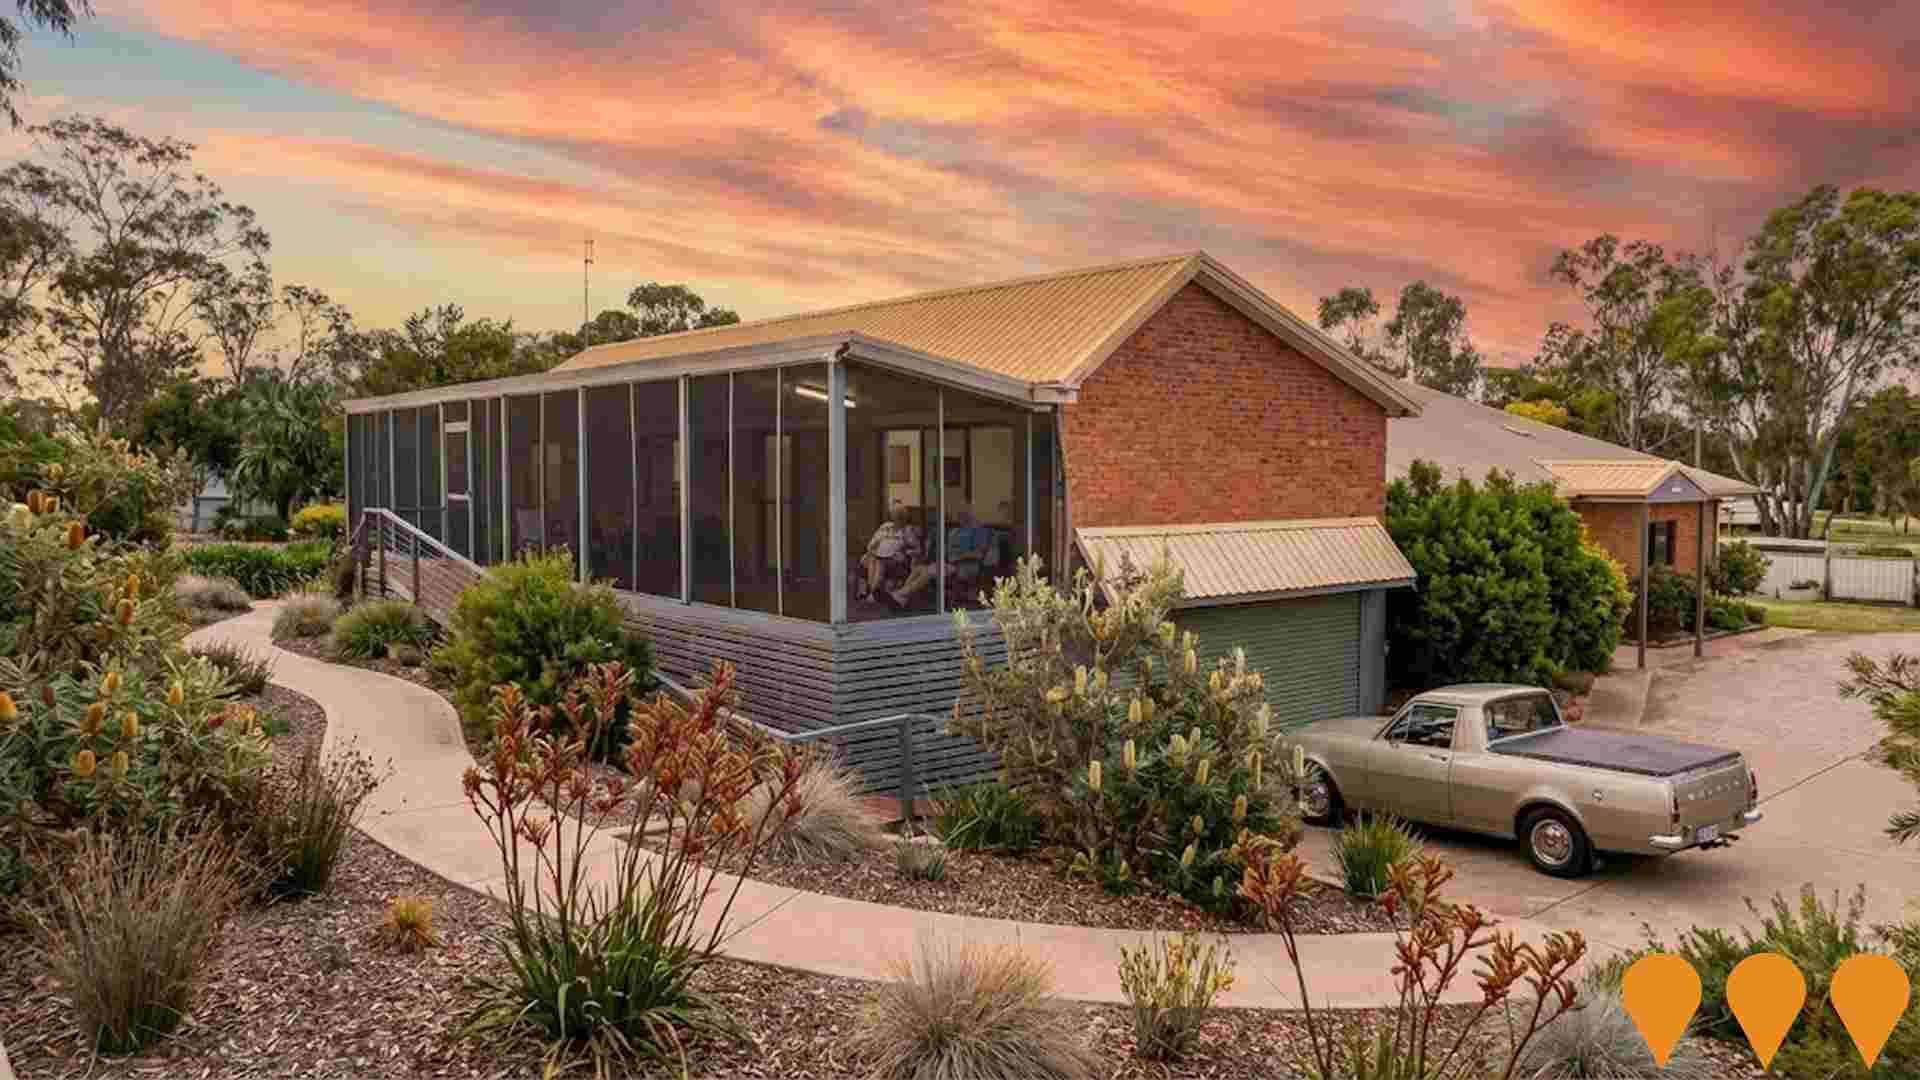
The performance of an area can significantly be influenced by changes in local infrastructure, major projects, and planning initiatives. AreaSearch has identified a total of 13 such projects that are likely to impact the area. Notable among these are Deniliquin Hospital Redevelopment, Deniliquin Battery Energy Storage System (BESS), Hardinge Street Road Reconstruction Project, and Deniliquin Cultural Arts Center. The following list details those projects considered most relevant:.
Professional plan users can use the search below to filter and access additional projects.
INFRASTRUCTURE SEARCH
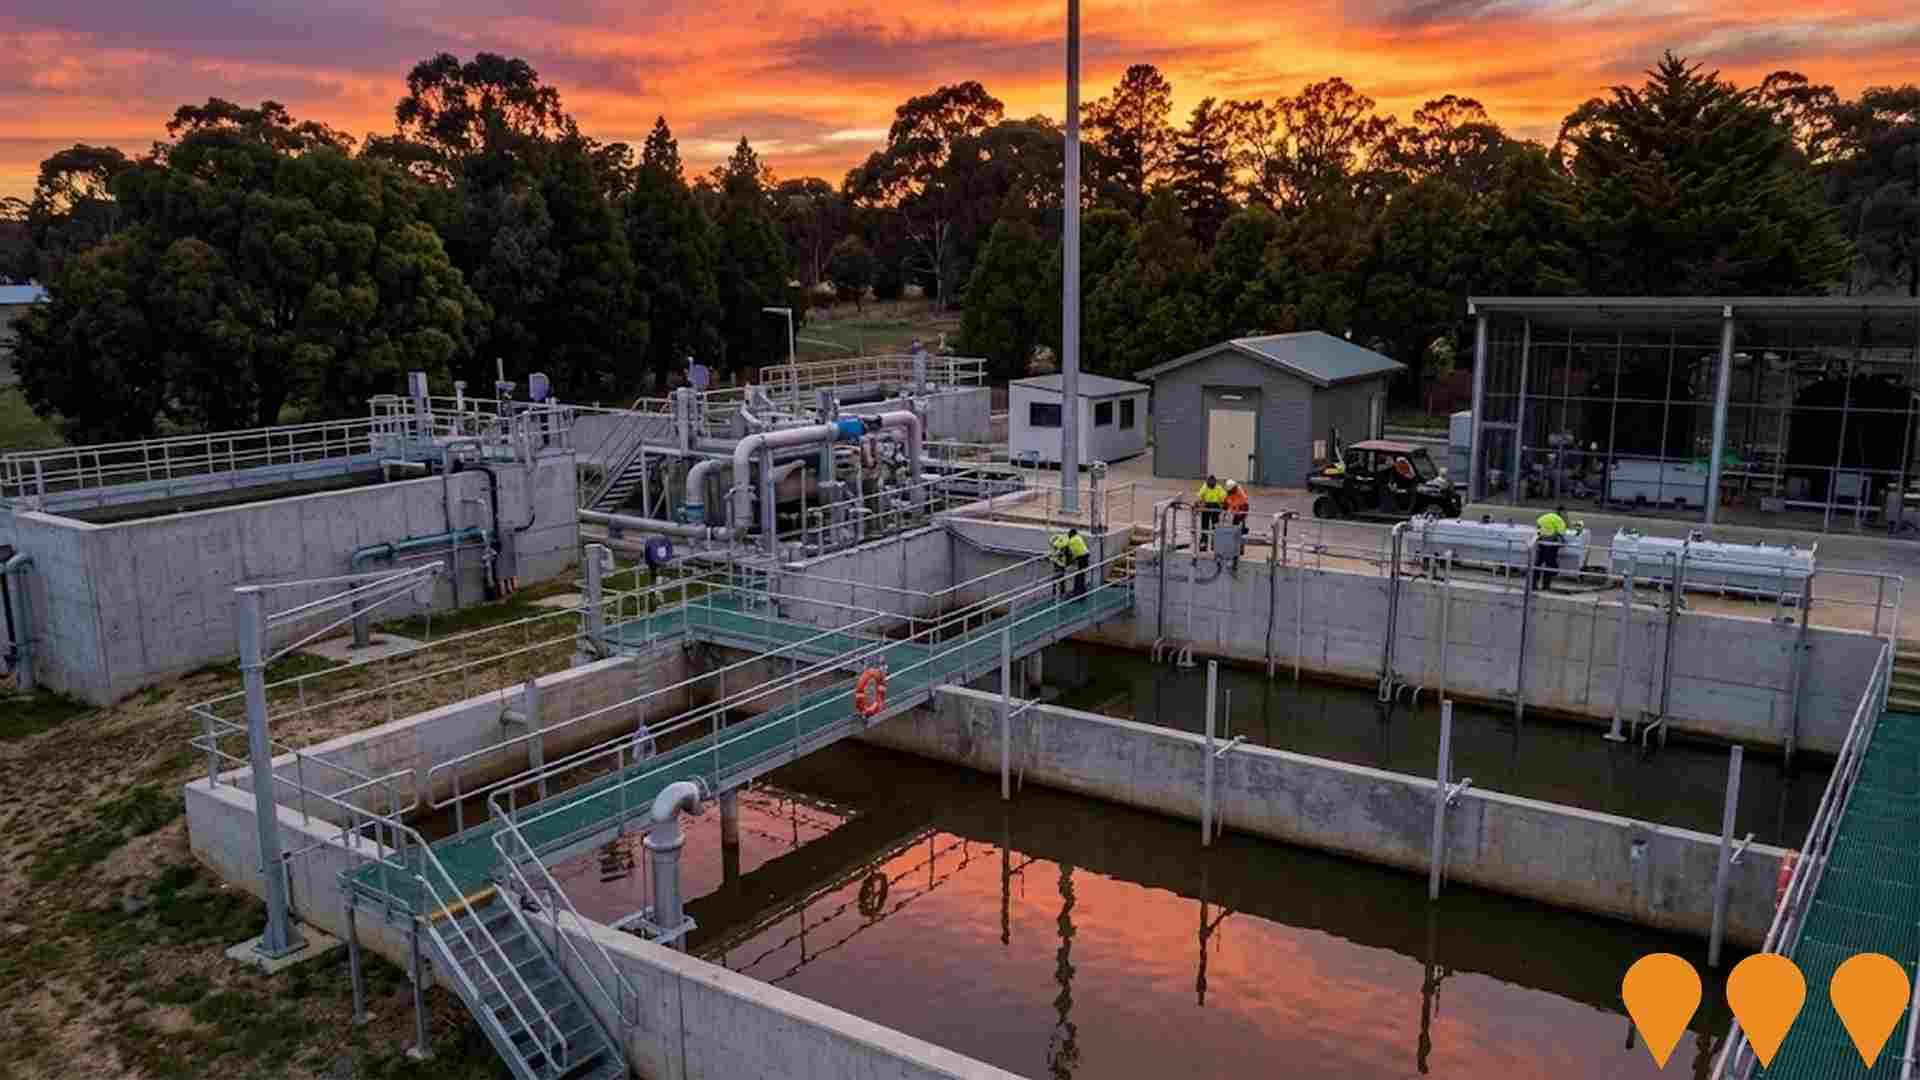
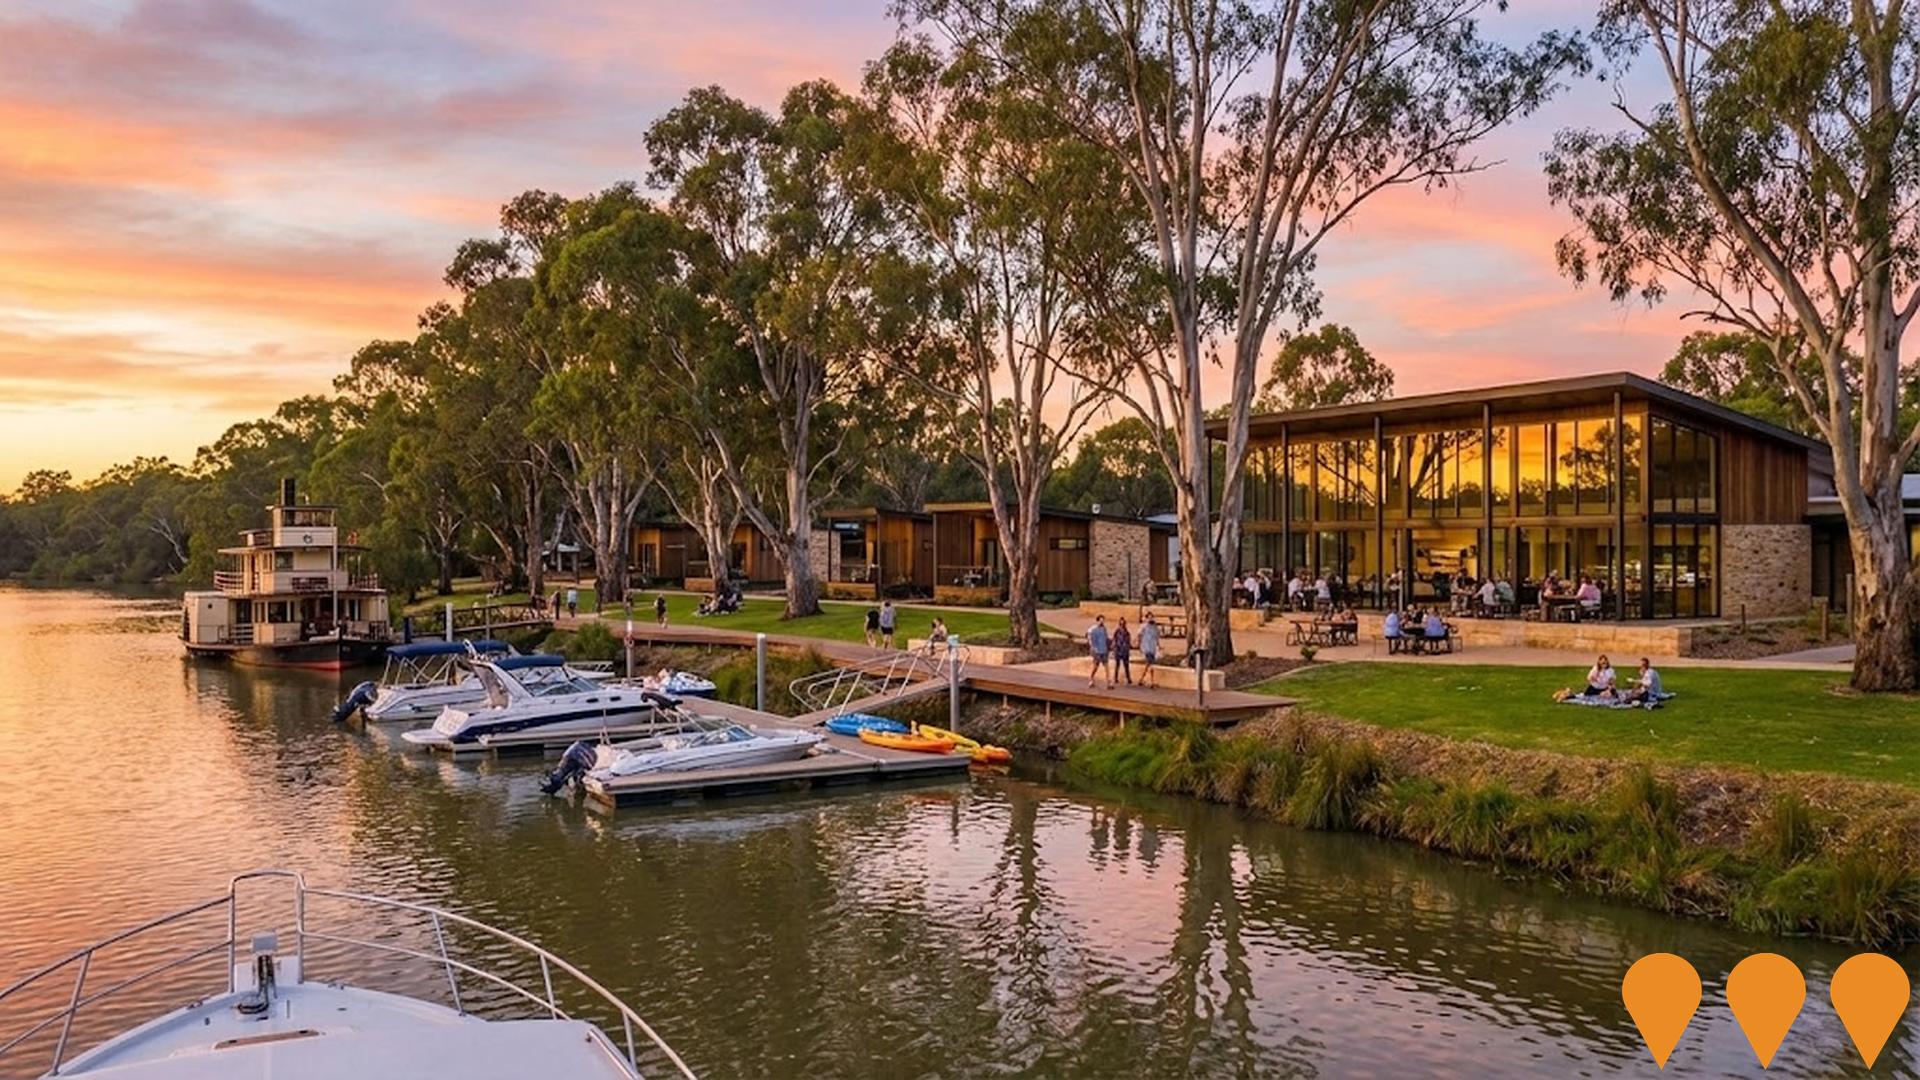
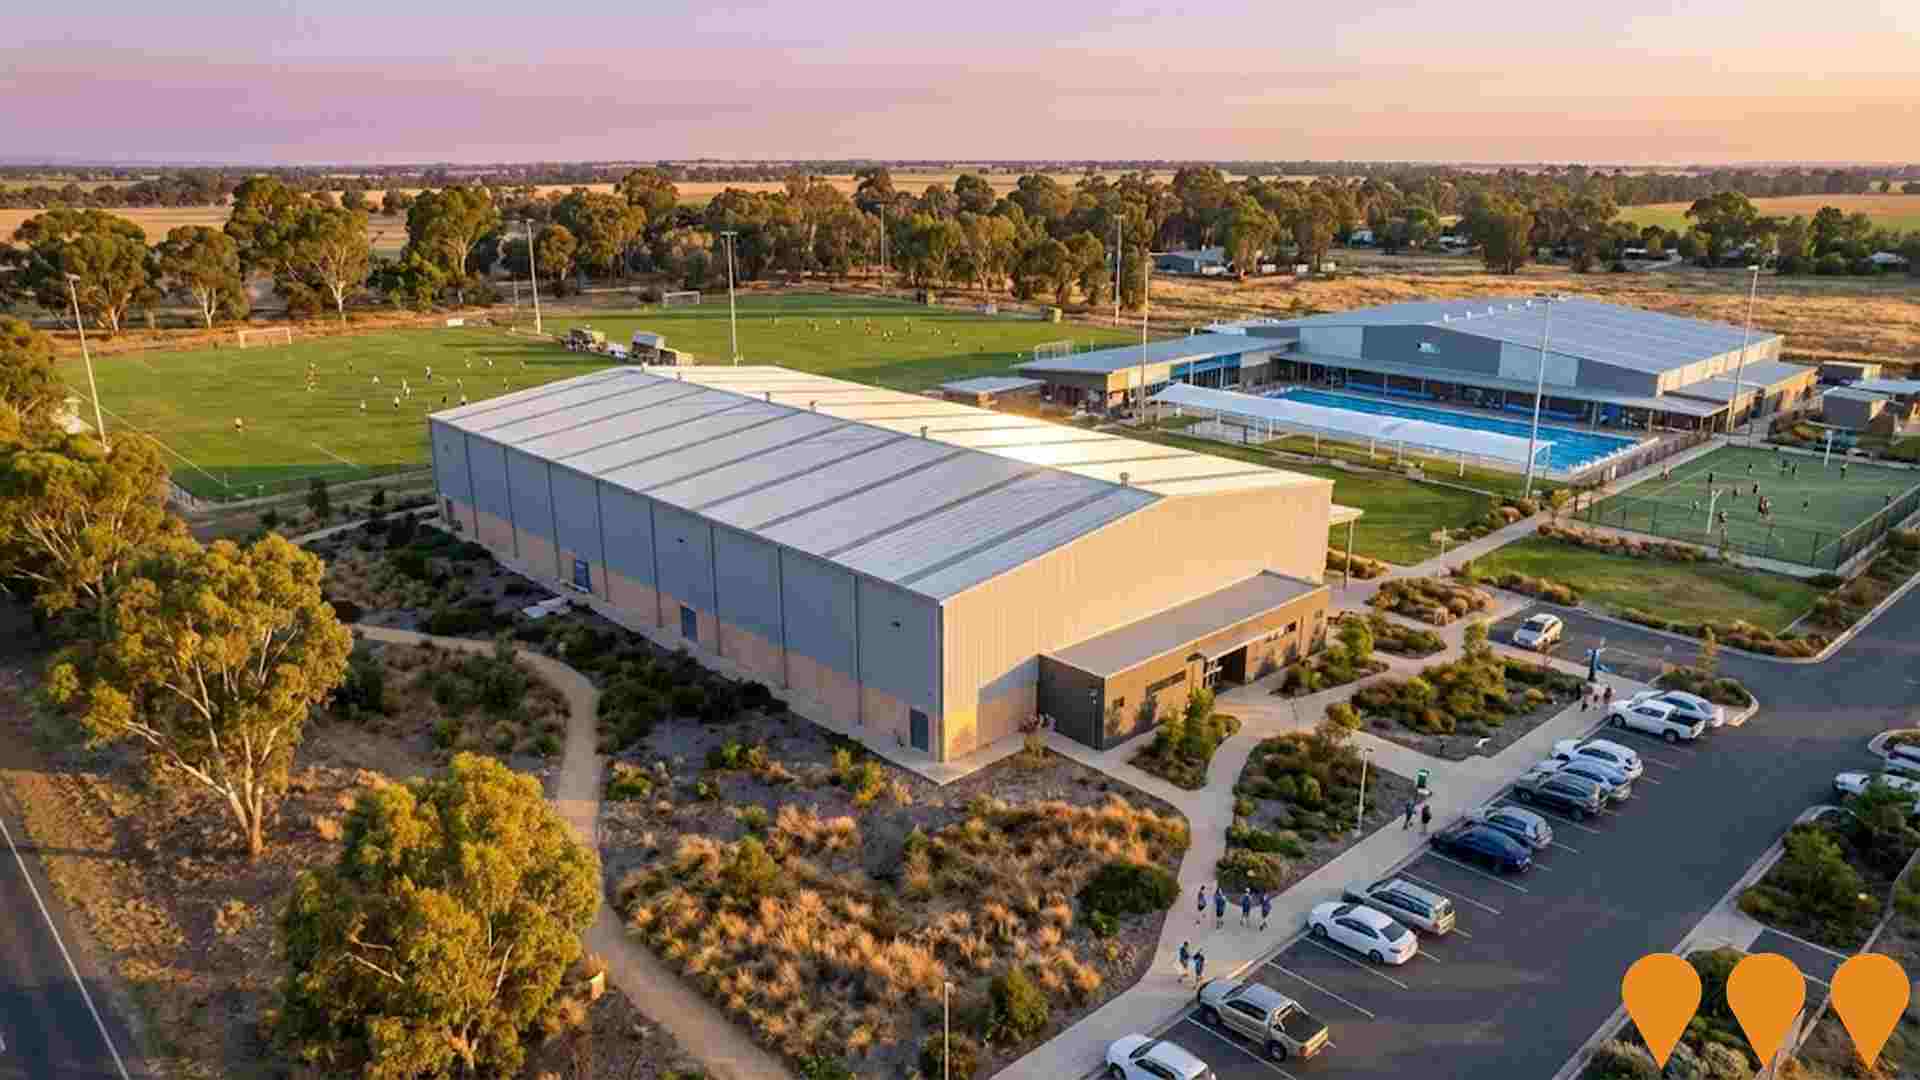
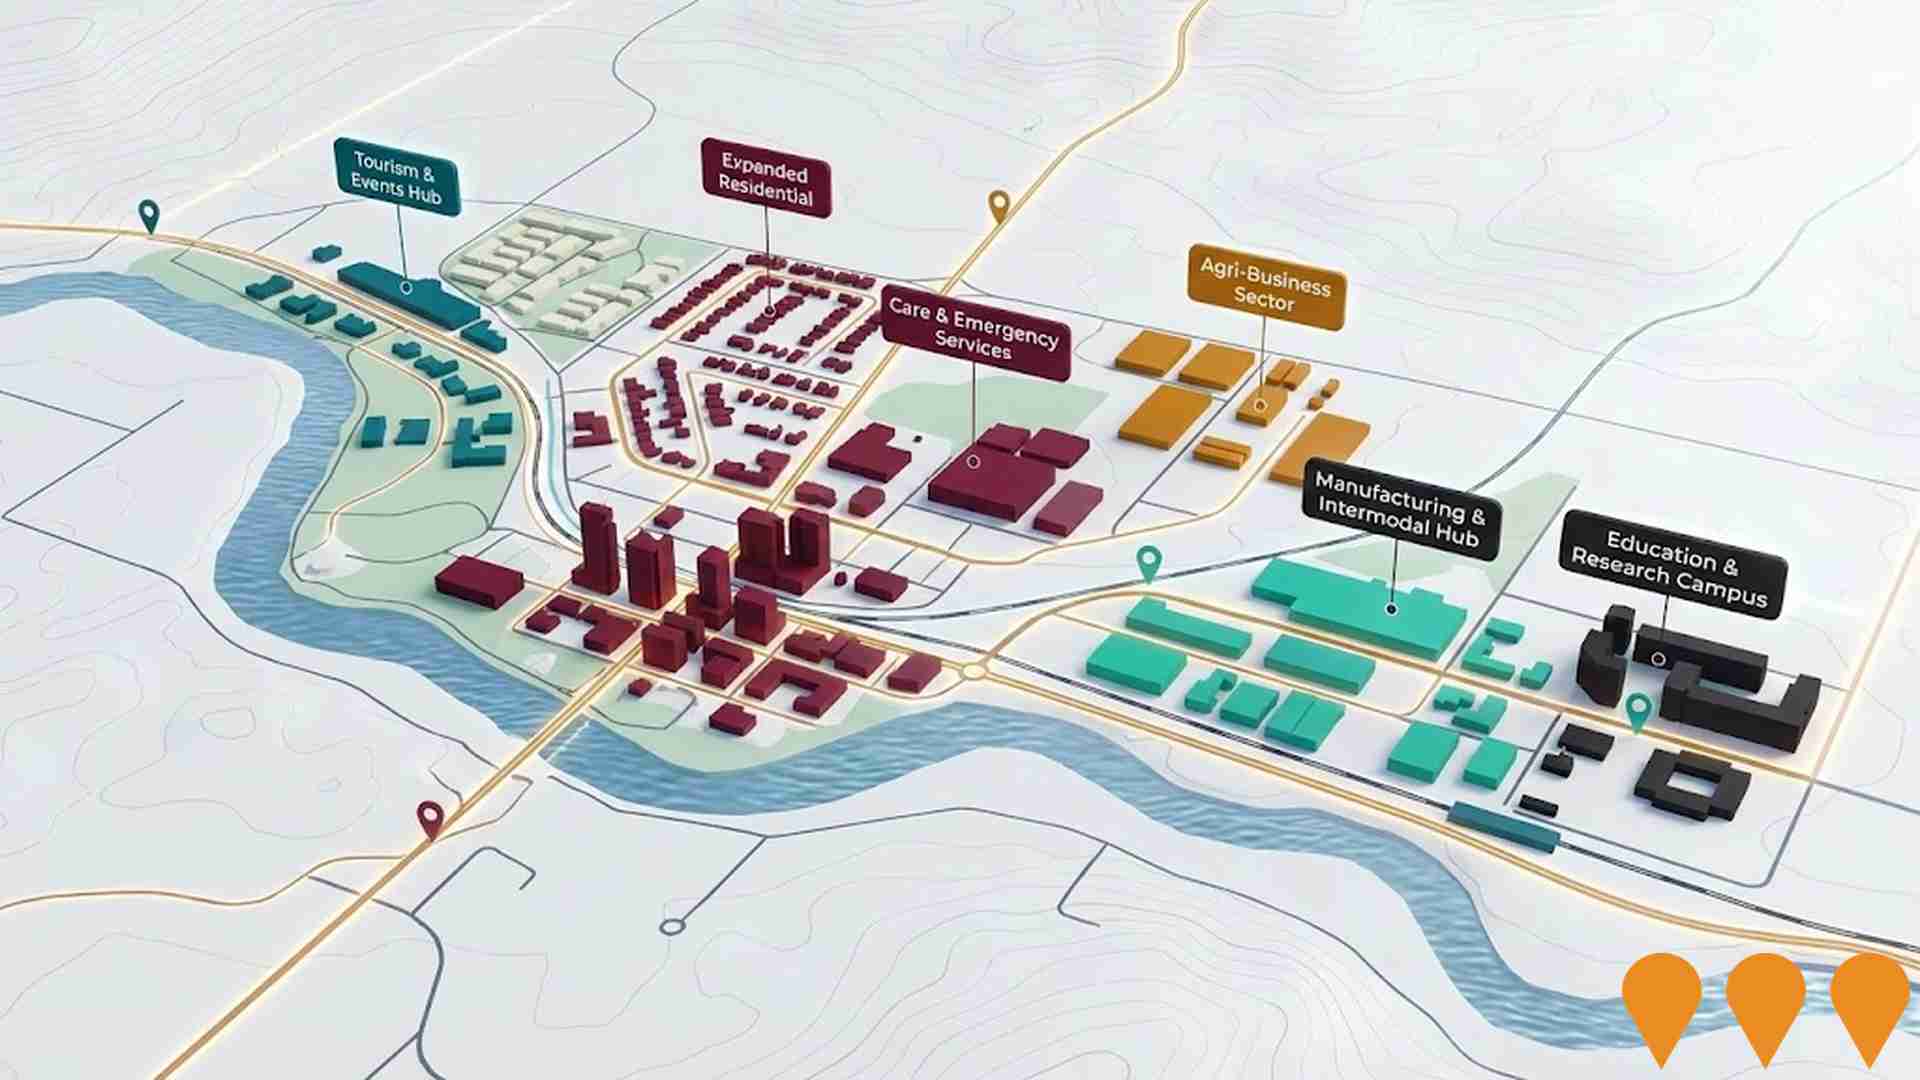
 Denotes AI-based impression for illustrative purposes only, not to be taken as definitive under any circumstances. Please follow links and conduct other investigations from the project's source for actual imagery. Developers and project owners wishing us to use original imagery please Contact Us and we will do so.
Frequently Asked Questions - Infrastructure
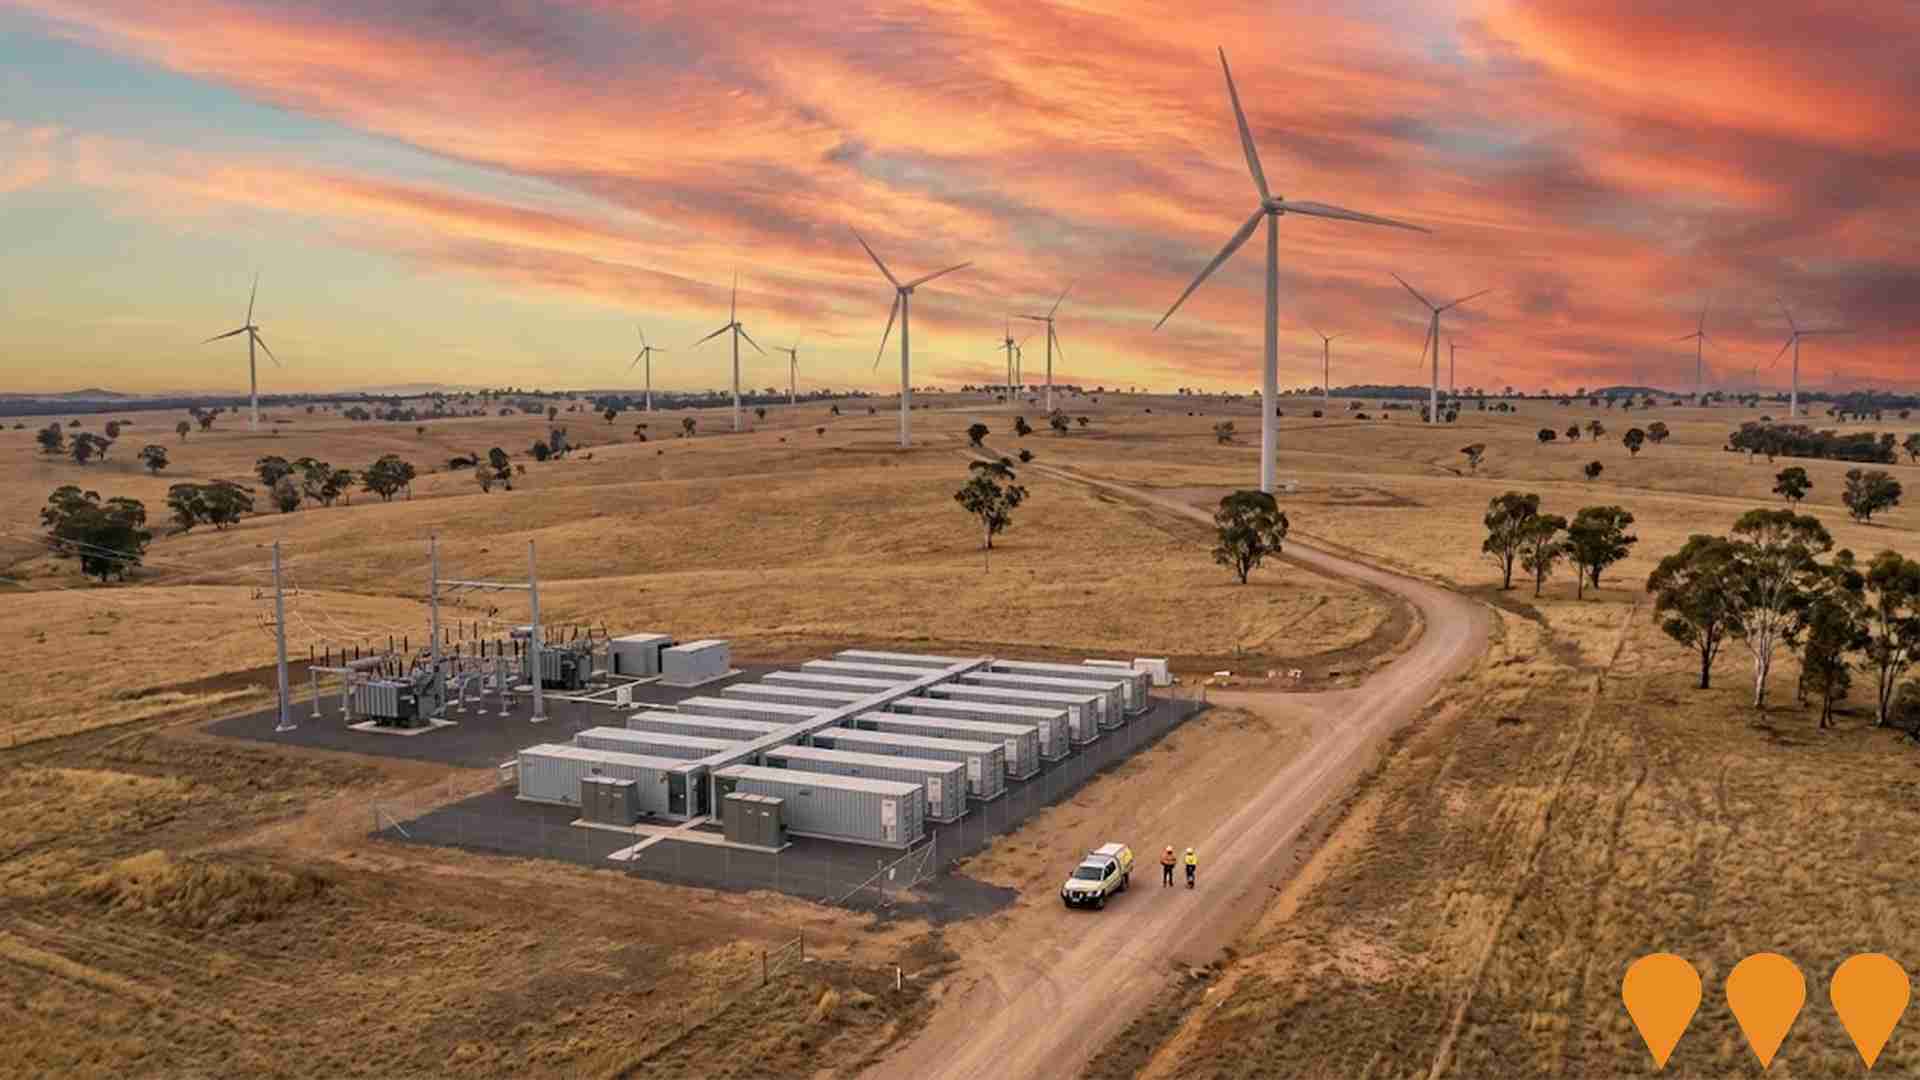
Merino Wind Farm and Battery
Octopus Australia is developing a 1GW onshore wind farm with integrated 400MW/800MWh battery energy storage system on a ~28,000 hectare site north of Deniliquin in the South West Renewable Energy Zone (REZ), NSW. The project is adjacent to Octopus's proposed Saltbush Wind Farm and will have capacity to power approximately 800,000 NSW homes annually once operational.
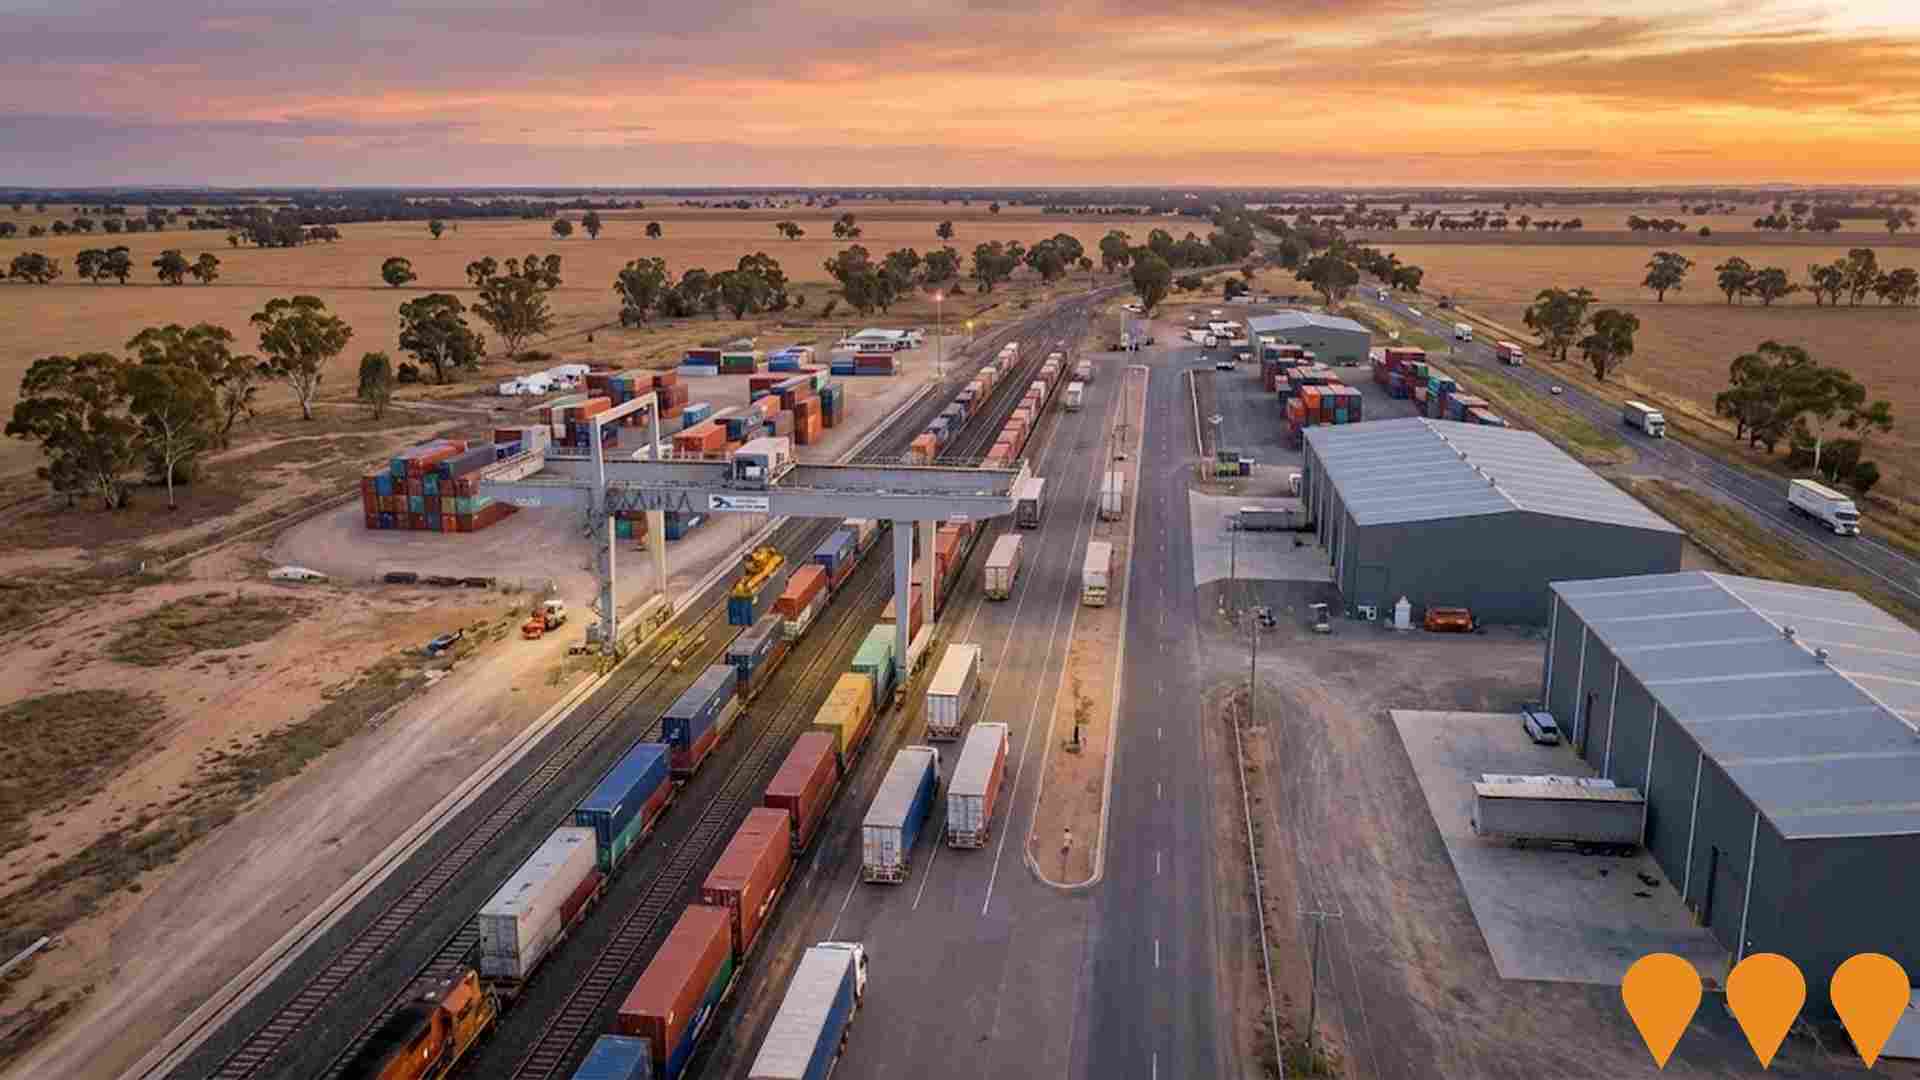
Deniliquin Inland Port
Deniliquin Inland Port is a proposed intermodal freight hub and industrial precinct at Deniliquin in the Edward River Council area. The project would expand on the existing Caruso Brothers Transport and Deni Industrial Park site to create a co located manufacturing and logistics hub that uses the Deniliquin railhead and Cobb Highway connections to move containerised rice and other agricultural products to the Port of Melbourne and wider domestic markets. It is intended to lower freight costs, attract new industry and jobs, and support long term growth of the Murray Darling agricultural region.
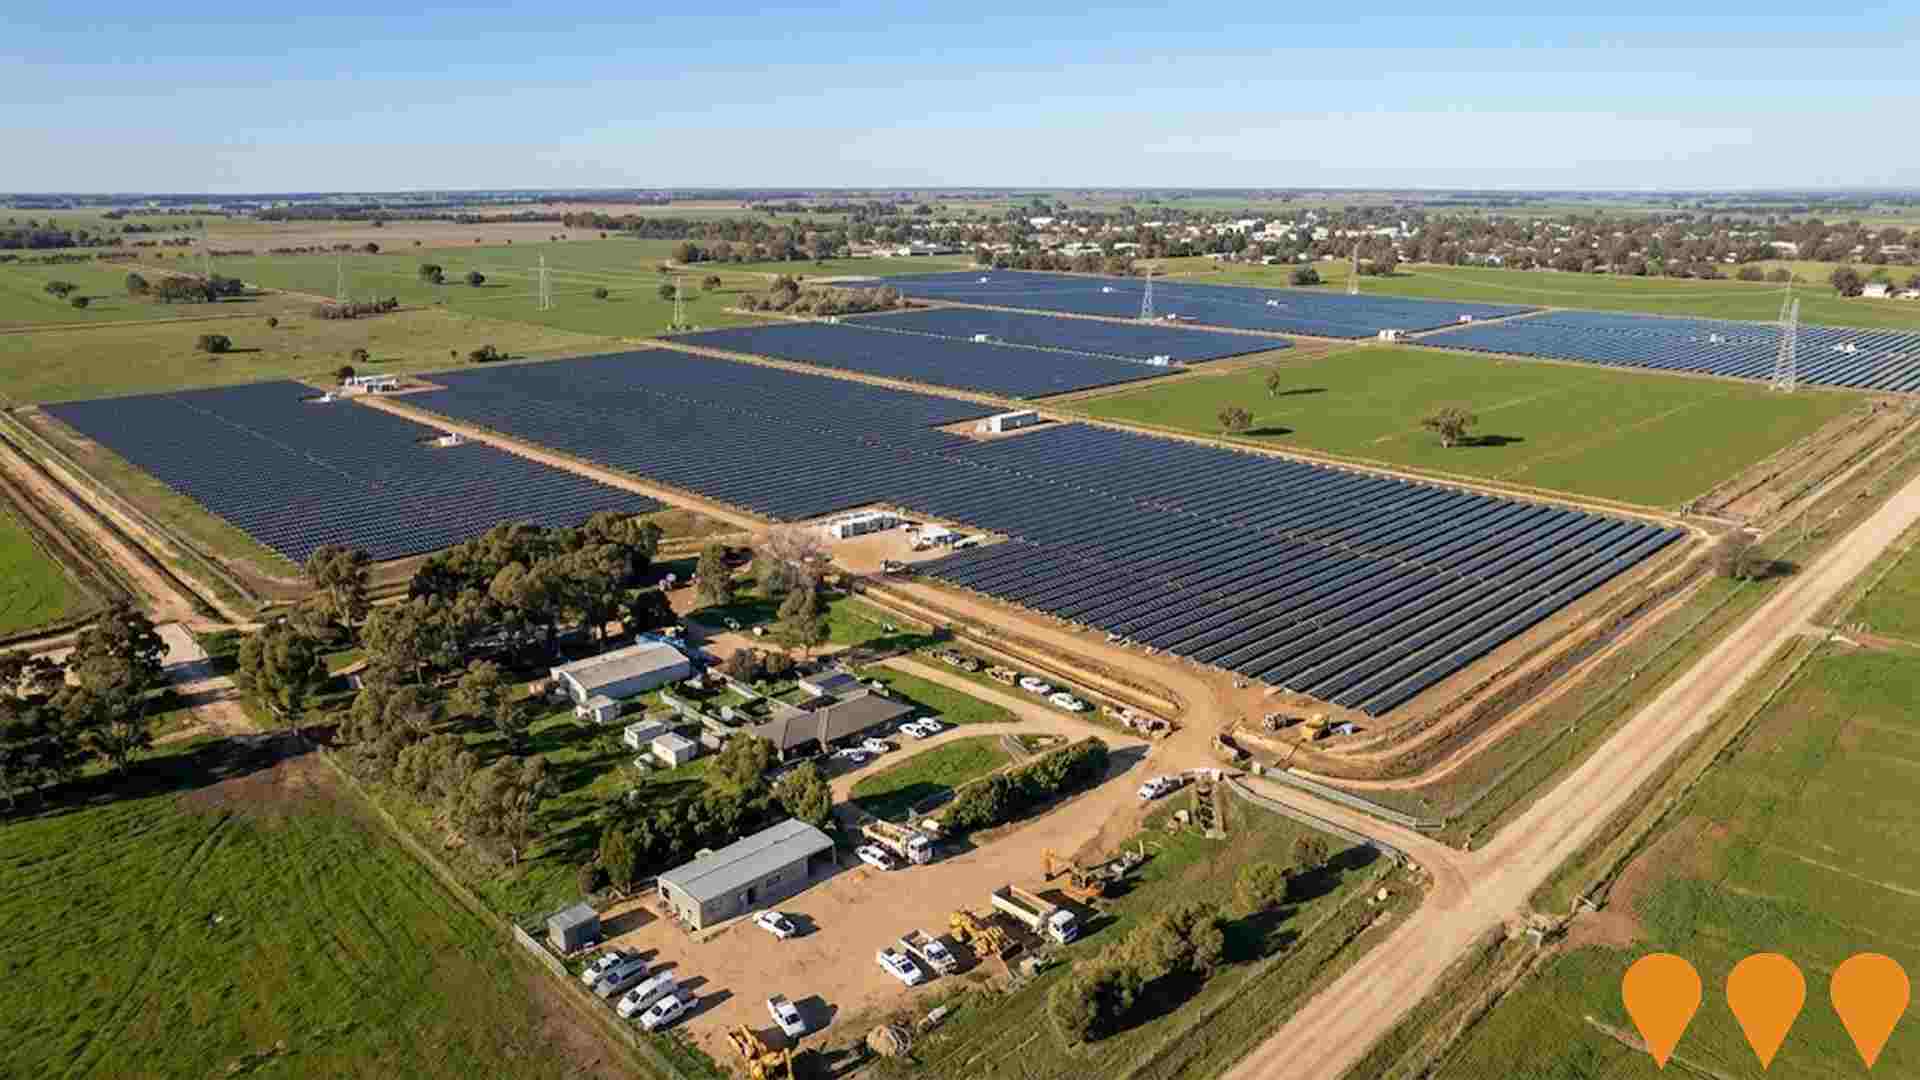
Deniliquin Solar Farm Stage 2
Proposed 600MW solar photovoltaic farm east of Deniliquin, to be developed on farmland adjacent to the existing Deniliquin Solar Farm. The project would connect into existing transmission infrastructure and materially increase renewable generation capacity in the wider South West NSW region.
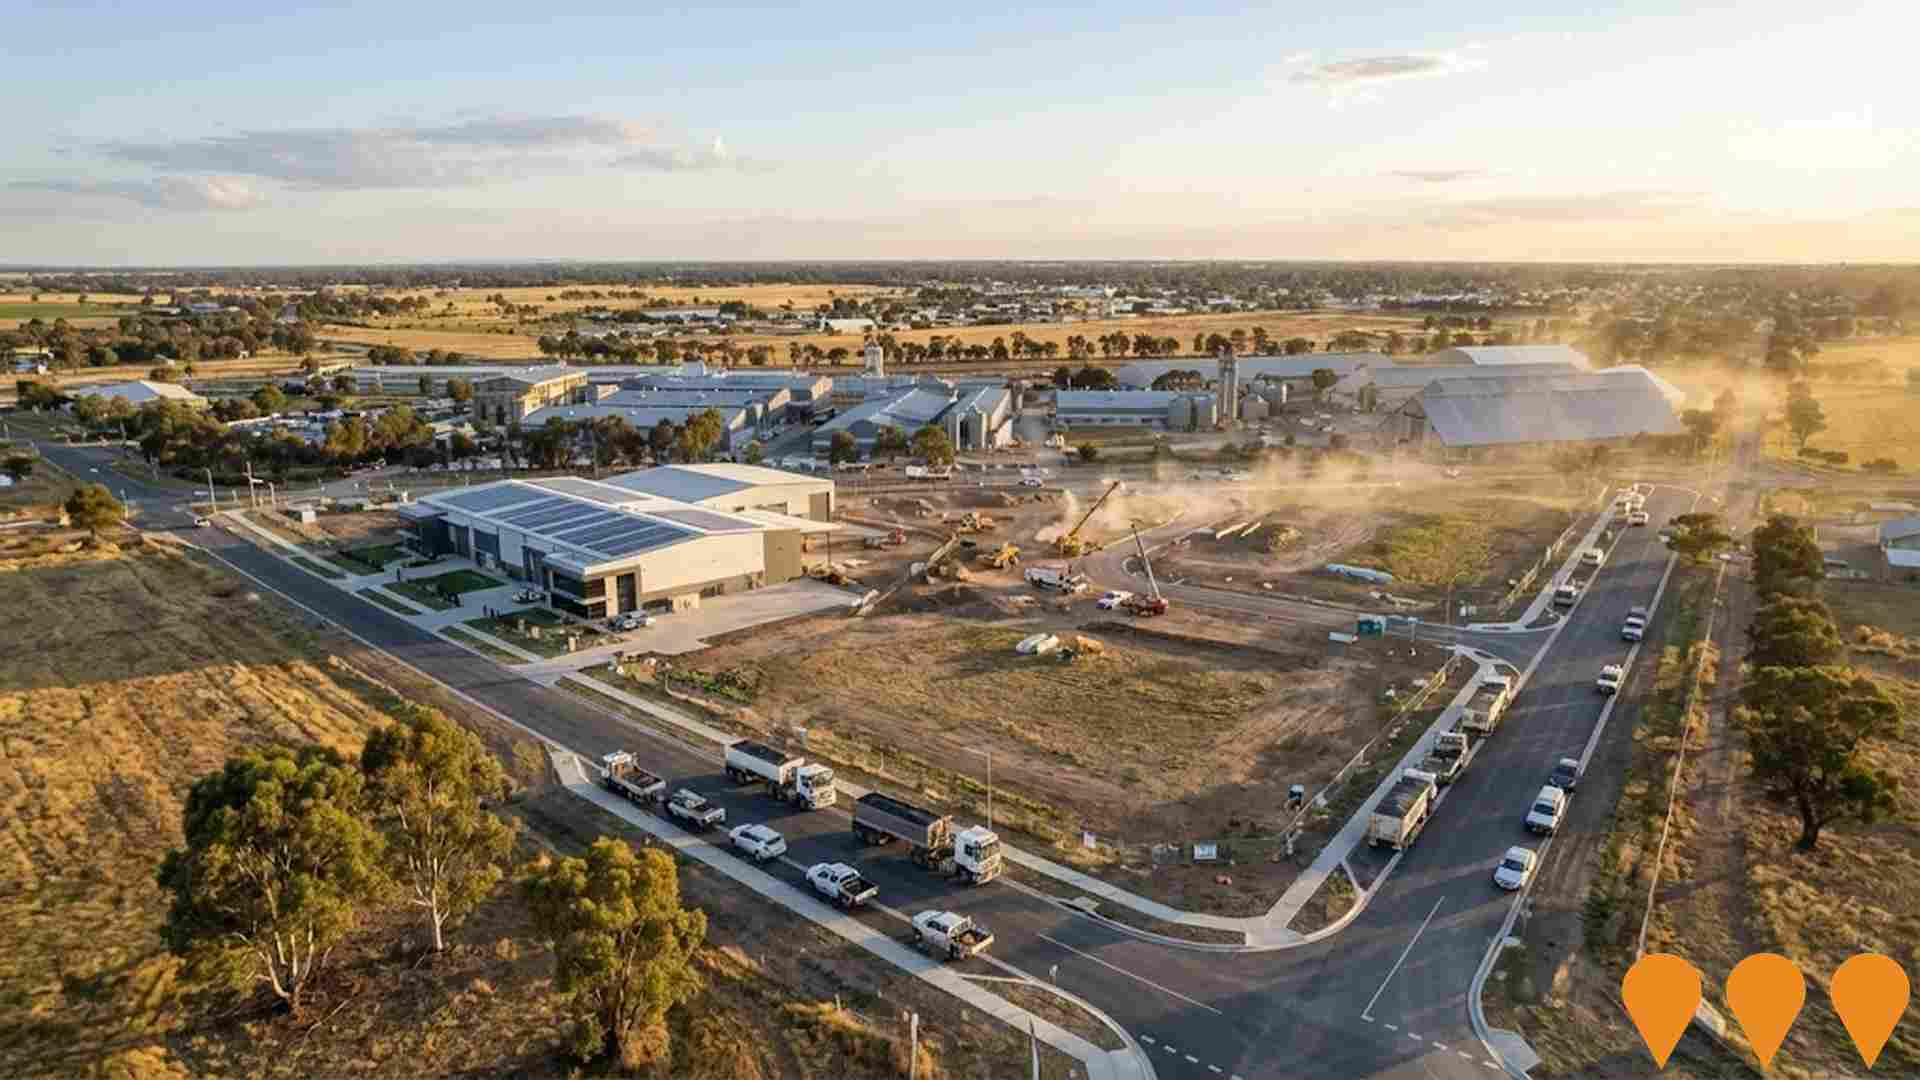
Deniliquin Industrial Estate
New and expanding industrial estate focused on Kelly Street in Deniliquin, providing serviced industrial lots and modern infrastructure to attract food processing, agricultural machinery, logistics, warehousing and related businesses. Edward River Council has delivered key road, kerb and gutter and stormwater works in the precinct and is progressively releasing industrial land in line with the Edward River Industrial Land Strategy and the Edward River 2050 Growth Strategy.
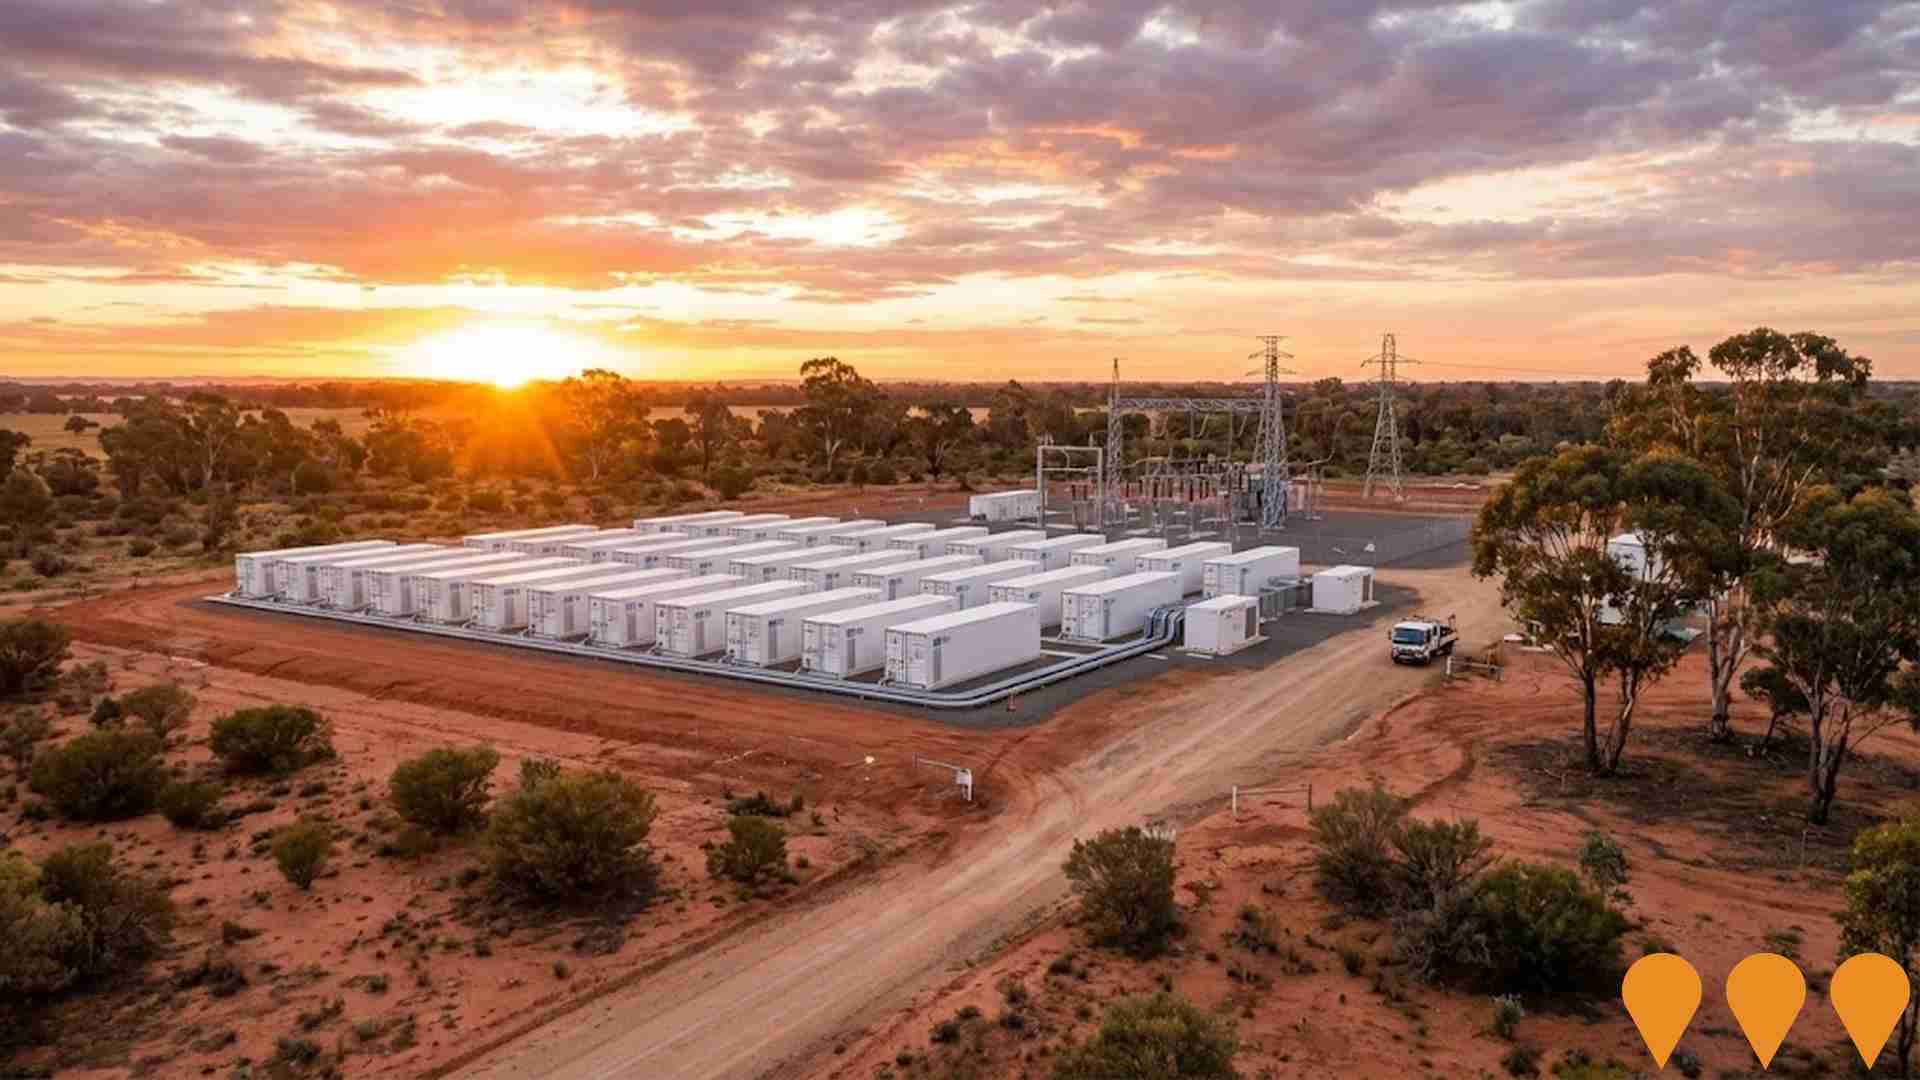
Deniliquin Battery Energy Storage System (BESS)
120MW / 480MWh lithium-ion battery energy storage system to assist the national electrical grid during peak demand and emergencies. Located 6km southeast of Deniliquin on a 7-hectare site, connecting to the 132kV Deniliquin substation.
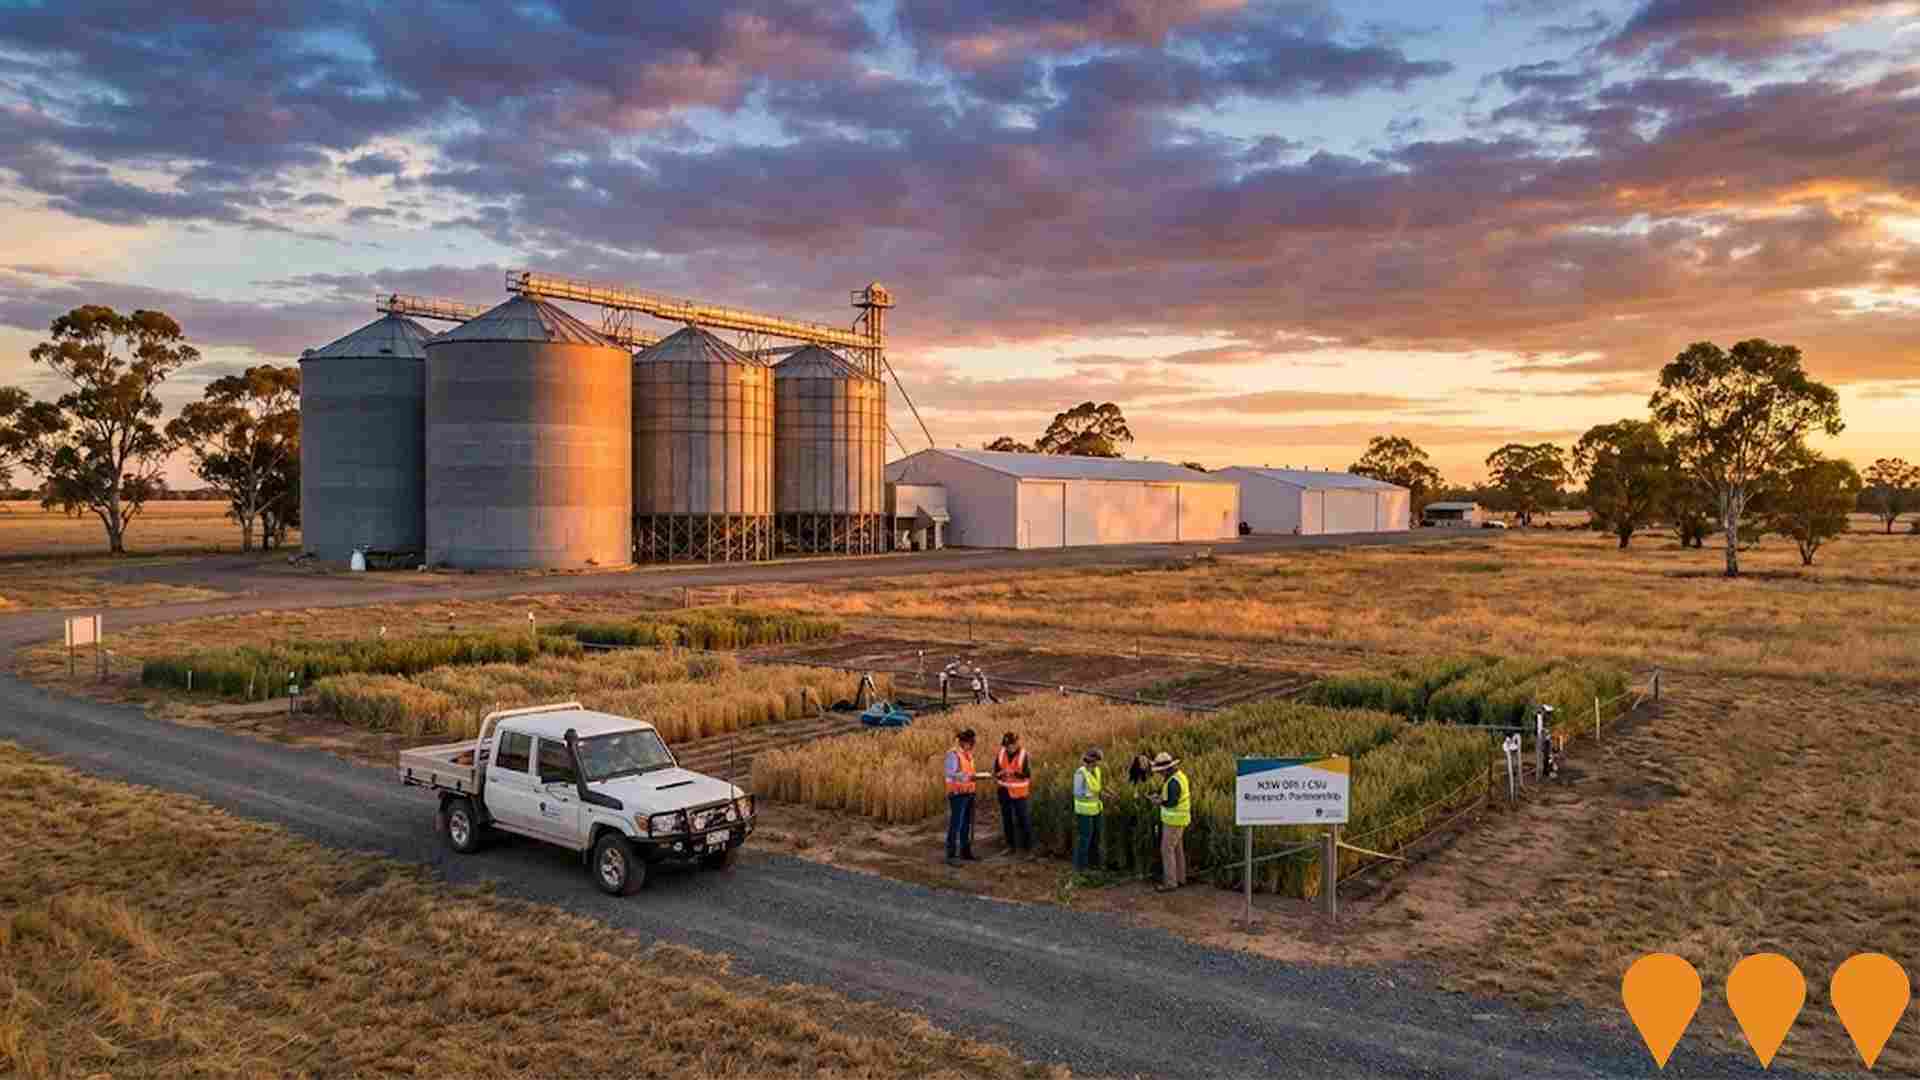
Deniliquin Agricultural Research Facility
State-of-the-art agricultural research center focusing on drought-resistant crops, sustainable farming practices, and climate adaptation strategies. Partnership between NSW DPI and Charles Sturt University.
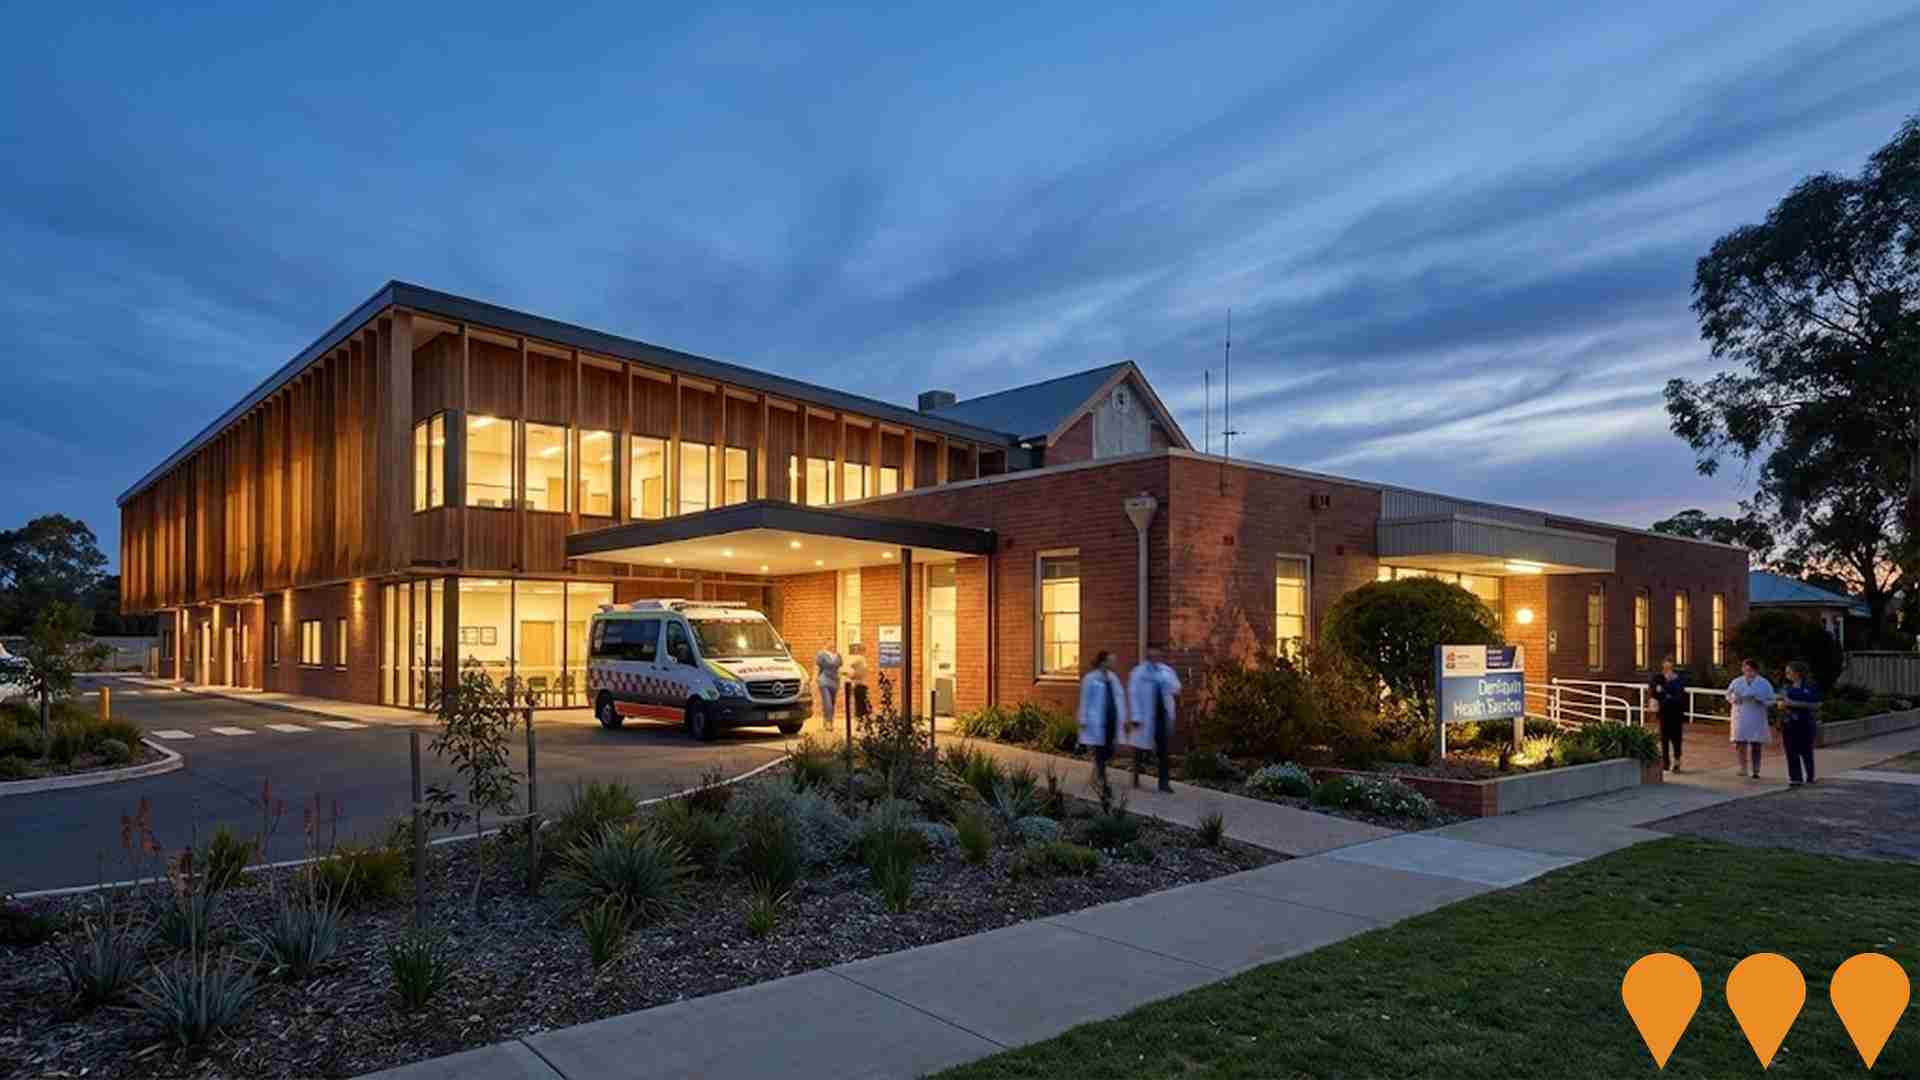
Deniliquin Hospital Redevelopment
Comprehensive redevelopment of Deniliquin Hospital including new emergency department, surgical suites, and patient accommodation. Will serve as the primary healthcare facility for the southern Riverina region.
Deniliquin NBN Upgrade
Fiber-to-the-premises upgrade for Deniliquin and surrounding rural areas. Part of the regional connectivity initiative to provide high-speed internet access to support digital agriculture and remote work capabilities.

Employment
The labour market performance in Deniliquin lags significantly behind most other regions nationally
Deniliquin has a balanced workforce with both white and blue collar jobs, with essential services well represented. The unemployment rate was 5.1% as of September 2025.
Over the past year, employment stability was relatively maintained. As of September 2025, 3,753 residents were employed, with an unemployment rate of 6.3%, which is 2.5 percentage points above Rest of NSW's rate of 3.8%. Workforce participation in Deniliquin was 53.9%, compared to Rest of NSW's 56.4%. Leading employment industries among residents include health care & social assistance, retail trade, and education & training.
Agriculture, forestry & fishing showed strong specialization, employing 1.5 times the regional level. Mining employed only 0.1% of local workers, below Rest of NSW's 2.5%. Over the 12 months to September 2025, employment increased by 0.4%, while labour force increased by 1.1%, causing unemployment to rise by 0.7 percentage points. In contrast, Rest of NSW saw employment contract by 0.5%, with unemployment rising by 0.4 percentage points. State-level data to 25-Nov-25 shows NSW employment contracted by 0.03%, losing 2,260 jobs, with a state unemployment rate of 3.9%. National employment forecasts from May-25 project national growth of 6.6% over five years and 13.7% over ten years. Applying these projections to Deniliquin's employment mix suggests local employment should increase by 6.3% over five years and 13.3% over ten years, though this is a simple weighting extrapolation for illustrative purposes and does not account for localized population projections.
Frequently Asked Questions - Employment
Income
The area's income levels rank in the lower 15% nationally based on AreaSearch comparative data
The median taxpayer income in Deniliquin SA2 was $45,539 and the average was $52,725 according to postcode level ATO data aggregated by AreaSearch for financial year 2022. This is below the national averages of $49,459 (median) and $62,998 (average). As of September 2025, estimated incomes would be approximately $51,281 (median) and $59,374 (average), based on Wage Price Index growth of 12.61% since financial year 2022. Census data shows household, family and personal incomes in Deniliquin fall between the 13th and 25th percentiles nationally. Income distribution indicates that 27.3%, or 1,981 individuals, earn within the $1,500 - 2,999 range, similar to regional levels at 29.9%. Despite modest housing costs allowing for 88.4% income retention, total disposable income ranks at only the 18th percentile nationally.
Frequently Asked Questions - Income
Housing
Deniliquin is characterized by a predominantly suburban housing profile, with a higher proportion of rental properties than the broader region
In Deniliquin, as per the latest Census, 89.1% of dwellings were houses, with the remaining 11.0% being semi-detached homes, apartments, or other types. This is similar to Non-Metro NSW's figures of 89.8% houses and 10.2% other dwellings. Home ownership in Deniliquin stood at 42.0%, with mortgaged properties at 30.4% and rented ones at 27.6%. The median monthly mortgage repayment was $1,083, lower than Non-Metro NSW's average of $1,285. Weekly rent in Deniliquin was $230, compared to $235 in Non-Metro NSW. Nationally, Deniliquin's mortgage repayments were significantly lower at $1,083 versus Australia's average of $1,863, and rents were substantially below the national figure of $375.
Frequently Asked Questions - Housing
Household Composition
Deniliquin features high concentrations of lone person households, with a lower-than-average median household size
Family households account for 62.4% of all households, including 20.8% couples with children, 31.0% couples without children, and 9.6% single parent families. Non-family households constitute the remaining 37.6%, with lone person households at 35.0% and group households comprising 2.5%. The median household size is 2.2 people, which is smaller than the Rest of NSW average of 2.3.
Frequently Asked Questions - Households
Local Schools & Education
Deniliquin faces educational challenges, with performance metrics placing it in the bottom quartile of areas assessed nationally
The area's university qualification rate is 15.1%, significantly lower than the NSW average of 32.2%. Bachelor degrees are the most common at 10.8%, followed by postgraduate qualifications (2.2%) and graduate diplomas (2.1%). Vocational credentials are prominent, with 39.6% of residents aged 15+ holding them, including advanced diplomas (9.6%) and certificates (30.0%). Educational participation is high at 27.9%, with 10.5% in primary education, 8.4% in secondary education, and 2.3% pursuing tertiary education.
Educational participation is notably high, with 27.9% of residents currently enrolled in formal education. This includes 10.5% in primary education, 8.4% in secondary education, and 2.3% pursuing tertiary education.
Frequently Asked Questions - Education
Schools Detail
Nearby Services & Amenities
Transport
Transport servicing is low compared to other areas nationally based on assessment of service frequency, route connectivity and accessibility
The public transport analysis indicates 63 active transport stops operating within Deniliquin. These stops serve a mix of bus routes, totaling 38 individual routes that facilitate 347 weekly passenger trips collectively. The accessibility of transport is rated as good, with residents located an average of 297 meters from the nearest transport stop.
Across all routes, service frequency averages 49 trips per day, translating to approximately 5 weekly trips per individual stop.
Frequently Asked Questions - Transport
Transport Stops Detail
Health
Health performance in Deniliquin is well below average with prevalence of common health conditions notable across both younger and older age cohorts
Health data indicates significant challenges for Deniliquin, with high prevalence of common health conditions across both younger and older age groups. Only approximately 47% (~3,389 people) have private health cover, compared to the national average of 55.3%.
The most prevalent medical conditions are arthritis (11.5%) and mental health issues (9.3%). About 59.5% of residents report no medical ailments, slightly lower than Rest of NSW's 60.6%. Deniliquin has a lower proportion of residents aged 65 and over at 27.6% (2,004 people), compared to Rest of NSW's 30.5%.
Frequently Asked Questions - Health
Cultural Diversity
The latest Census data sees Deniliquin placing among the least culturally diverse areas in the country when compared across a range of language and cultural background related metrics
Deniliquin had a lower cultural diversity compared to average, with 88.0% citizens, 93.3% born in Australia, and 96.5% speaking English only at home. Christianity was the predominant religion, accounting for 56.7%, slightly below the Rest of NSW's 58.1%. The top three ancestral groups were Australian (35.2%), English (31.5%), and Irish (8.8%).
Notably, Australian Aboriginal representation was higher in Deniliquin at 4.1% compared to the regional average of 2.5%, Scottish was at 8.5% (vs 9.2%), and Maori was at 0.5% (vs 0.2%).
Frequently Asked Questions - Diversity
Age
Deniliquin hosts an older demographic, ranking in the top quartile nationwide
Deniliquin's median age at 47 years is significantly higher than the Rest of NSW average of 43 and exceeds the national average of 38 by a substantial margin. The age profile reveals that those aged 65-74 are particularly prominent, making up 14.8% of the population, while the 35-44 group comprises only 9.4%, both figures being higher than the Rest of NSW averages. This concentration of 65-74 year-olds is well above the national average of 9.4%. Between 2021 and present, the 15 to 24 age group has increased from 10.7% to 11.9%, while the 25 to 34 cohort has risen from 10.2% to 11.4%. Conversely, the 45 to 54 cohort has decreased from 11.8% to 9.8%, and the 5 to 14 group has dropped from 11.6% to 10.3%. By 2041, Deniliquin's age composition is expected to shift notably. The 75 to 84 group is projected to grow by 30%, reaching 837 people from the current 643. This growth will be led by those aged 65 and above, who are expected to comprise 73% of the total population increase. Conversely, population declines are projected for the 35 to 44 and 0 to 4 age cohorts.
