Chart Color Schemes
This analysis uses ABS Statistical Areas Level 2 (SA2) boundaries, which can materially differ from Suburbs and Localities (SAL) even when sharing similar names.
SA2 boundaries are defined by the Australian Bureau of Statistics and are designed to represent communities for statistical reporting (e.g., census and ERP).
Suburbs and Localities (SAL) represent commonly-used suburb/locality names (postal-style areas) and may use different geographic boundaries. For comprehensive analysis, consider reviewing both boundary types if available.
est. as @ -- *
ABS ERP | -- people | --
2021 Census | -- people
Sales Activity
Curious about local property values? Filter the chart to assess the volume and appreciation (including resales) trends and regional comparisons, or scroll to the map below view this information at an individual property level.
Find a Recent Sale
Sales Detail
Population
Kerang has shown very soft population growth performance across periods assessed by AreaSearch
Kerang's population, as of November 2025, is approximately 3,841, showing a decrease of 119 people since the 2021 Census which recorded 3,960 residents. This decline, representing a 3.0% drop, was inferred from ABS estimates showing an estimated resident population of 3,833 in June 2024 and the validation of five new addresses post-Census. The population density is around 26 persons per square kilometer. Kerang's population decrease since the Census (-3.0%) aligns closely with that of its SA3 area (-0.3%), indicating similar regional trends. Population growth was driven by balanced natural increase and migration factors. AreaSearch uses ABS/Geoscience Australia projections for each SA2 area, released in 2024 with a base year of 2022.
For areas not covered, it employs VIC State Government's Regional/LGA projections from 2023, adjusted using weighted aggregation methods to SA2 levels. Growth rates by age group are applied across all areas for years 2032 to 2041. By 2041, the population is projected to decline by 1,071 persons according to these methodologies.
Frequently Asked Questions - Population
Development
The level of residential development activity in Kerang is very low in comparison to the average area assessed nationally by AreaSearch
Kerang has recorded approximately 12 residential properties granted approval per year over the past five financial years, totalling 62 homes. As of FY-26, 3 approvals have been recorded so far. The population has fallen during this period, suggesting that new supply has likely kept pace with demand, providing good choice for buyers. The average construction cost value of new homes is $256,000, which aligns with regional trends.
In FY-26, $4.4 million in commercial development approvals have been recorded, indicating limited focus on commercial development. Compared to the Rest of Vic., Kerang shows comparable construction activity per person, maintaining market equilibrium consistent with surrounding areas. However, this level is lower than the national average, reflecting market maturity and possible development constraints. New development consists of 86.0% detached dwellings and 14.0% townhouses or apartments, preserving Kerang's low-density nature with a focus on detached housing attracting space-seeking buyers.
The estimated population per dwelling approval is 549 people, reflecting the area's quiet, low-activity development environment. With population projections showing stability or decline, Kerang should see reduced housing demand pressures in the future, benefiting potential buyers.
Frequently Asked Questions - Development
Infrastructure
Kerang has moderate levels of nearby infrastructure activity, ranking in the 44thth percentile nationally
Changes to local infrastructure significantly impact an area's performance. AreaSearch has identified seven projects potentially affecting this region. Notable ones are Victoria to NSW Interconnector West (VNI West), Kerang Solar & BESS Hybrid, Kerang District Health Facility Upgrade (CSSD, PACU, and Operating Theatre Equipment), and Koorangie Energy Storage System (KESS). The following list details those most relevant.
Professional plan users can use the search below to filter and access additional projects.
INFRASTRUCTURE SEARCH
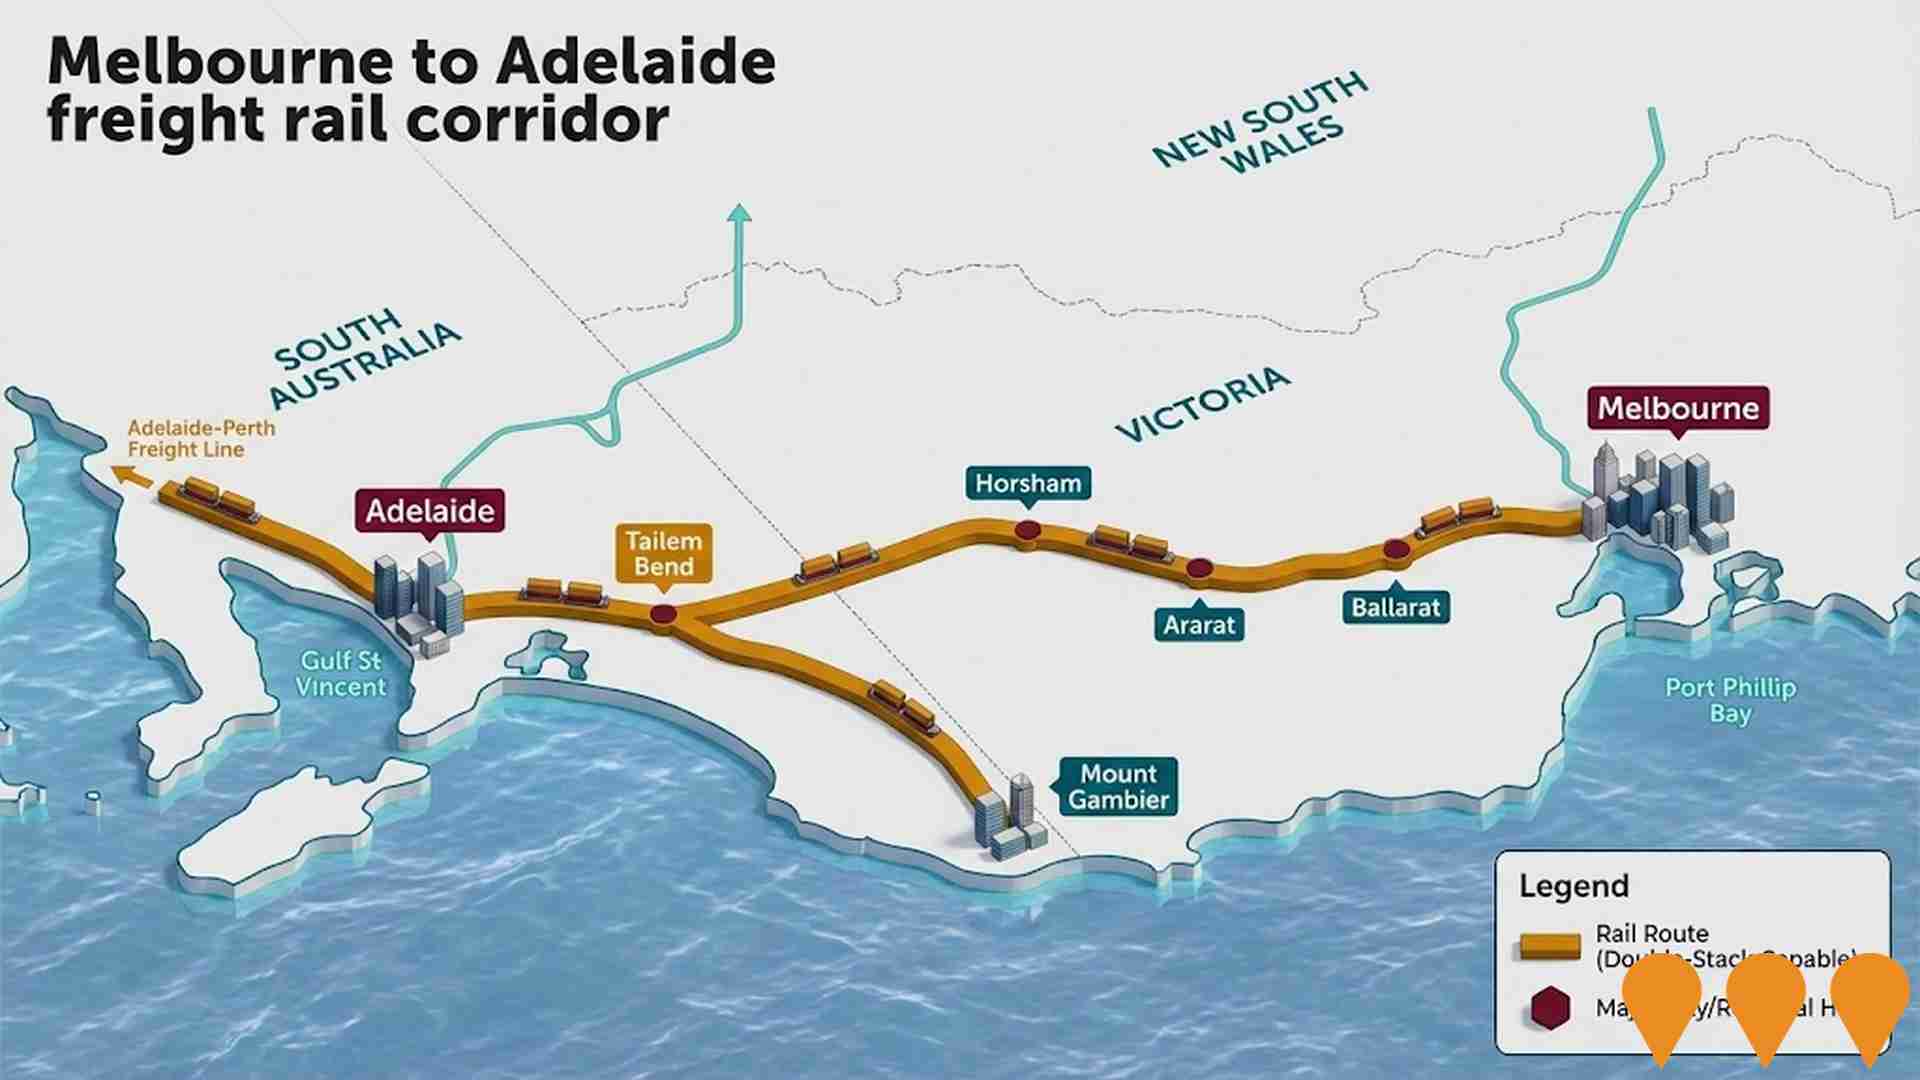
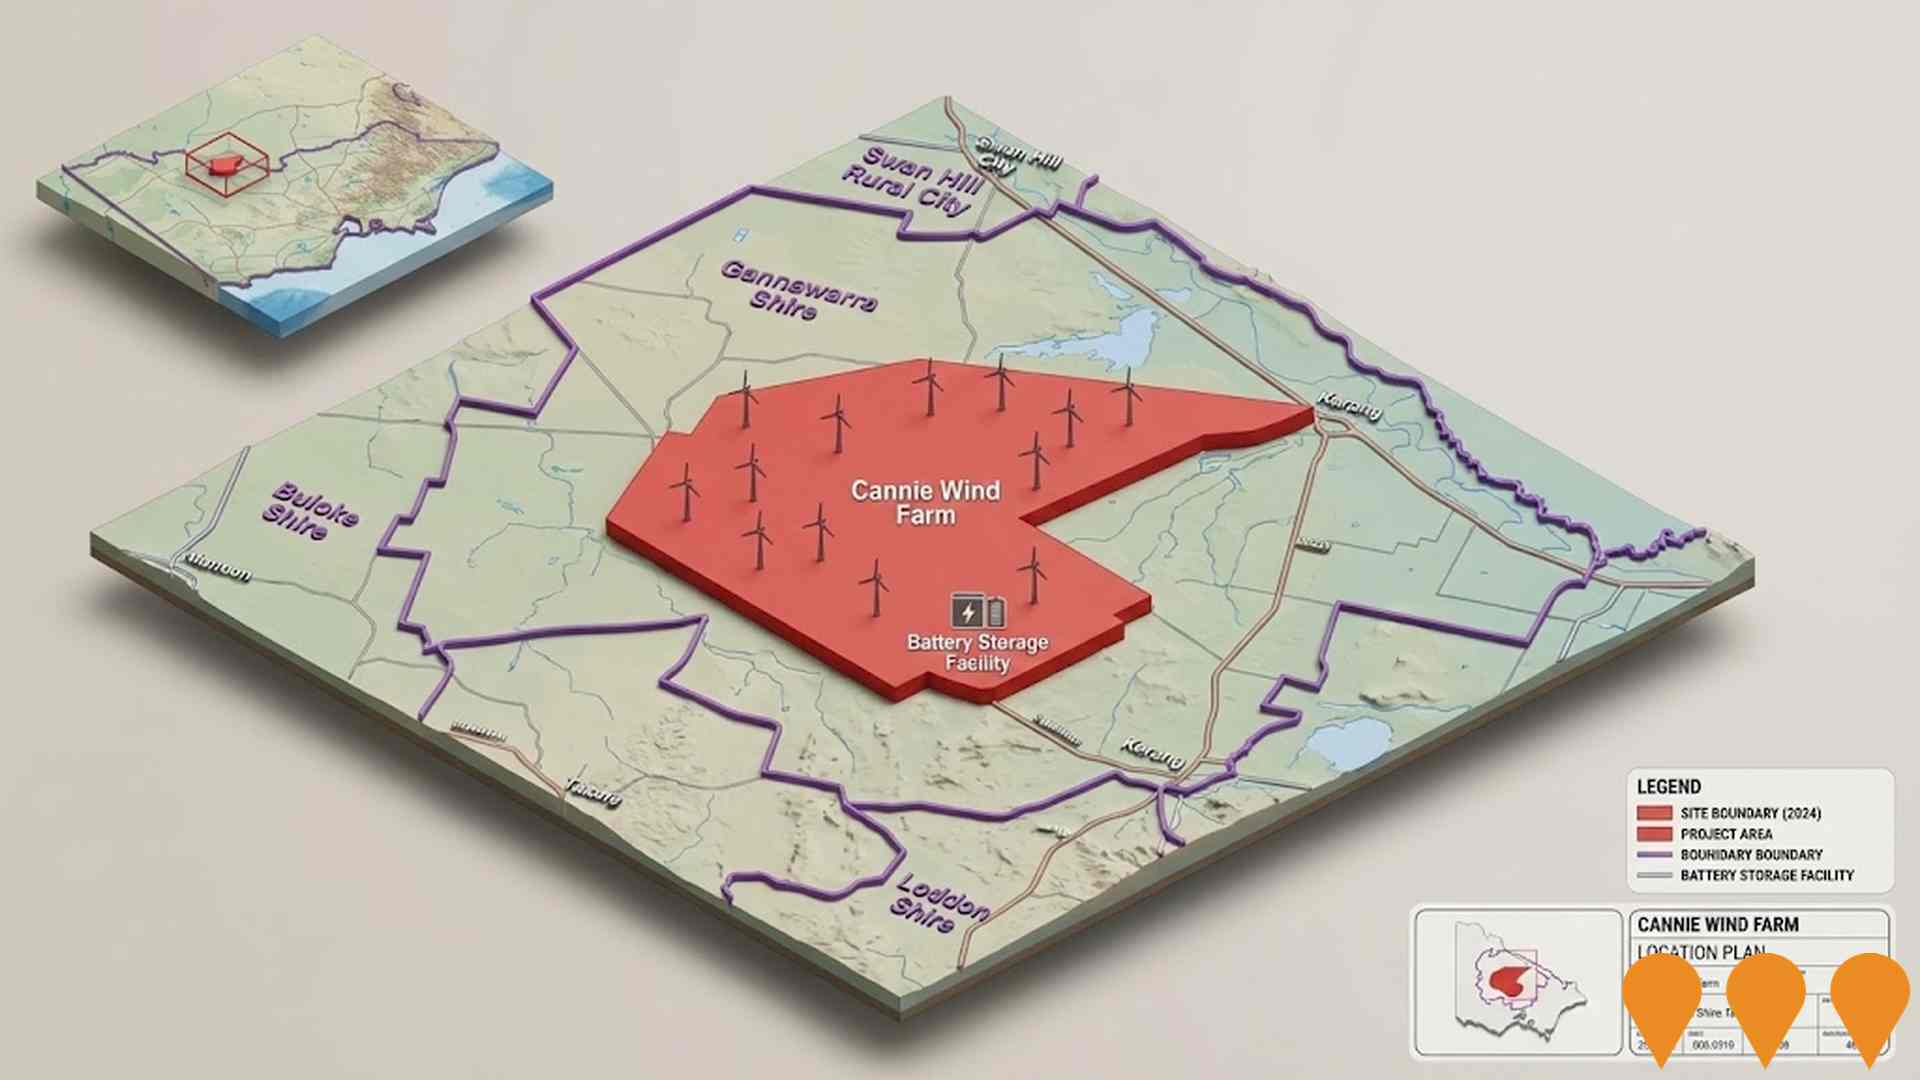
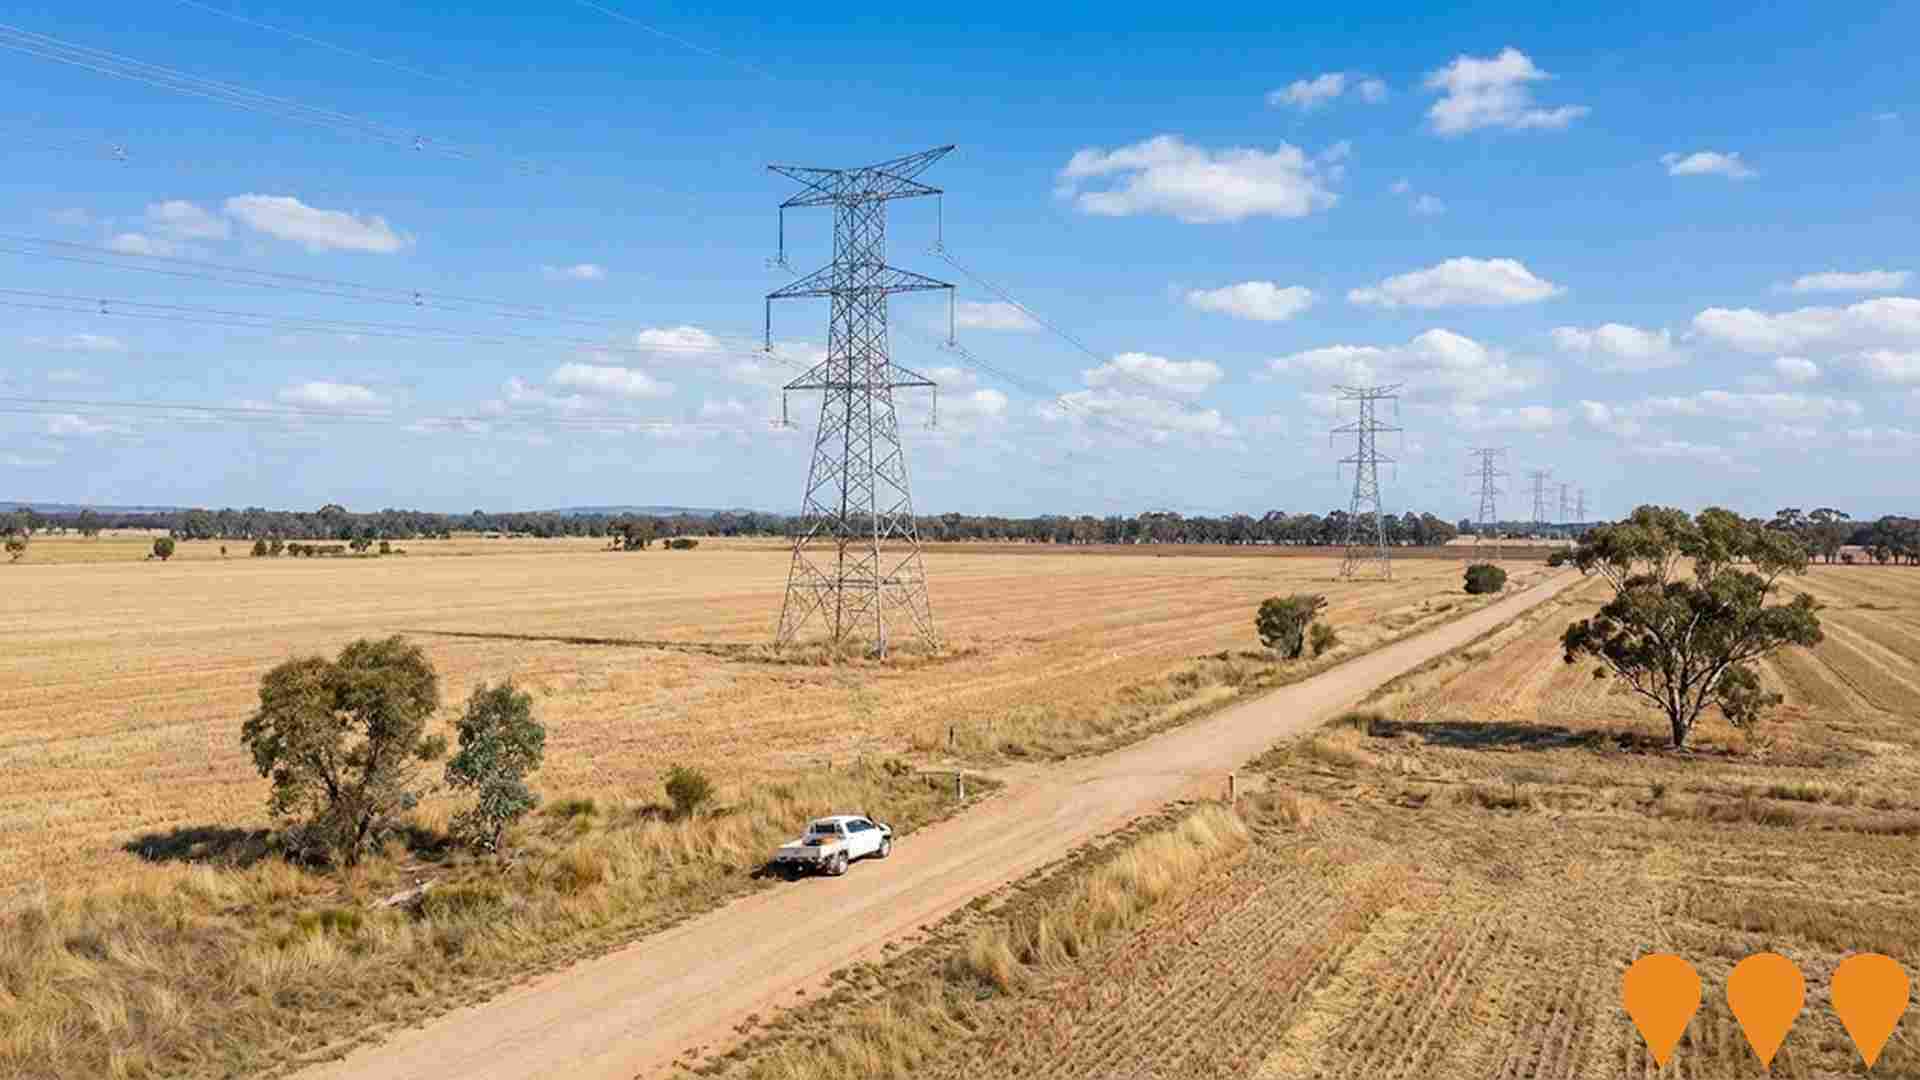
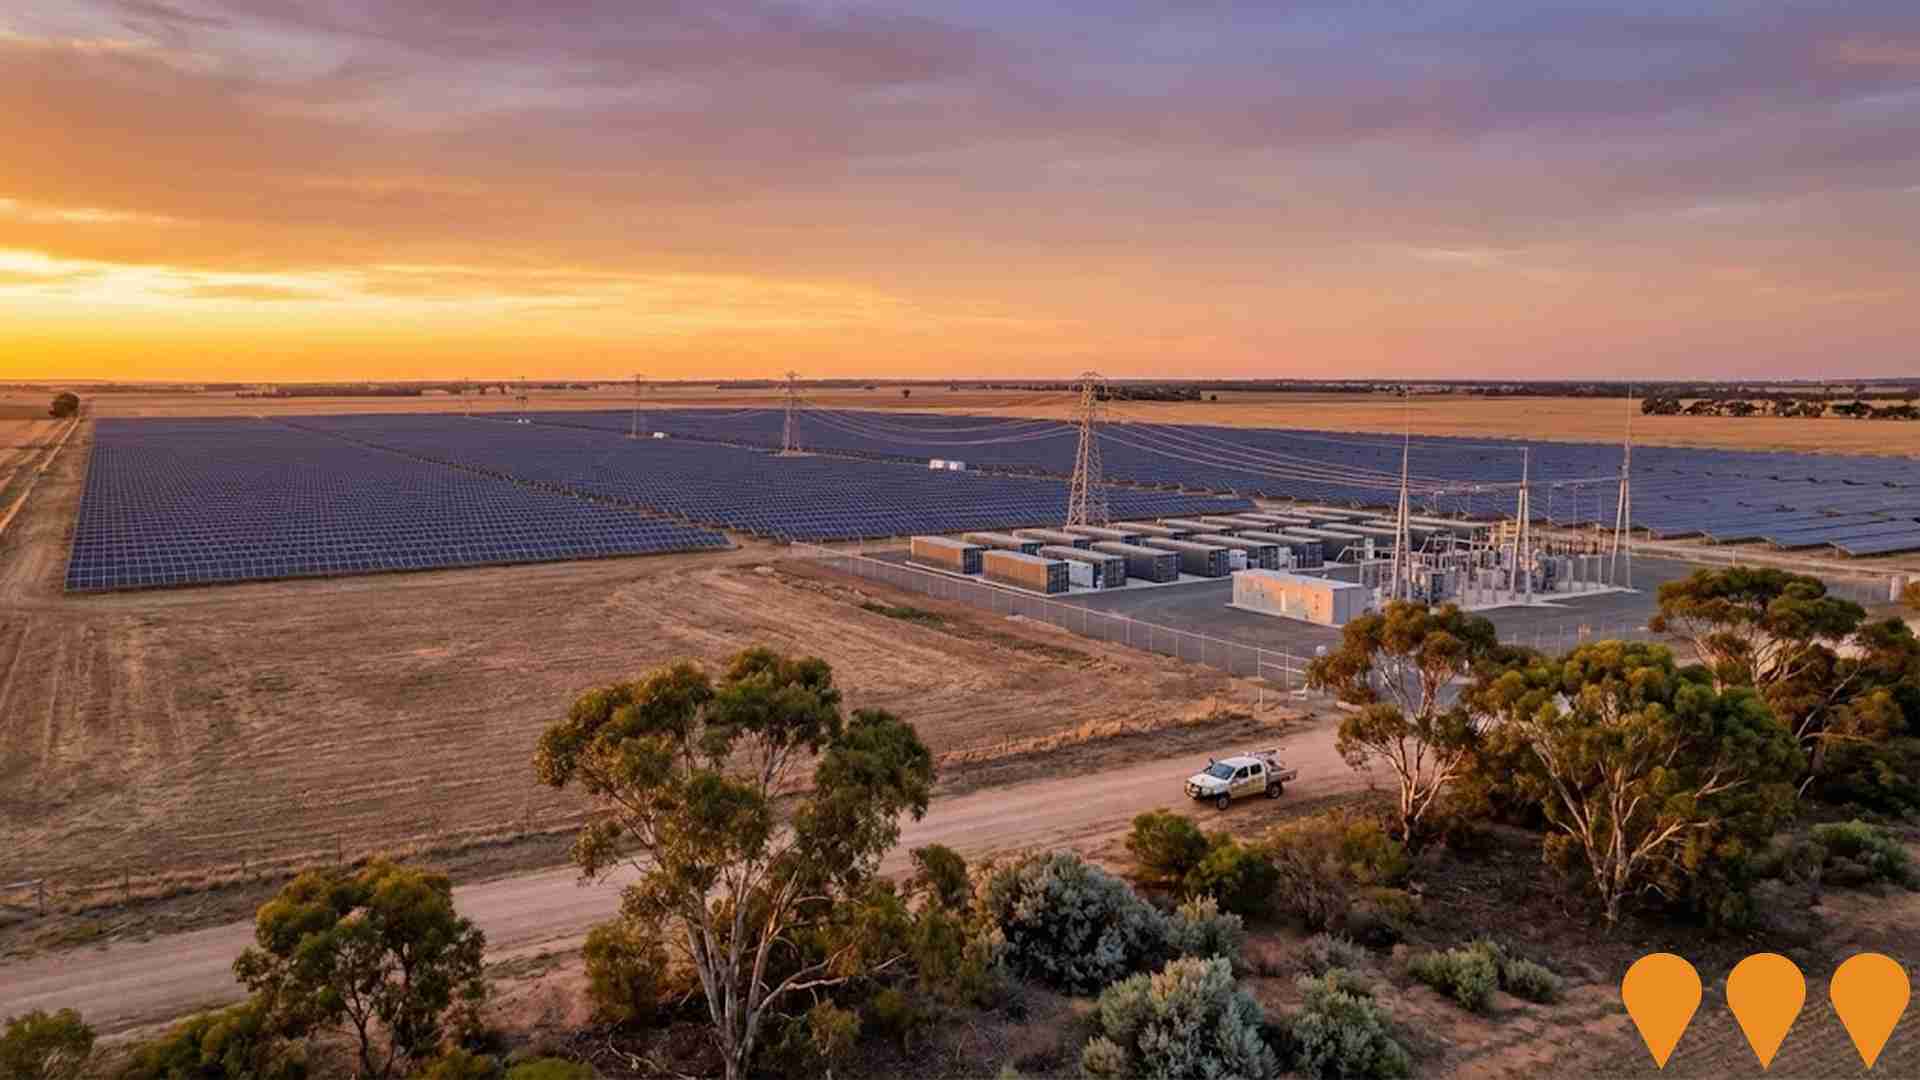
 Denotes AI-based impression for illustrative purposes only, not to be taken as definitive under any circumstances. Please follow links and conduct other investigations from the project's source for actual imagery. Developers and project owners wishing us to use original imagery please Contact Us and we will do so.
Frequently Asked Questions - Infrastructure
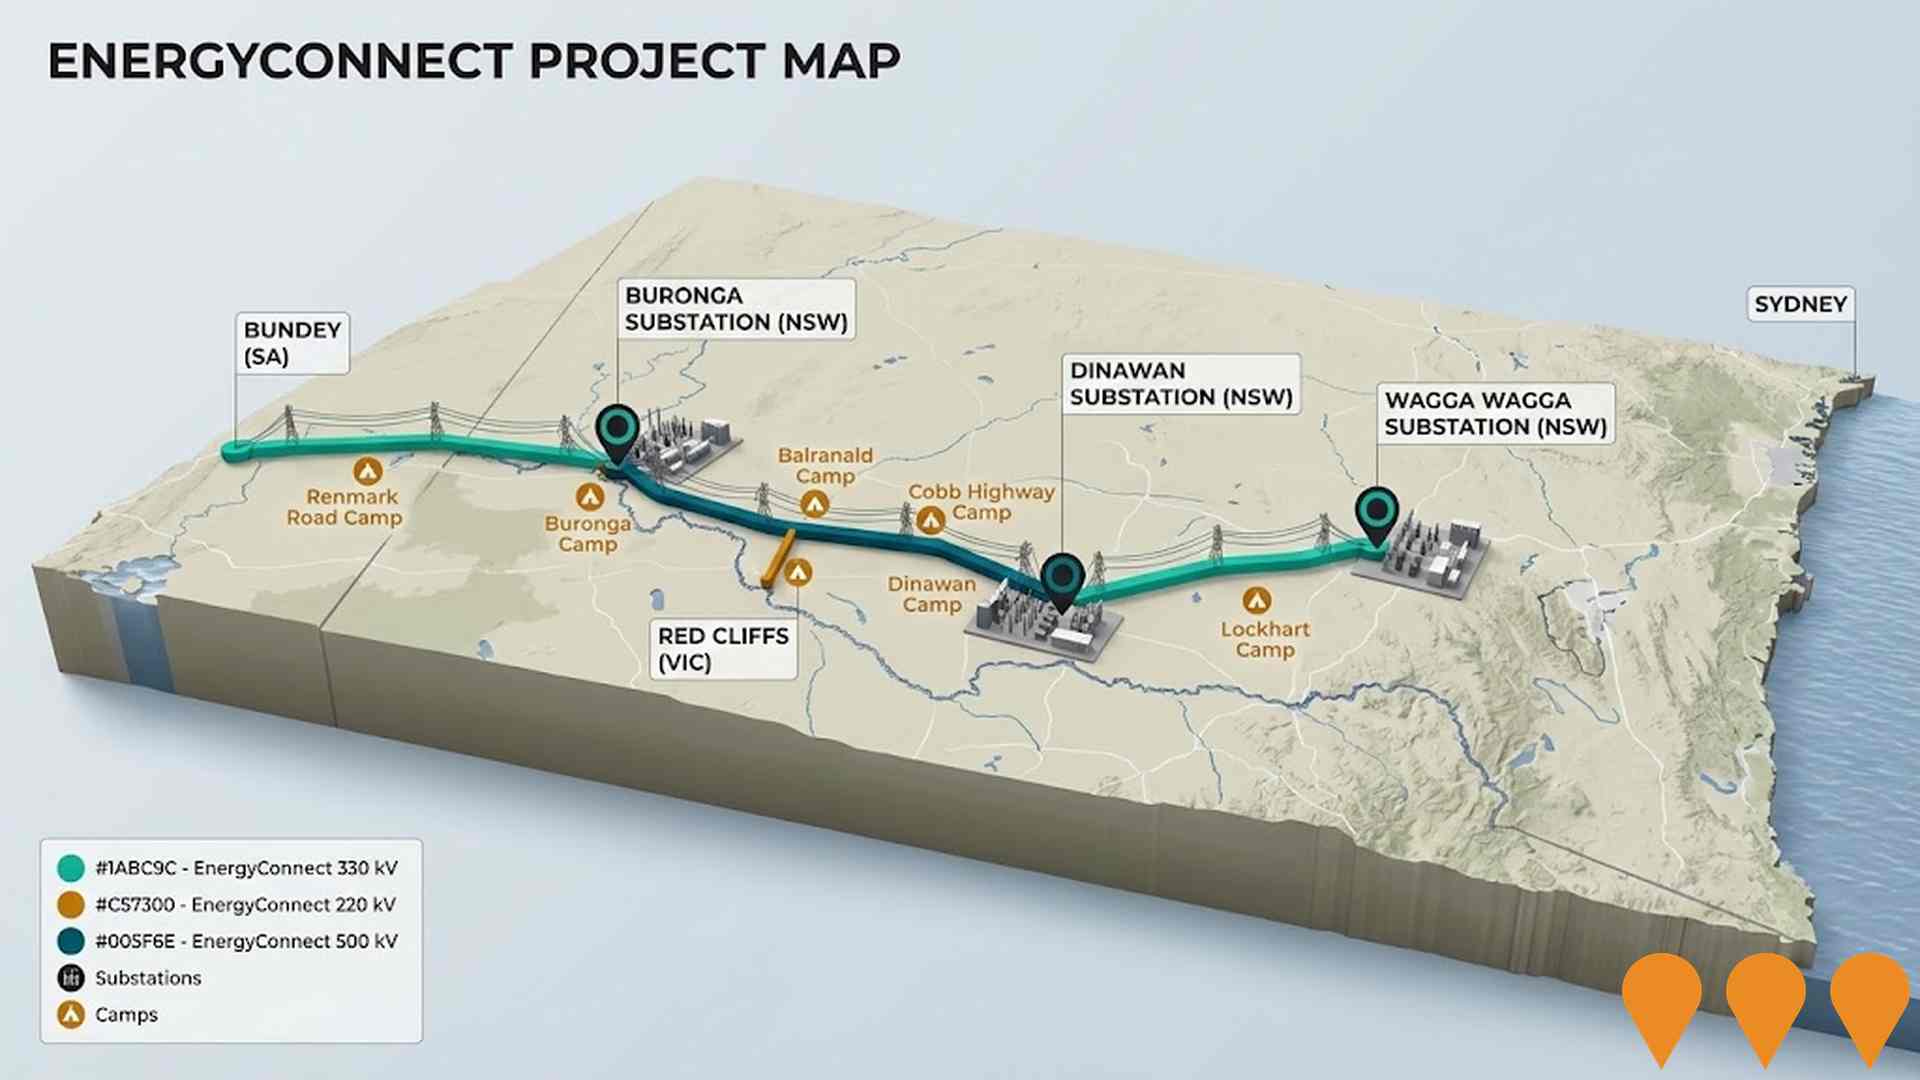
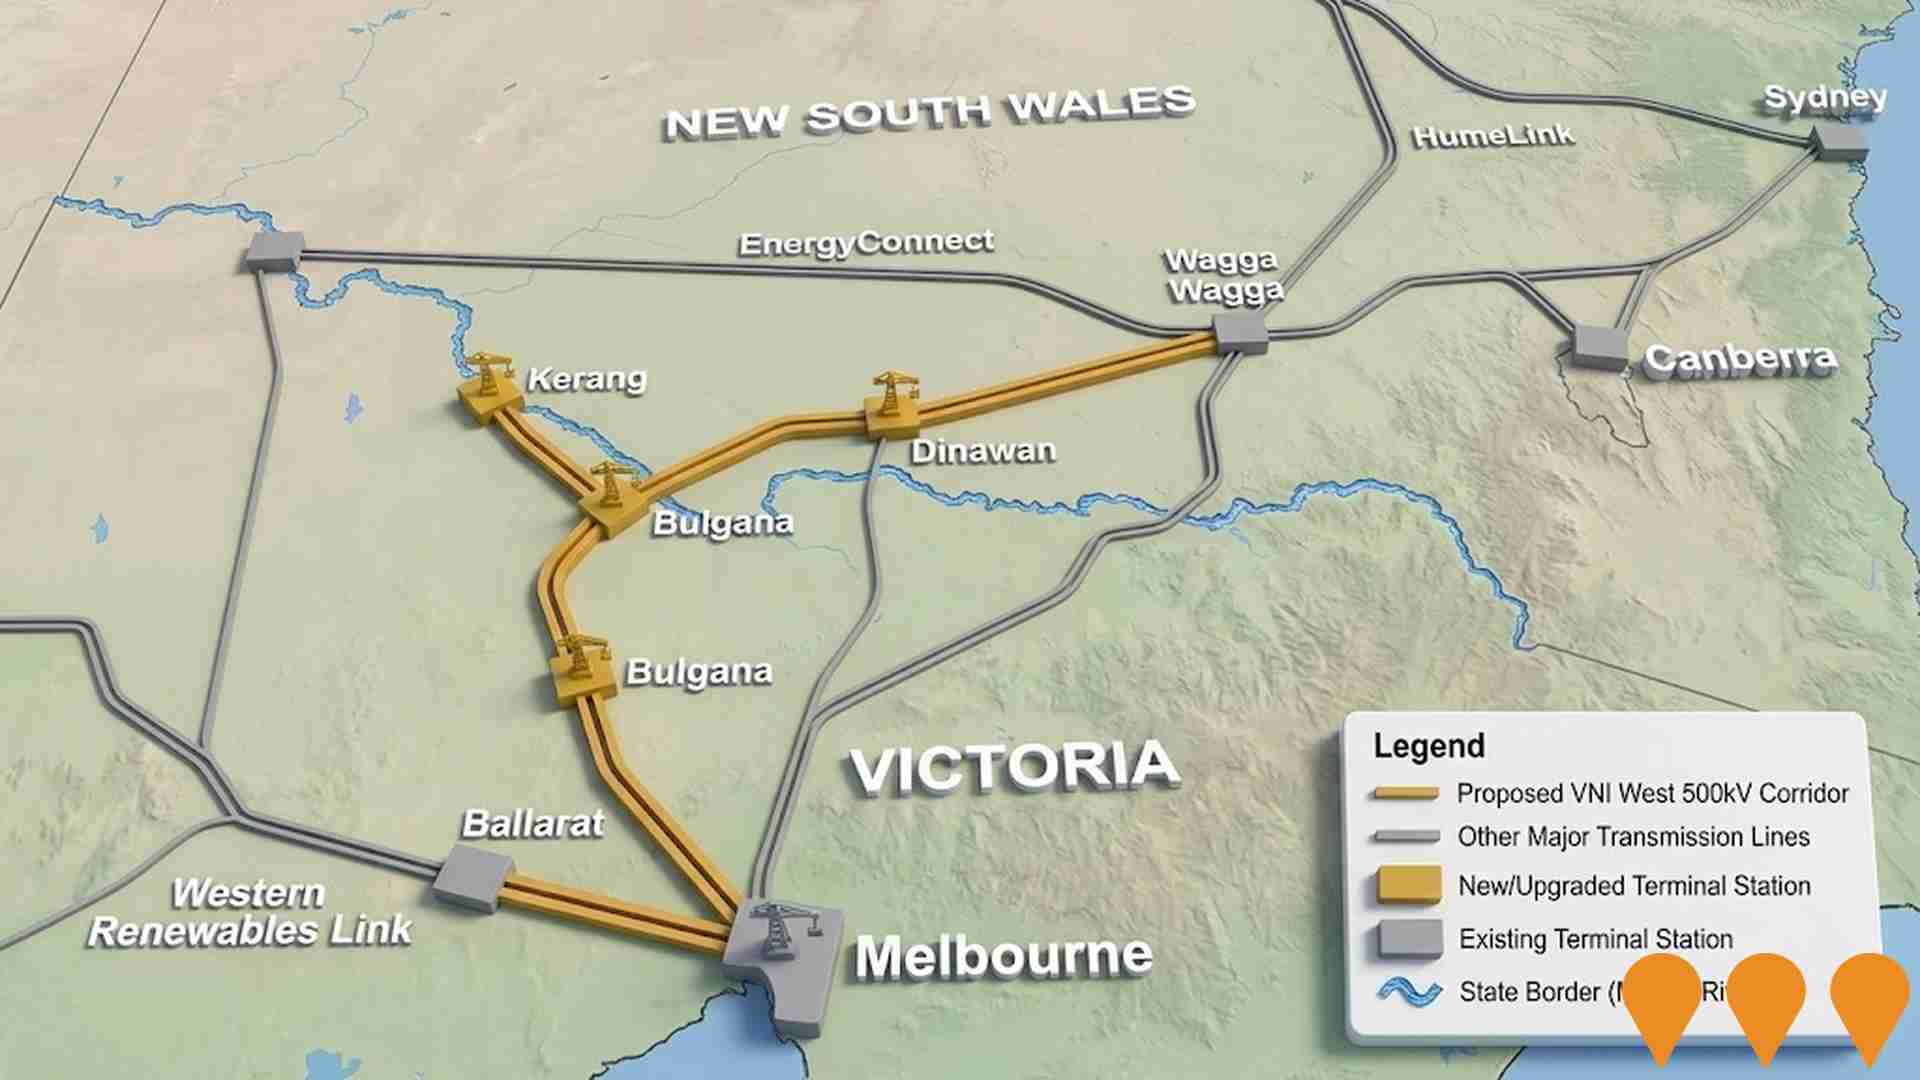
Victoria to NSW Interconnector West (VNI West)
A proposed 500 kV double circuit transmission line to connect Victoria and NSW electricity grids. The project aims to increase transfer capacity, improve reliability, support renewable energy integration from both states' Renewable Energy Zones, and maintain supply as coal-fired power stations retire. The Victorian section is undergoing an Environment Effects Statement (EES) and the NSW section has completed its Environmental Impact Statement (EIS) exhibition.
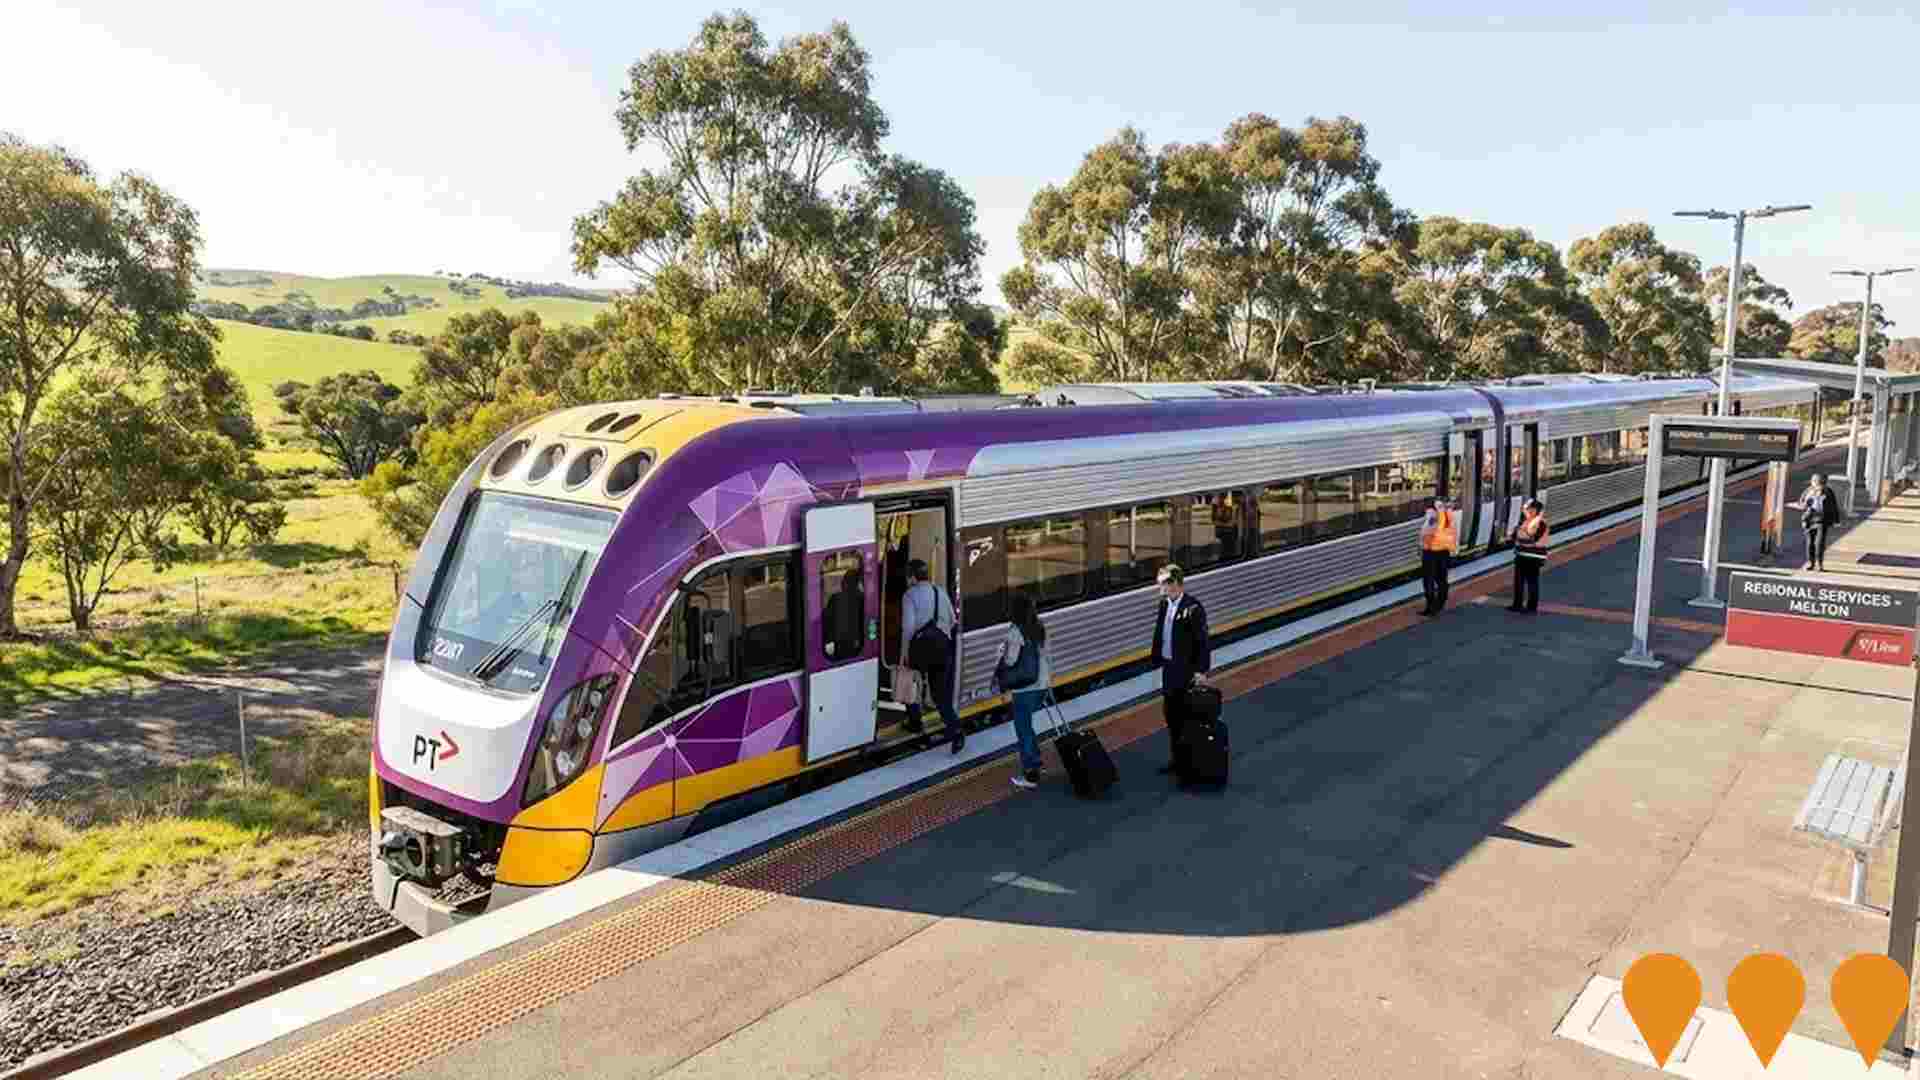
Kerang District Health Facility Upgrade (CSSD, PACU, and Operating Theatre Equipment)
Upgrade of the Central Sterile Services Department (CSSD), expansion of the Post-Anaesthesia Care Unit (PACU), and replacement of operating room equipment including sterilising tools, endoscopes, and patient monitors. The project will ensure compliance with Australian Standards and reduce the risk of cancelled procedures. The works are part of a $3.5 million funding package from the Victorian Government (Regional Health Infrastructure Fund and Engineering Infrastructure Replacement Program). Construction was due to commence by mid-September 2024, with surgical lists ceasing for 4-5 months during the construction phase, expected to recommence by late February/early March 2025.

Koorangie Energy Storage System (KESS)
A 185 MW / 370 MWh grid-forming battery energy storage system (BESS) using 100 Tesla Megapacks. It provides clean, reliable energy storage, essential grid stability services, and enables up to 300 MW of new renewable generation in the Murray River Renewable Energy Zone (REZ). The system is capable of powering 350,000 homes for two hours.
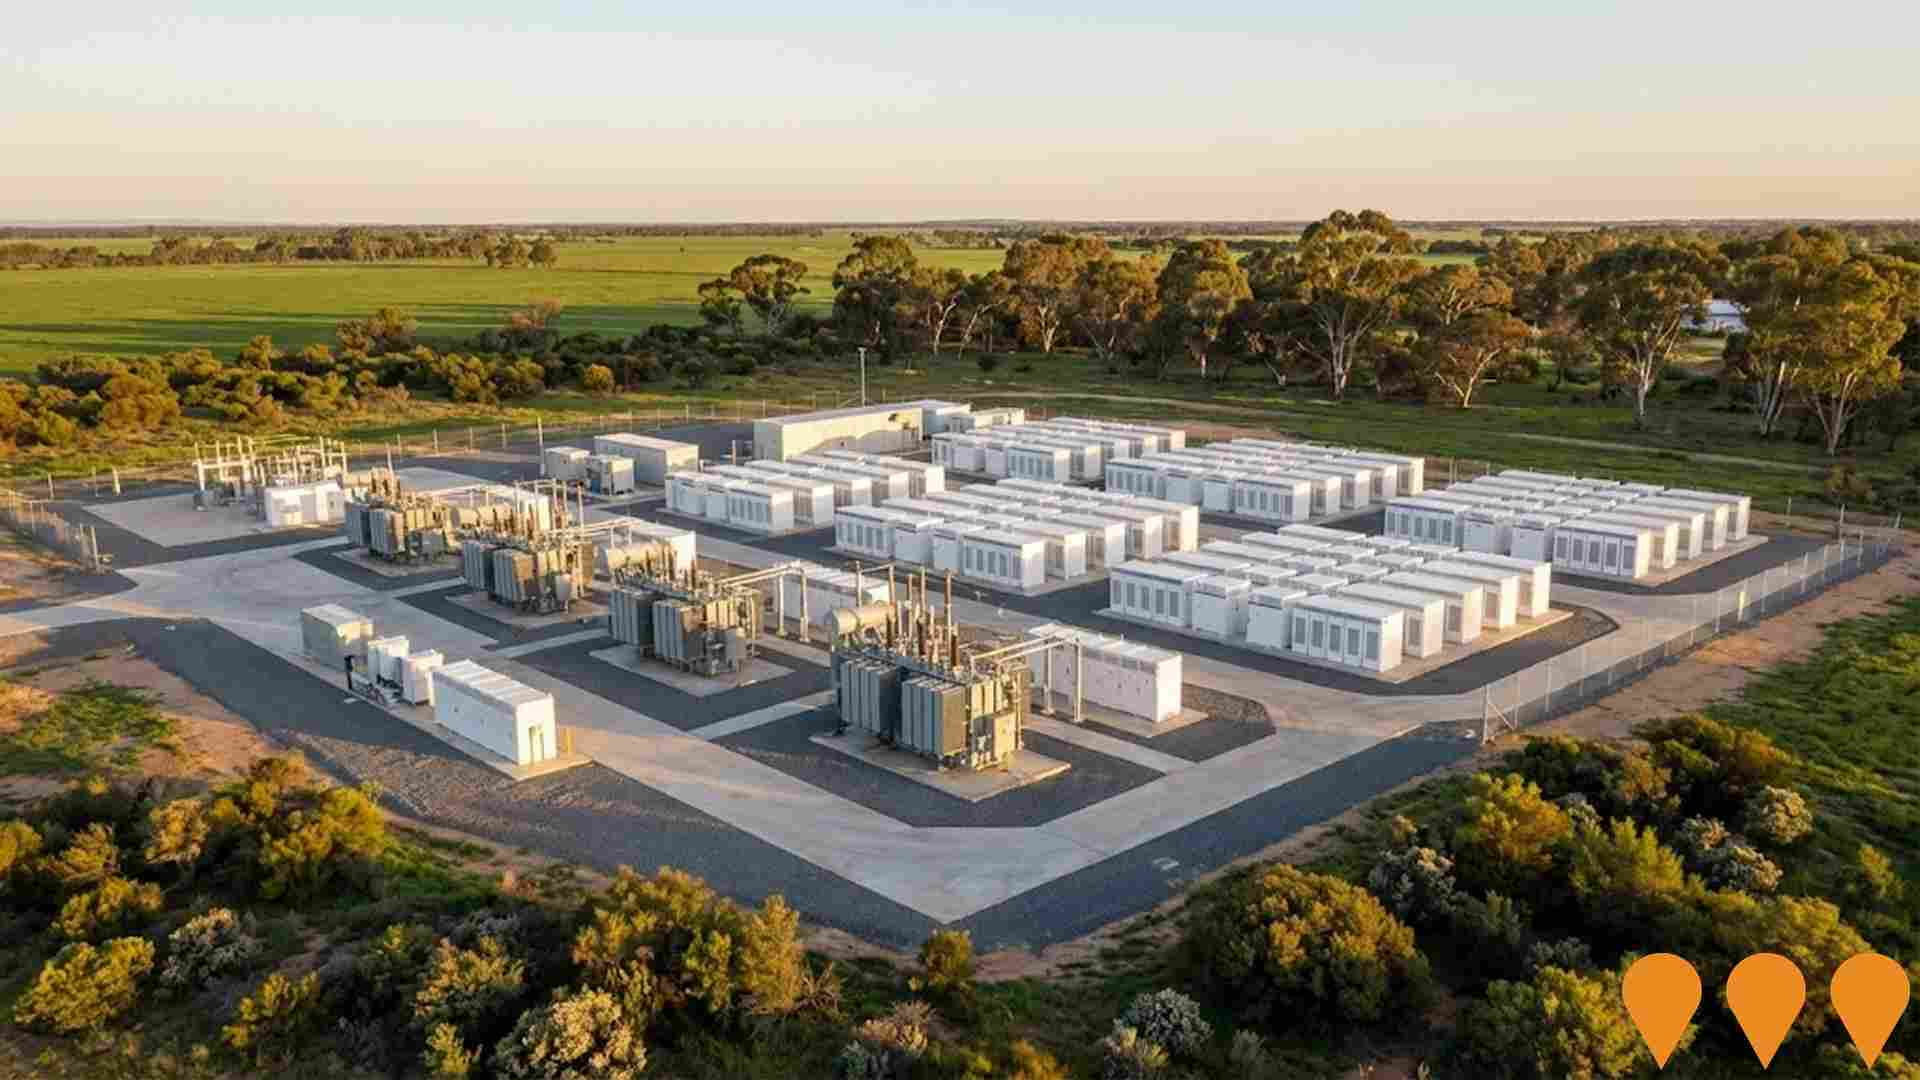
Victorian Renewable Energy Zones
VicGrid, a Victorian Government agency, is coordinating the planning and staged declaration of six proposed onshore Renewable Energy Zones (plus a Gippsland shoreline zone to support offshore wind). The 2025 Victorian Transmission Plan identifies the indicative REZ locations, access limits and the transmission works needed to connect new wind, solar and storage while minimising impacts on communities, Traditional Owners, agriculture and the environment. Each REZ will proceed through a statutory declaration and consultation process before competitive allocation of grid access to projects.
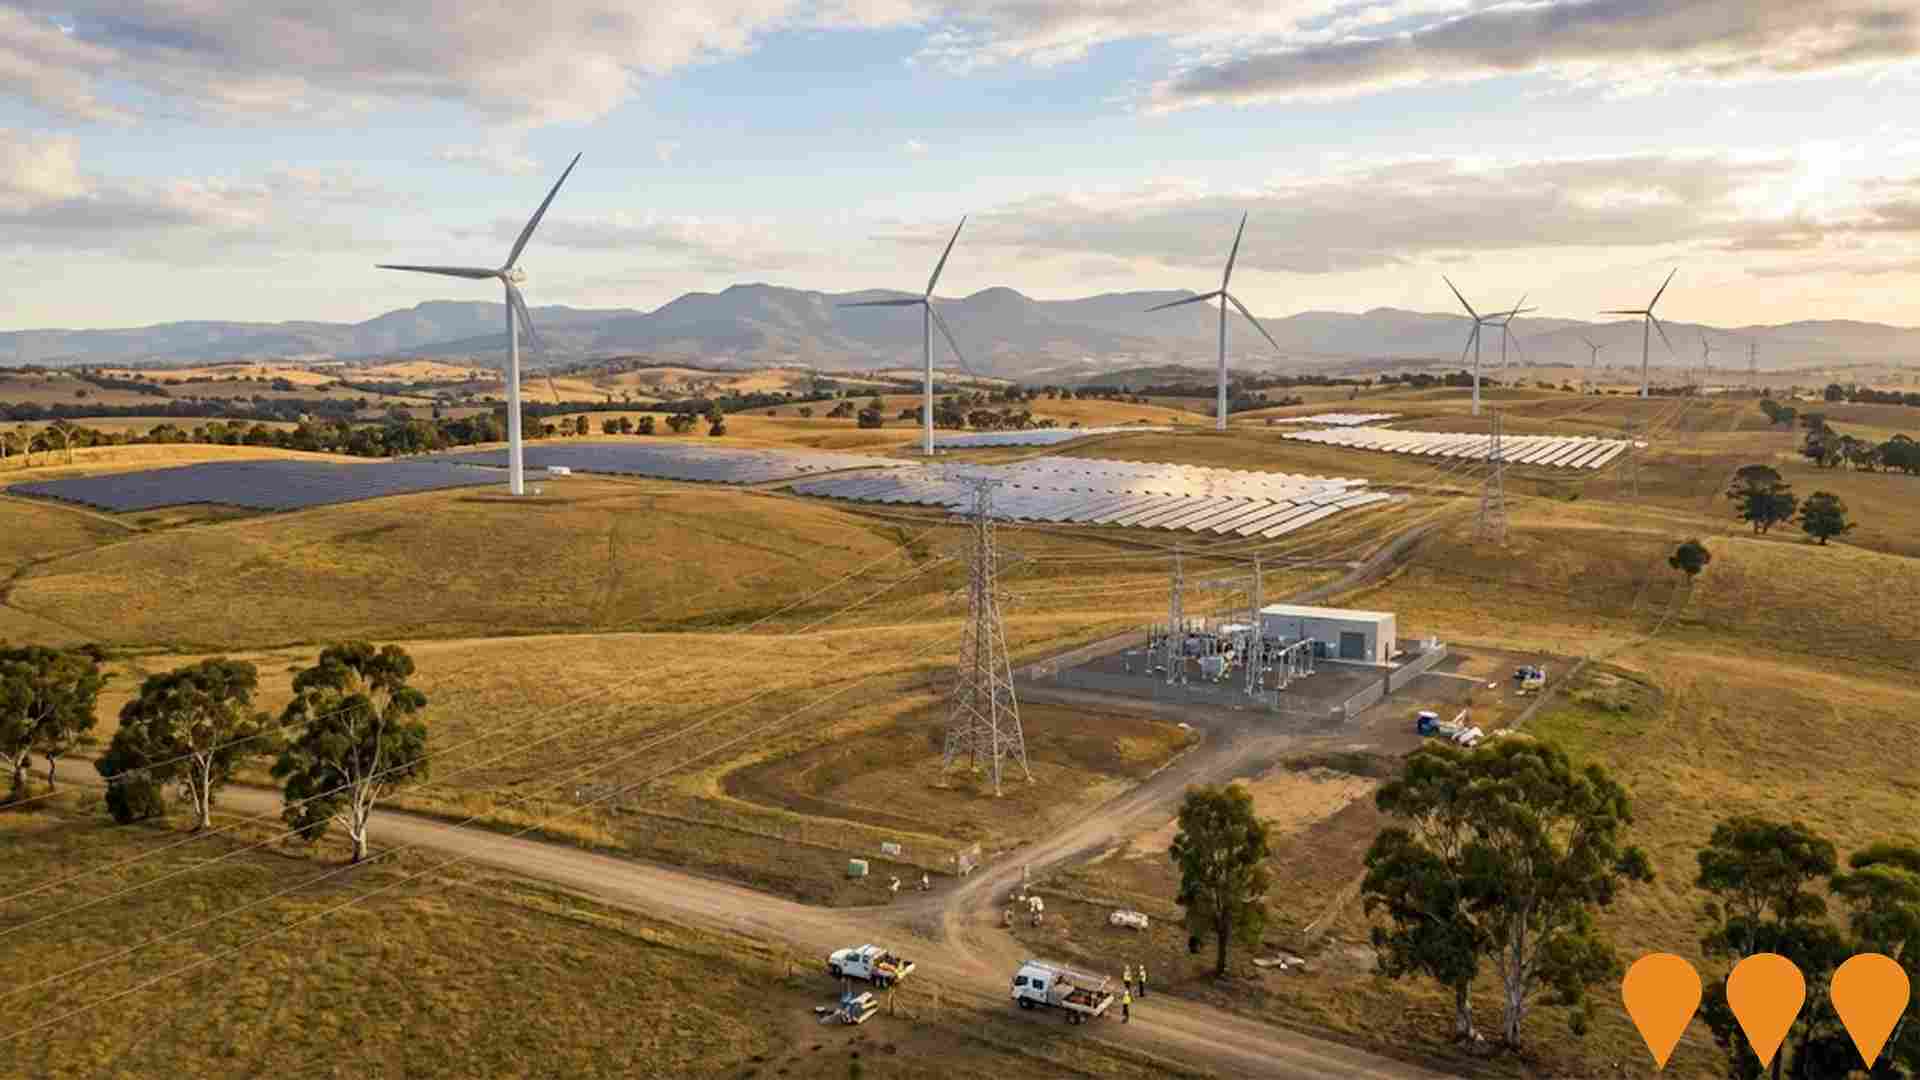
Cannie Wind Farm
A proposed wind farm of up to 174 turbines with a total capacity of up to 1300 MW, located on approximately 14,000 hectares of farmland west of Kerang. The project also includes a Battery Energy Storage System (up to 200 MW / 800 MWh) and a transmission line connection to the proposed VNI-West interconnector. The project is currently undergoing an Environment Effects Statement (EES) process with the Victorian Government.
VNI West (NSW section)
NSW portion of the VNI West interconnector: a proposed 500 kV double-circuit transmission line linking Transgrid's Dinawan Substation (near Coleambally) to the NSW/Victoria border north of Kerang, with associated upgrades including works on Transmission Line 51 near Wagga Wagga and expansion works at Dinawan Substation. The NSW Environmental Impact Statement (EIS) is on public exhibition in August 2025, and Transgrid has announced staged delivery with Stage 1 to Dinawan/South West REZ by early 2029 and Stage 2 to the Victorian border aligned to November 2030.
Kerang Solar & BESS Hybrid
A 161 MW DC solar farm co-located with a 55 MW / 110 MWh AC-coupled Battery Energy Storage System (BESS) in regional Victoria. The project has received Development Approval and AEMO 5.3.4A grid connection approval as of July 2025. It will use grid-forming inverter technology for grid stability. Construction is expected to commence late 2025, pending financial close.
Tragowel BESS Project
A proposed utility-scale Battery Energy Storage System (BESS) with a capacity of 200 MW / 800 MWh, located near the Kerang Terminal Station. It's designed to support grid stability and facilitate the integration of renewable energy sources into the local electricity grid. The project is currently undergoing technical development assessments in preparation for lodging a planning application with the Victorian Government Department of Transport and Planning (DTP).

Employment
Despite maintaining a low unemployment rate of 2.9%, Kerang has experienced recent job losses, resulting in a below average employment performance ranking when compared nationally
Kerang has a balanced workforce with both white and blue collar jobs. Essential services sectors are well represented, and the unemployment rate is 2.9%.
As of September 2025, 1601 residents are employed, with an unemployment rate of 0.9% lower than Rest of Vic.'s 3.8%. Workforce participation in Kerang is at 46.9%, compared to Rest of Vic.'s 57.4%. The dominant employment sectors among residents include health care & social assistance, retail trade, and manufacturing. Public administration & safety shows strong specialization, with an employment share 1.6 times the regional level.
Accommodation & food services have a limited presence at 5.1%, compared to the regional average of 6.9%. Many Kerang residents commute elsewhere for work based on Census data. Between September 2024 and September 2025, the labour force decreased by 4.3% while employment fell by 2.0%, causing unemployment to drop by 2.3 percentage points. In contrast, Rest of Vic.'s employment fell by 0.7%, with a slight rise in unemployment. State-wide, VIC's employment grew by 1.13% year-on-year as of 25-Nov, adding 41,950 jobs, with an unemployment rate of 4.7%. National employment forecasts from May-25 suggest national employment will expand by 6.6% over five years and 13.7% over ten years. Applying these projections to Kerang's employment mix indicates local employment should increase by 5.7% over five years and 12.5% over ten years, though this is a simple extrapolation for illustrative purposes and does not account for localized population projections.
Frequently Asked Questions - Employment
Income
Income metrics place the area in the bottom 10% of locations nationally according to AreaSearch analysis
AreaSearch's latest postcode level ATO data for financial year 2022 shows Kerang SA2 had a median income among taxpayers of $42,504 and an average of $50,020. This is lower than the national average. Rest of Vic., meanwhile, had a median income of $48,741 and an average of $60,693. Based on Wage Price Index growth since financial year 2022, current estimates for Kerang would be approximately $47,672 (median) and $56,102 (average) as of September 2025. Census data reveals household, family and personal incomes in Kerang fall between the 3rd and 8th percentiles nationally. Income distribution shows that 32.5% of residents earn between $400 - $799 per week, differing from broader area patterns where the $1,500 - $2,999 bracket dominates at 30.3%. This indicates constrained household budgets across much of the area despite modest housing costs with 89.0% of income retained. However, total disposable income ranks at just the 7th percentile nationally.
Frequently Asked Questions - Income
Housing
Kerang is characterized by a predominantly suburban housing profile, with above-average rates of outright home ownership
Kerang's dwelling structures, as per the latest Census, consisted of 89.6% houses and 10.5% other dwellings (semi-detached, apartments, 'other' dwellings). In comparison, Non-Metro Vic.'s dwelling structures were 90.7% houses and 9.2% other dwellings. Home ownership in Kerang was at 48.9%, with the rest being mortgaged (27.5%) or rented (23.6%). The median monthly mortgage repayment in Kerang was $1,000, lower than Non-Metro Vic.'s average of $1,083. The median weekly rent figure in Kerang was $200, the same as Non-Metro Vic.'s figure. Nationally, Kerang's mortgage repayments were significantly lower than the Australian average of $1,863, while rents were substantially below the national figure of $375.
Frequently Asked Questions - Housing
Household Composition
Kerang features high concentrations of lone person households, with a lower-than-average median household size
Family households comprise 58.7% of all households, including 19.1% couples with children, 28.2% couples without children, and 10.0% single parent families. Non-family households account for the remaining 41.3%, with lone person households at 38.7% and group households comprising 2.8%. The median household size is 2.1 people, which is smaller than the Rest of Vic. average of 2.3.
Frequently Asked Questions - Households
Local Schools & Education
Kerang faces educational challenges, with performance metrics placing it in the bottom quartile of areas assessed nationally
The area's university qualification rate is 11.8%, significantly lower than Victoria's average of 33.4%. Bachelor degrees are the most common at 8.6%, followed by postgraduate qualifications (1.6%) and graduate diplomas (1.6%). Vocational credentials are prominent, with 38.6% of residents aged 15+ holding them, including advanced diplomas (9.5%) and certificates (29.1%). Educational participation is high at 25.3%, comprising 10.6% in primary education, 7.9% in secondary education, and 1.6% pursuing tertiary education.
Educational participation is notably high, with 25.3% of residents currently enrolled in formal education. This includes 10.6% in primary education, 7.9% in secondary education, and 1.6% pursuing tertiary education.
Frequently Asked Questions - Education
Schools Detail
Nearby Services & Amenities
Transport
Transport servicing is very low compared to other areas nationally based on assessment of service frequency, route connectivity and accessibility
Kerang has two operational public transport stops offering a mix of train and bus services. These stops are served by 14 different routes, collectively offering 108 weekly passenger trips. Transport accessibility is limited with residents typically located 902 meters from the nearest stop.
Service frequency averages 15 trips per day across all routes, equating to approximately 54 weekly trips per individual stop.
Frequently Asked Questions - Transport
Transport Stops Detail
Health
Health performance in Kerang is a key challenge with a range of health conditions having marked impacts on both younger and older age cohorts
Critical health challenges are evident across Kerang. A range of health conditions impact both younger and older age cohorts.
The rate of private health cover is extremely low at approximately 46% of the total population (~1,774 people), compared to the national average of 55.3%. The most common medical conditions in the area are arthritis and asthma, impacting 13.0% and 9.9% of residents respectively. Conversely, 56.6% of residents declare themselves completely clear of medical ailments, compared to 64.1% across Rest of Vic.. The area has 30.4% of residents aged 65 and over (1,168 people), which is higher than the 24.0% in Rest of Vic.. Health outcomes among seniors present some challenges, performing even better than the general population in health metrics.
Frequently Asked Questions - Health
Cultural Diversity
The latest Census data sees Kerang placing among the least culturally diverse areas in the country when compared across a range of language and cultural background related metrics
Kerang's population shows low cultural diversity, with 91.2% being citizens, 93.9% born in Australia, and 97.4% speaking English only at home. Christianity is the dominant religion in Kerang, accounting for 55.6%, compared to 53.2% across Rest of Vic.. The top three ancestry groups are English (35.2%), Australian (33.5%), and Scottish (9.2%).
Notably, Australian Aboriginal representation is higher at 2.6% in Kerang versus the regional average of 2.5%. Irish and German representations are also slightly higher than regional averages at 8.3% and 3.3%, respectively.
Frequently Asked Questions - Diversity
Age
Kerang ranks among the oldest 10% of areas nationwide
Kerang's median age is 51 years, which is significantly higher than the Rest of Vic average of 43 years and considerably older than the Australian median of 38 years. Compared to the Rest of Vic average, the 65-74 cohort is notably over-represented in Kerang at 15.9%, while the 45-54 year-olds are under-represented at 9.4%. This concentration of the 65-74 age group is well above the national average of 9.4%. Post-2021 Census data shows that the 35 to 44 age group has grown from 9.6% to 10.7%, while the 45 to 54 cohort has declined from 10.9% to 9.4%. By 2041, Kerang is expected to see notable shifts in its age composition. The 85+ group will grow by -7 people (-7%), reaching 173 from 185. Meanwhile, population declines are projected for the 85+ and 45-54 cohorts.
