Chart Color Schemes
This analysis uses ABS Statistical Areas Level 2 (SA2) boundaries, which can materially differ from Suburbs and Localities (SAL) even when sharing similar names.
SA2 boundaries are defined by the Australian Bureau of Statistics and are designed to represent communities for statistical reporting (e.g., census and ERP).
Suburbs and Localities (SAL) represent commonly-used suburb/locality names (postal-style areas) and may use different geographic boundaries. For comprehensive analysis, consider reviewing both boundary types if available.
est. as @ -- *
ABS ERP | -- people | --
2021 Census | -- people
Sales Activity
Curious about local property values? Filter the chart to assess the volume and appreciation (including resales) trends and regional comparisons, or scroll to the map below view this information at an individual property level.
Find a Recent Sale
Sales Detail
Population
Caringbah South has seen population growth performance typically on par with national averages when looking at short and medium term trends
Caringbah South's population was around 13,561 as of November 2025, reflecting an increase of 546 people since the 2021 Census which reported a population of 13,015. This change is inferred from the estimated resident population of 13,506 in June 2024 and an additional 187 validated new addresses since the Census date. The population density ratio was 3,331 persons per square kilometer, placing Caringbah South in the upper quartile relative to national locations assessed by AreaSearch. Its growth of 4.2% since the 2021 census exceeded the SA4 region's growth of 4.1%. Population growth was primarily driven by overseas migration contributing approximately 52.1% of overall population gains during recent periods, although all drivers including natural growth and interstate migration were positive factors. AreaSearch adopted ABS/Geoscience Australia projections for each SA2 area released in 2024 with a base year of 2022.
For areas not covered by this data, NSW State Government's SA2 level projections released in 2022 with a base year of 2021 were utilized. Growth rates by age group from these aggregations were applied to all areas for years 2032 to 2041. Based on the latest annual ERP population numbers, Caringbah South is expected to grow by 1,062 persons to 2041, reflecting an increase of approximately 7.4% in total over the 17-year period.
Frequently Asked Questions - Population
Development
AreaSearch assessment of residential development activity positions Caringbah South among the top 25% of areas assessed nationwide
Caringbah South has received approximately 116 dwelling approvals annually over the past five financial years, totalling 581 homes. As of FY26, 41 approvals have been recorded. On average, 1.1 people move to the area per year for each dwelling built between FY21 and FY25, indicating a balanced supply and demand market with stable conditions.
New properties are constructed at an average expected cost of $434,000, which is higher than regional norms, reflecting quality-focused development. Compared to Greater Sydney, Caringbah South has slightly more development activity, 29.0% above the regional average per person over the five-year period, balancing buyer choice while supporting current property values. New building activity comprises 22.0% detached houses and 78.0% medium and high-density housing, providing accessible entry options for downsizers, investors, and entry-level buyers. This shift from the area's existing housing composition of 76.0% houses indicates decreasing availability of developable sites and reflects changing lifestyles and demand for diverse, affordable housing options. With around 131 people per dwelling approval, Caringbah South is considered a low-density area.
According to AreaSearch's latest quarterly estimate, the area is expected to grow by 1,047 residents by 2041. Based on current development patterns, new housing supply should meet demand, offering good conditions for buyers and potentially facilitating further population growth beyond current projections.
Frequently Asked Questions - Development
Infrastructure
Caringbah South has strong levels of nearby infrastructure activity, ranking in the top 30% nationally
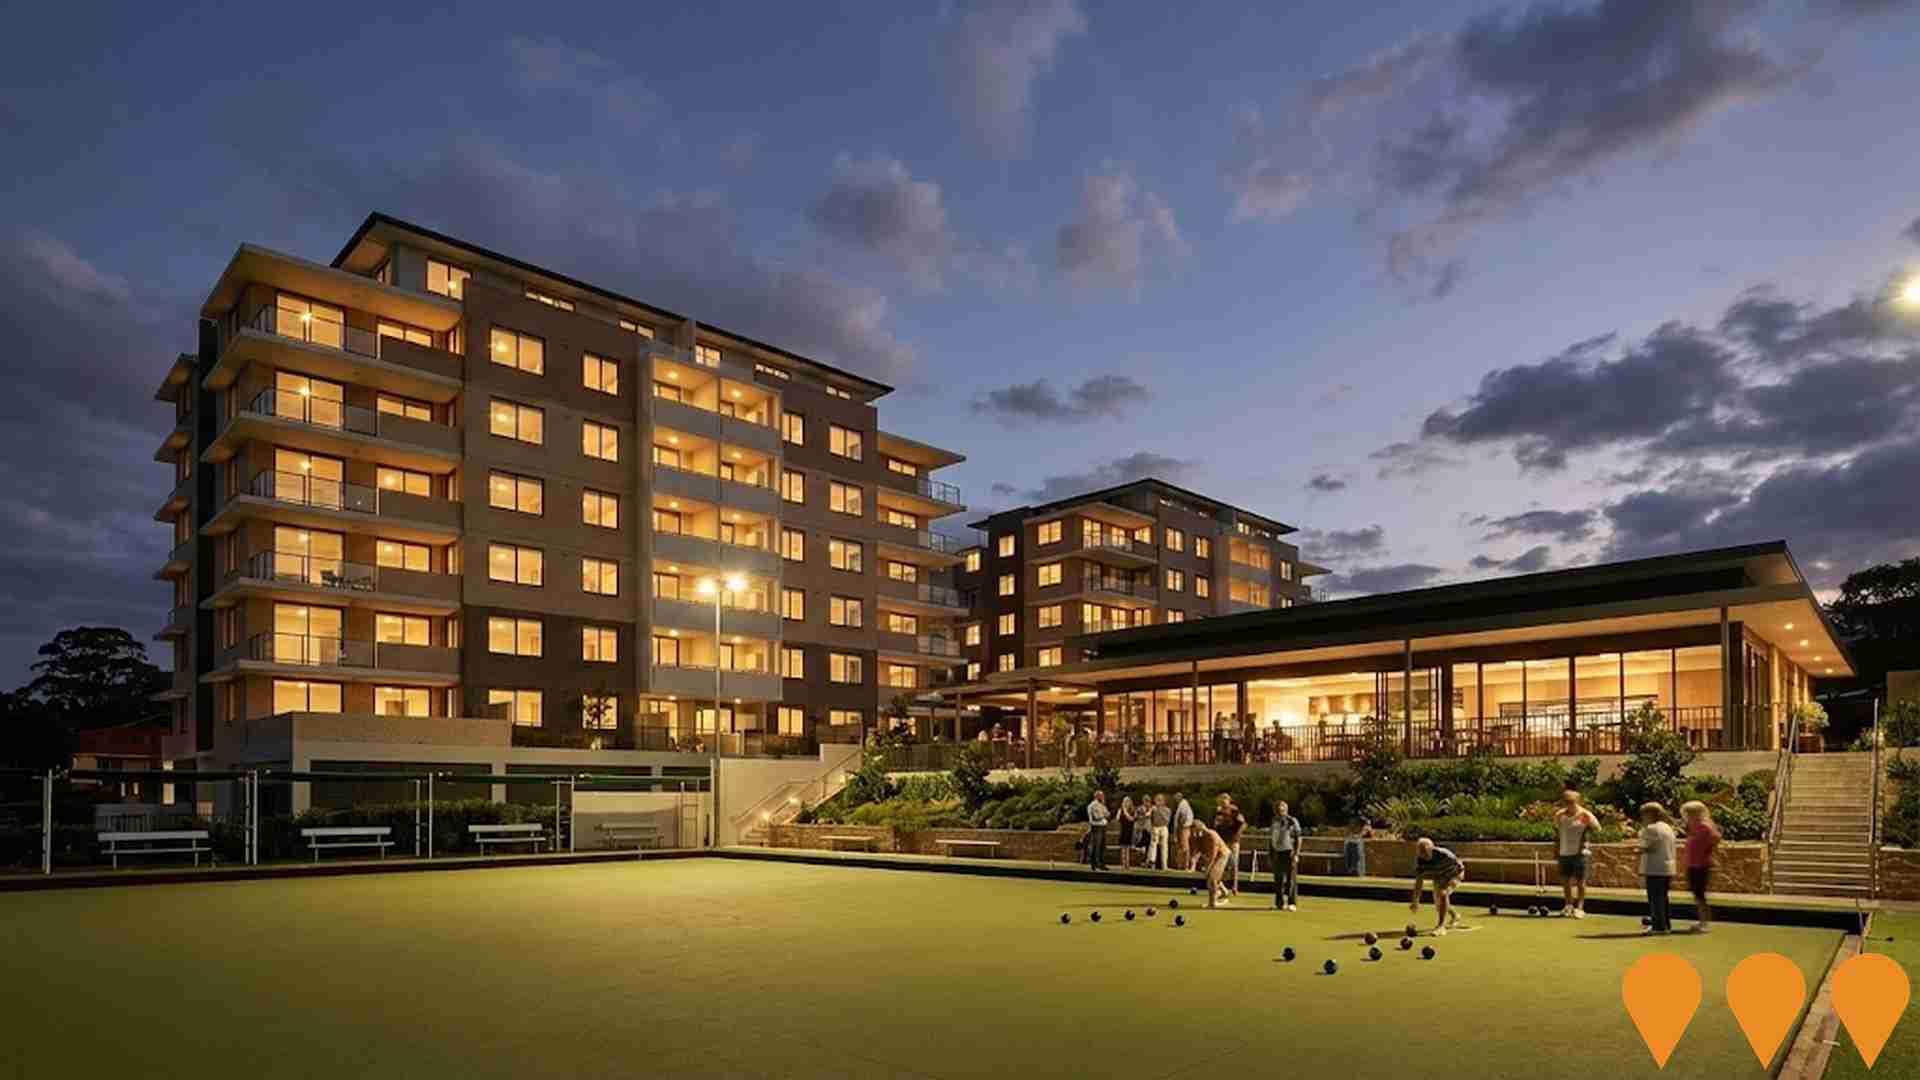
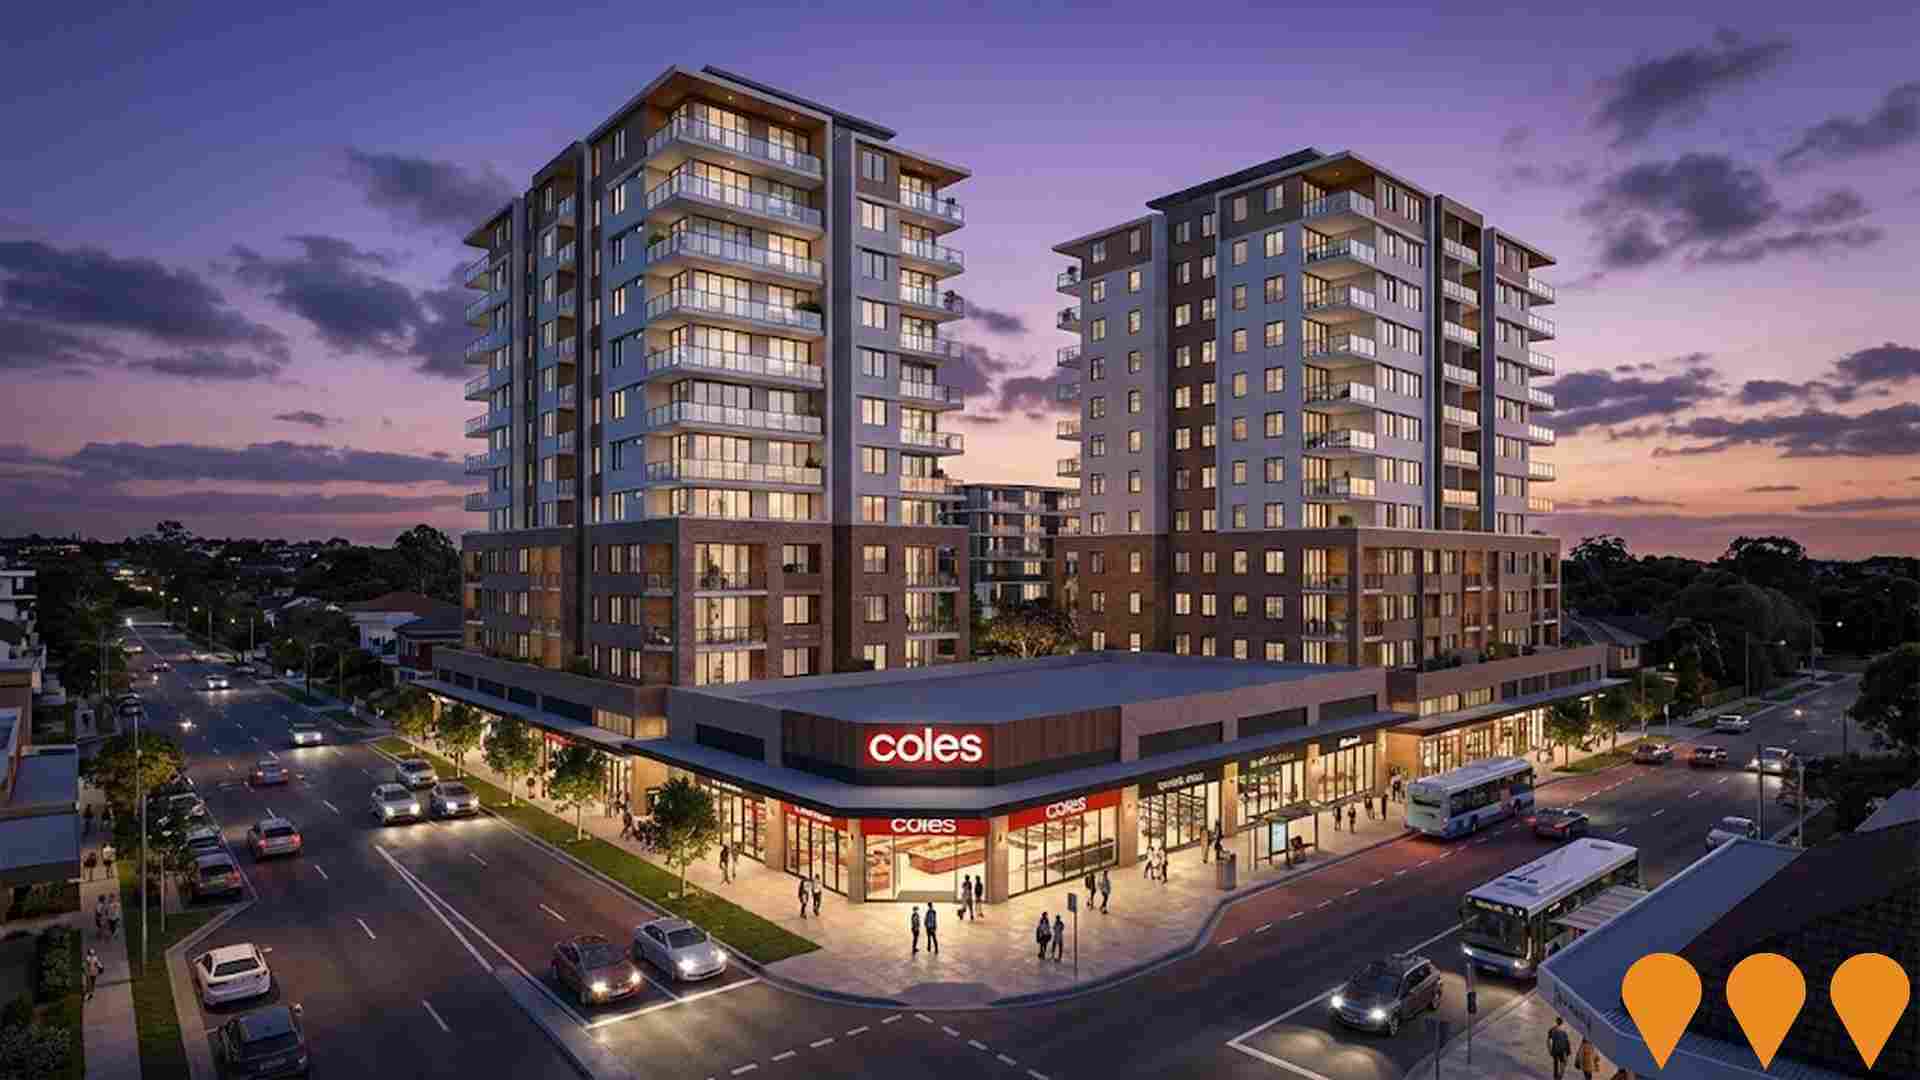
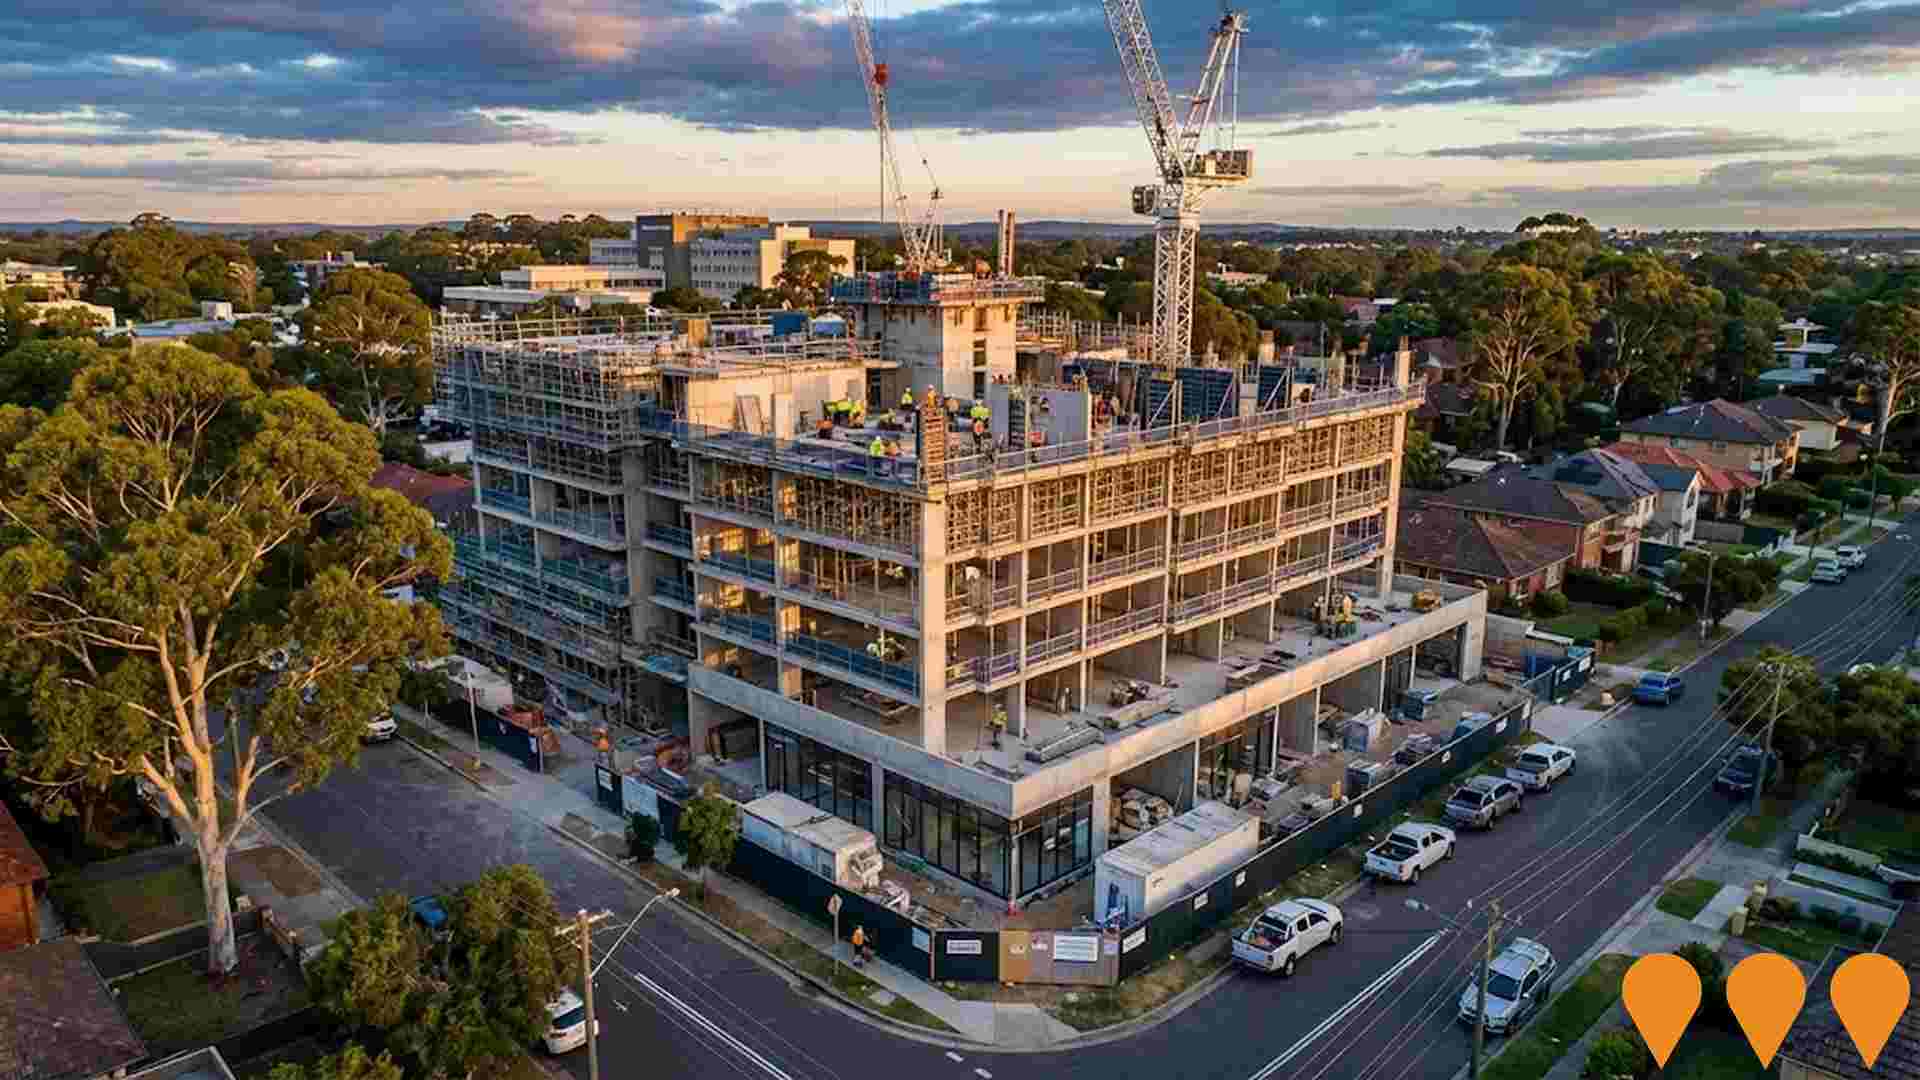
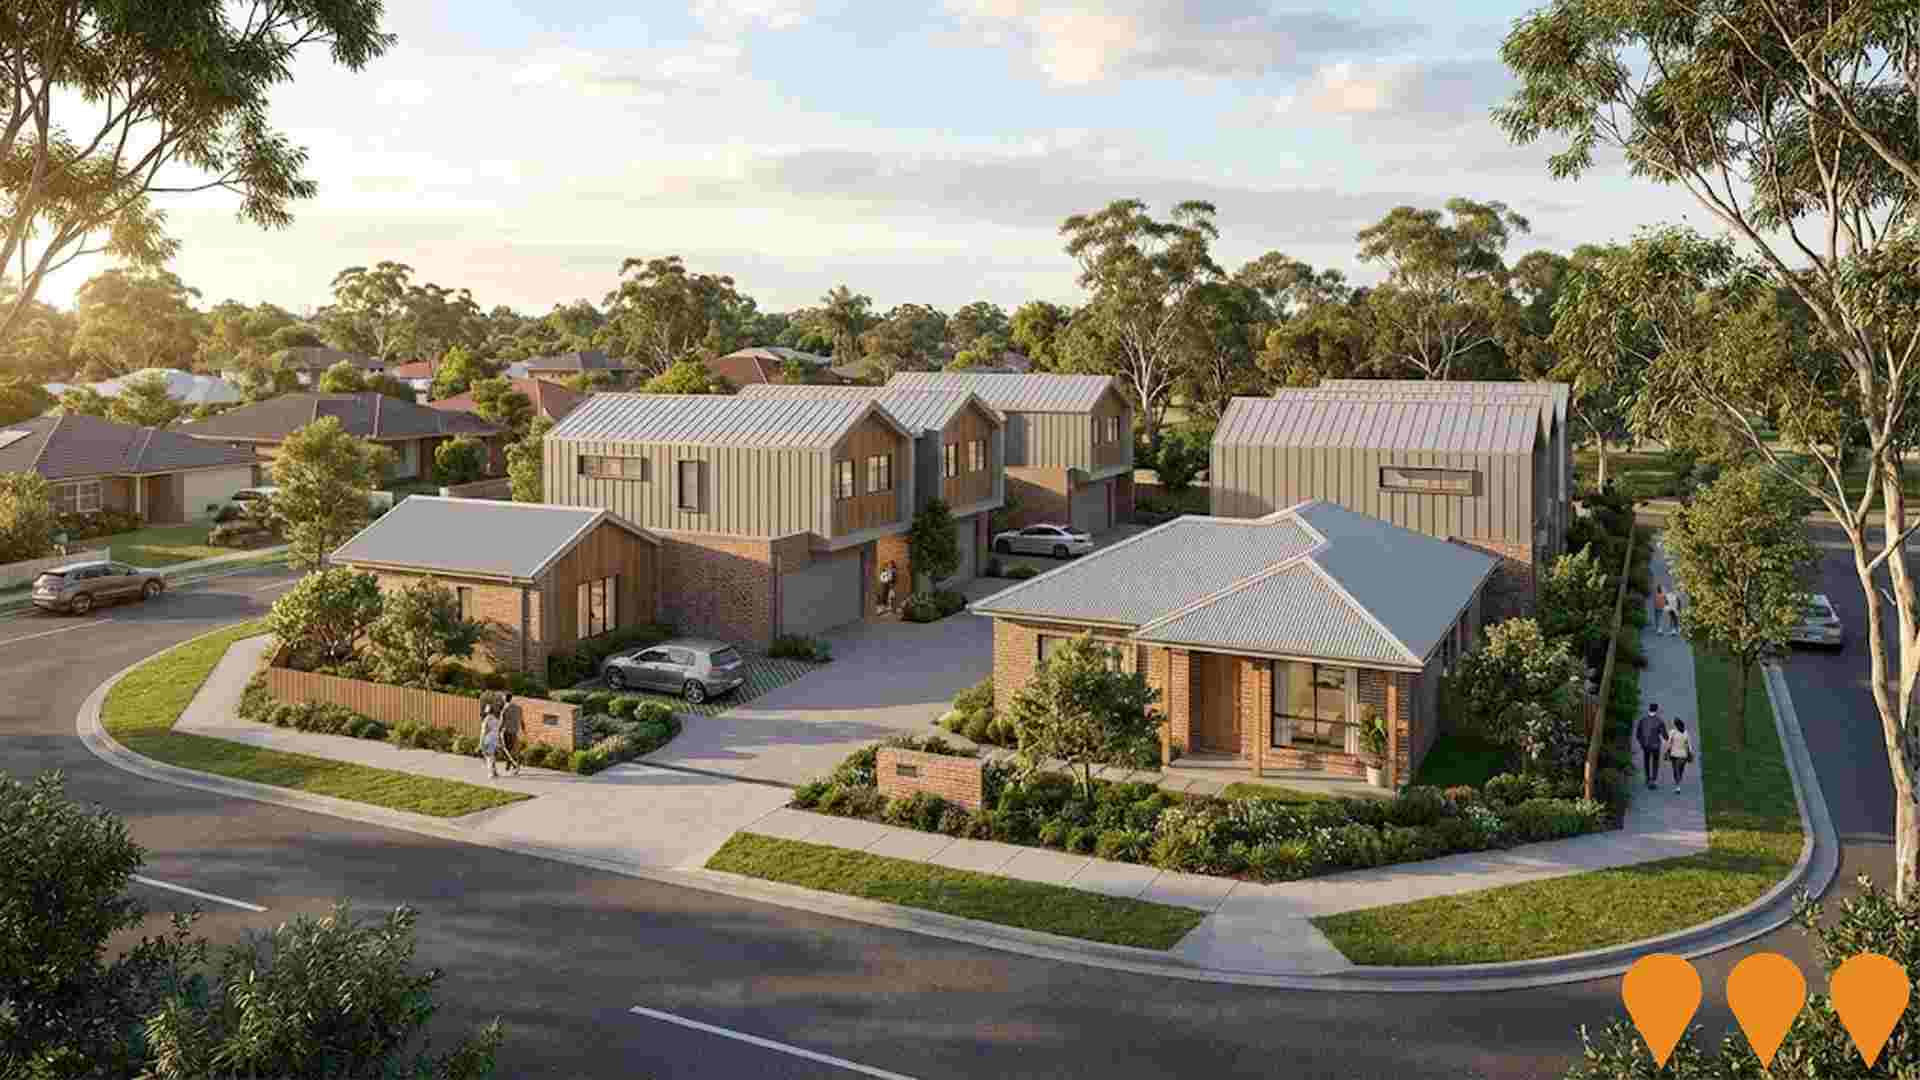
Local infrastructure changes significantly impact an area's performance. AreaSearch has identified 14 projects likely affecting the region. Notable projects include Caringbah Pavilion, Live Caringbah, Shop top housing with affordable housing at Willarong Road and President Avenue Caringbah, and Frank Vickery Village Seniors Housing Expansion. The following list details those most relevant:.
Professional plan users can use the search below to filter and access additional projects.
INFRASTRUCTURE SEARCH
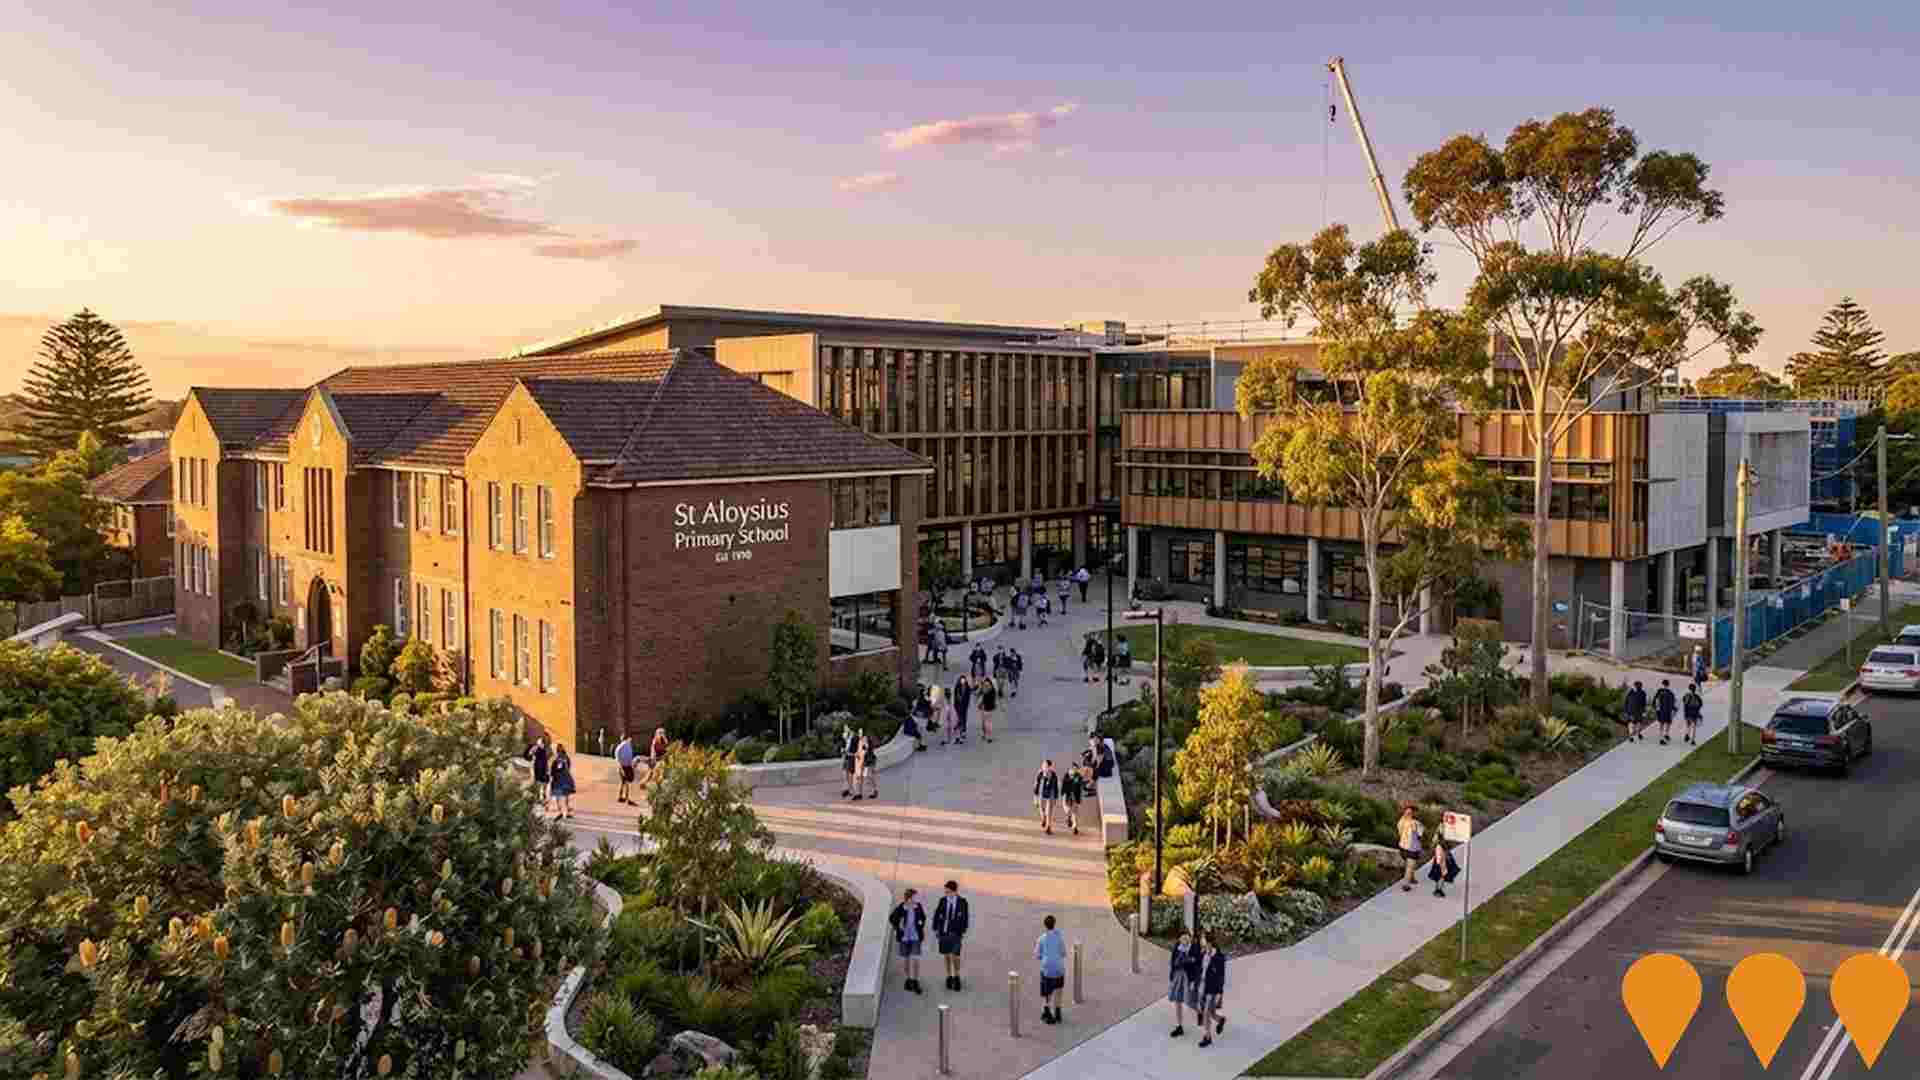
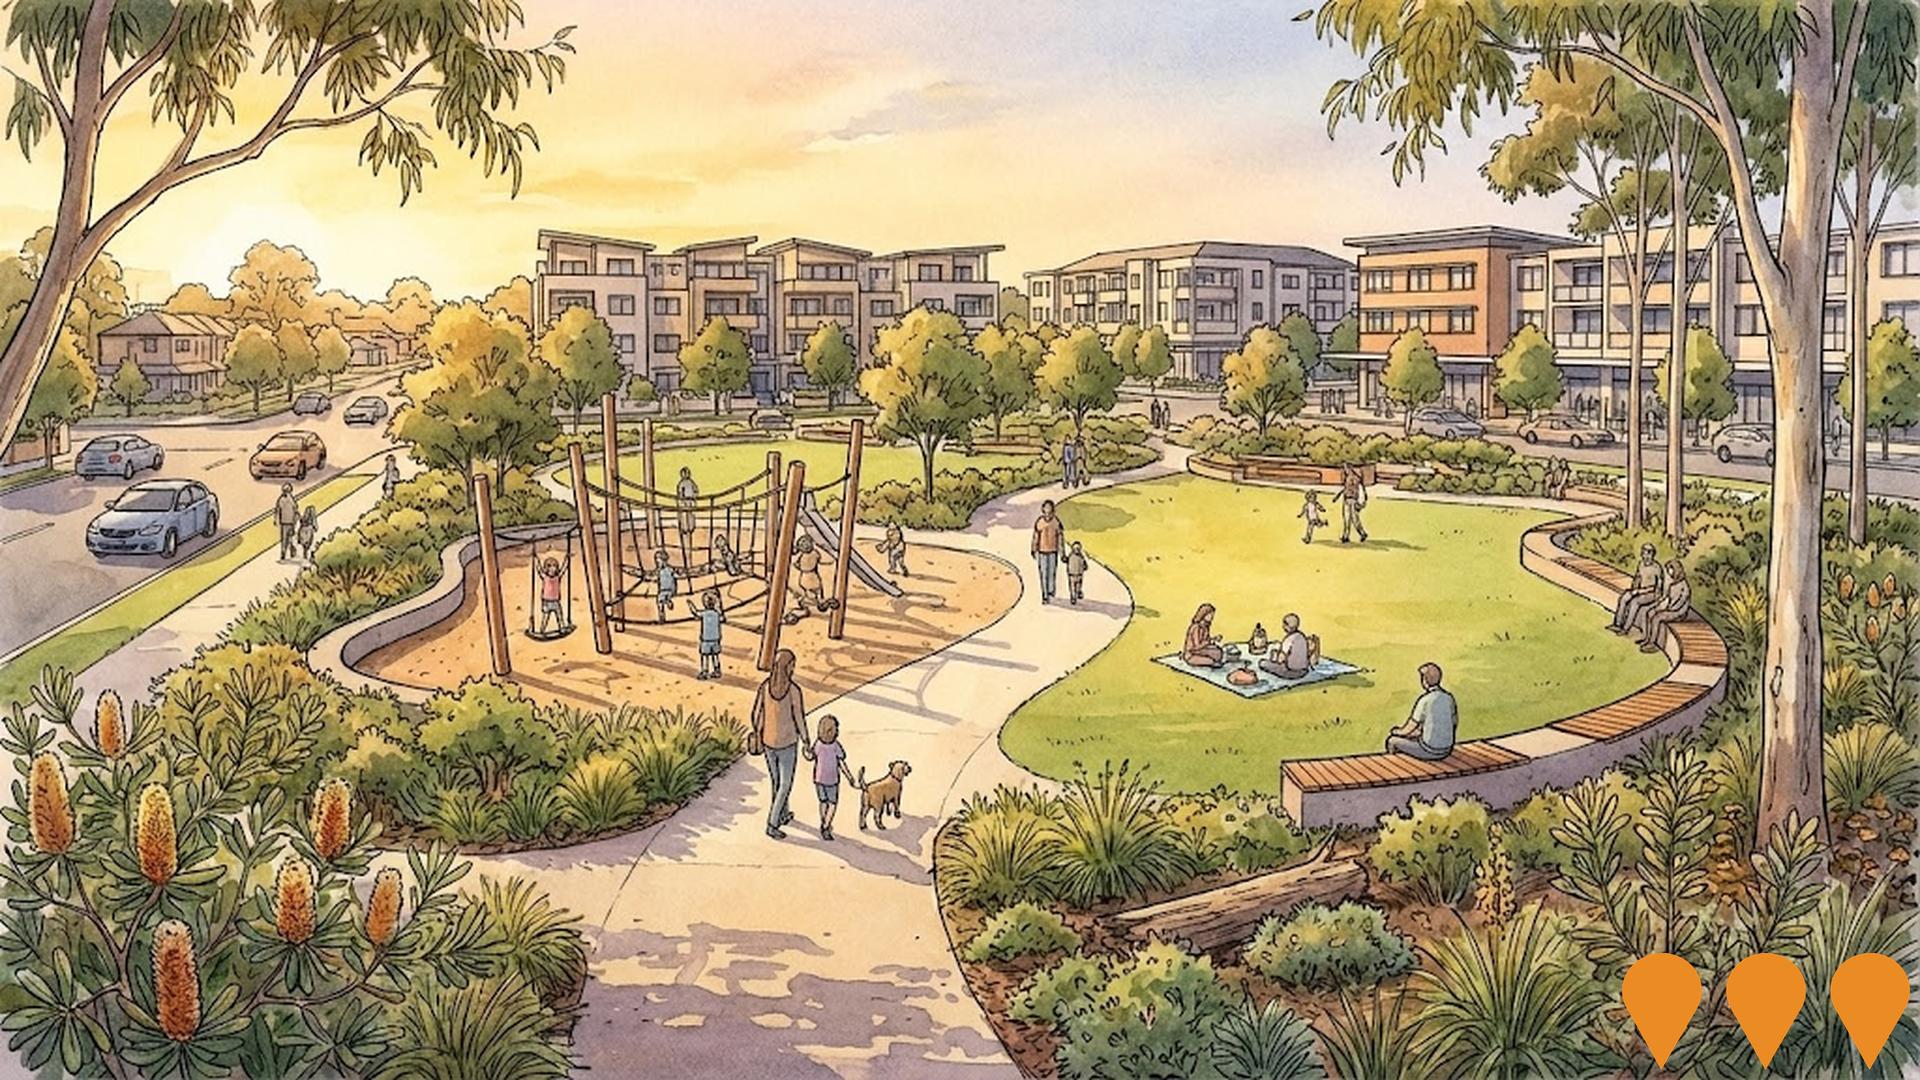
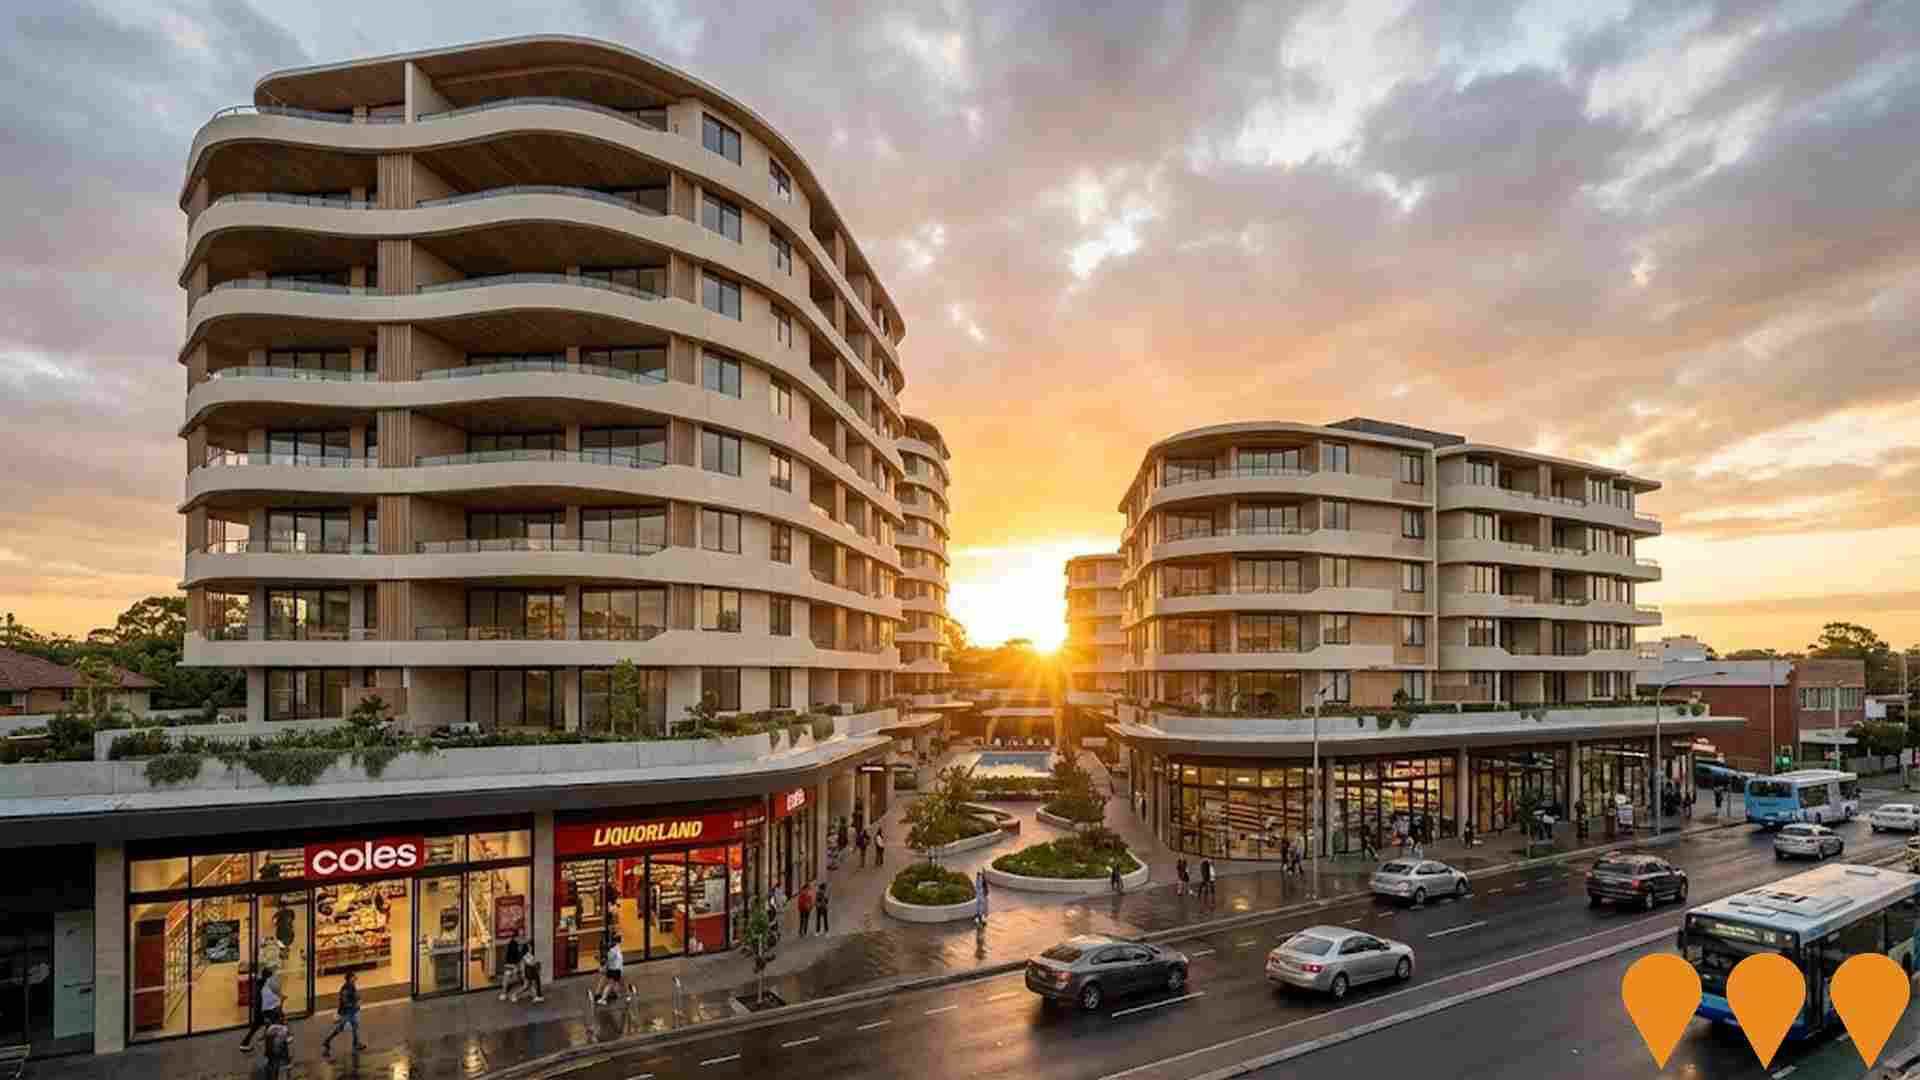
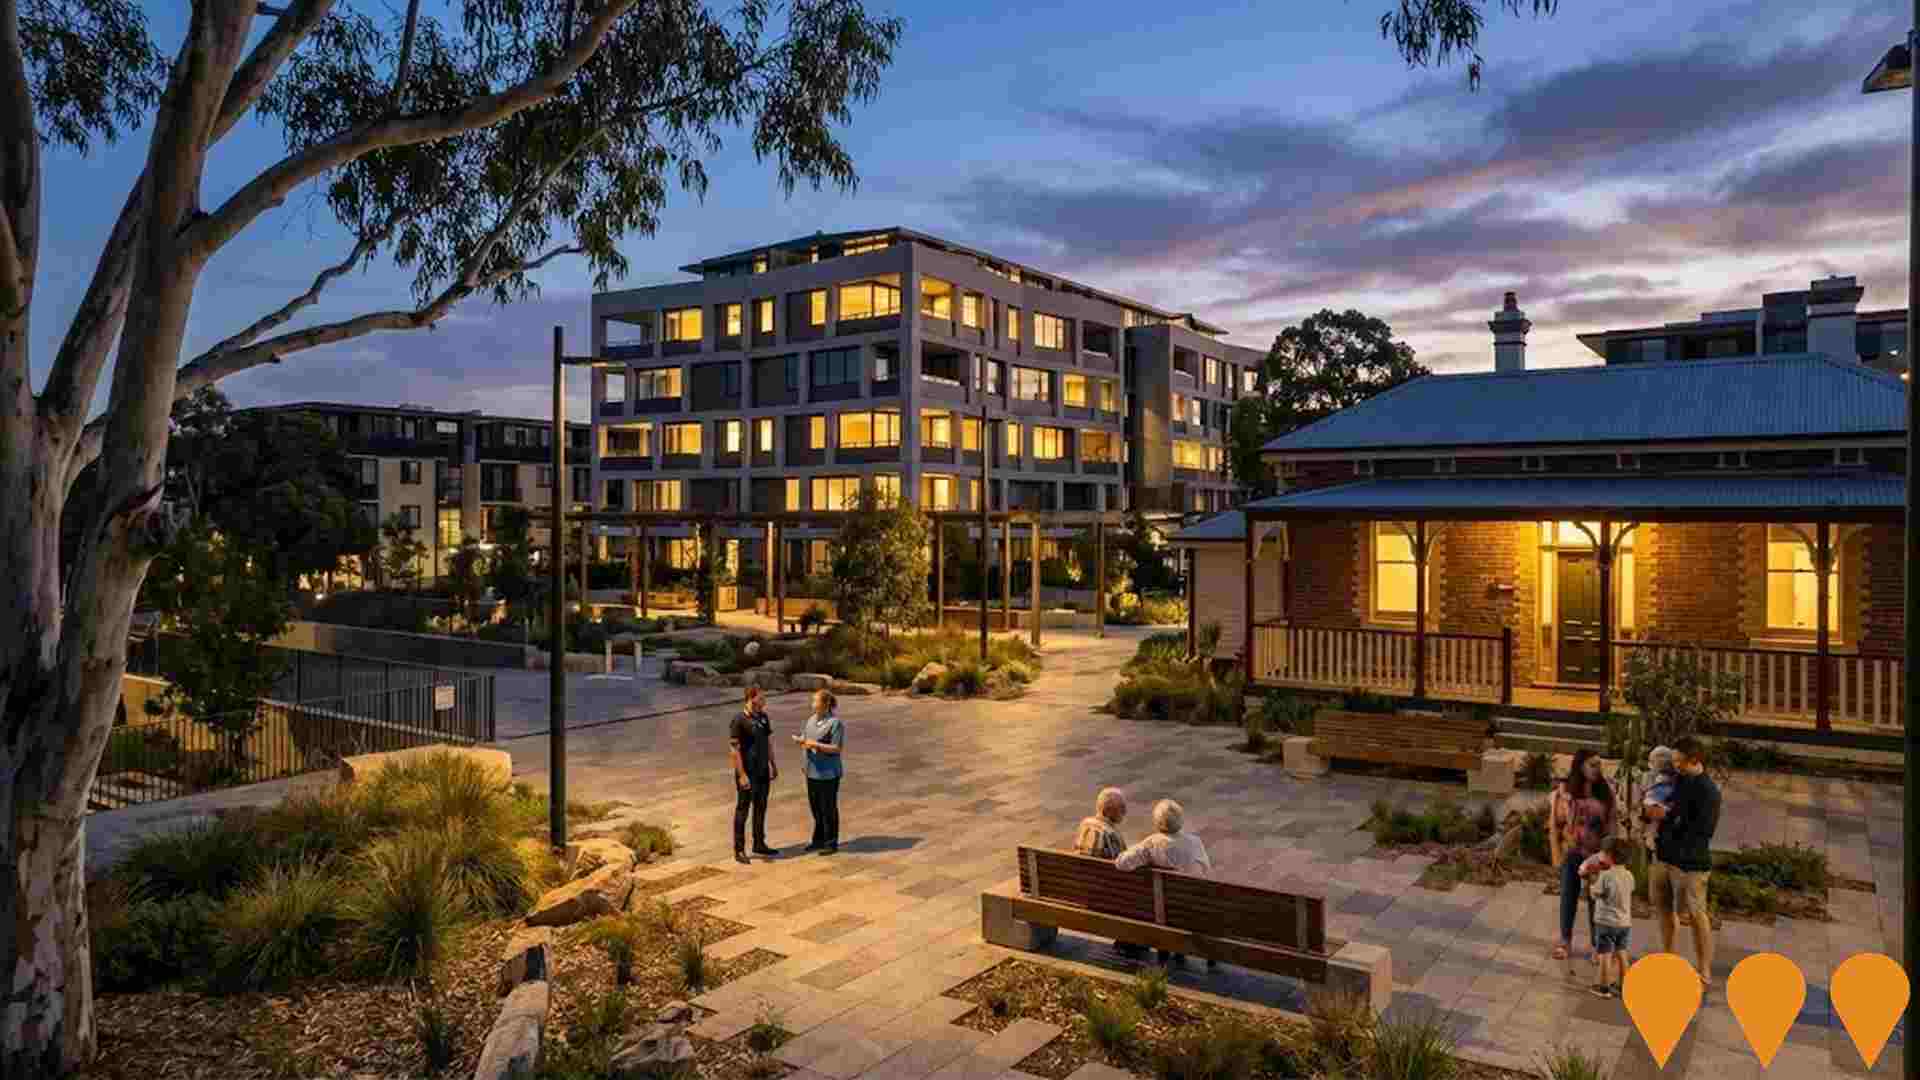
 Denotes AI-based impression for illustrative purposes only, not to be taken as definitive under any circumstances. Please follow links and conduct other investigations from the project's source for actual imagery. Developers and project owners wishing us to use original imagery please Contact Us and we will do so.
Frequently Asked Questions - Infrastructure
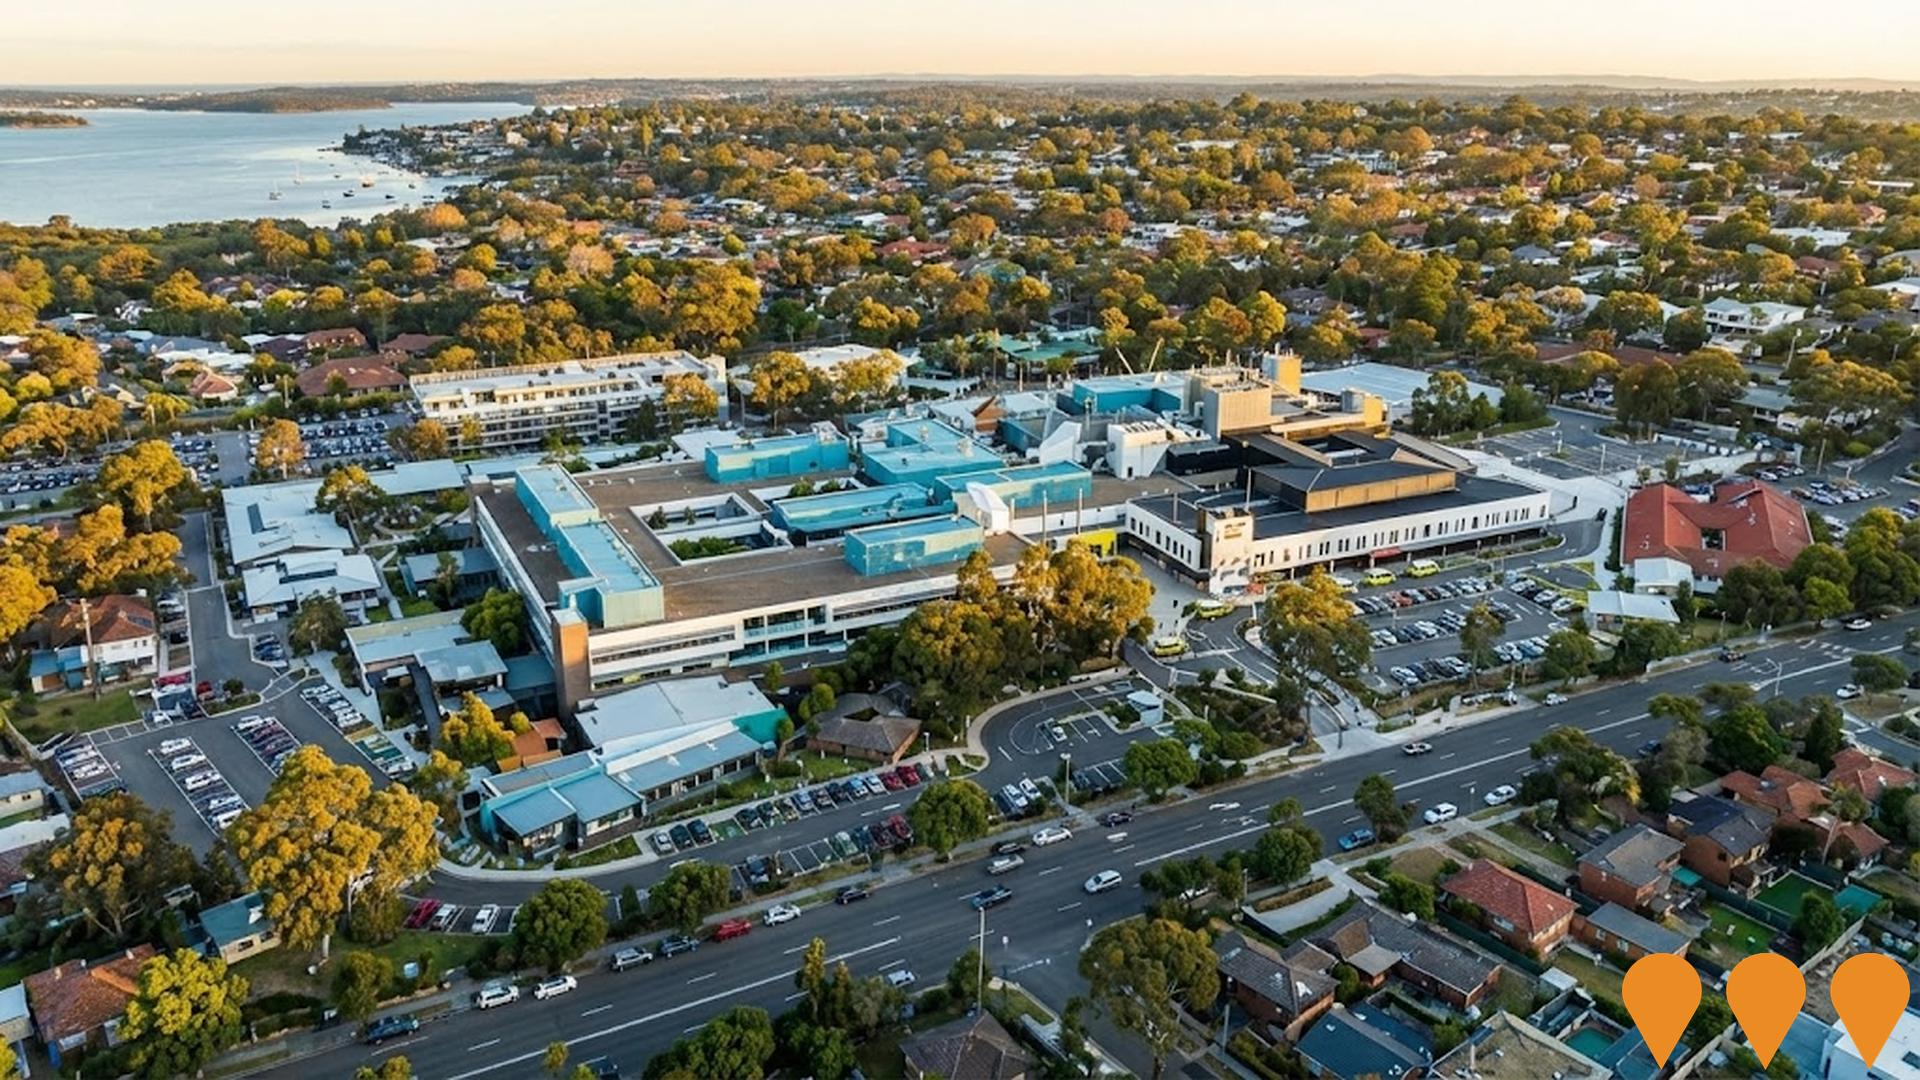
Sutherland Hospital Redevelopment
A $88.5 million expansion and modernisation of Sutherland Hospital, delivering six new operating theatres, a surgical short stay unit, recovery areas, staff amenities, admission/discharge facilities, an MRI facility, a new central sterilising services department, an upgraded emergency department, an intensive care unit, patient accommodation, and supporting infrastructure. Completed in February 2024 as part of NSW Health's infrastructure investment program.
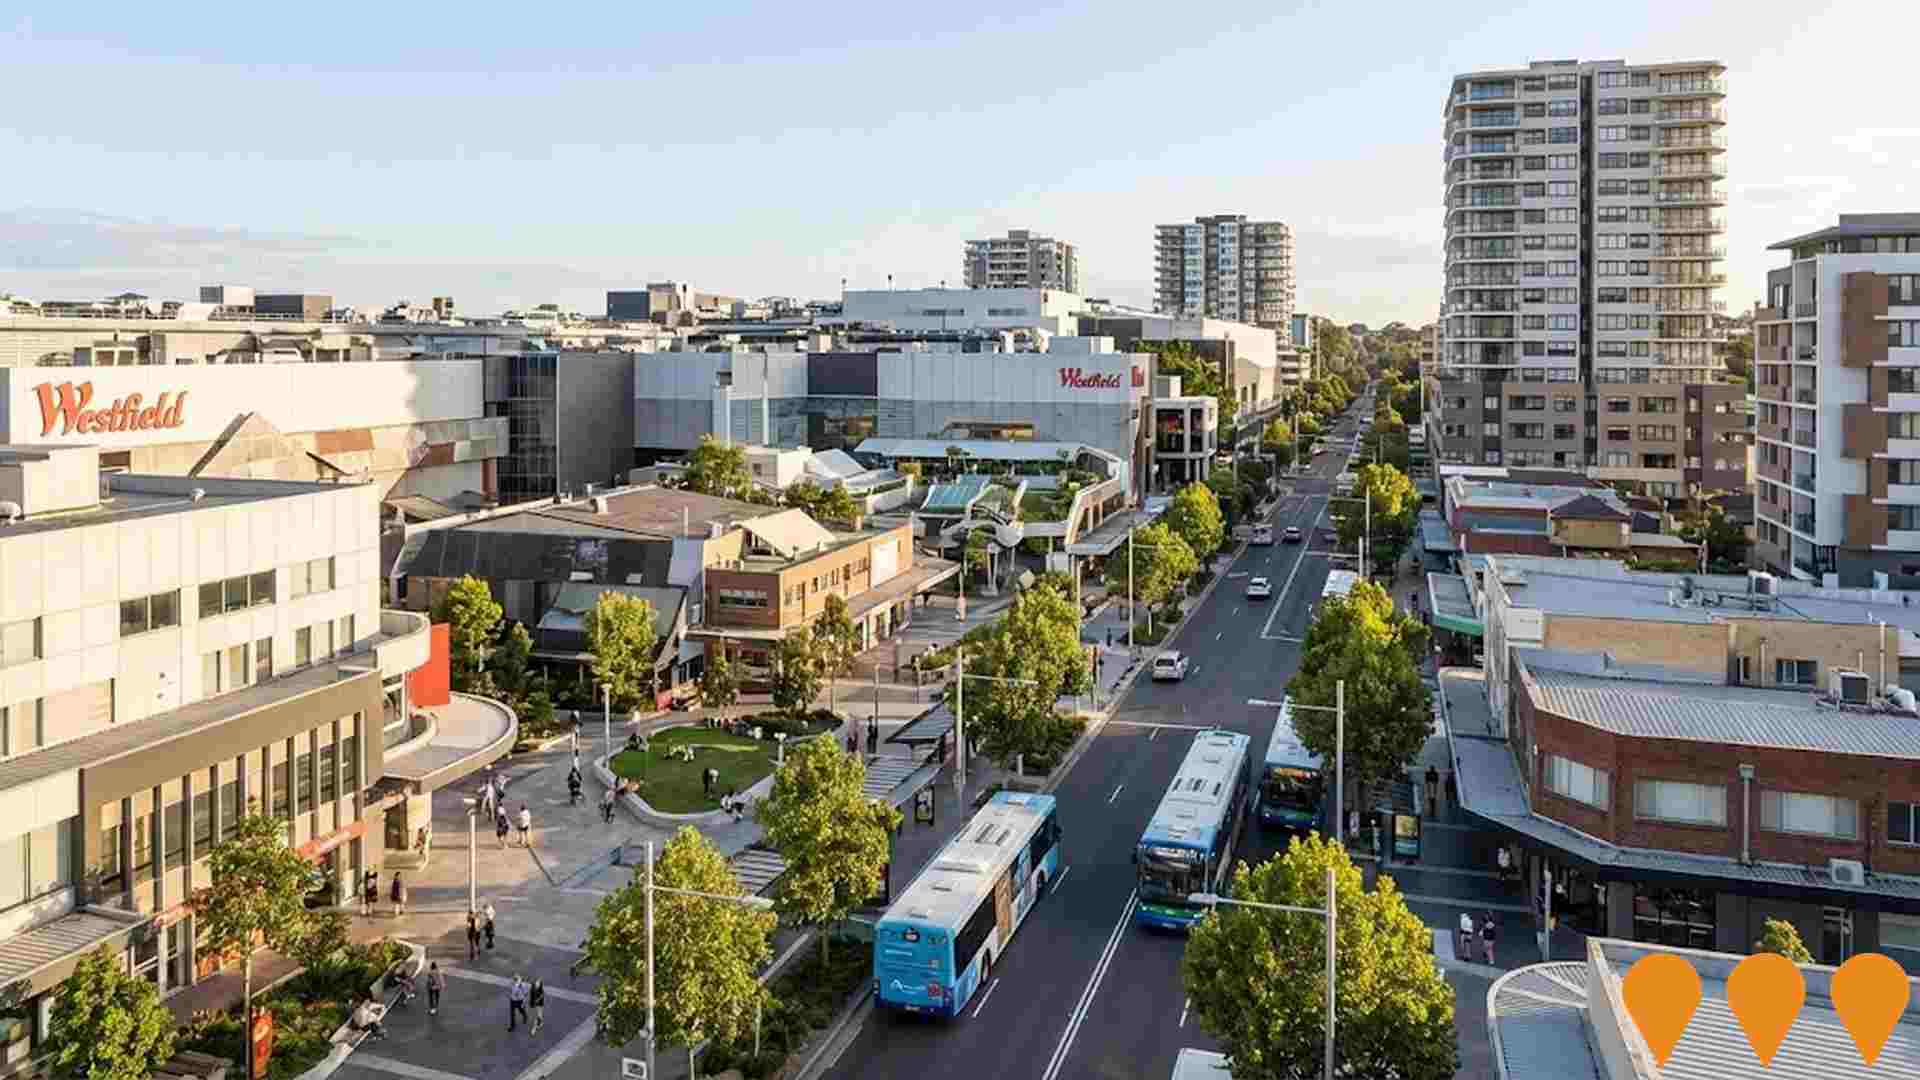
Miranda Centre Place Plan and Public Domain Plan
A strategic planning initiative by Sutherland Shire Council to prepare a 'Place Plan' and 'Public Domain Plan' for Miranda Centre. This work will present a future vision for growth, housing opportunities, and infrastructure investments, and will guide future changes to planning controls (LEP/DCP) to enable increased building height and density in designated areas within and around the commercial centre. It also includes plans for improving public spaces like footpaths, street trees, lighting, and open spaces.
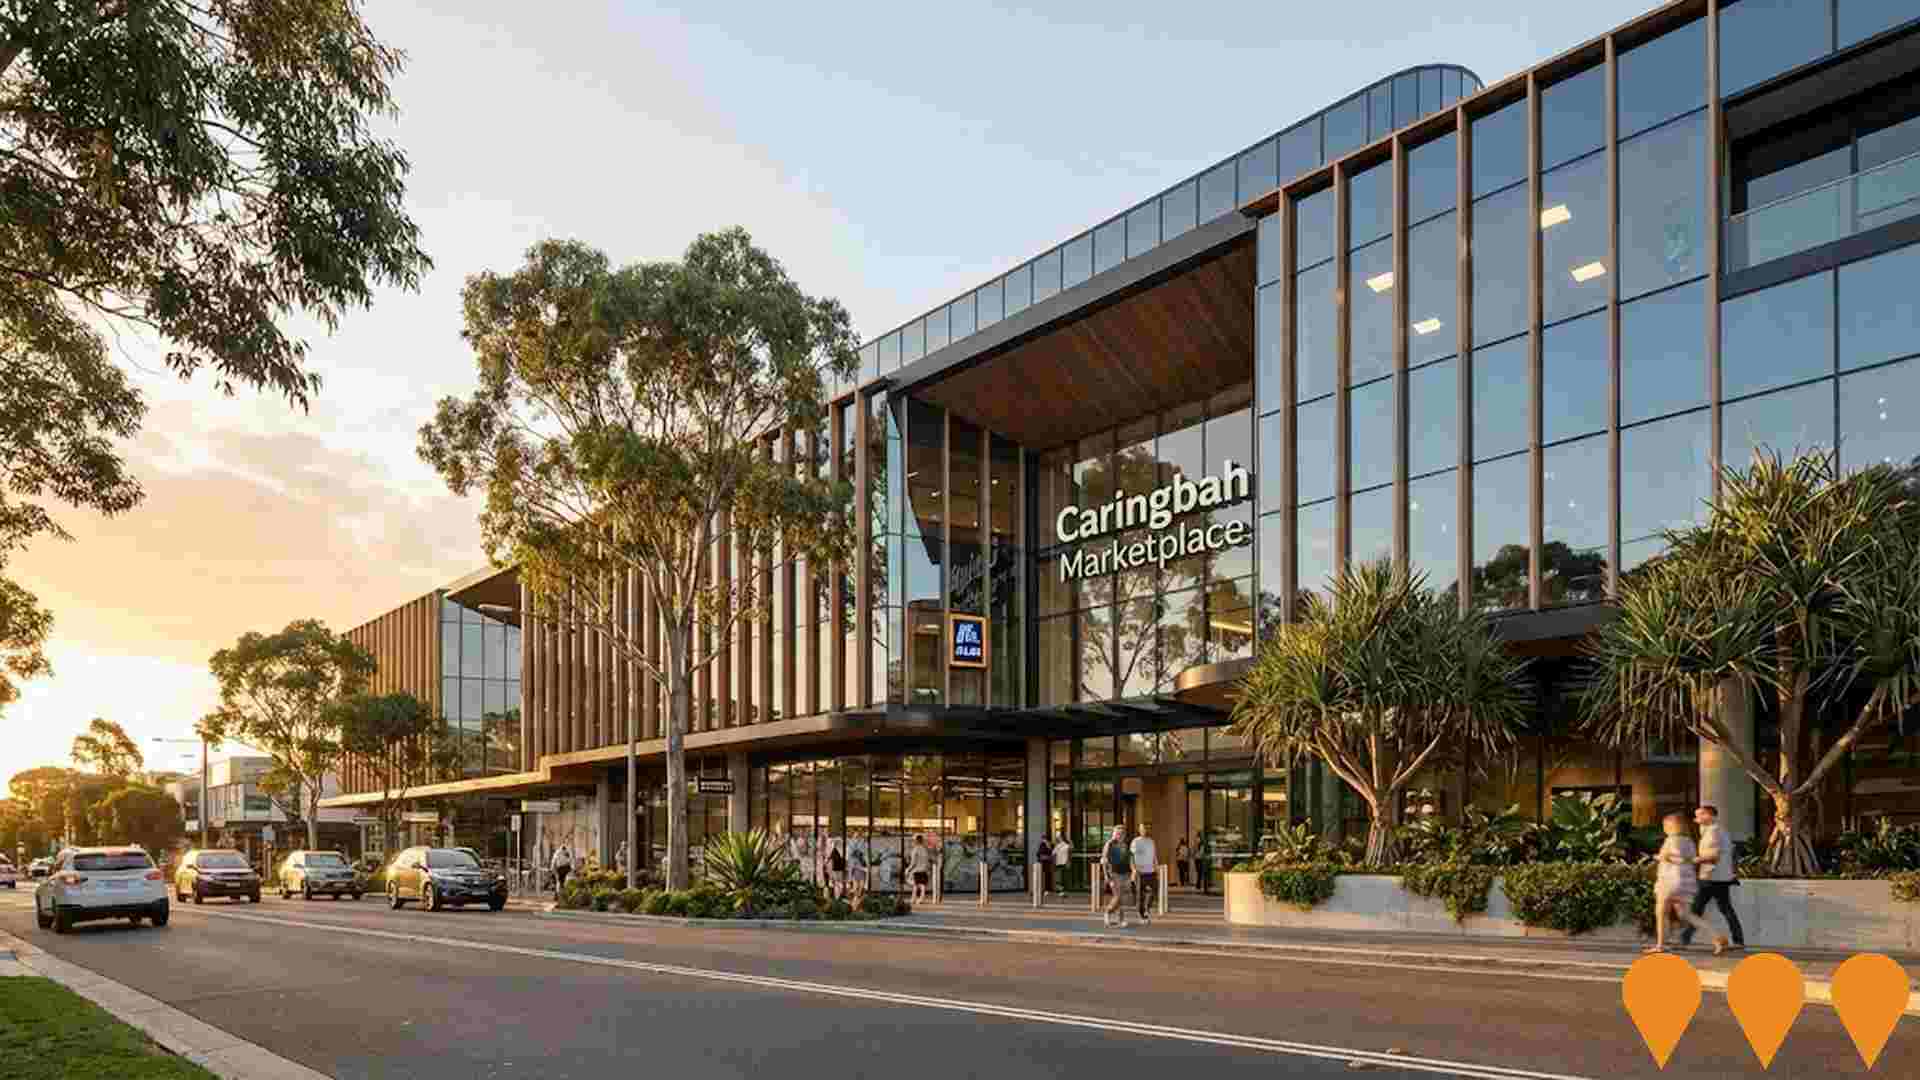
Caringbah Marketplace
Premium mixed-use development site offering up to 5,445 sqm gross floor area anchored by a brand-new 10-year lease to ALDI on a 1,815 sqm E2 Commercial Centre zoned site, strategically located 300m from Caringbah Train Station.
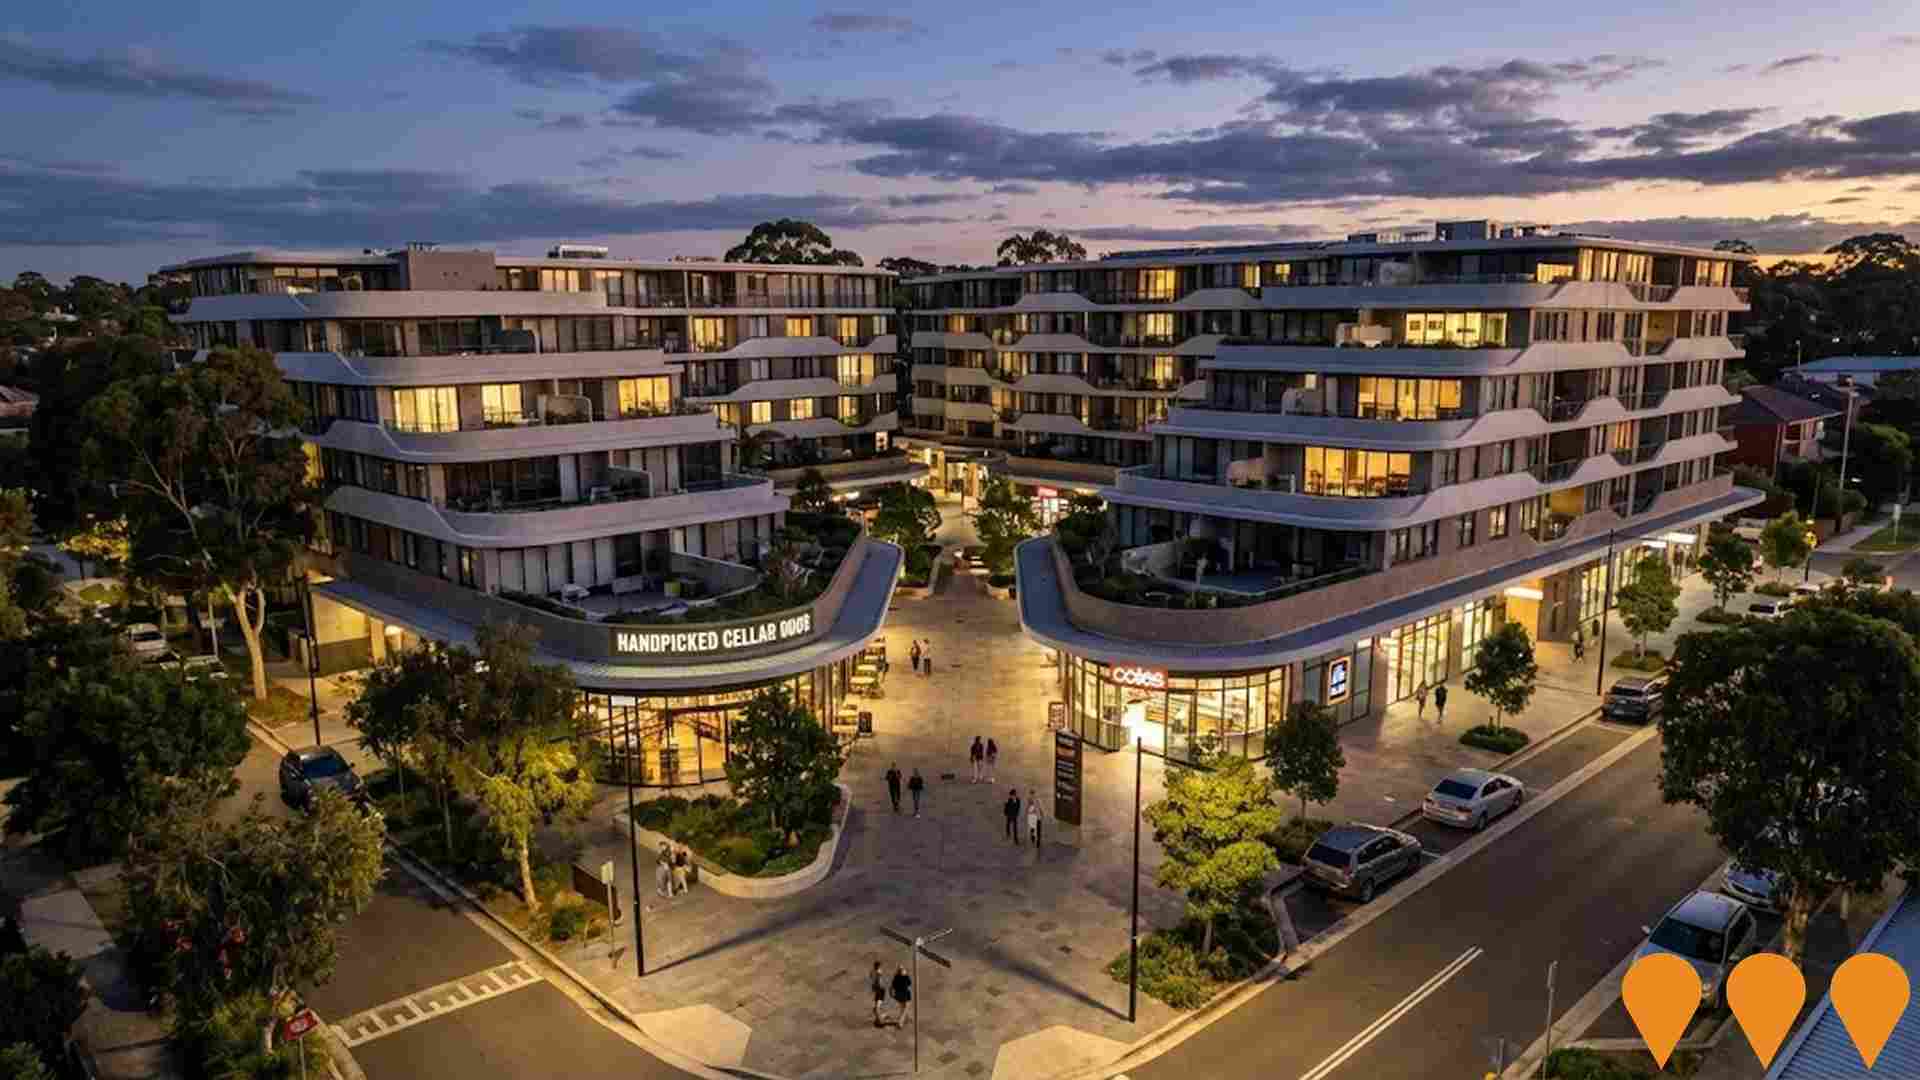
South Village Kirrawee
Mixed-use development with 779 residential apartments and 14,190m2 retail precinct including Coles, ALDI, specialty stores and restaurant precinct. Previously known as the Kirrawee Brick Pit, this dynamic development combines residential, commercial, and public park spaces. Includes new Kirrawee Library PLUS technology-focused community hub with flexible spaces, study areas, and recording facilities.
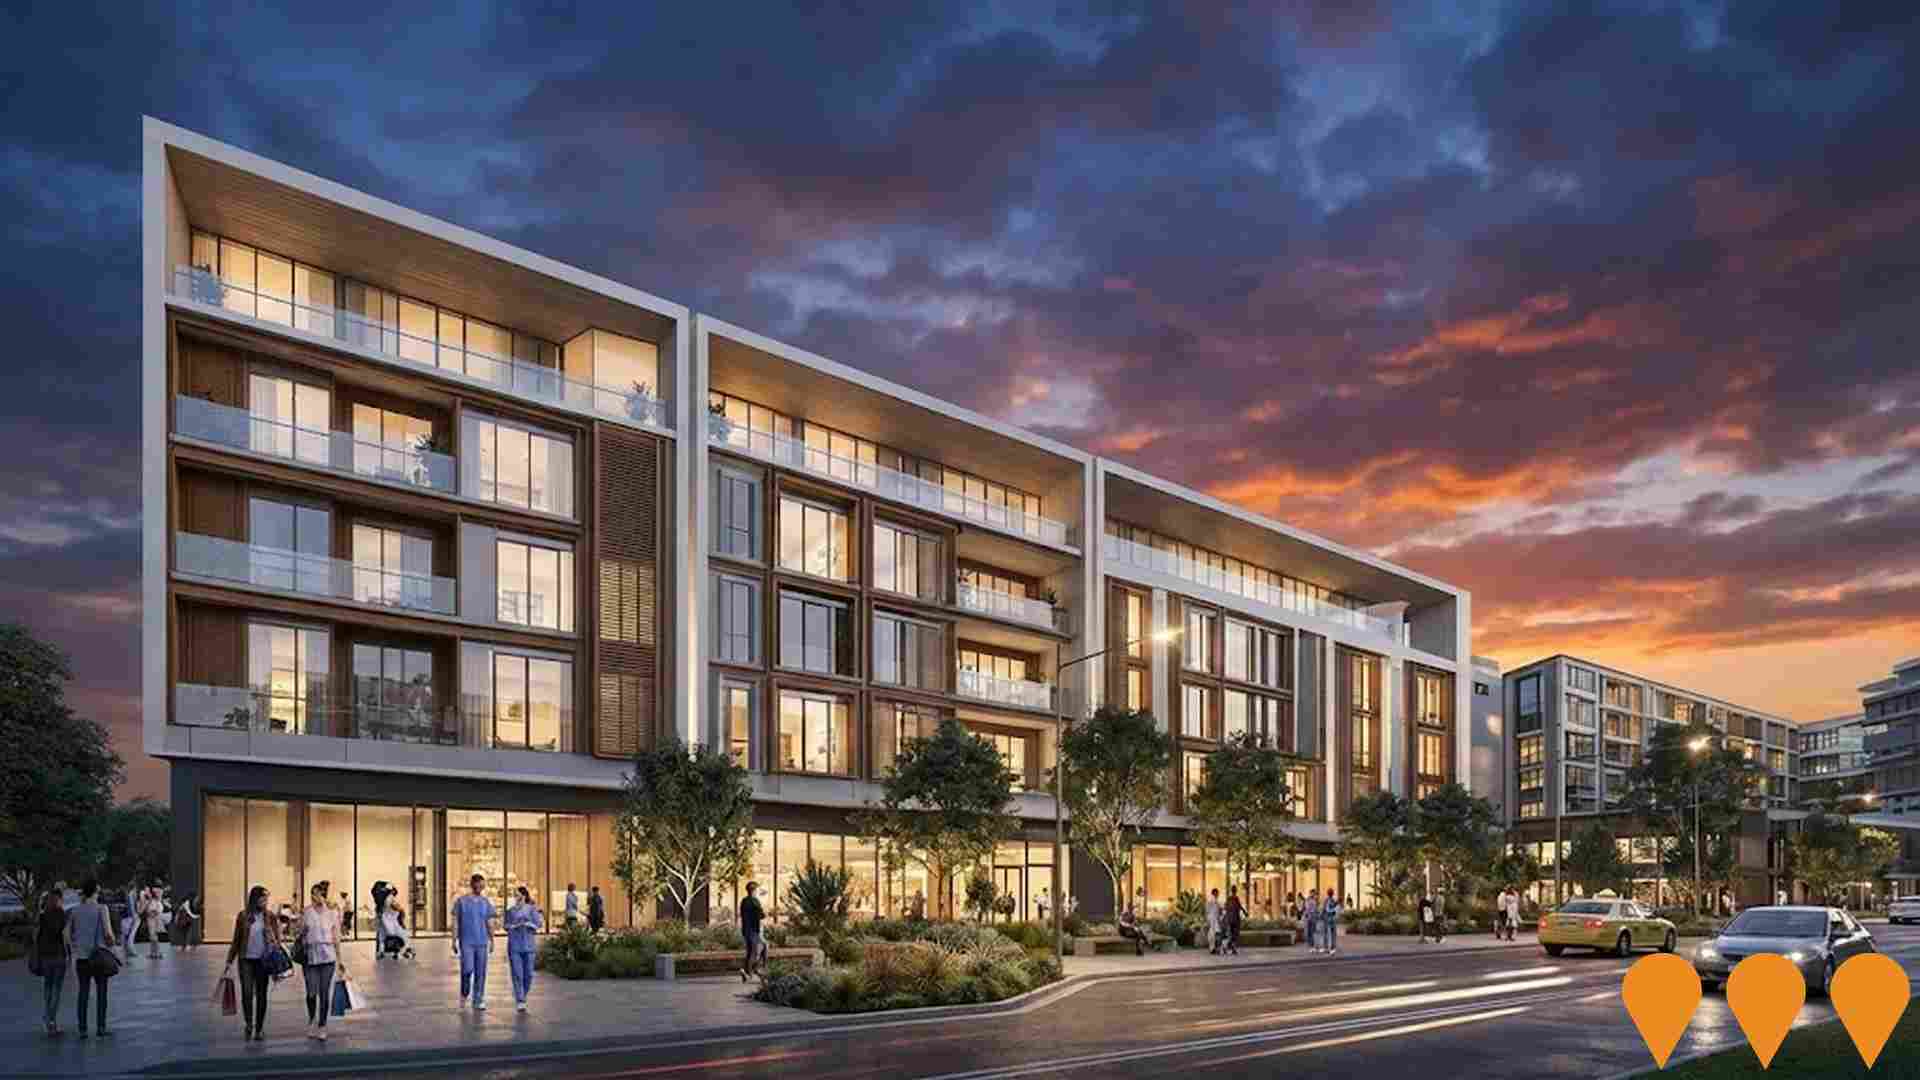
Live Caringbah
Live Caringbah is an approved mixed-use development in the Caringbah Medical Precinct comprising approximately 240 apartments (1-, 2-, and 3-bedroom) across two eight-storey towers, together with a five-storey medical/health facility. Designed with contemporary coastal-inspired architecture by DKO, the project includes rooftop gardens, study/home office spaces, and high-quality resident amenities. Originally proposed as residential-only, the project was approved on appeal by the Land and Environment Court in April 2024 following initial refusals by the planning panel.
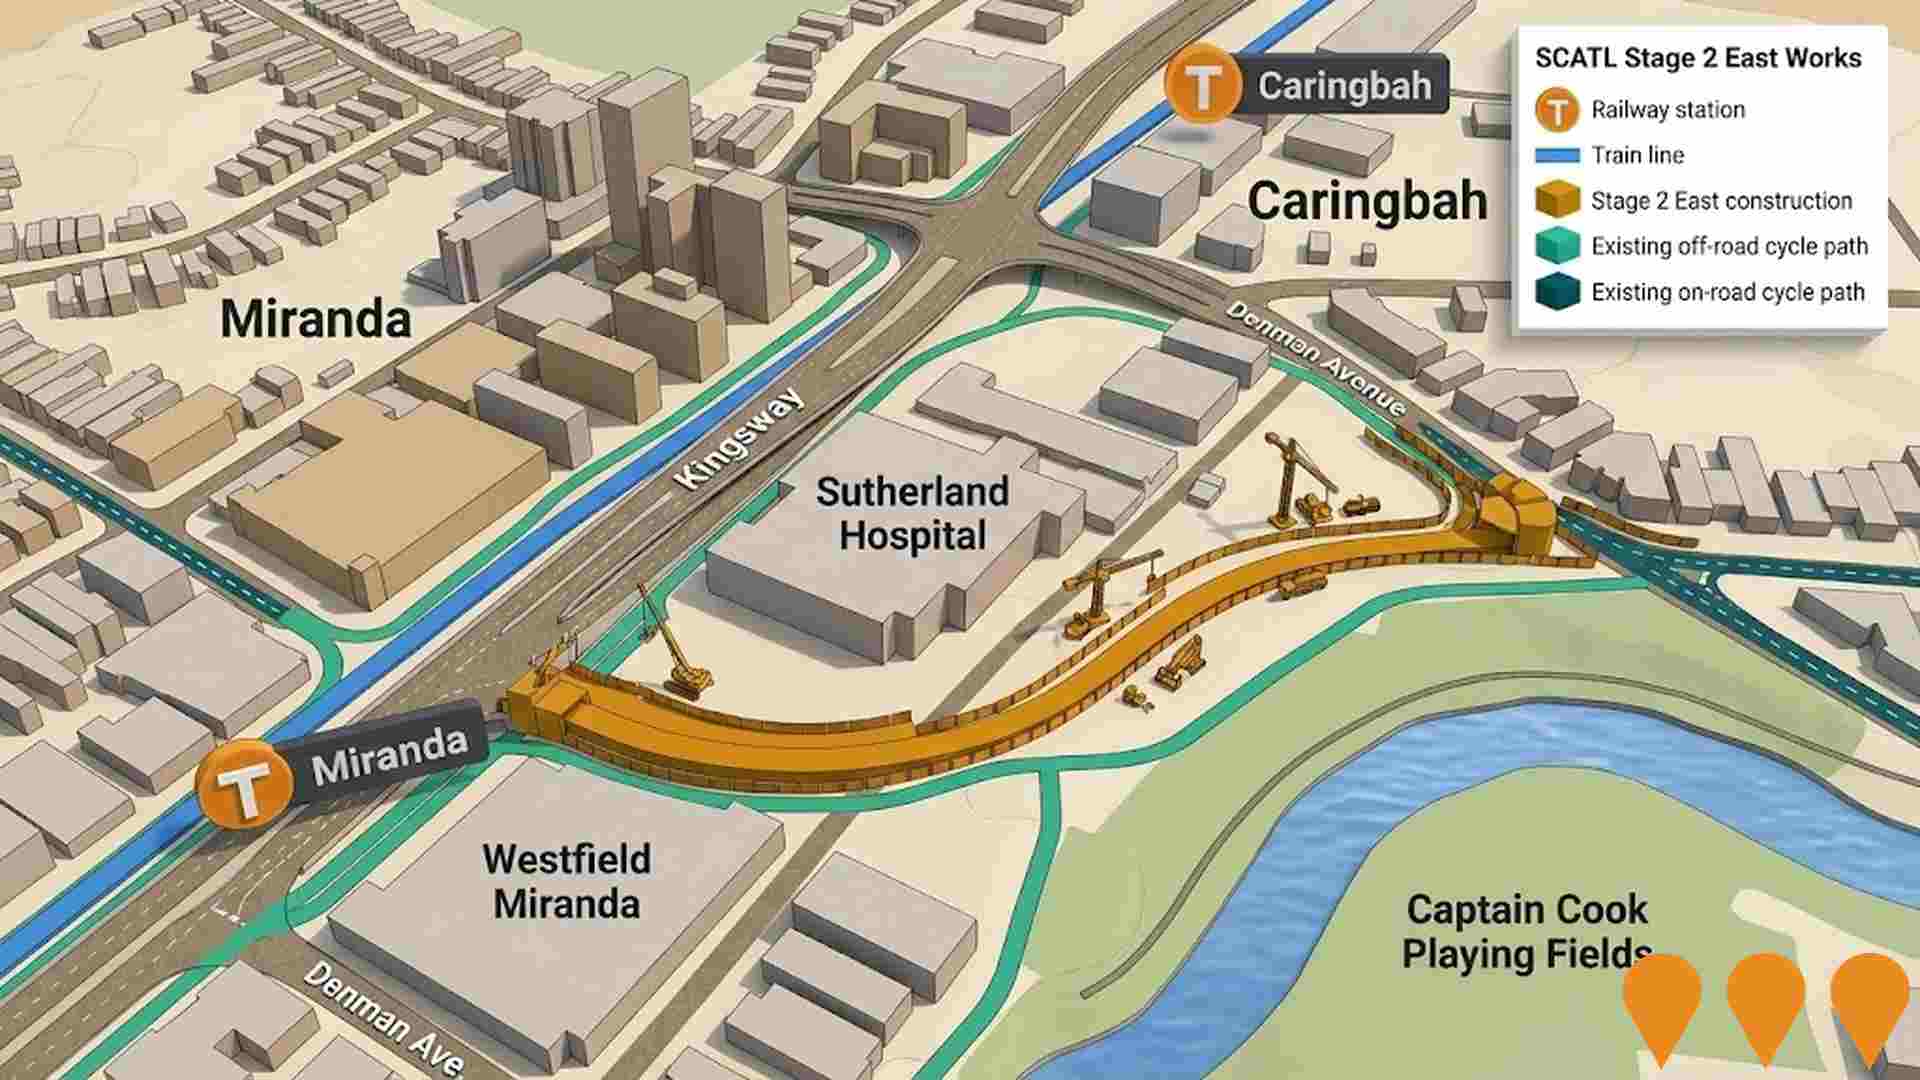
Sutherland to Cronulla Active Transport Link (SCATL)
The Sutherland to Cronulla Active Transport Link (SCATL) is an 11km cycleway and pedestrian path connecting Sutherland to Cronulla, utilizing the rail corridor and various locations. Stage 1 (Sutherland to Kirrawee) and Stage 2 (Kirrawee to Caringbah, including Jackson Avenue, Miranda to Gannons Road, Caringbah) are completed, with Stage 2 finalized in early 2024 using $65M in funding. Stage 3 (Caringbah to Cronulla) is in construction, with a focus on connecting key centers, transport hubs, schools, and business precincts in the Sutherland Shire.
Caringbah Pavilion
A landmark mixed-use lifestyle precinct featuring 188 apartments (including 42 affordable housing units) above a vibrant retail village with a Coles supermarket, Liquorland, and specialty shops. The development comprises two residential towers (10-storey and 6-storey) with resort-style amenities including rooftop gardens, pool, gym, and wellness zones. Designed by CQ Studio, the project delivers 1-4 bedroom residences with premium finishes, engineered timber flooring, and European appliances. Located 200 meters from Caringbah train station, the precinct combines coastal living with urban convenience in the heart of Sutherland Shire.
Frank Vickery Village Seniors Housing Expansion
Expansion of existing seniors housing complex to provide additional independent living units and care facilities. Enhances aged care options in the Sutherland Shire region.
Employment
The exceptional employment performance in Caringbah South places it among Australia's strongest labour markets
Caringbah South has an educated workforce with professional services well-represented. Its unemployment rate is 1.4%, with estimated employment growth of 1.2% in the past year as of September 2025.
There are 7,438 residents employed, and the unemployment rate is 2.8% lower than Greater Sydney's rate of 4.2%. Workforce participation is similar to Greater Sydney at 64.1%. Leading industries include construction, health care & social assistance, and professional & technical services. Construction stands out with an employment share of 1.6 times the regional level, while health care & social assistance has lower representation at 11.5% compared to the regional average of 14.1%.
The area offers limited local employment opportunities based on Census data. Between September 2024 and September 2025, employment levels increased by 1.2%, with labour force growth also at 1.2%, leaving unemployment broadly unchanged. In contrast, Greater Sydney saw employment grow by 2.1% and labour force by 2.4%, with a slight rise in unemployment to 4.2%. Statewide in NSW as of 25-Nov-2025, employment contracted by 0.03% (losing 2,260 jobs), with an unemployment rate of 3.9%, favourable compared to the national rate of 4.3%. National employment forecasts from May-25 project growth of 6.6% over five years and 13.7% over ten years. Applying these projections to Caringbah South's employment mix suggests local employment should increase by 6.8% over five years and 13.6% over ten years, though this is a simplified extrapolation for illustrative purposes only.
Frequently Asked Questions - Employment
Income
Income metrics indicate excellent economic conditions, with the area achieving higher performance than 75% of national locations assessed by AreaSearch
According to AreaSearch's aggregation of ATO data released for financial year 2022, Caringbah South SA2 had a median taxpayer income of $61,329 and an average income of $91,323. Nationally, these figures are high compared to the national median of $56,994 and average of $80,856 in Greater Sydney. Based on Wage Price Index growth from financial year 2022 to September 2025, estimated incomes would be approximately $69,063 (median) and $102,839 (average). As per the 2021 Census, Caringbah South's household, family, and personal incomes rank between the 82nd and 94th percentiles nationally. Income analysis shows that 33.0% of residents earn over $4,000 annually, with a total of 4,475 people in this bracket, differing from regional patterns where the $1,500-$2,999 bracket dominates at 30.9%. Economic strength is evident with 46.2% of households earning over $3,000 weekly, supporting high consumer spending. Housing expenses account for 14.9% of income, and residents rank in the 94th percentile for disposable income. The area's SEIFA income ranking places it in the 9th decile.
Frequently Asked Questions - Income
Housing
Caringbah South is characterized by a predominantly suburban housing profile, with above-average rates of outright home ownership
Caringbah South's dwellings, as per the latest Census, were 76.5% houses and 23.5% other dwellings (semi-detached, apartments, 'other'). Sydney metro had 52.4% houses and 47.6% other dwellings. Home ownership in Caringbah South was 47.5%, with mortgaged dwellings at 40.6% and rented ones at 11.9%. The median monthly mortgage repayment was $3,400, higher than Sydney metro's $2,774. Median weekly rent was $730 compared to Sydney metro's $500. Nationally, Caringbah South's mortgage repayments were significantly higher at $1,863 and rents substantially above the national figure of $375.
Frequently Asked Questions - Housing
Household Composition
Caringbah South features high concentrations of family households, with a higher-than-average median household size
Family households account for 82.0% of all households, including 45.7% that are couples with children, 27.2% that are couples without children, and 8.5% that are single parent families. Non-family households make up the remaining 18.0%, with lone person households at 17.0% and group households comprising 1.0%. The median household size is 2.9 people, larger than the Greater Sydney average of 2.5.
Frequently Asked Questions - Households
Local Schools & Education
Caringbah South shows strong educational performance, ranking in the upper quartile nationally when assessed across multiple qualification and achievement indicators
Caringbah South's educational qualifications trail Greater Sydney's regional benchmarks. 31.1% of residents aged 15+ have university degrees compared to 38.0%. Bachelor degrees are the most common at 22.0%, followed by postgraduate qualifications (6.7%) and graduate diplomas (2.4%). Trade and technical skills are prominent, with 36.8% of residents aged 15+ holding vocational credentials – advanced diplomas (13.7%) and certificates (23.1%).
Educational participation is high, with 29.1% of residents currently enrolled in formal education. This includes 10.1% in primary education, 8.7% in secondary education, and 4.4% pursuing tertiary education.
Frequently Asked Questions - Education
Schools Detail
Nearby Services & Amenities
Transport
Transport servicing is moderate compared to other areas nationally based on assessment of service frequency, route connectivity and accessibility
Caringbah South has 69 active public transport stops, all of which are bus stops. These stops are served by 15 different routes that together facilitate 737 weekly passenger trips. The accessibility of these services is rated as excellent, with residents typically located just 157 meters from the nearest stop.
On average, there are 105 trips per day across all routes, which equates to roughly 10 weekly trips per individual stop.
Frequently Asked Questions - Transport
Transport Stops Detail
Health
Caringbah South's residents are extremely healthy with both young and old age cohorts seeing low prevalence of common health conditions
Analysis of health metrics shows strong performance throughout Caringbah South. Both young and old age cohorts have low prevalence of common health conditions.
The rate of private health cover is exceptionally high at approximately 67% of the total population (9,099 people), compared to the national average of 55.3%. The most common medical conditions in the area are arthritis and asthma, impacting 8.1 and 6.3% of residents respectively. A total of 73.3% of residents declare themselves completely clear of medical ailments, compared to 72.3% across Greater Sydney. As of 2021, 21.3% of residents are aged 65 and over (2,885 people). Health outcomes among seniors are particularly strong, broadly in line with the general population's health profile.
Frequently Asked Questions - Health
Cultural Diversity
Caringbah South ranks below the Australian average when compared to other local markets across a number of language and cultural background related metrics
Caringbah South, as per the 2016 Census, had a population with 84.8% born in Australia, 93.6% being citizens, and 91.5% speaking English only at home. Christianity was the predominant religion, comprising 65.6%. This was higher than Greater Sydney's 61.2%.
The top three ancestry groups were English (29.6%), Australian (27.2%), and Irish (9.6%). Notably, Croatian (1.0% vs regional 0.7%), Maltese (1.1% vs 0.9%), and Greek (2.7% vs 3.2%) were overrepresented compared to the regional averages.
Frequently Asked Questions - Diversity
Age
Caringbah South's median age exceeds the national pattern
The median age in Caringbah South is 42 years, which is significantly higher than Greater Sydney's average of 37 years and Australia's average of 38 years. The 65-74 age group constitutes 10.8% of the population compared to Greater Sydney, while the 25-34 cohort makes up 7.6%. According to data from the post-2021 Census, the 75 to 84 age group has increased from 5.9% to 7.0%, whereas the 55 to 64 cohort has decreased from 13.0% to 11.8% and the 25 to 34 group has dropped from 8.7% to 7.6%. Population forecasts for 2041 indicate substantial demographic changes in Caringbah South, with the 85+ age group expected to grow by 125%, reaching 1,057 people from 470. Notably, the combined 65+ age groups will account for 77% of total population growth, reflecting the area's aging demographic profile. Conversely, the 25-34 and 0-4 age cohorts are expected to experience population declines.
