Chart Color Schemes
This analysis uses ABS Statistical Areas Level 2 (SA2) boundaries, which can materially differ from Suburbs and Localities (SAL) even when sharing similar names.
SA2 boundaries are defined by the Australian Bureau of Statistics and are designed to represent communities for statistical reporting (e.g., census and ERP).
Suburbs and Localities (SAL) represent commonly-used suburb/locality names (postal-style areas) and may use different geographic boundaries. For comprehensive analysis, consider reviewing both boundary types if available.
est. as @ -- *
ABS ERP | -- people | --
2021 Census | -- people
Sales Activity
Curious about local property values? Filter the chart to assess the volume and appreciation (including resales) trends and regional comparisons, or scroll to the map below view this information at an individual property level.
Find a Recent Sale
Sales Detail
Population
Population growth drivers in Woolooware - Burraneer are strong compared to national averages based on AreaSearch's ranking of recent, and medium to long-term trends
Woolooware-Burraneer's population, as of November 2025, is approximately 10,086. This figure represents a growth of 1,139 people since the 2021 Census, which recorded a population of 8,947. The increase is inferred from the estimated resident population of 9,535 in June 2024 and an additional 340 validated new addresses post-Census. This results in a population density of 3,028 persons per square kilometer, placing Woolooware-Burraneer in the upper quartile nationally according to AreaSearch's assessments. The area's growth rate of 12.7% since the 2021 Census exceeds both its SA4 region (4.1%) and SA3 area, indicating it as a regional growth leader. Overseas migration contributed approximately 40.9% of overall population gains recently, with all drivers including natural growth and interstate migration being positive factors.
AreaSearch uses ABS/Geoscience Australia projections for each SA2 area, released in 2024 with a base year of 2022. For areas not covered by this data, NSW State Government's SA2 level projections from 2022 using a 2021 base year are utilized. Growth rates by age group from these aggregations are applied to all areas for years 2032 to 2041. By 2041, Woolooware-Burraneer's population is projected to increase by 2,397 persons, reflecting an 18.3% total rise over the 17-year period based on the latest annual ERP population numbers.
Frequently Asked Questions - Population
Development
AreaSearch assessment of residential development activity positions Woolooware - Burraneer among the top 25% of areas assessed nationwide
Woolooware-Burraneer has recorded approximately 103 residential properties granted approval annually. Over the past five financial years, from FY21 to FY25518 homes were approved, with a further 31 approved so far in FY26. On average, around two people have been moving to the area for each dwelling built over these five years, indicating balanced supply and demand conditions. However, recent data suggests this has intensified to five people per dwelling over the past two financial years, potentially indicating growing popularity and undersupply concerns.
New properties are constructed at an average expected construction cost value of $266,000, below the regional average, offering more affordable housing options for buyers. In terms of commercial development, Woolooware-Burraneer has recorded $185.9 million in approvals this financial year, demonstrating strong commercial development momentum. Compared to Greater Sydney, the area has 73.0% more building activity per person, providing buyers with greater choice. However, building activity has slowed in recent years. This high level of activity is substantially higher than the national average, suggesting strong developer confidence in the location. New building activity in Woolooware-Burraneer shows a shift towards higher-density living, with 20.0% detached dwellings and 80.0% townhouses or apartments. This marks a significant departure from existing housing patterns, which are currently 60.0% houses.
This change may be due to diminishing developable land availability and evolving lifestyle preferences, as well as housing affordability needs. Woolooware-Burraneer reflects a transitioning market with around 215 people per approval. Population forecasts indicate the area will gain approximately 1,846 residents by 2041. With current construction levels, housing supply should adequately meet demand, creating favourable conditions for buyers while potentially enabling growth that exceeds current forecasts.
Frequently Asked Questions - Development
Infrastructure
Woolooware - Burraneer has very high levels of nearby infrastructure activity, ranking in the top 20% nationally
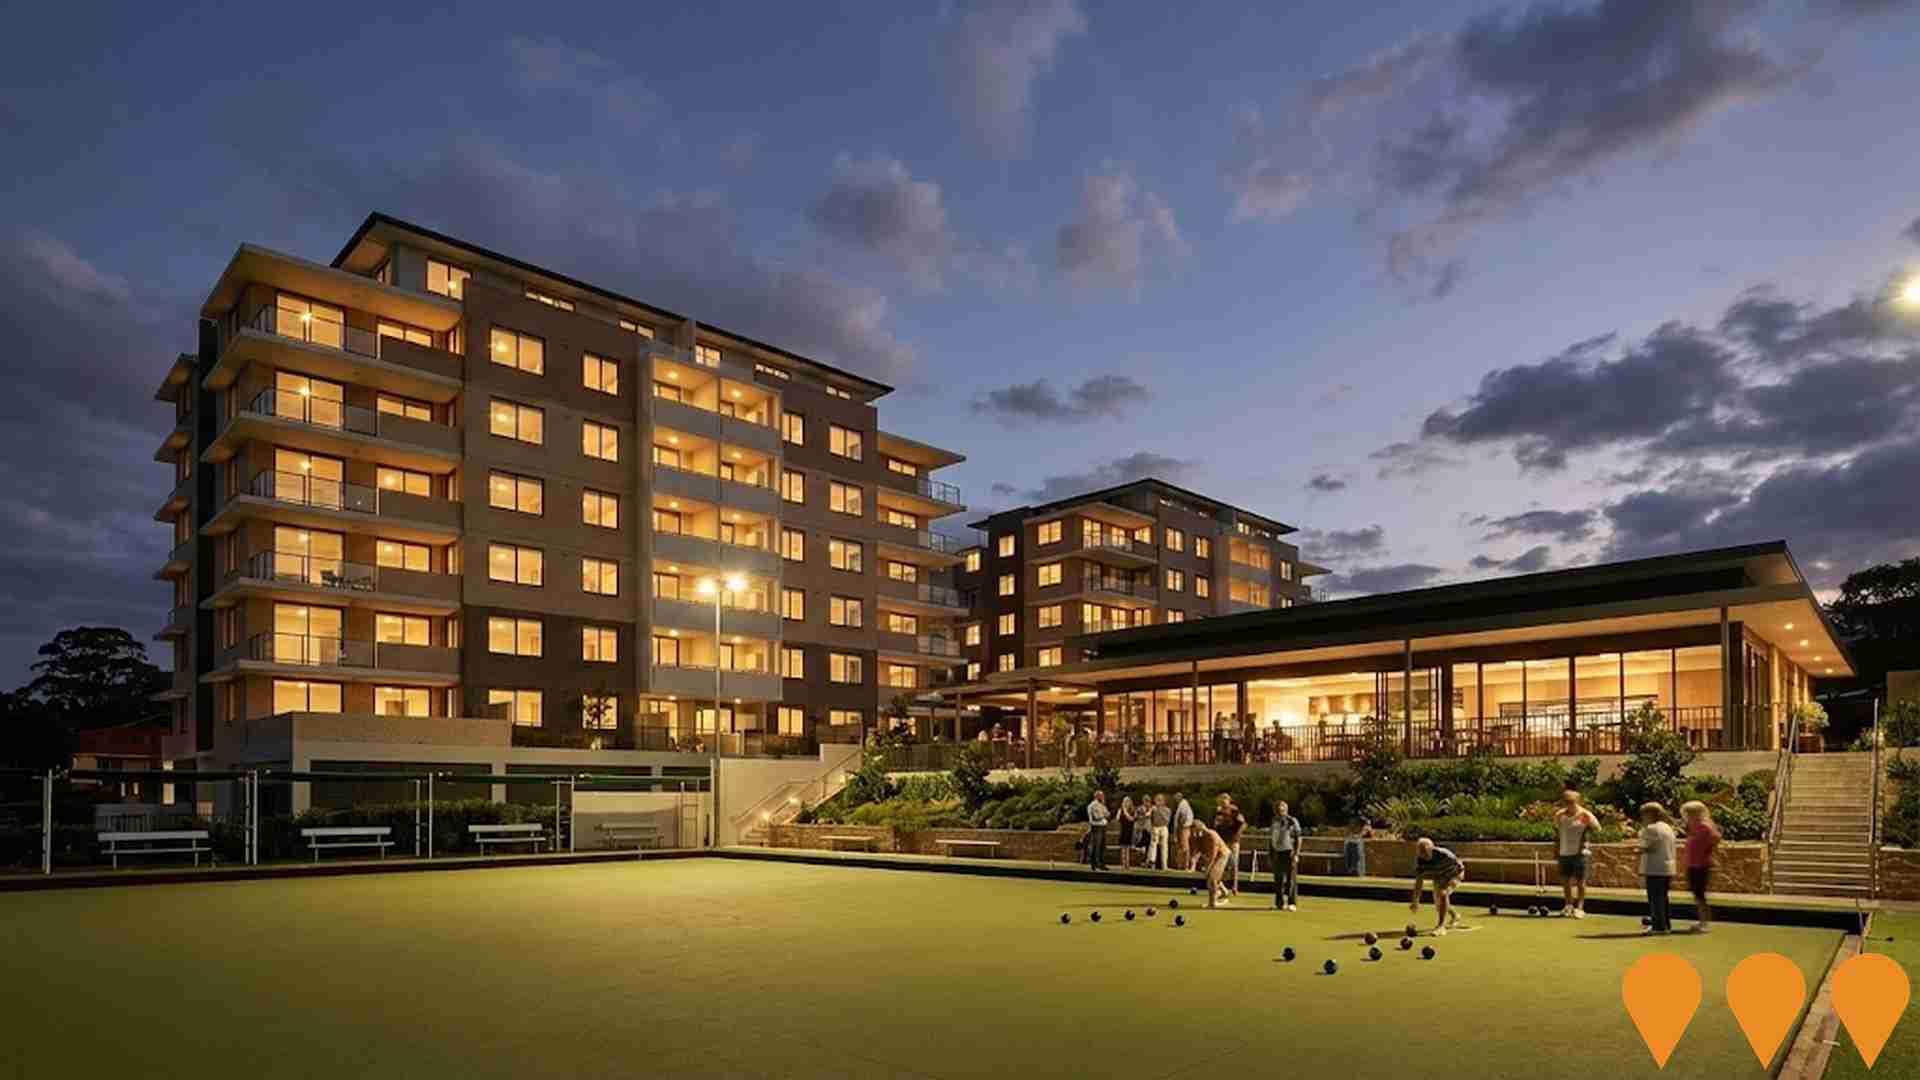
Changes in local infrastructure significantly affect an area's performance. AreaSearch has identified 21 projects that could impact the area. Notable ones include St Aloysius College Cronulla Expansion, VUE Cronulla, Woolooware Bay Town Centre, and Caringbah Pavilion. The following list details those most likely to be relevant.
Professional plan users can use the search below to filter and access additional projects.
INFRASTRUCTURE SEARCH
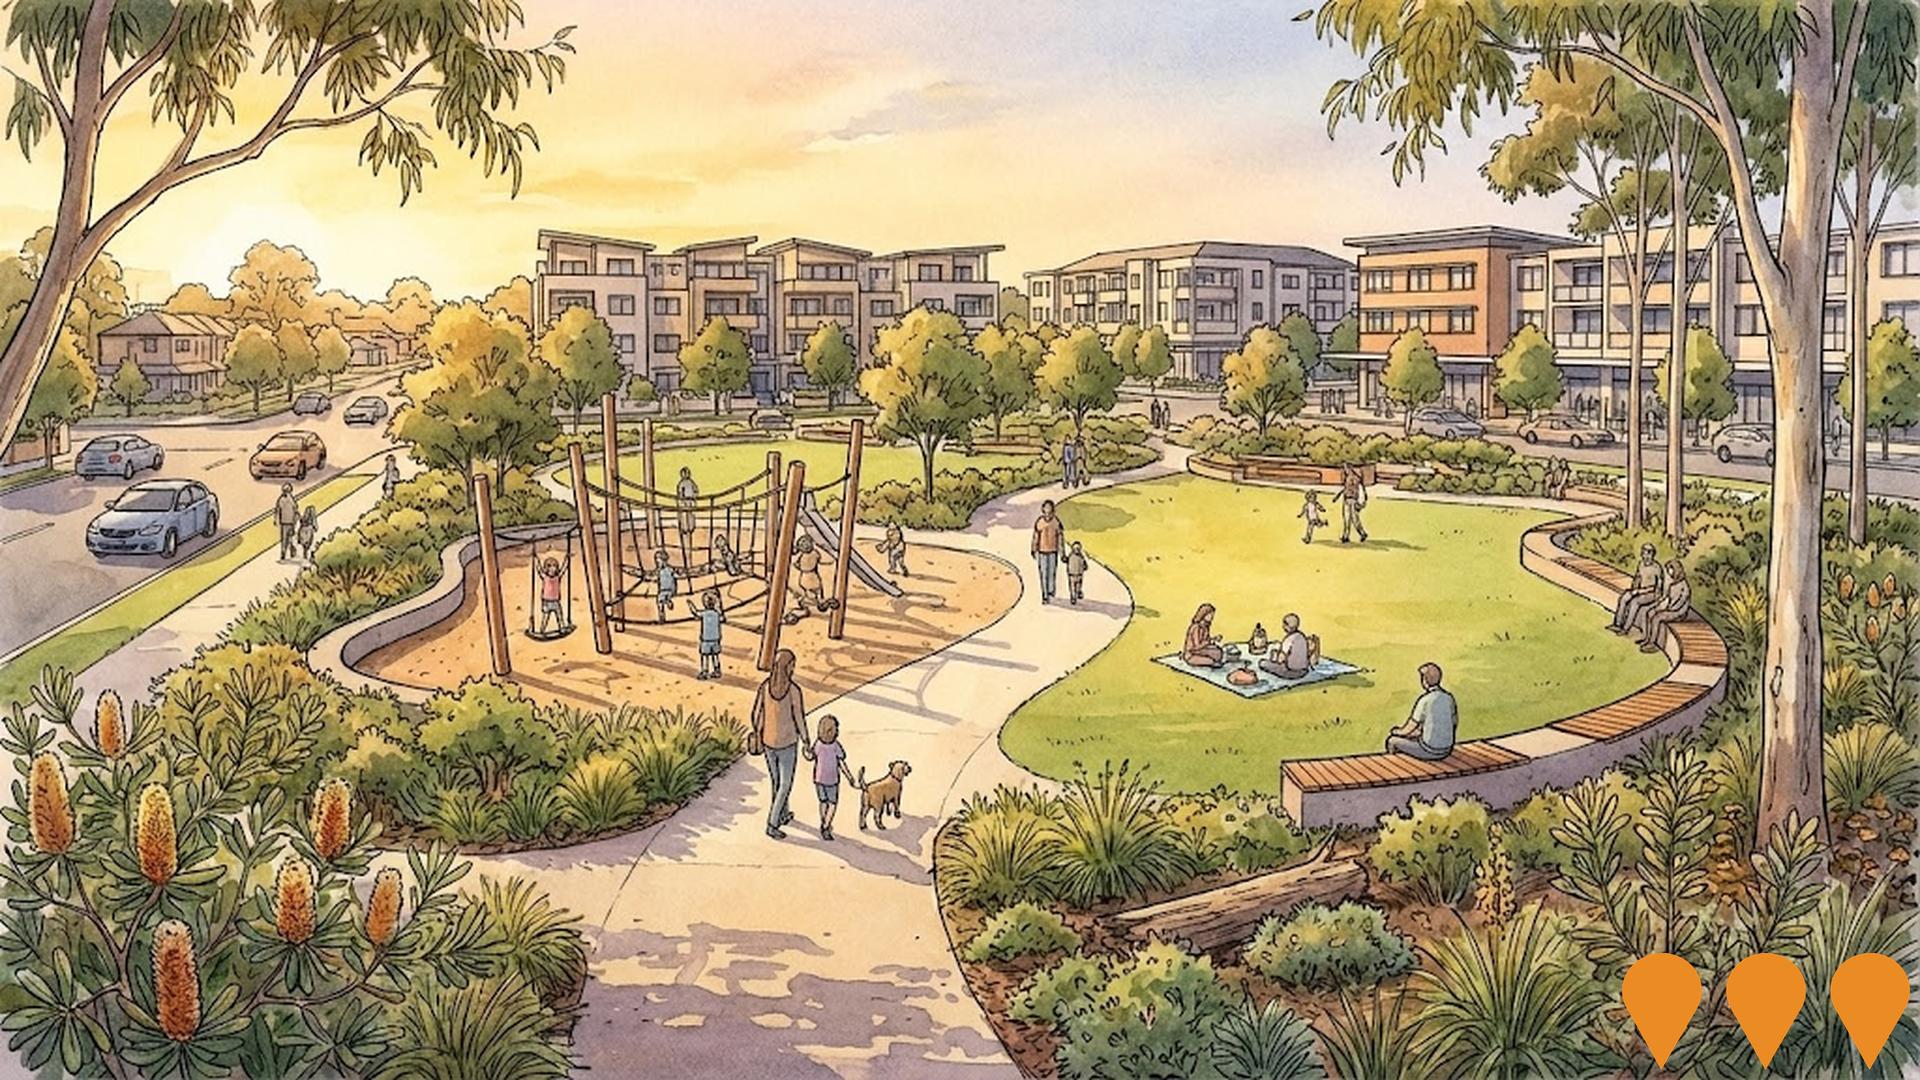
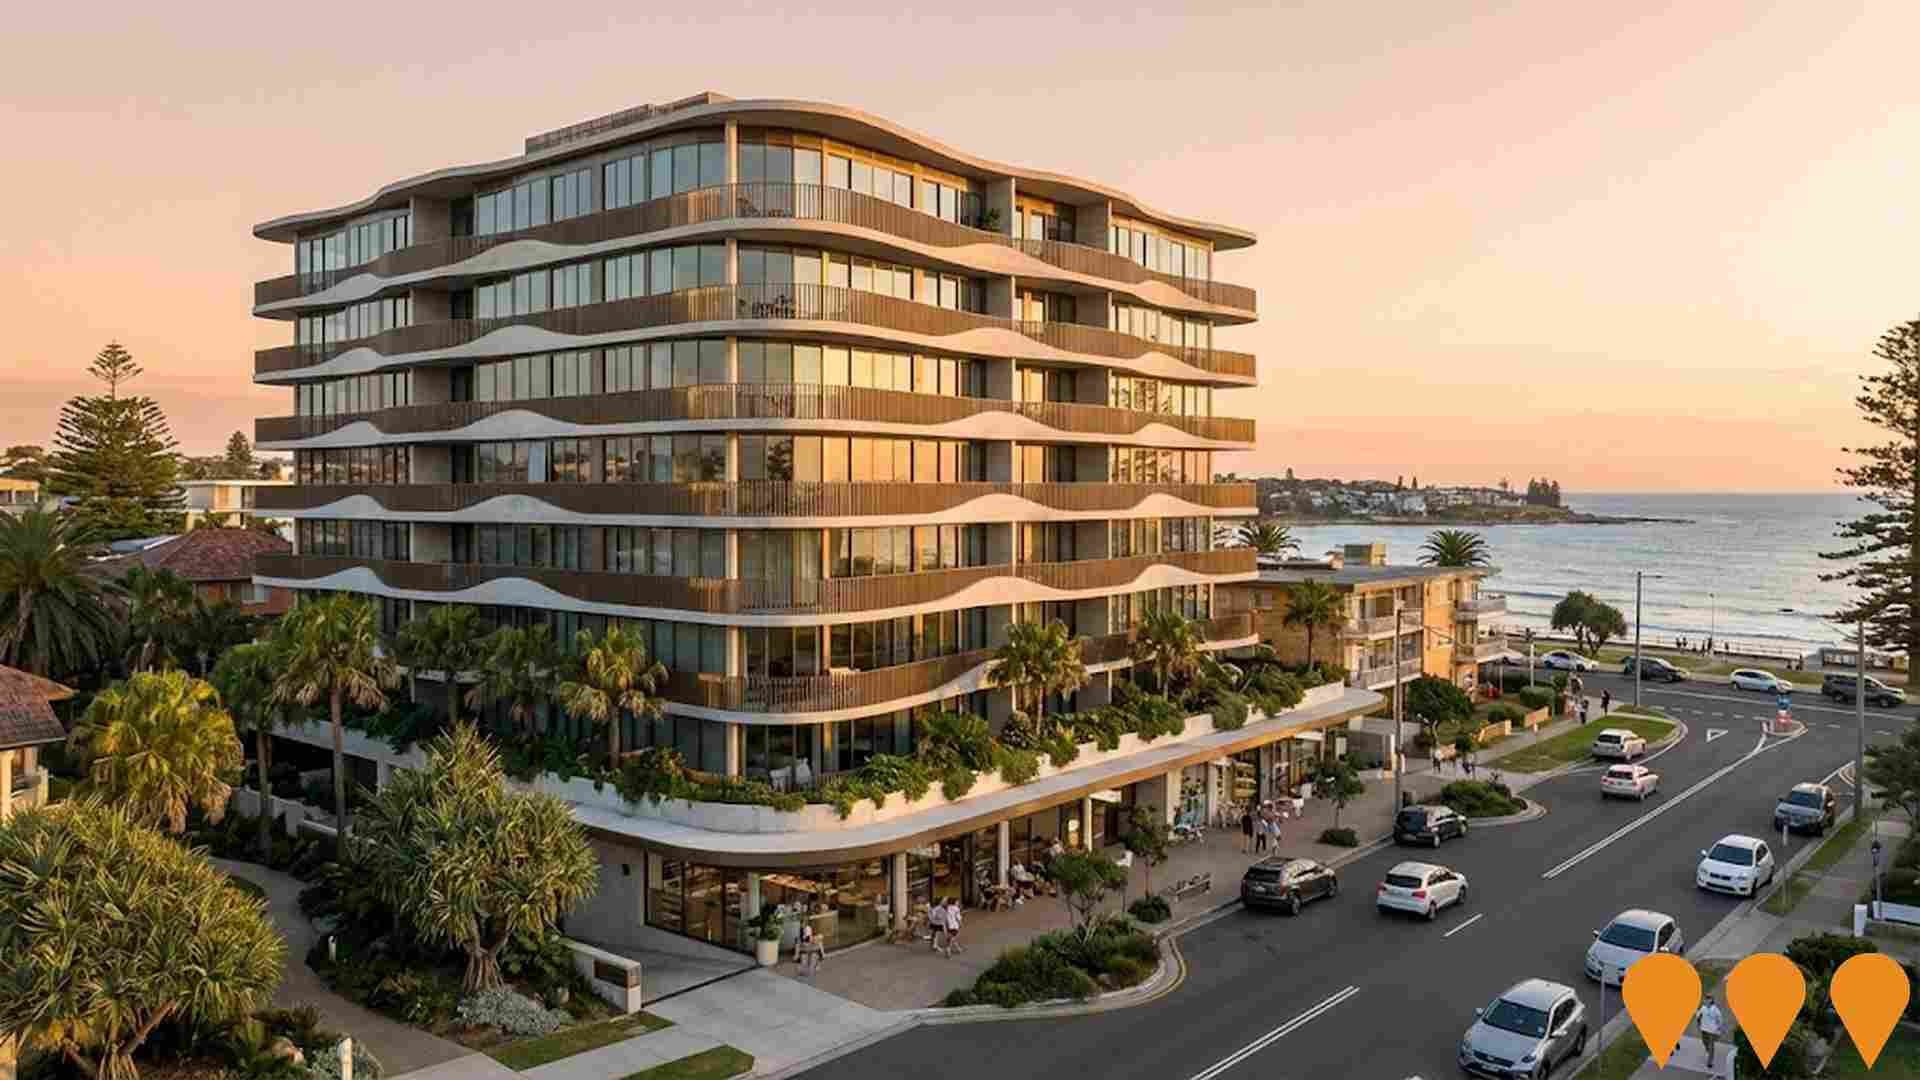
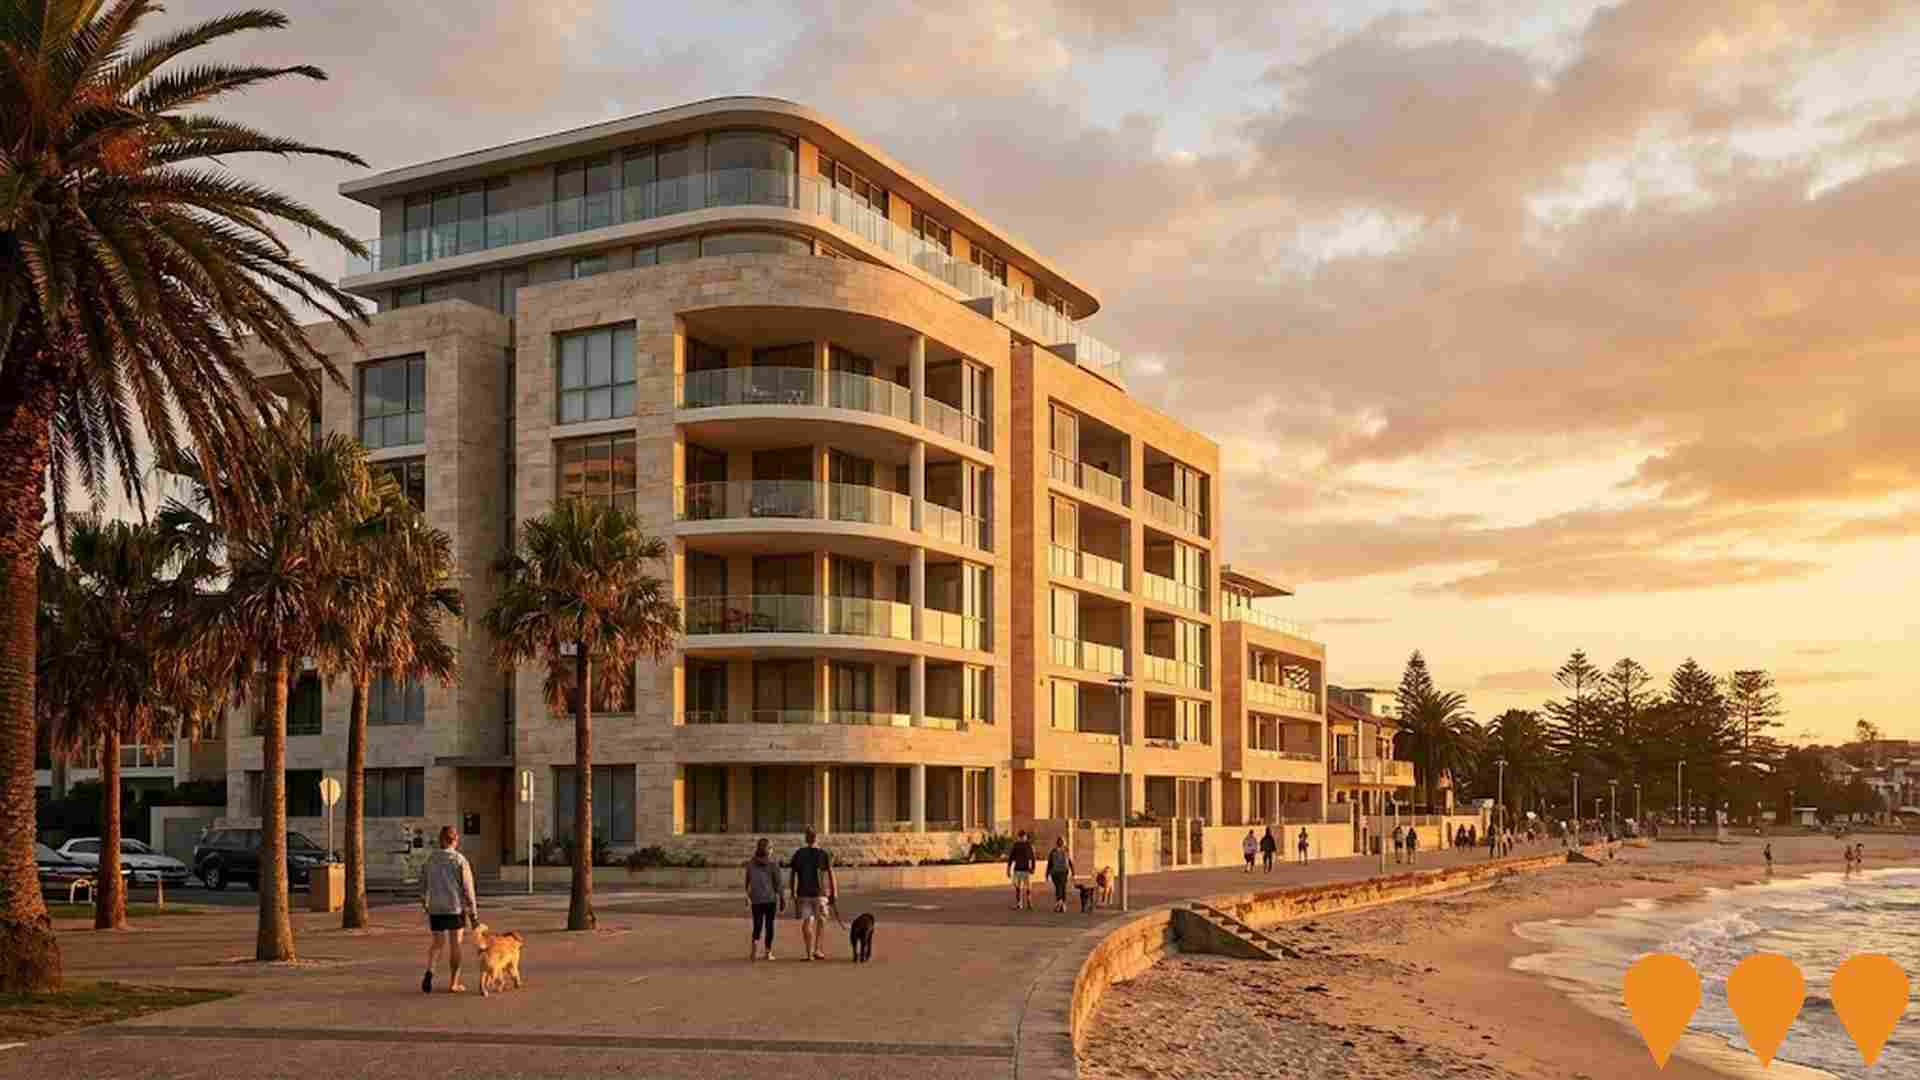
 Denotes AI-based impression for illustrative purposes only, not to be taken as definitive under any circumstances. Please follow links and conduct other investigations from the project's source for actual imagery. Developers and project owners wishing us to use original imagery please Contact Us and we will do so.
Frequently Asked Questions - Infrastructure
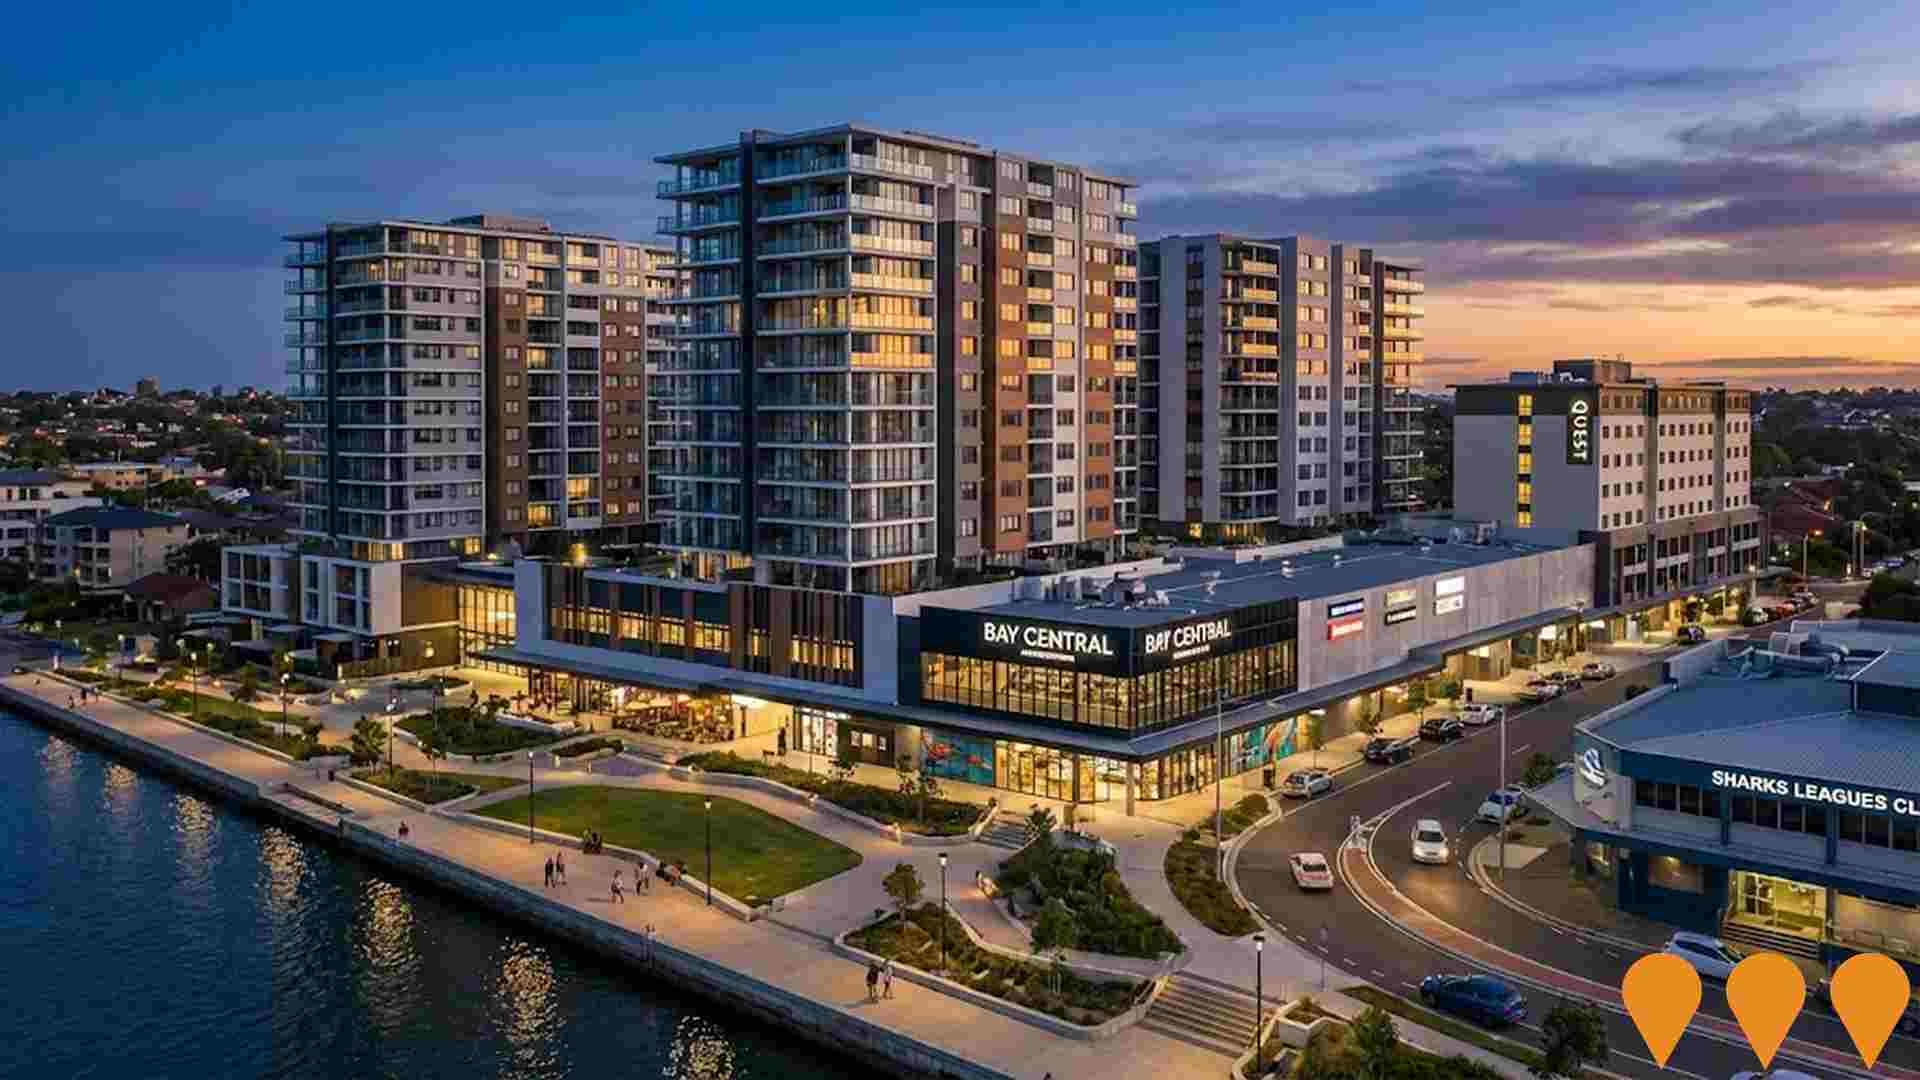
Woolooware Bay Town Centre
A major mixed-use development delivered in four stages, culminating in a waterfront precinct. The project includes approximately 898 apartments, the 18,000sqm Bay Central retail centre, a 71-key Quest Hotel, a refurbished Sharks Leagues Club, and extensive community facilities. The final stage was completed in 2024.
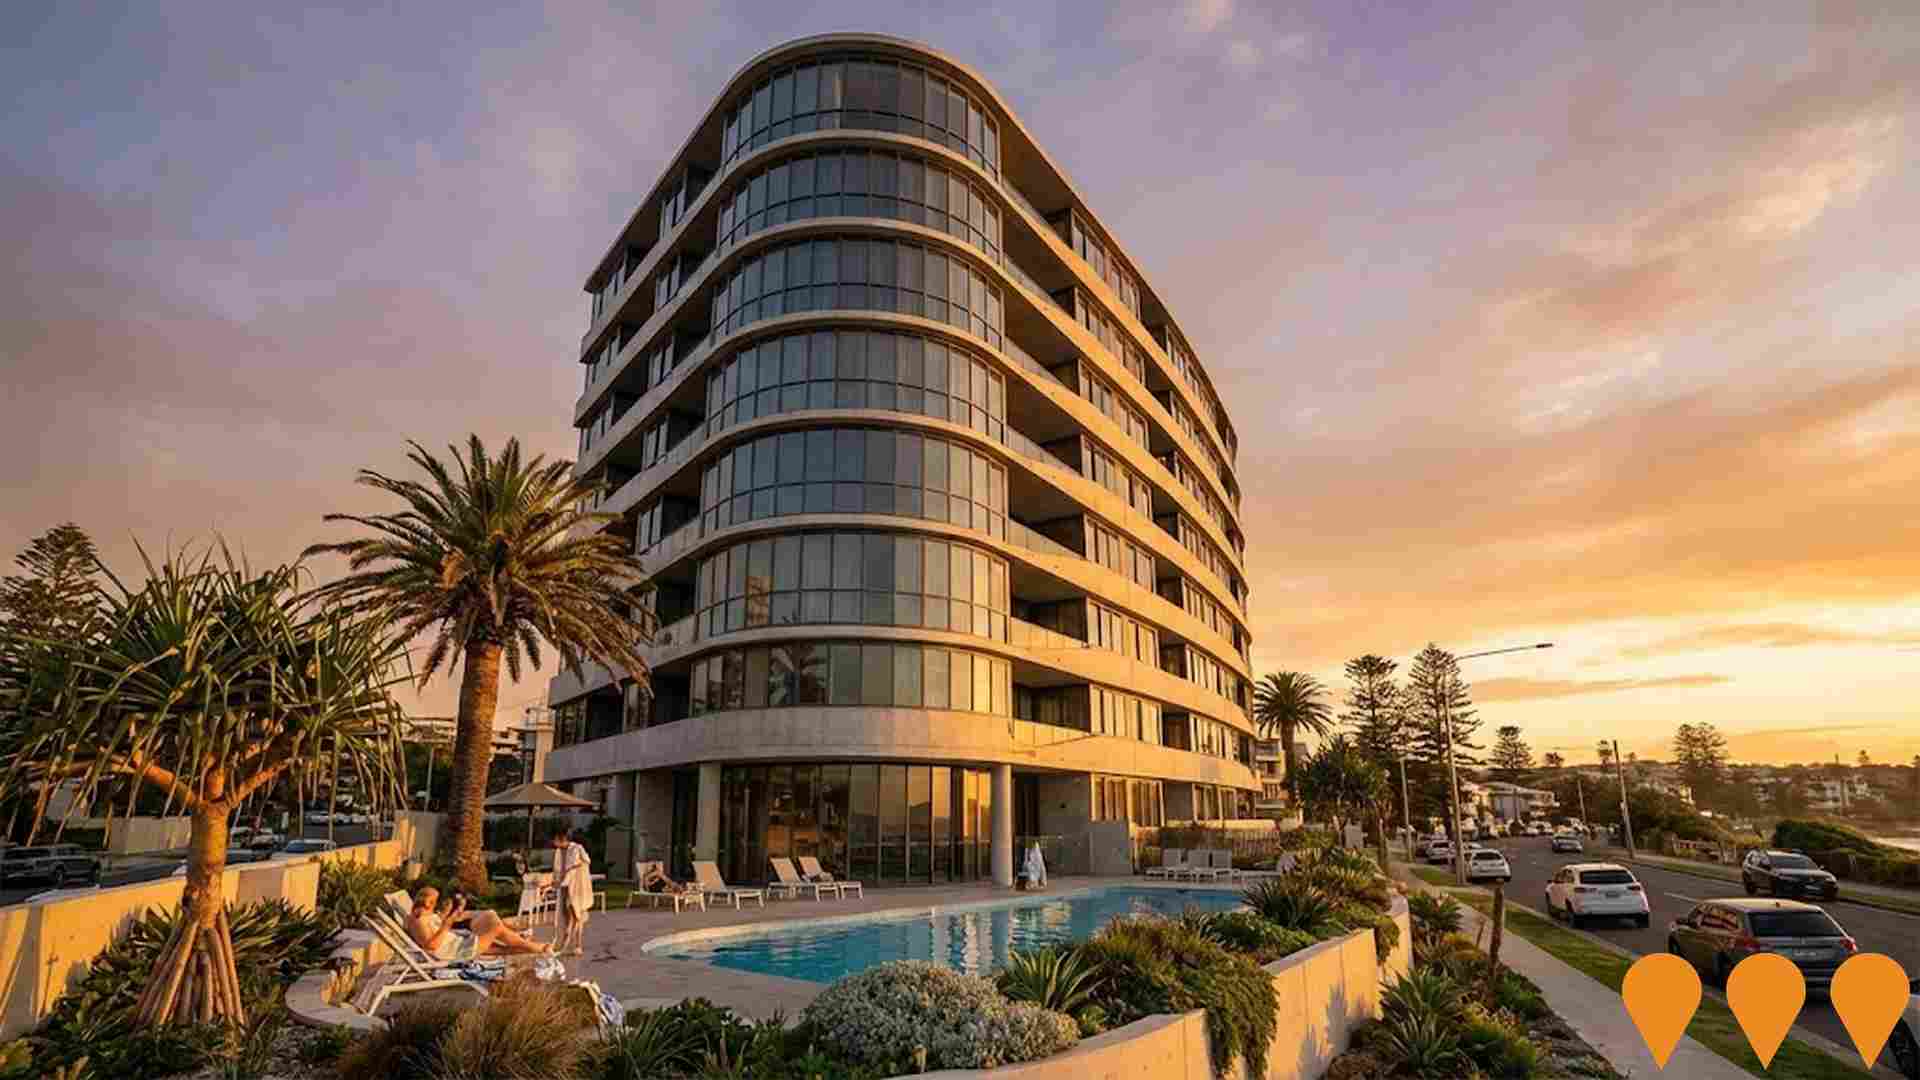
VUE Cronulla
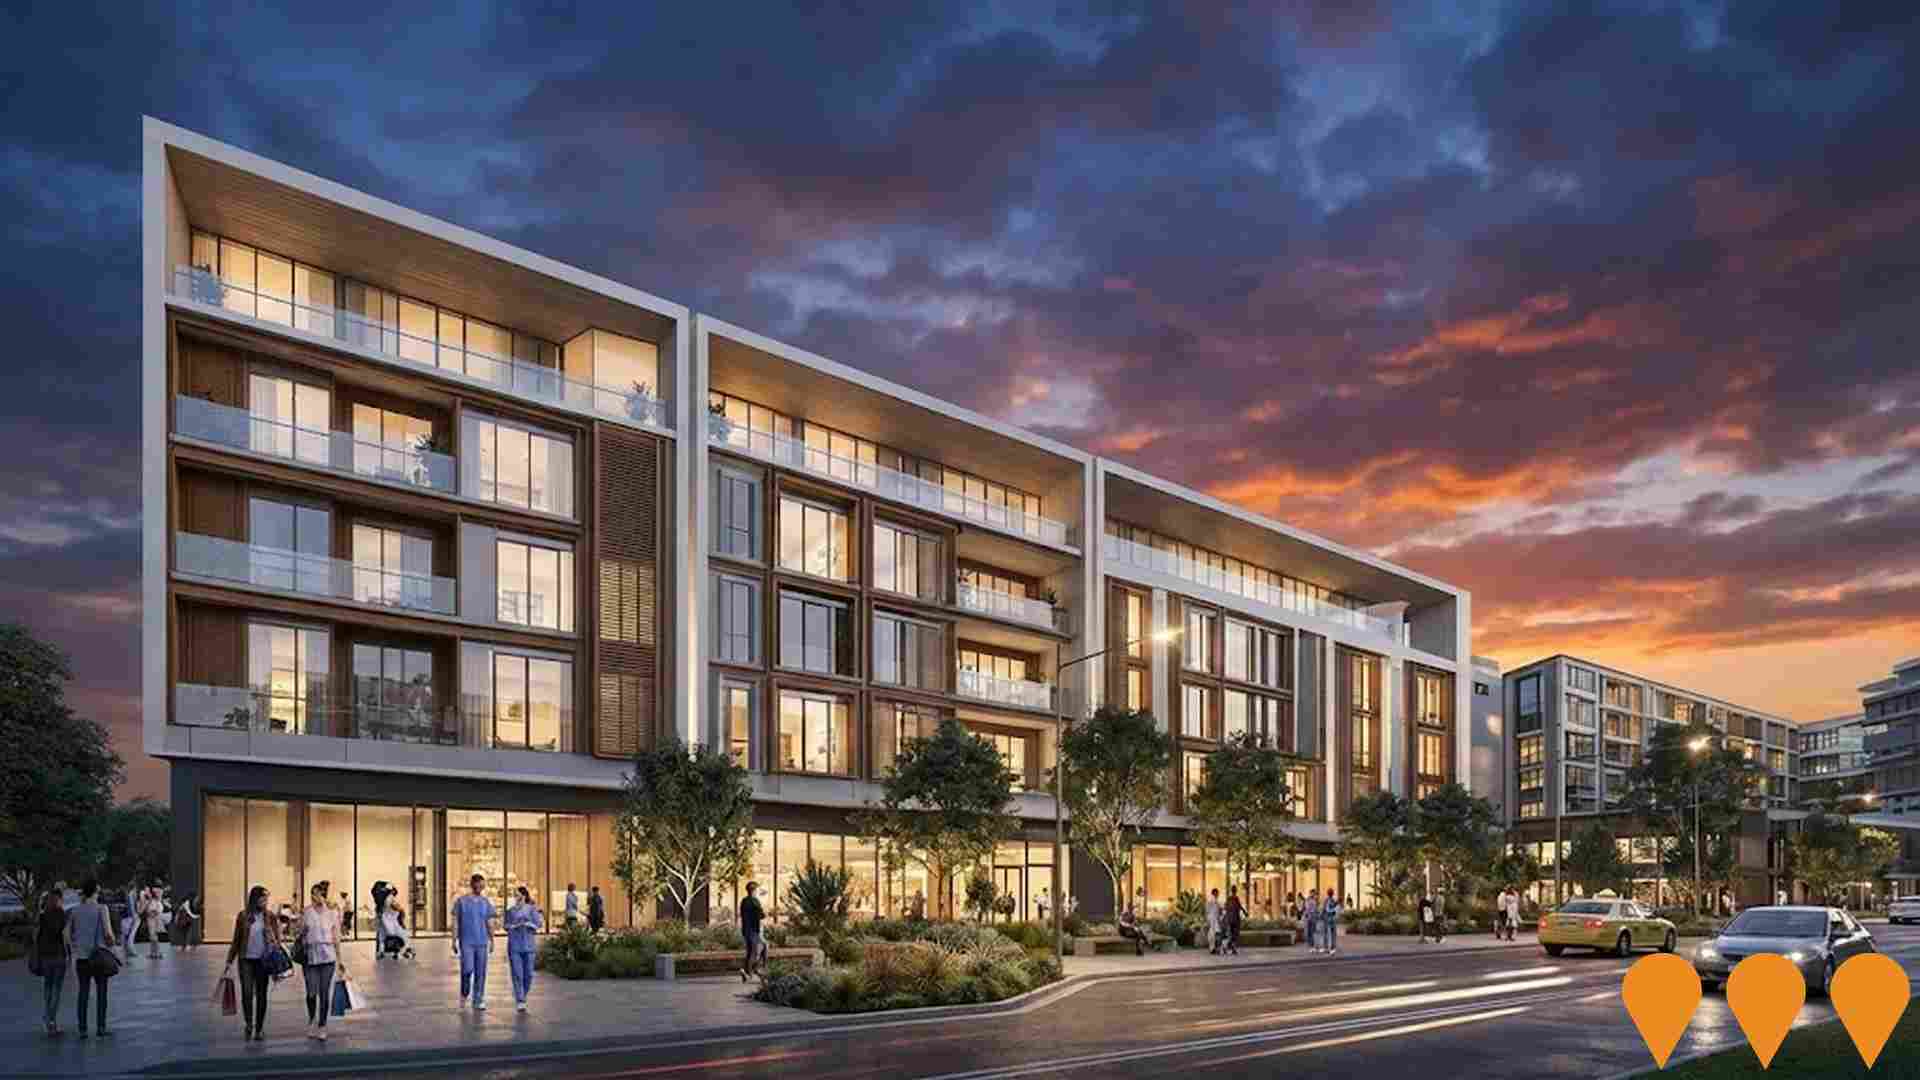
A landmark $350 million mixed-use urban renewal development featuring two eight-storey towers over a double-storey podium, comprising 112 luxury apartments (1-3 bedrooms and penthouses), 880 sqm of commercial space, and 3,000 sqm of retail space including Harris Farm Markets (the first in Sutherland Shire). The development includes resort-style amenities with north-facing pool, hot-cold plunge pools, infrared sauna, steam room, open-air gym, yoga and Pilates studio, communal terrace with pavilion, and poolside daybeds. Designed by PBD Architects with interiors by Mim Design, VUE represents the first major urban renewal in Cronulla since 1999, bringing new vitality to the Northern Gateway precinct with multiple specialty food and beverage outlets.
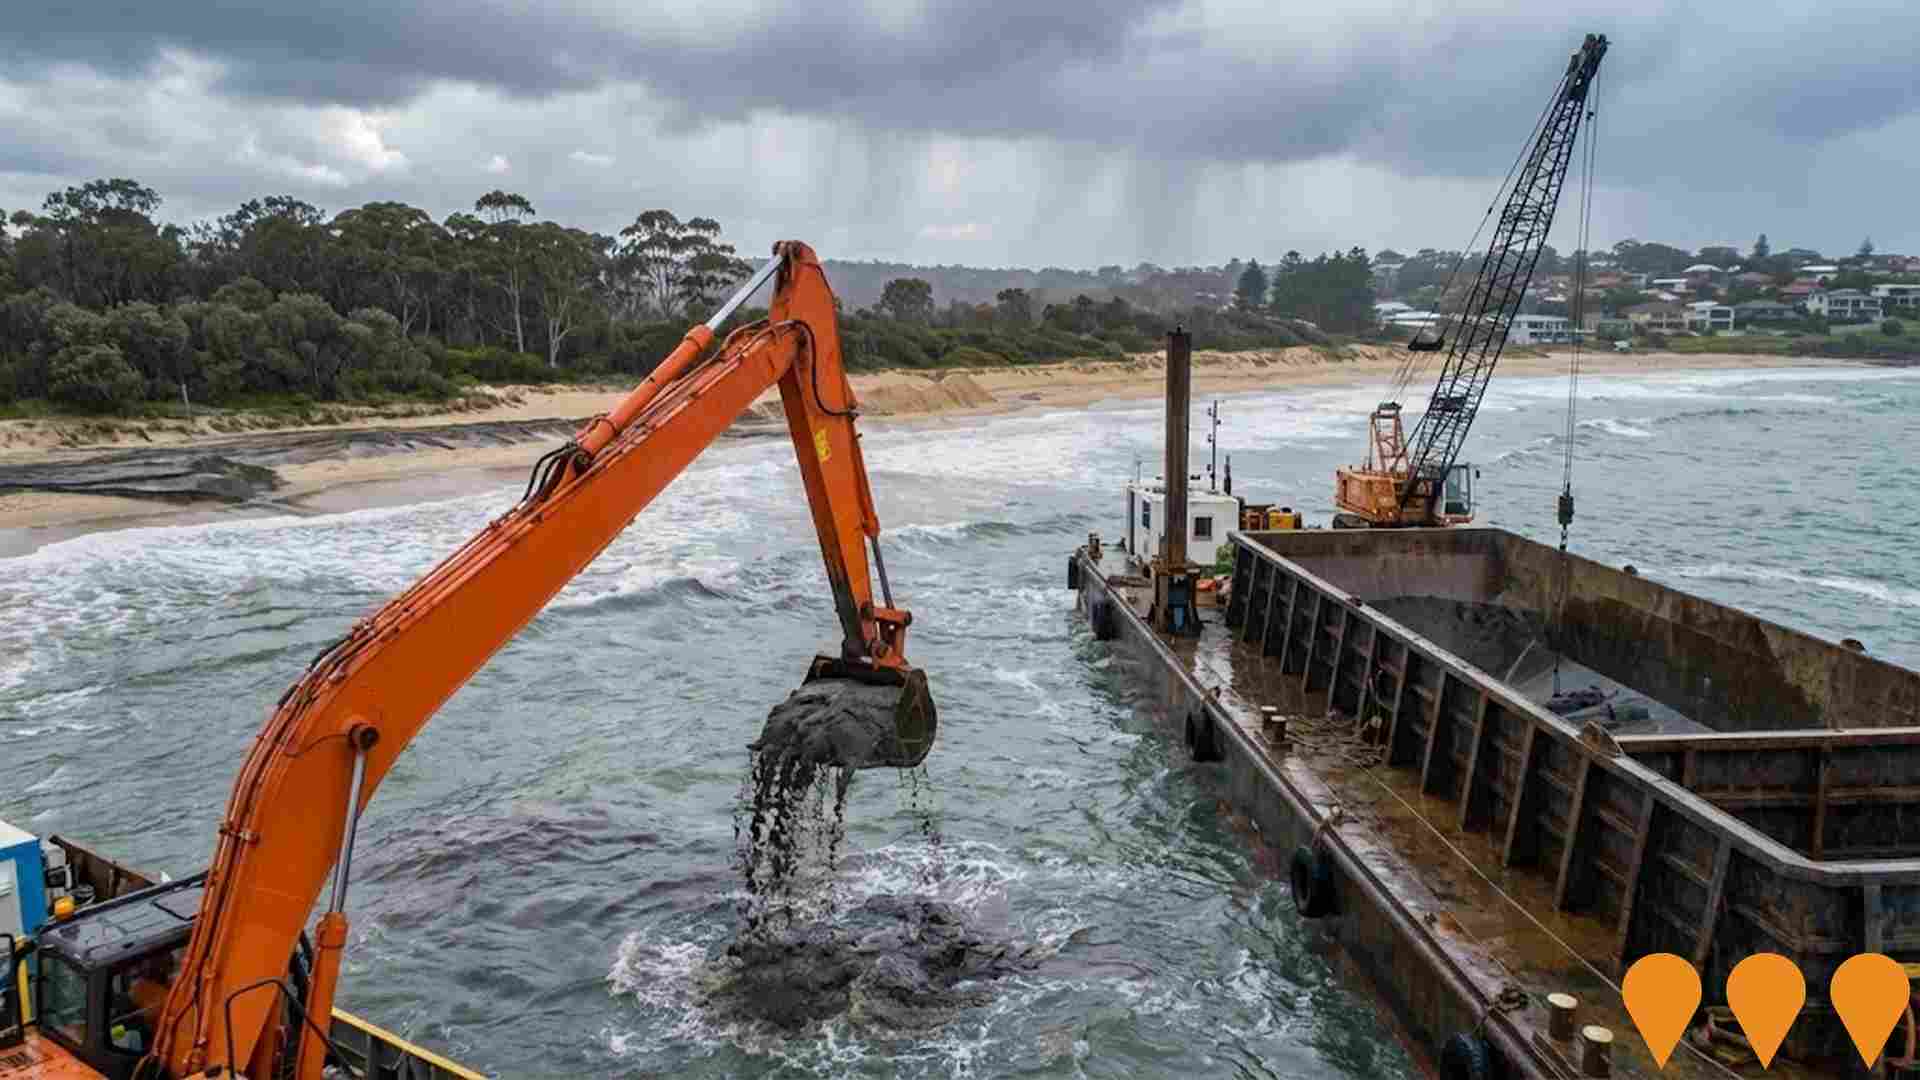
Port Hacking Estuary Dredging & Beach Nourishment
Major environmental management project involving estuary dredging and beach nourishment to improve navigation, reduce flooding risk and enhance coastal protection. Important infrastructure for marine access and coastal resilience.
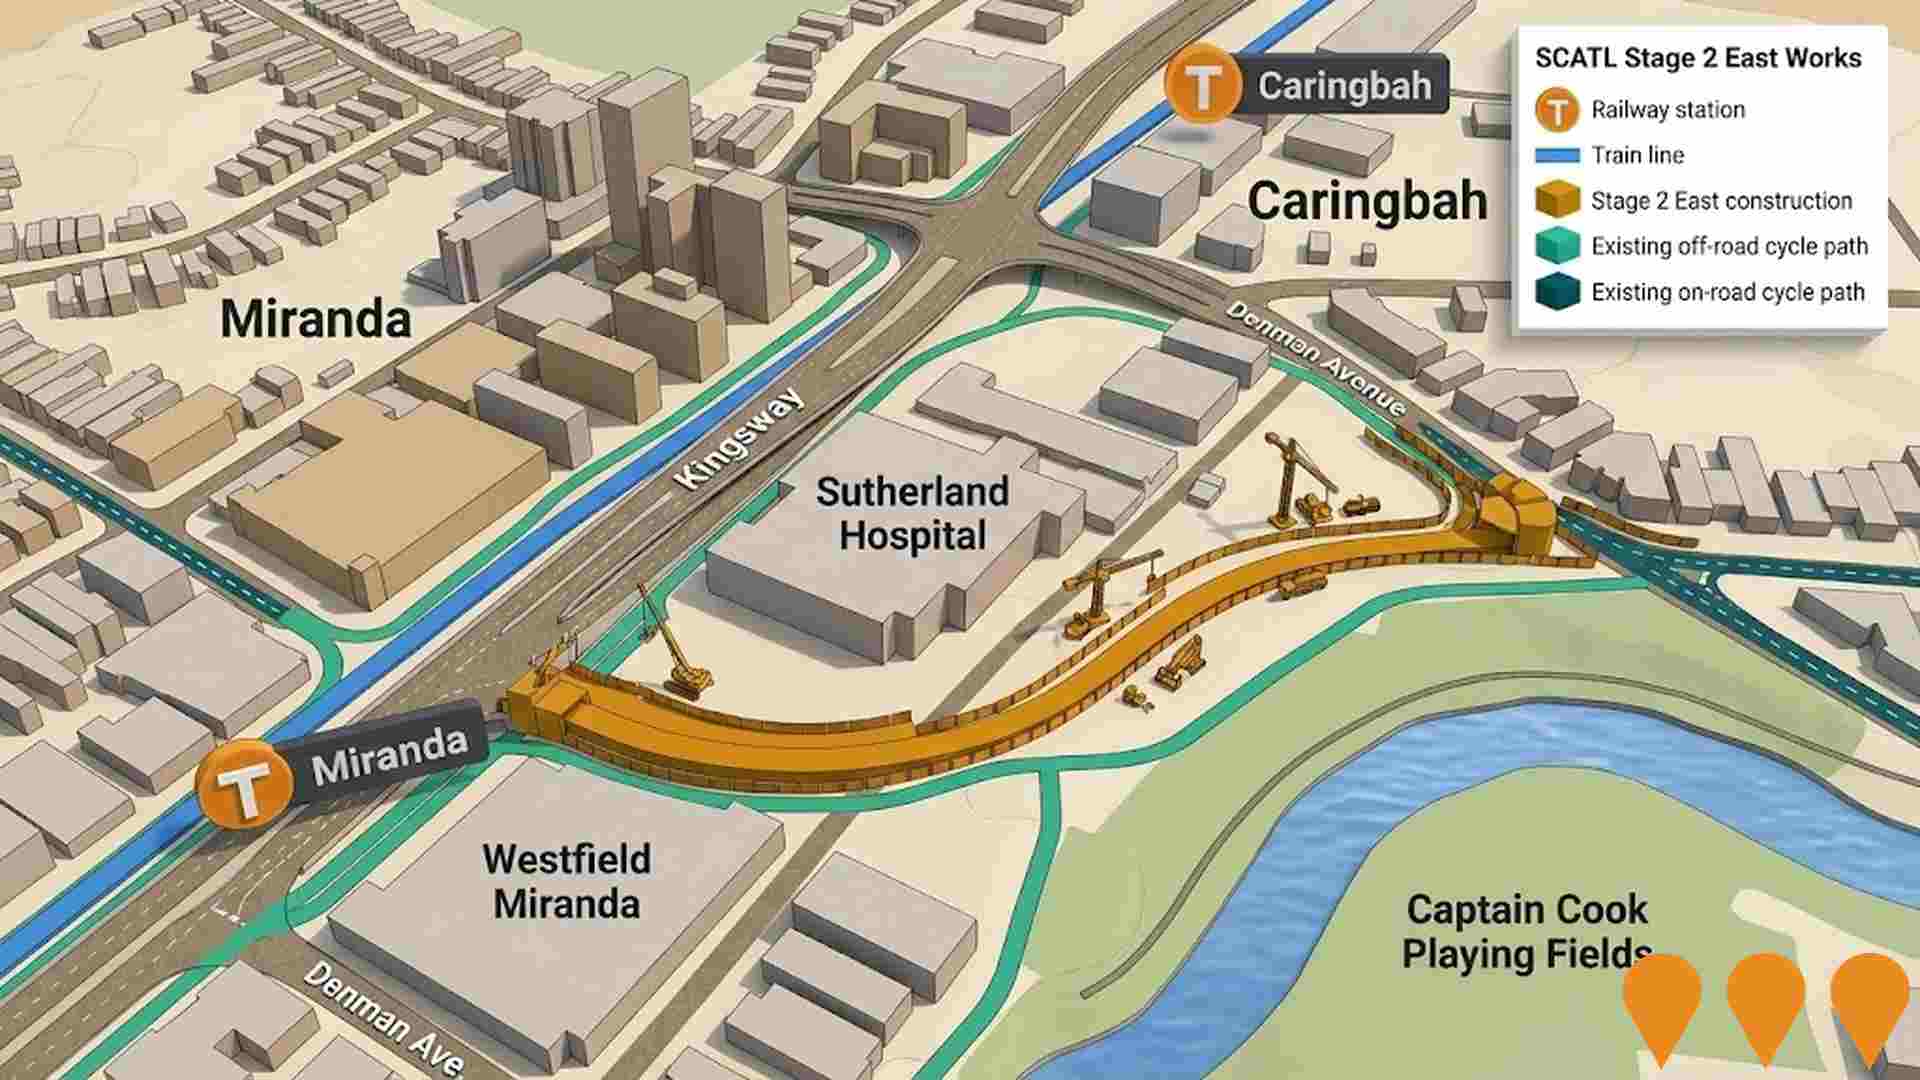
Sutherland to Cronulla Active Transport Link (SCATL)
The Sutherland to Cronulla Active Transport Link (SCATL) is an 11km cycleway and pedestrian path connecting Sutherland to Cronulla, utilizing the rail corridor and various locations. Stage 1 (Sutherland to Kirrawee) and Stage 2 (Kirrawee to Caringbah, including Jackson Avenue, Miranda to Gannons Road, Caringbah) are completed, with Stage 2 finalized in early 2024 using $65M in funding. Stage 3 (Caringbah to Cronulla) is in construction, with a focus on connecting key centers, transport hubs, schools, and business precincts in the Sutherland Shire.
Live Caringbah
Live Caringbah is an approved mixed-use development in the Caringbah Medical Precinct comprising approximately 240 apartments (1-, 2-, and 3-bedroom) across two eight-storey towers, together with a five-storey medical/health facility. Designed with contemporary coastal-inspired architecture by DKO, the project includes rooftop gardens, study/home office spaces, and high-quality resident amenities. Originally proposed as residential-only, the project was approved on appeal by the Land and Environment Court in April 2024 following initial refusals by the planning panel.
Caringbah Pavilion
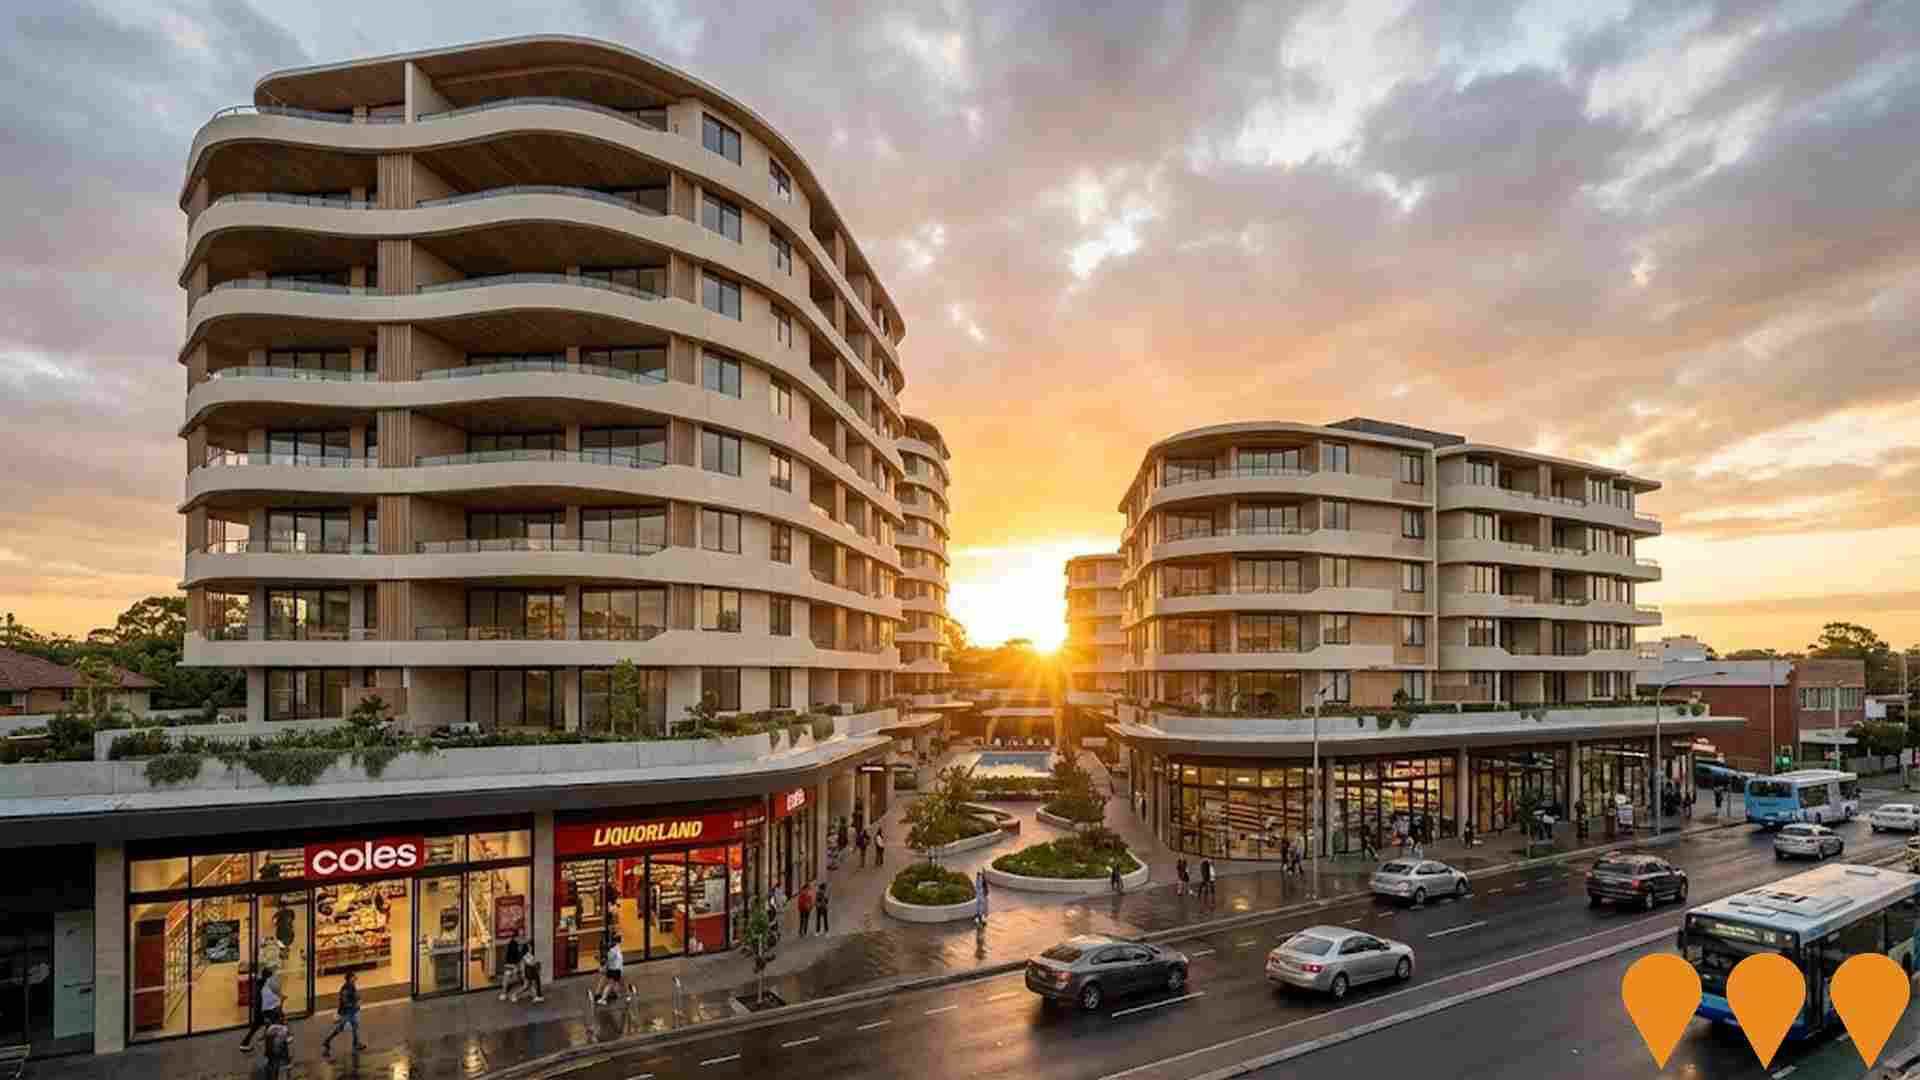
A landmark mixed-use lifestyle precinct featuring 188 apartments (including 42 affordable housing units) above a vibrant retail village with a Coles supermarket, Liquorland, and specialty shops. The development comprises two residential towers (10-storey and 6-storey) with resort-style amenities including rooftop gardens, pool, gym, and wellness zones. Designed by CQ Studio, the project delivers 1-4 bedroom residences with premium finishes, engineered timber flooring, and European appliances. Located 200 meters from Caringbah train station, the precinct combines coastal living with urban convenience in the heart of Sutherland Shire.
St Aloysius College Cronulla Expansion
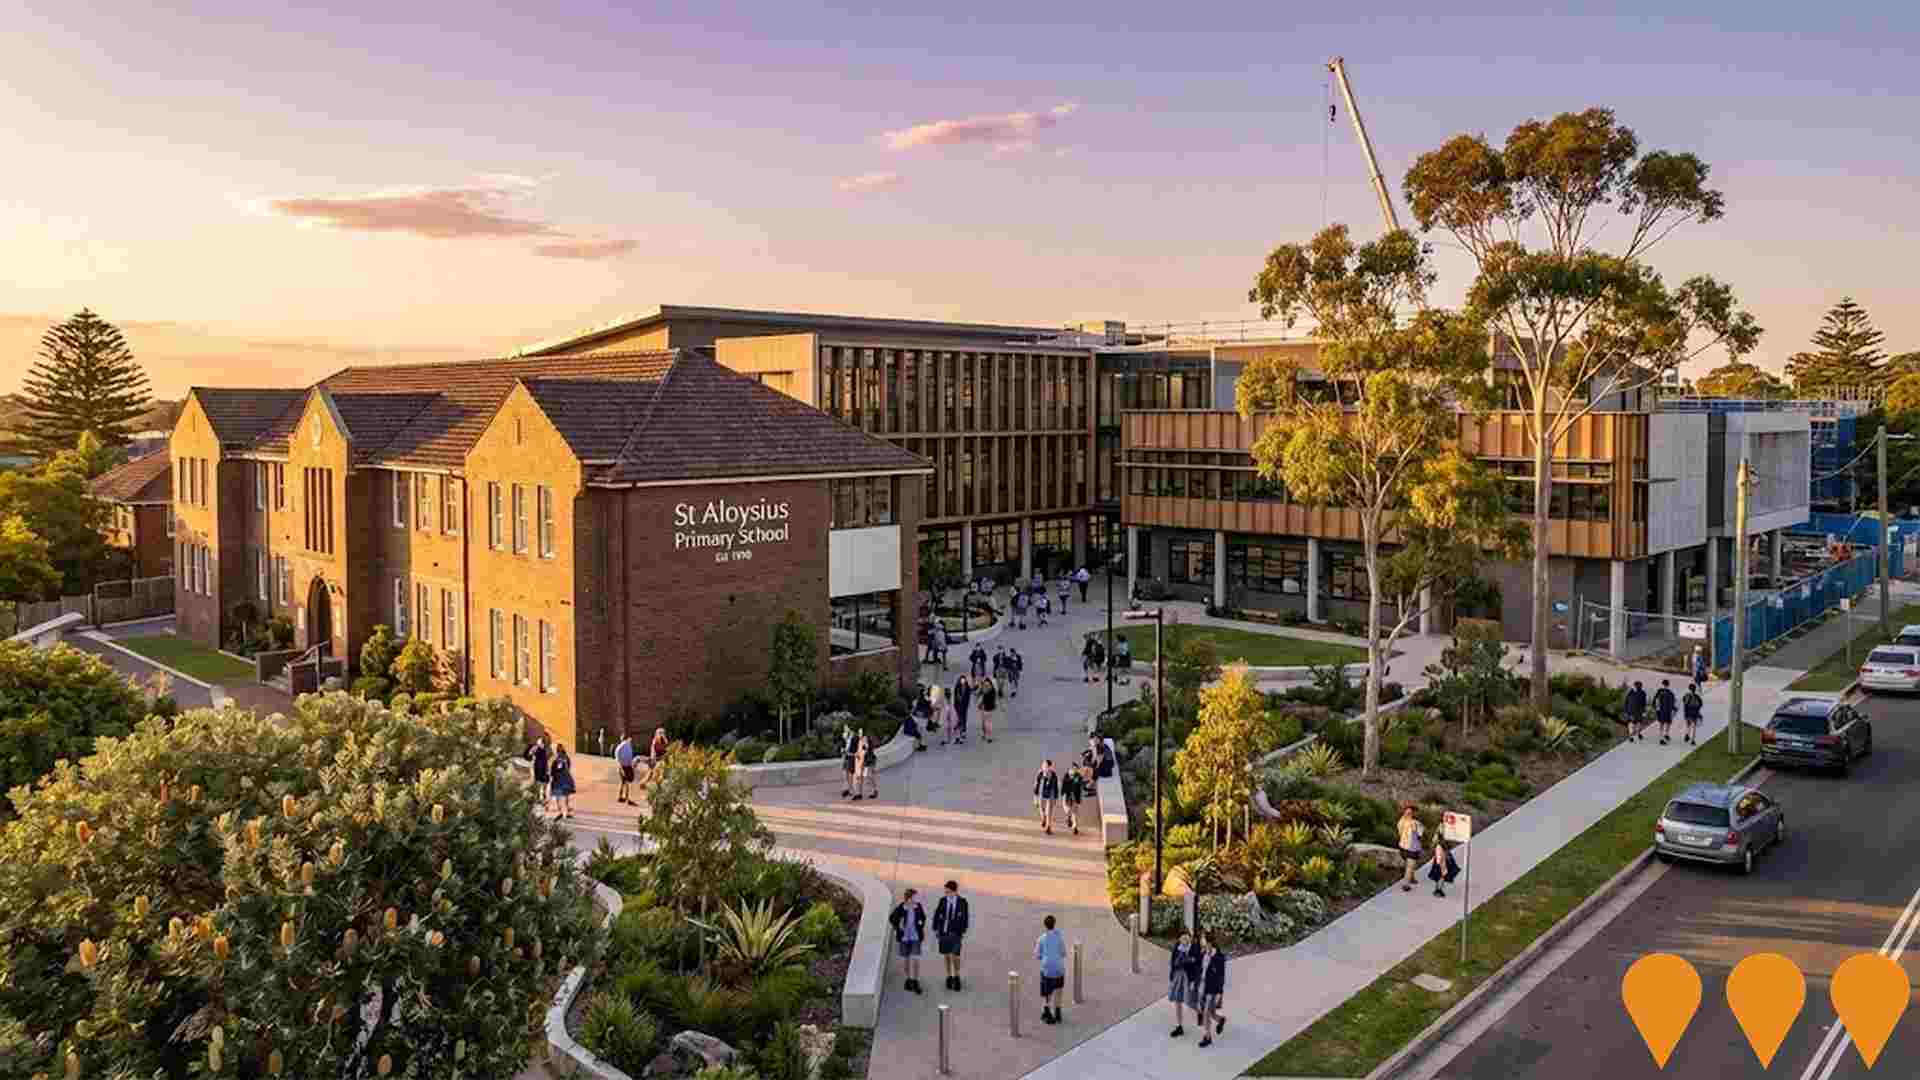
$28 million phased expansion to modernise facilities and increase capacity from 414 to 1,080 students. Includes new classrooms, science laboratories, food technology spaces, and sustainable building practices.
Cronulla High School Upgrade
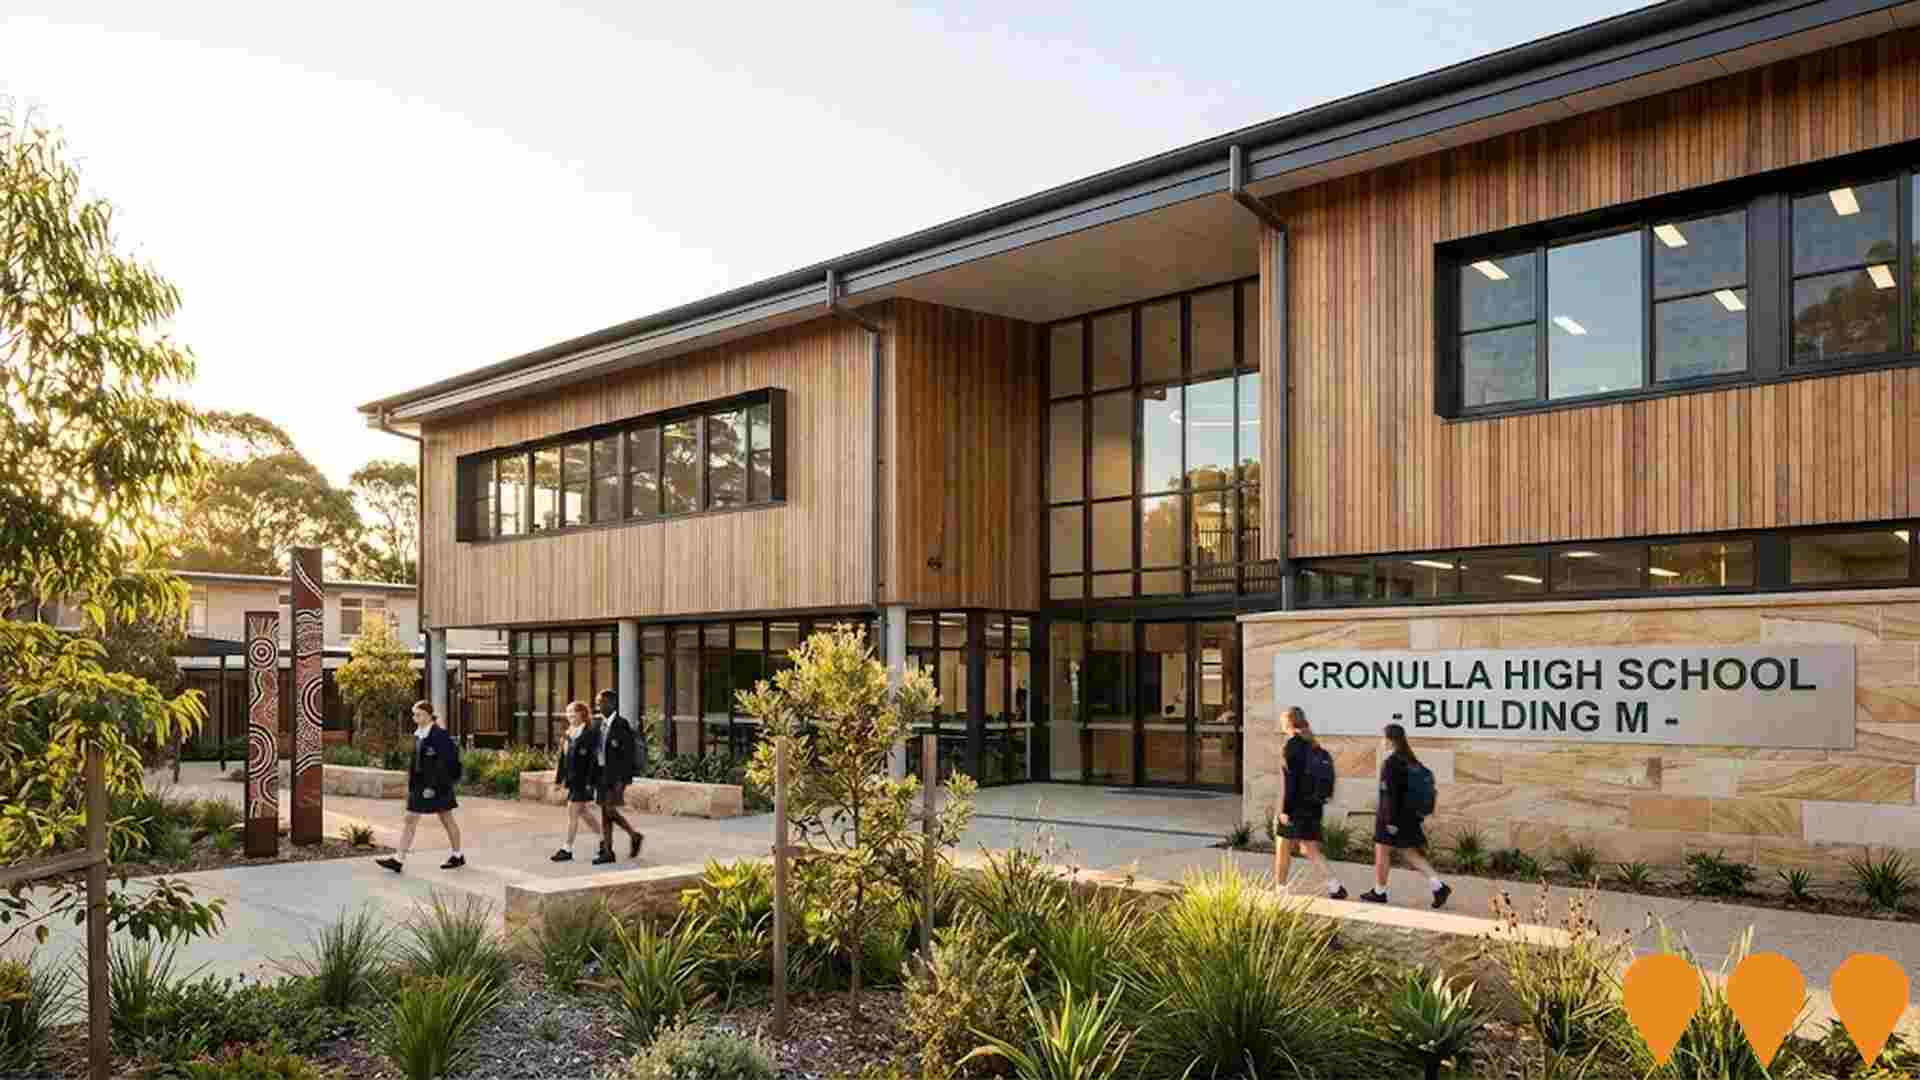
Major upgrade to Cronulla High School, including new permanent classrooms, improvements to Building M, and a cultural tribute installation. Building L includes four new teaching spaces to enhance educational facilities.
Employment
AreaSearch analysis of employment trends sees Woolooware - Burraneer performing better than 90% of local markets assessed across Australia
Woolooware-Burraneer has an educated workforce with professional services well-represented. Its unemployment rate is 1.7%, lower than Greater Sydney's 4.2%.
Employment growth over the past year was estimated at 1.5%. As of September 2025, 5716 residents are employed, with a participation rate of 67.5% compared to Greater Sydney's 60.0%. Key employment sectors include construction, health care & social assistance, and professional & technical services. Construction is particularly strong, employing 1.4 times the regional level.
However, health care & social assistance employs only 11.5% of local workers, below Greater Sydney's 14.1%. Between September 2024 and September 2025, employment increased by 1.5%, labour force by 1.5%, with unemployment remaining essentially unchanged. In contrast, Greater Sydney saw employment growth of 2.1% and labour force growth of 2.4%. State-level data to 25-Nov-25 shows NSW employment contracted by 0.03%, losing 2260 jobs, with an unemployment rate of 3.9%. National employment forecasts from May-25 project a 6.6% increase over five years and 13.7% over ten years. Applying these projections to Woolooware-Burraneer's employment mix suggests local employment should increase by 6.8% over five years and 13.7% over ten years, based on simple weighting extrapolation for illustrative purposes.
Frequently Asked Questions - Employment
Income
The economic profile demonstrates exceptional strength, placing the area among the top 10% nationally based on comprehensive AreaSearch income analysis
The Woolooware - Burraneer SA2 had exceptionally high income levels nationally according to latest ATO data aggregated by AreaSearch for financial year 2022. Its median income among taxpayers was $65,758 and average income stood at $100,453, compared to Greater Sydney's figures of $56,994 and $80,856 respectively. Based on Wage Price Index growth of 12.61% since financial year 2022, estimates as of September 2025 would be approximately $74,050 (median) and $113,120 (average). From the 2021 Census, household, family and personal incomes in Woolooware - Burraneer ranked highly nationally, between the 88th and 91st percentiles. The $4000+ earnings band captured 30.9% of the community (3,116 individuals), contrasting with the surrounding region where the $1,500 - 2,999 bracket led at 30.9%. Higher earners represented a substantial presence with 44.1% exceeding $3,000 weekly. High housing costs consumed 15.5% of income, yet strong earnings placed disposable income at the 91st percentile and the area's SEIFA income ranking placed it in the 9th decile.
Frequently Asked Questions - Income
Housing
Woolooware - Burraneer displays a diverse mix of dwelling types, with above-average rates of outright home ownership
Dwelling structure in Woolooware - Burraneer, as evaluated at the Census held on 28 August 2016, comprised 59.7% houses and 40.4% other dwellings (semi-detached, apartments, 'other' dwellings), compared to Sydney metropolitan area's 52.4% houses and 47.6% other dwellings. Home ownership in Woolooware - Burraneer was 38.2%, with mortgaged dwellings at 40.9% and rented dwellings at 20.9%. The median monthly mortgage repayment in the area was $3,000, above Sydney metro's average of $2,774. Median weekly rent figure was recorded at $550, compared to Sydney metro's $500. Nationally, Woolooware - Burraneer's median monthly mortgage repayments were significantly higher than the Australian average of $1,863, and rents were substantially above the national figure of $375.
Frequently Asked Questions - Housing
Household Composition
Woolooware - Burraneer has a typical household mix, with a higher-than-average median household size
Family households account for 74.9% of all households, including 38.6% couples with children, 27.5% couples without children, and 8.2% single parent families. Non-family households make up the remaining 25.1%, consisting of 23.2% lone person households and 1.9% group households. The median household size is 2.6 people, which is larger than the Greater Sydney average of 2.5.
Frequently Asked Questions - Households
Local Schools & Education
Woolooware - Burraneer shows strong educational performance, ranking in the upper quartile nationally when assessed across multiple qualification and achievement indicators
University qualification levels in Woolooware - Burraneer are at 33.4%, slightly below Greater Sydney's average of 38.0%. Bachelor degrees are the most common at 24.2%, followed by postgraduate qualifications at 6.3% and graduate diplomas at 2.9%. Vocational credentials are held by 35.7% of residents aged 15 and above, with advanced diplomas at 13.9% and certificates at 21.8%.
Educational participation is high, with 27.9% currently enrolled in formal education. This includes 8.6% in primary education, 8.2% in secondary education, and 5.1% pursuing tertiary education.
Frequently Asked Questions - Education
Schools Detail
Nearby Services & Amenities
Transport
Transport servicing is high compared to other areas nationally based on assessment of service frequency, route connectivity and accessibility
Woolooware - Burraneer has 72 active public transport stops offering a mix of train and bus services. These stops are served by 28 individual routes, collectively facilitating 2,668 weekly passenger trips. Transport accessibility is rated excellent with residents typically located 125 meters from the nearest stop.
Service frequency averages 381 trips per day across all routes, equating to approximately 37 weekly trips per stop.
Frequently Asked Questions - Transport
Transport Stops Detail
Health
Woolooware - Burraneer's residents boast exceedingly positive health performance metrics with very low prevalence of common health conditions across all age groups
Woolooware - Burraneer shows excellent health outcomes, with low prevalence of common conditions across all ages. Private health cover stands at approximately 72% (7,231 people), higher than Greater Sydney's 65.7%. Nationally, it averages 55.3%.
Arthritis and asthma are the most prevalent conditions, affecting 7.2% and 6.7% respectively. A total of 75.0% report no medical ailments, compared to 72.3% in Greater Sydney. The area has 19.1% seniors (1,931 people), lower than Greater Sydney's 21.1%. Seniors' health outcomes align with the general population's profile.
Frequently Asked Questions - Health
Cultural Diversity
Woolooware - Burraneer ranks below the Australian average when compared to other local markets across a number of language and cultural background related metrics
Woolooware-Burraneer has a cultural diversity score below average, with 83.9% of its population born in Australia, 93.0% being citizens, and 90.3% speaking English only at home. Christianity is the predominant religion in Woolooware-Burraneer, accounting for 63.1% of people, compared to 61.2% across Greater Sydney. The top three ancestry groups are English (29.9%), Australian (26.2%), and Irish (9.6%).
Notably, Croatian (0.9%) is overrepresented compared to the regional average of 0.7%, as are Macedonian (0.5%) and Greek (2.4%).
Frequently Asked Questions - Diversity
Age
Woolooware - Burraneer's population is slightly older than the national pattern
Woolooware-Burraneer has a median age of 40, slightly higher than Greater Sydney's figure of 37 and Australia's national average of 38 years. Compared to the Greater Sydney average, the 55-64 age cohort is notably over-represented in Woolooware-Burraneer at 12.9%, while the 25-34 year-olds are under-represented at 11.3%. Between 2021 and present, the 75 to 84 age group has grown from 5.1% to 6.4% of the population, while the 35 to 44 cohort increased from 12.2% to 13.2%. Conversely, the 45 to 54 age cohort has declined from 14.3% to 12.2%. Demographic modeling suggests that Woolooware-Burraneer's age profile will evolve significantly by 2041. The 75 to 84 age cohort is projected to grow significantly, expanding by 65% from 645 to 1,064 people. Notably, the combined 65+ age groups will account for 55% of total population growth, reflecting the area's aging demographic profile. The 0 to 4 age group displays more modest growth at 0%, adding only 2 residents.
