Cabramatta West - Mount Pritchard
Statistical Area - sa2

Chart Color Schemes
Loading map data ...
0 People

est. as @ -- *

ABS ERP | -- people | --

2021 Census | -- people

Land Area
--
Land Area
Population Density
--
Density
Unemployment Rate
--
Unemployment
Development
--
Resi Approvals
Get My Report

Sales Activity

Table Chart PROFILE FAQ

Curious about local property values? Filter the chart to assess the volume and appreciation (including resales) trends and regional comparisons, or scroll to the map below view this information at an individual property level.

House icon
Median Price
$0
Key icon
1yr Sales Volume
0
Find a Recent Sale
Type Specified (1) | Limit 50

Sales Detail

Population

Table Chart PROFILE FAQ

Cabramatta West - Mount Pritchard has seen population growth performance typically on par with national averages when looking at short and medium term trends

Cabramatta West - Mount Pritchard's population is approximately 18,570 as of August 2025. Between the 2021 Census and June 2024, the population increased by around 321 people (1.8%), reaching an estimated resident population of 18,537. This growth was partly due to 37 validated new addresses since the Census date. The population density is approximately 3,477 persons per square kilometer, placing it in the upper quartile relative to national locations assessed by AreaSearch. Over the past decade, Cabramatta West - Mount Pritchard has shown resilient growth with a compound annual growth rate of 0.7%, outperforming its SA3 area. Overseas migration contributed approximately 68.7% of overall population gains during recent periods.

AreaSearch uses ABS/Geoscience Australia projections for each SA2 area, released in 2024 with 2022 as the base year. For areas not covered by this data, NSW State Government's SA2 level projections are used, released in 2022 with 2021 as the base year. Growth rates by age group are applied to all areas for years 2032 to 2041. By 2041, demographic trends suggest lower quartile growth is anticipated, with an expected increase of approximately 454 persons based on the latest population numbers, indicating a total increase of around 2.3% over the 17-year period.

Frequently Asked Questions - Population

What is the latest population estimate for Cabramatta West - Mount Pritchard?
Total population for Cabramatta West - Mount Pritchard was estimated to be approximately 18,570 as at Aug 25. This is based upon an estimated resident population of 18,537 from the ABS up to June 2024.
How has the population in Cabramatta West - Mount Pritchard changed since 2021?
Cabramatta West - Mount Pritchard has added approximately 321 people and shown a 1.76% increase from the 18,249 people recorded at the 2021 Census period.
What is the population density in Cabramatta West - Mount Pritchard?
The population density in Cabramatta West - Mount Pritchard is estimated at 3,477 persons per square kilometer based on the latest population estimate.
How much has the population grown over the past 10 years?
Over the past 10 years, the population has shown a compound annual growth rate of 0.7% per annum.
What are the main drivers of population growth in the area?
Population growth in Cabramatta West - Mount Pritchard is driven by: Overseas migration (68.7%), Natural increase (31.3%), Interstate migration (0.0%). The primary driver is Overseas migration, contributing 68.7% of overall population gains.

Development

Table Chart PROFILE FAQ

Residential development activity is slightly higher than average within Cabramatta West - Mount Pritchard when compared nationally

Cabramatta West - Mount Pritchard has received approximately 98 residential property approvals annually. The Australian Bureau of Statistics produces development approval data on a financial year basis, totalling 490 approvals from FY21 to FY25, with 12 approved so far in FY26. Over the past five years, an average of zero people per dwelling have moved into the area annually, suggesting that new supply is meeting or exceeding demand and providing ample buyer options while supporting population growth beyond current forecasts. The average construction cost of new homes is $364,000, below the regional average, indicating more affordable housing options.

This financial year has seen $2.6 million in commercial approvals, reflecting the area's residential character. Compared to Greater Sydney, Cabramatta West - Mount Pritchard shows elevated construction activity, at 15.0% above the regional average per person over the past five years. New building activity comprises 69.0% standalone homes and 31.0% townhouses or apartments, diversifying housing options from family homes to more affordable compact living. This shift reflects reduced development site availability and changing lifestyle demands.

The area has approximately 192 people per dwelling approval, indicating a low-density market. By 2041, Cabramatta West - Mount Pritchard is expected to grow by 420 residents. At current development rates, new housing supply should comfortably meet demand, providing favourable conditions for buyers and potentially supporting growth beyond current population projections.

Frequently Asked Questions - Development

How many dwelling approvals have occurred in the Cabramatta West - Mount Pritchard area recently?
Dwelling approval activity in the Cabramatta West - Mount Pritchard area has seen 193 residential approvals over the past two financial years, based on AreaSearch's SA2 aggregation method. Cabramatta West - Mount Pritchard's current population of 18,570 has been supported by 98 approvals on average over recent years.
How does Cabramatta West - Mount Pritchard's development activity compare to the broader region?
Cabramatta West - Mount Pritchard has seen 0.53 approvals per 100 people in recent years, compared to 0.66 approvals in the broader region. This means that one dwelling has been approved for every 192 people in Cabramatta West - Mount Pritchard, compared to one for every 186 in the broader region.
Is the Cabramatta West - Mount Pritchard area keeping up with housing demand?
With the population expected to increase by 420 people by 2041, around 140 new dwellings will be necessary. Recent approval levels appear more than sufficient to meet these forecasts, considering the census average of 3.0 persons per dwelling. This suggests that population growth may exceed trend projections in the coming years, supported by a robust housing supply.
What has been the trend in development approvals over the past five years?
Looking at development activity over the past five years, Cabramatta West - Mount Pritchard's approval levels have been below the yearly average of 98, indicating a recent decline in approval activity.
How many dwellings will be needed to accommodate future population growth?
The population in Cabramatta West - Mount Pritchard is expected to grow by 420 people by 2041, necessitating approximately 140 new dwellings. This calculation is based on the current census average of 3.0 persons per dwelling in the area.
How does recent development compare to population growth in Cabramatta West - Mount Pritchard?
Over the past five years, the population in Cabramatta West - Mount Pritchard has grown by approximately 2,652 people, while 490 residential approvals were recorded. This equates to a ratio of 5.4 people added for each new dwelling approval. This high ratio suggests strong population growth relative to housing supply, potentially indicating unmet housing demand.
Are there opportunities for residential developers in Cabramatta West - Mount Pritchard?
With dwelling approval activity running at an average of 98 approvals per year and a population of 18,570, the market appears to be adequately supplied relative to projected housing demand in recent years, suggesting that developers should have a longer-term approach when considering new projects. With the population expected to increase by 420 people by 2041, around 140 new dwellings will be necessary. Recent approval levels appear more than sufficient to meet these forecasts, considering the census average of 3.0 persons per dwelling. This suggests that population growth may exceed trend projections in the coming years, supported by a robust housing supply.

Infrastructure

PROFILE FAQ

Cabramatta West - Mount Pritchard has very high levels of nearby infrastructure activity, ranking in the top 10% nationally

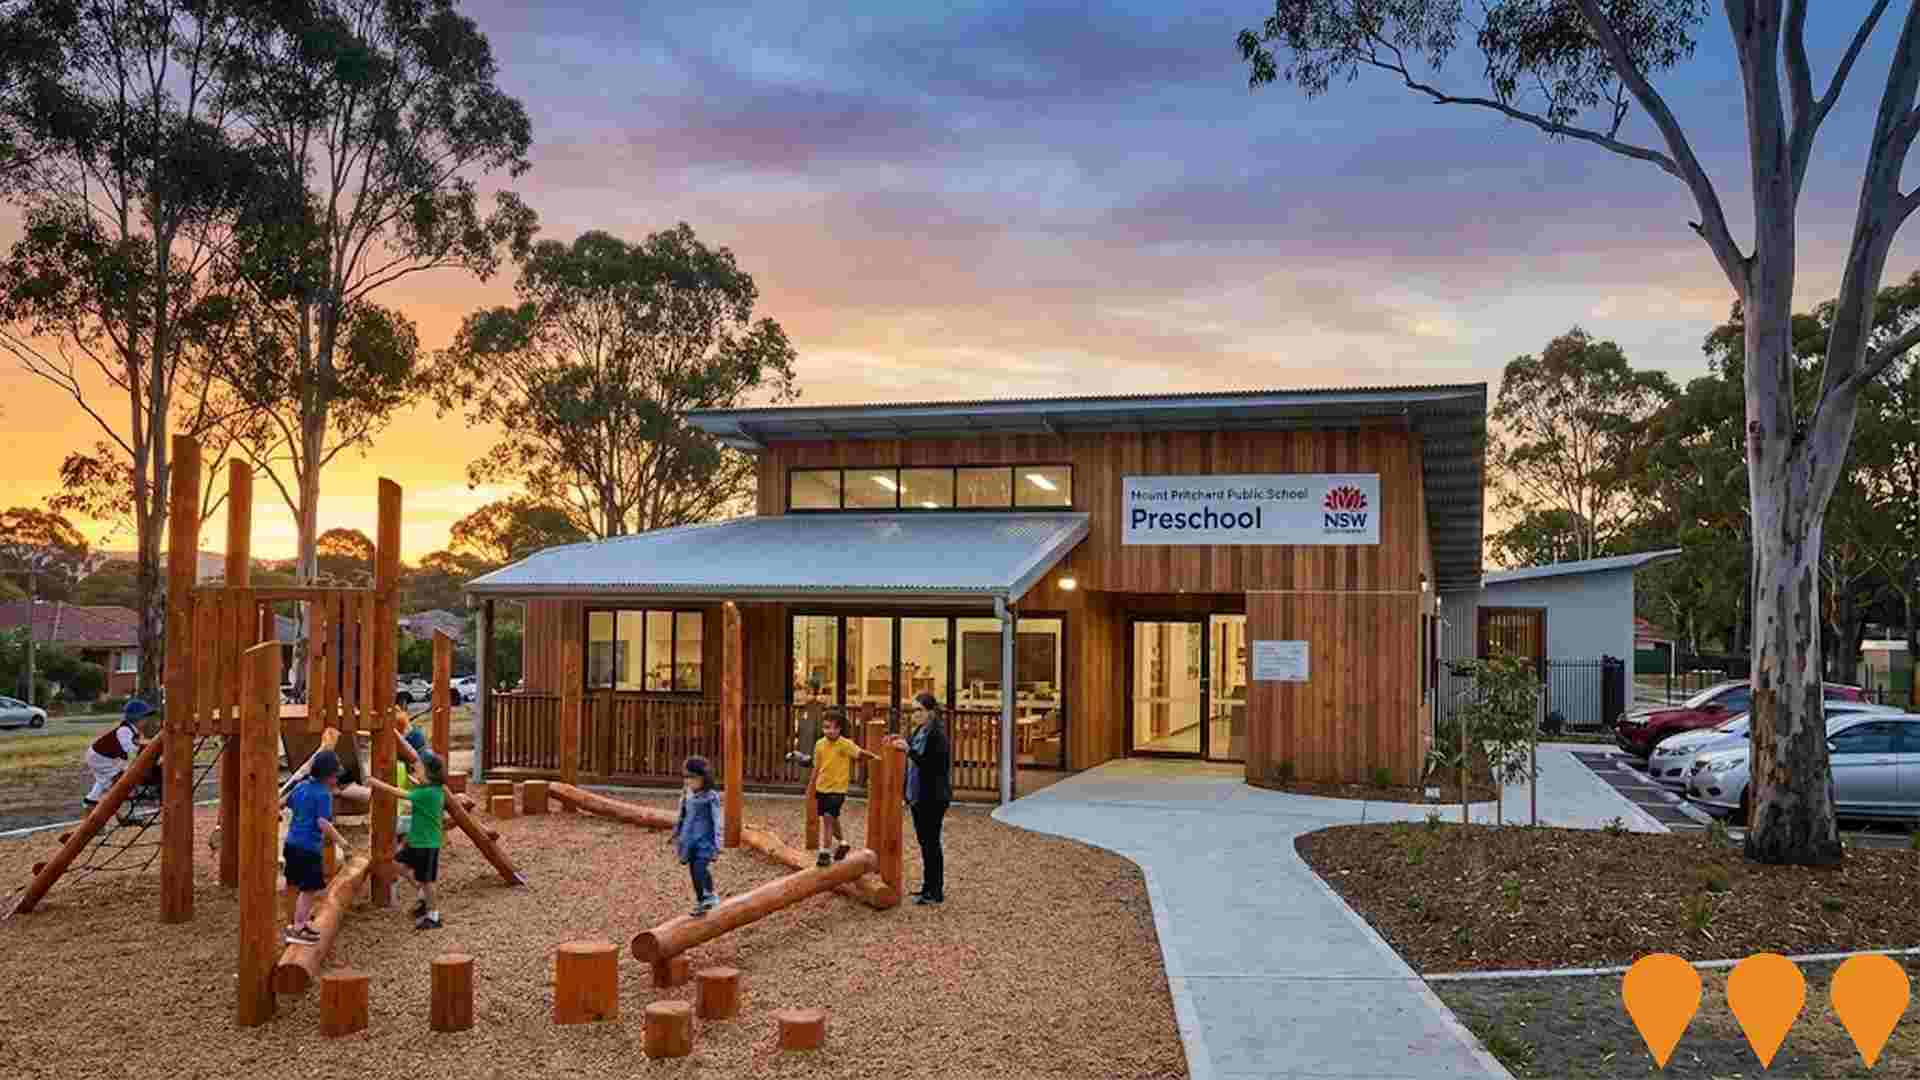
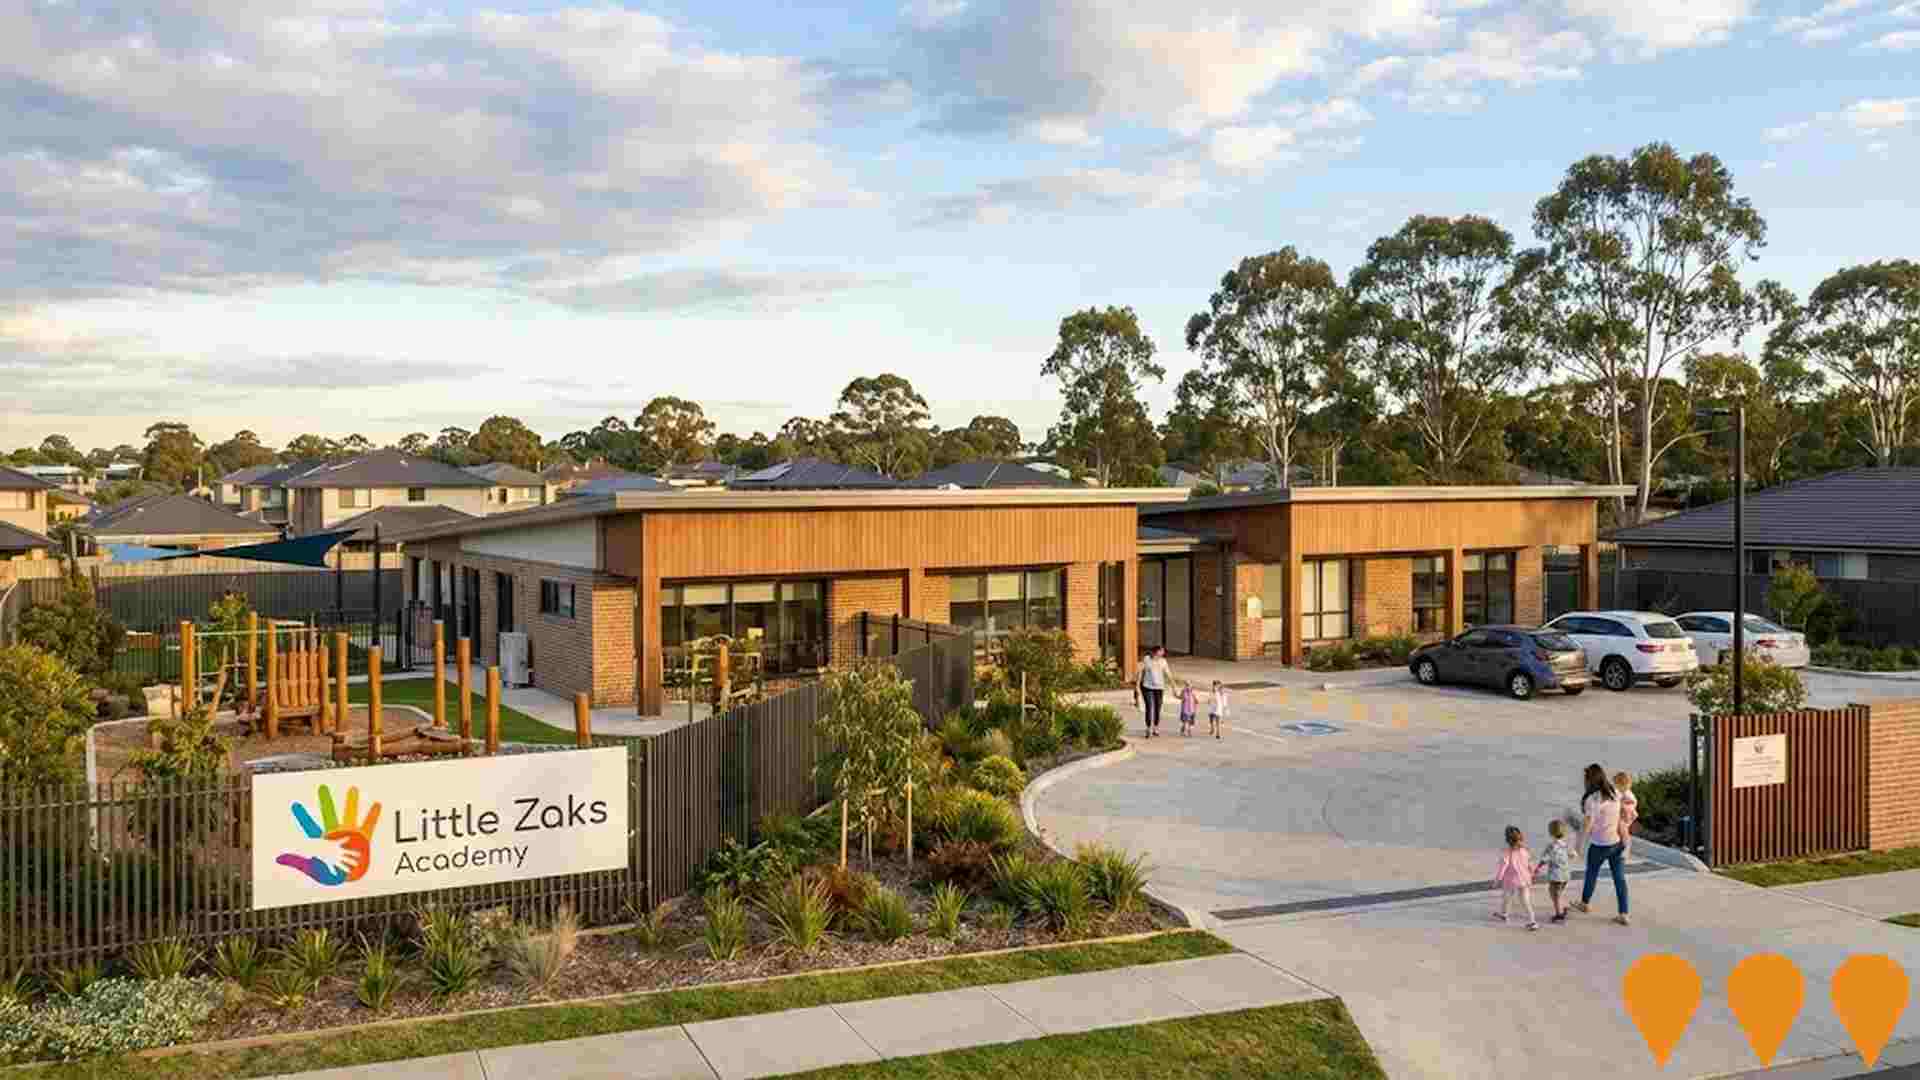
Changes to local infrastructure significantly influence an area's performance. AreaSearch has identified 27 projects that may impact this region. Notable ones include Mounties Mount Pritchard Upgrade, Prout Park Upgrade, Mount Pritchard Public School Preschool, and Little Zaks Academy Mount Pritchard. The following list details those likely most relevant.

Professional plan users can use the search below to filter and access additional projects.

INFRASTRUCTURE SEARCH
All Selected

Frequently Asked Questions - Infrastructure

What are some of the major infrastructure and planning changes likely to influence Cabramatta West - Mount Pritchard?
Key infrastructure and planning changes likely to influence Cabramatta West - Mount Pritchard include: Mounties Mount Pritchard Upgrade (Construction); Prout Park Upgrade (Construction); Mount Pritchard Public School Preschool (Planning); Little Zaks Academy Mount Pritchard (Dev. Approval); and Canvas at Bonnyrigg (Construction). These projects represent significant developments that will shape the area's future infrastructure landscape.
What types of infrastructure projects are impacting Cabramatta West - Mount Pritchard?
Infrastructure development impacting Cabramatta West - Mount Pritchard spans multiple sectors including Sports & Recreation, Education & Training, and Residential Development, among others.
What is the scale of infrastructure investment impacting Cabramatta West - Mount Pritchard?
Infrastructure investment analysis indicates substantial capital deployment exceeding $3.2 billion in projects that will impact the extended area, with a notable concentration of investment within the immediate Cabramatta West - Mount Pritchard vicinity.
How does Cabramatta West - Mount Pritchard's infrastructure development compare to other areas?
Cabramatta West - Mount Pritchard ranks in the top 10% nationally for infrastructure development, reflecting exceptional investment activity compared to similar areas across the country.
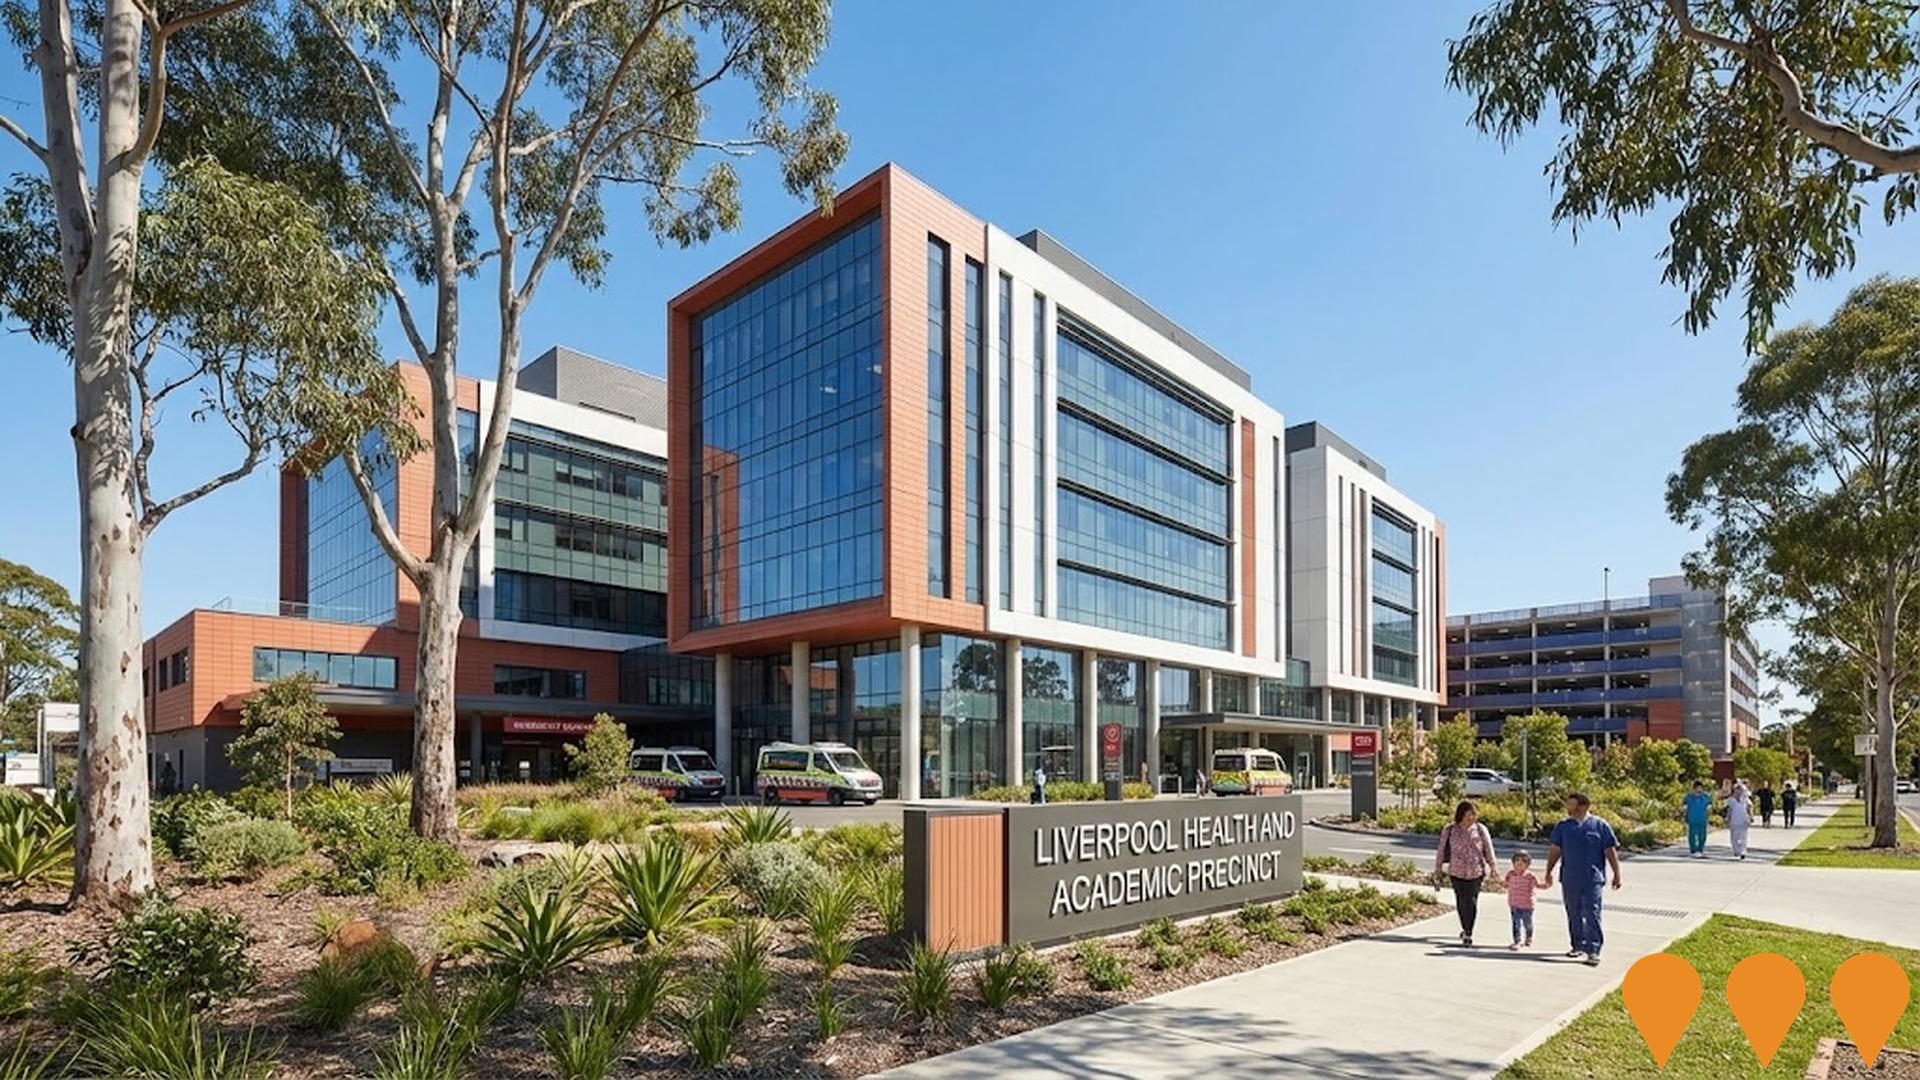
Liverpool Health and Academic Precinct (LHAP)
Category: Health & Medical
Stage: Construction | Est. Comp: 2027
Source / Links: Link 1   Link 2  

$830 million redevelopment creating Liverpool Health and Academic Precinct - an international hub of medical excellence, research and education. Phase 1 completed late 2024 with new 5-storey Integrated Services Building including expanded NICU, birthing suites, pathology department and expanded emergency department. Phase 2 beginning 2025 includes new integrated cancer centre with Australian Cancer Research Foundation's Oasis Wellness Centre, additional inpatient units, additional inpatient beds, expanded women's and children's ambulatory care, research facilities, and clinical services building. Expected completion 2027. Transforming healthcare delivery and creating a world-class health and education precinct.

Project Image

Parks for People Program Bankstown
Category: Sports & Recreation
Stage: Planning | Est. Comp: 2027
Source / Links: Link 1   Link 2  

The Parks for People program is a NSW Government initiative investing $50 million to create high-quality public open spaces in Greater Sydney, including Bankstown as part of the Transport Oriented Development Accelerated Precinct. It includes new parks, playgrounds, community gardens, and improved sports facilities to enhance liveability amid increased housing density.

Project Image

Liverpool Health and Academic Precinct
Category: Health
Stage: Construction | Est. Comp: 2027
Source / Links: Link 1   Link 2  

The Liverpool Health and Academic Precinct is an $830 million redevelopment of Liverpool Hospital including an integrated cancer centre, expanded Emergency Department, neonatal intensive care unit, new birthing suites, maternity and children's services, and ambulatory care. Phase 1 was completed in October 2024 with a new five-storey building. Phase 2, scheduled for completion in 2027, will deliver a new multi-storey Integrated Services Building with inpatient units, the ACRF Oasis Wellness Centre, and expanded women's and children's ambulatory care. The precinct includes a new multi-storey car park completed in 2022 and will transform Liverpool Hospital into a clinical hub for innovation, medical research and education serving South Western Sydney's rapidly growing population.

Project Image

Bonnyrigg Estate Renewal - Humphries Precinct
Category: Communities, Precincts & Urban Renewal
Stage: Construction | Est. Comp: 2026
Source / Links: Link 1   Link 2  

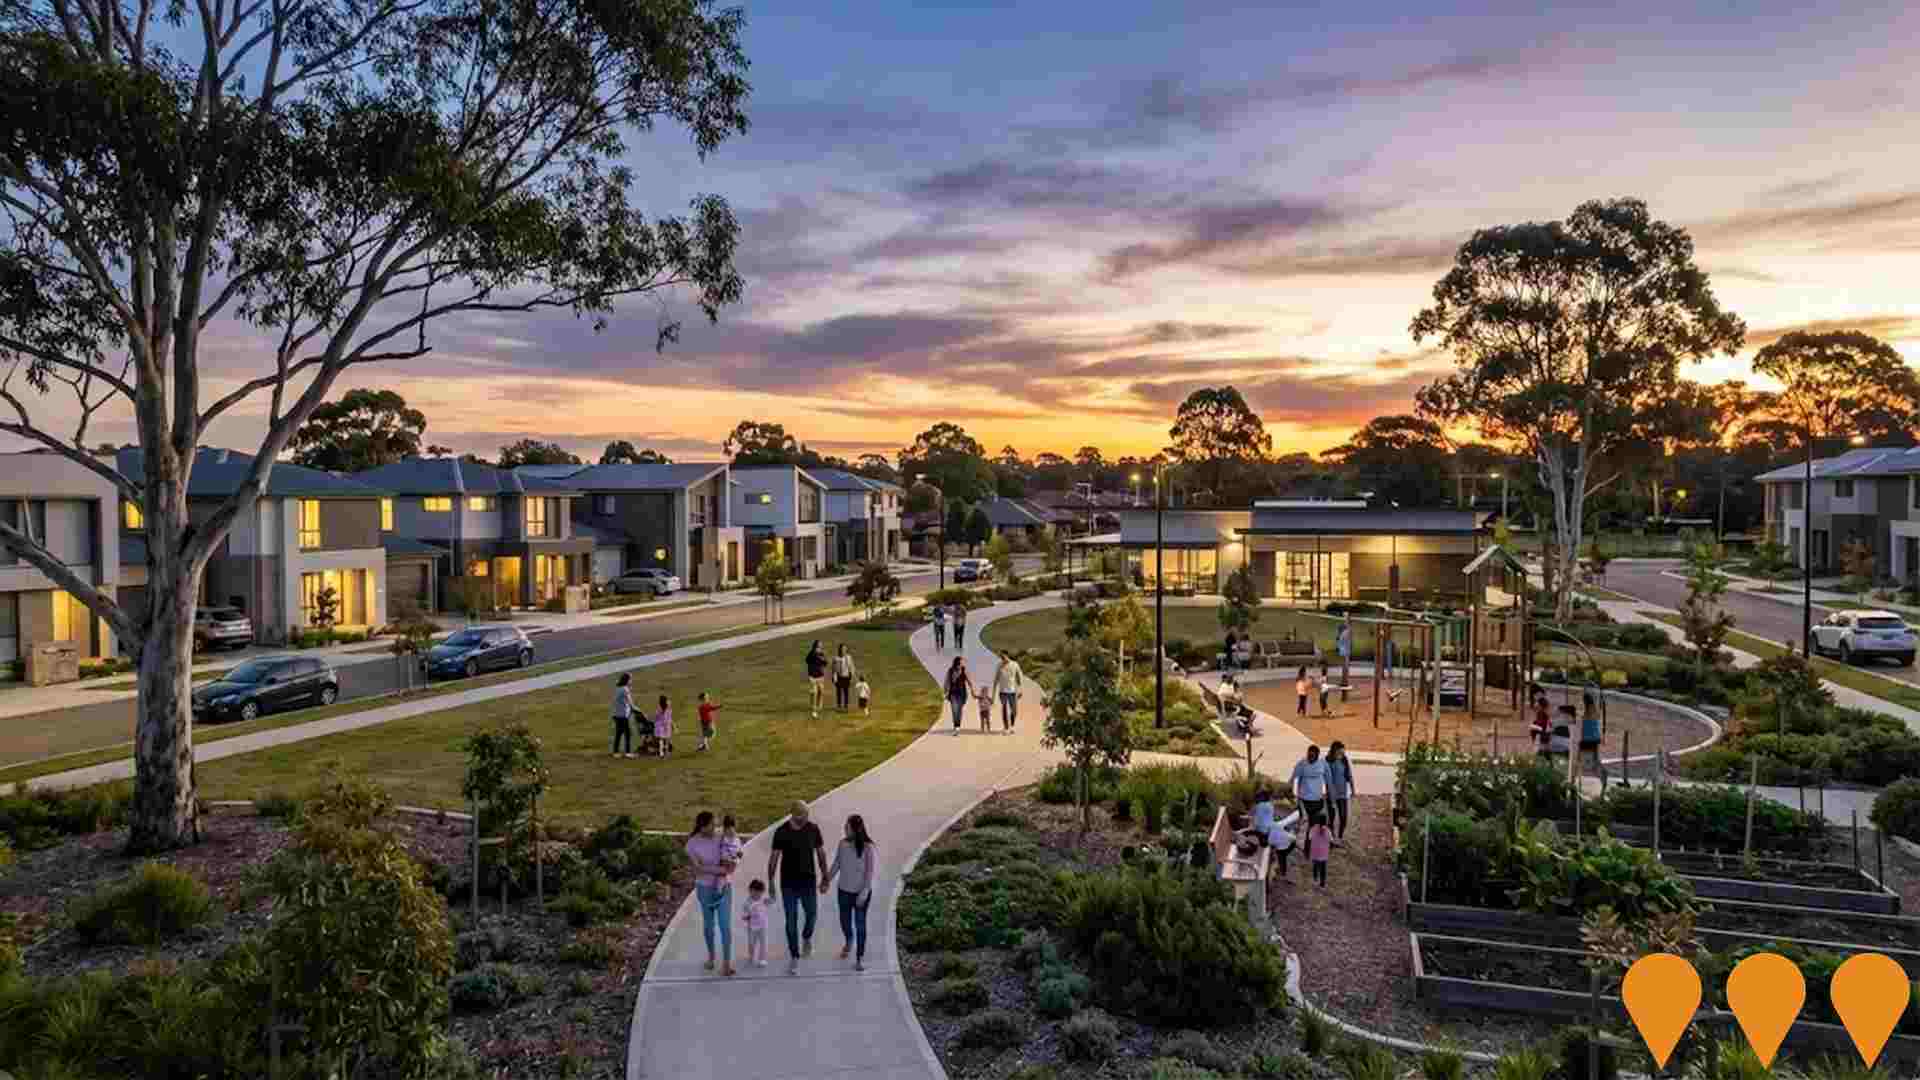
$400 million urban renewal project transforming former Bonnyrigg public housing estate into mixed-income community. Stage 3 includes 340 new homes with mix of social, affordable and private housing, plus community centre, park upgrades and retail spaces. Part of NSW Government's Communities Plus program.
Project Image

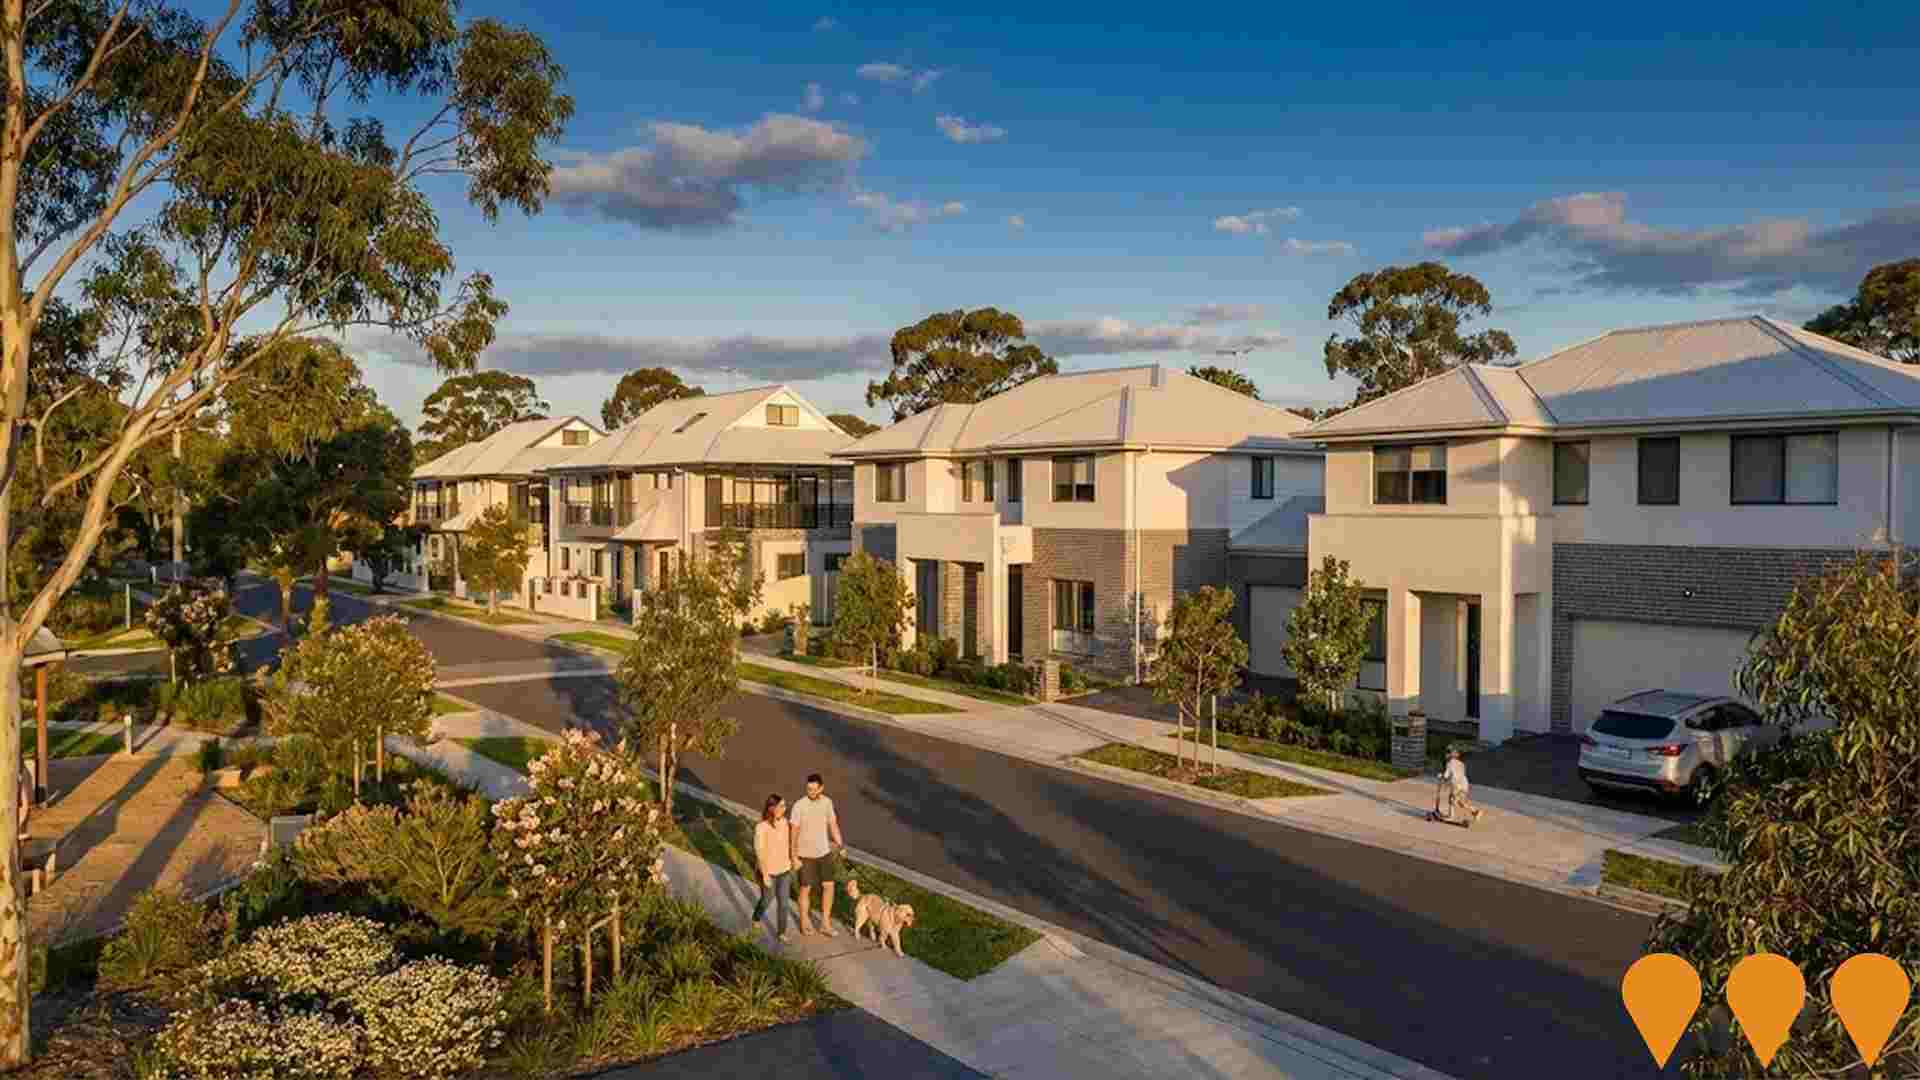
Canvas at Bonnyrigg
Category: Residential Development
Stage: Construction | Est. Comp: 2026
Source / Links: Link 1   Link 2  

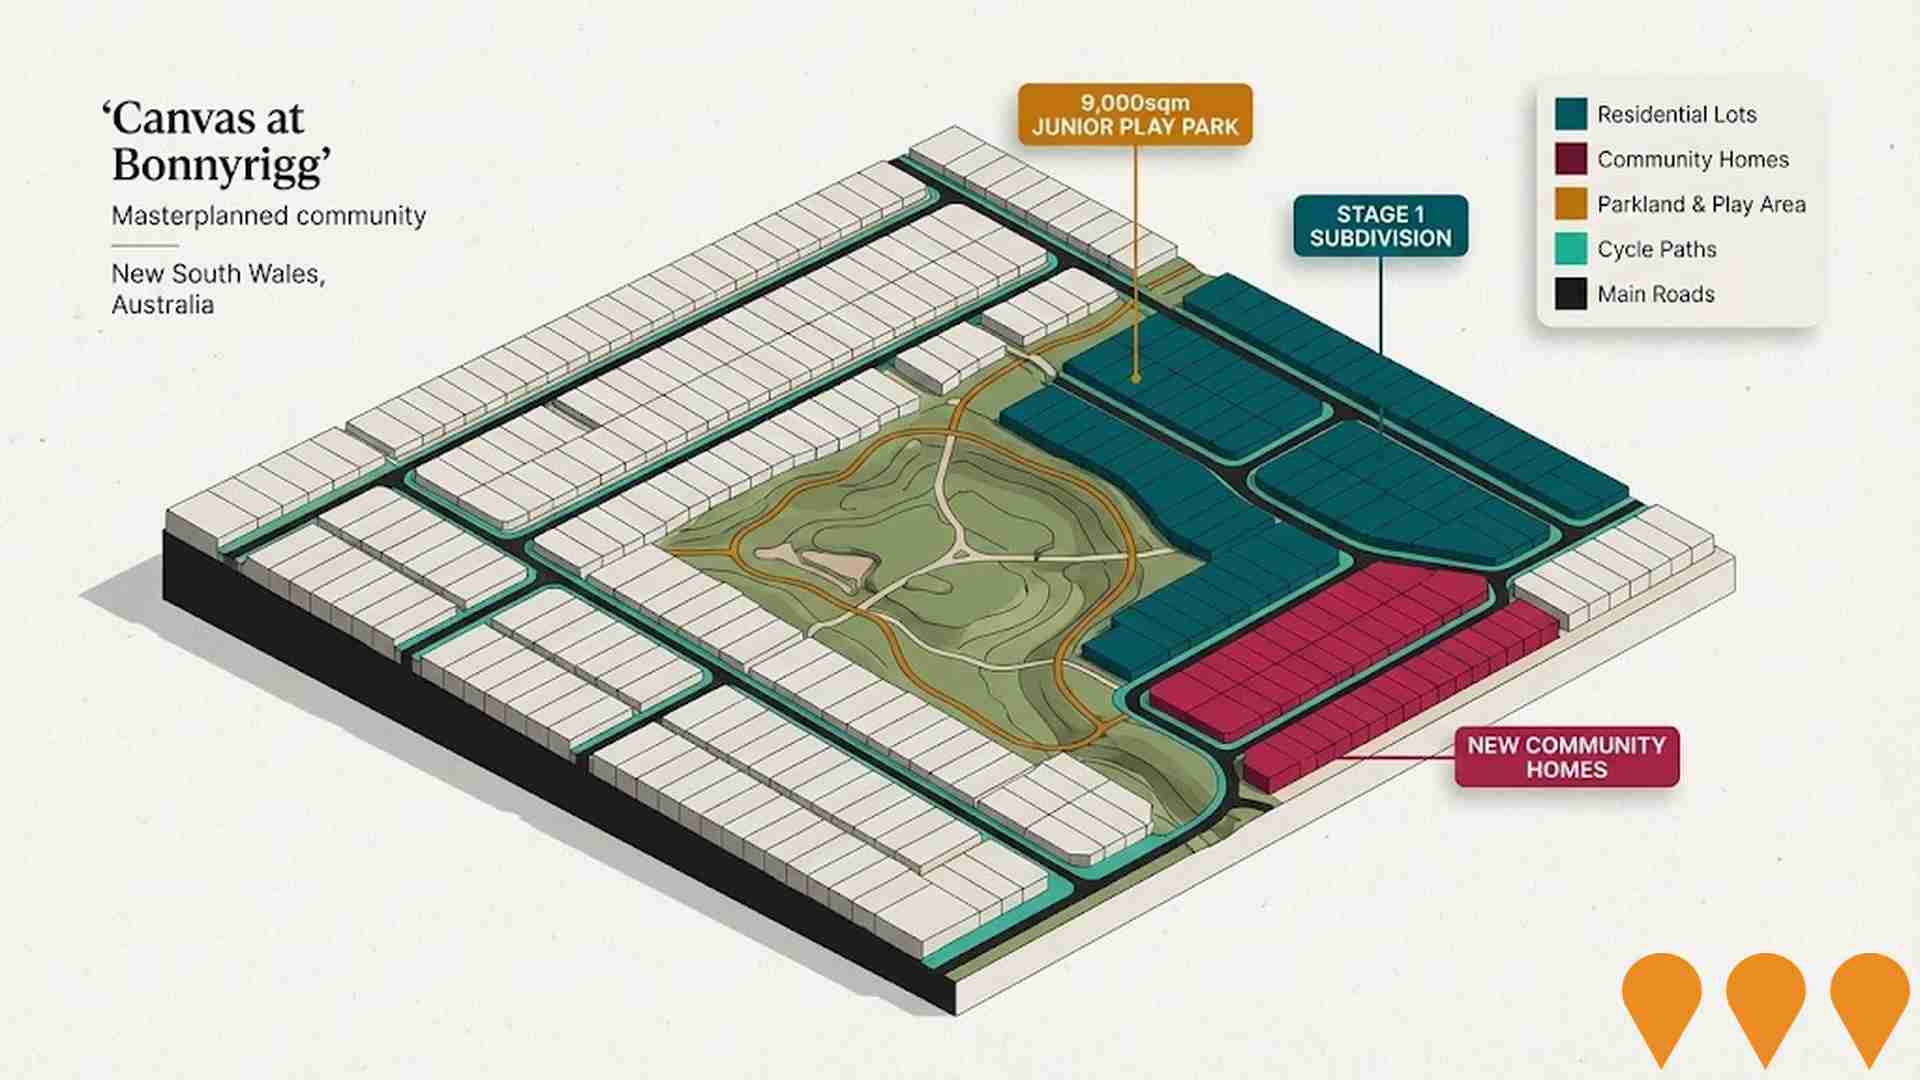
Canvas is a masterplanned community being developed as part of the Bonnyrigg Estate renewal. It will deliver 210 land lots for private sale and 65 new community homes, with the potential for more social homes in later stages. The project includes new and extended roads, as well as a new 9,000sqm public junior play park with play equipment, cycle paths, and picnic areas. Stage 1 subdivision works are currently progressing, with completion anticipated by the end of 2025. Land lots are available for purchase with an anticipated settlement in 2026.
Project Image

FLAIR - 27-33 Ascot Street
Category: Residential Development
Stage: Construction | Est. Comp: 2025
Source / Links: Link 1   Link 2  

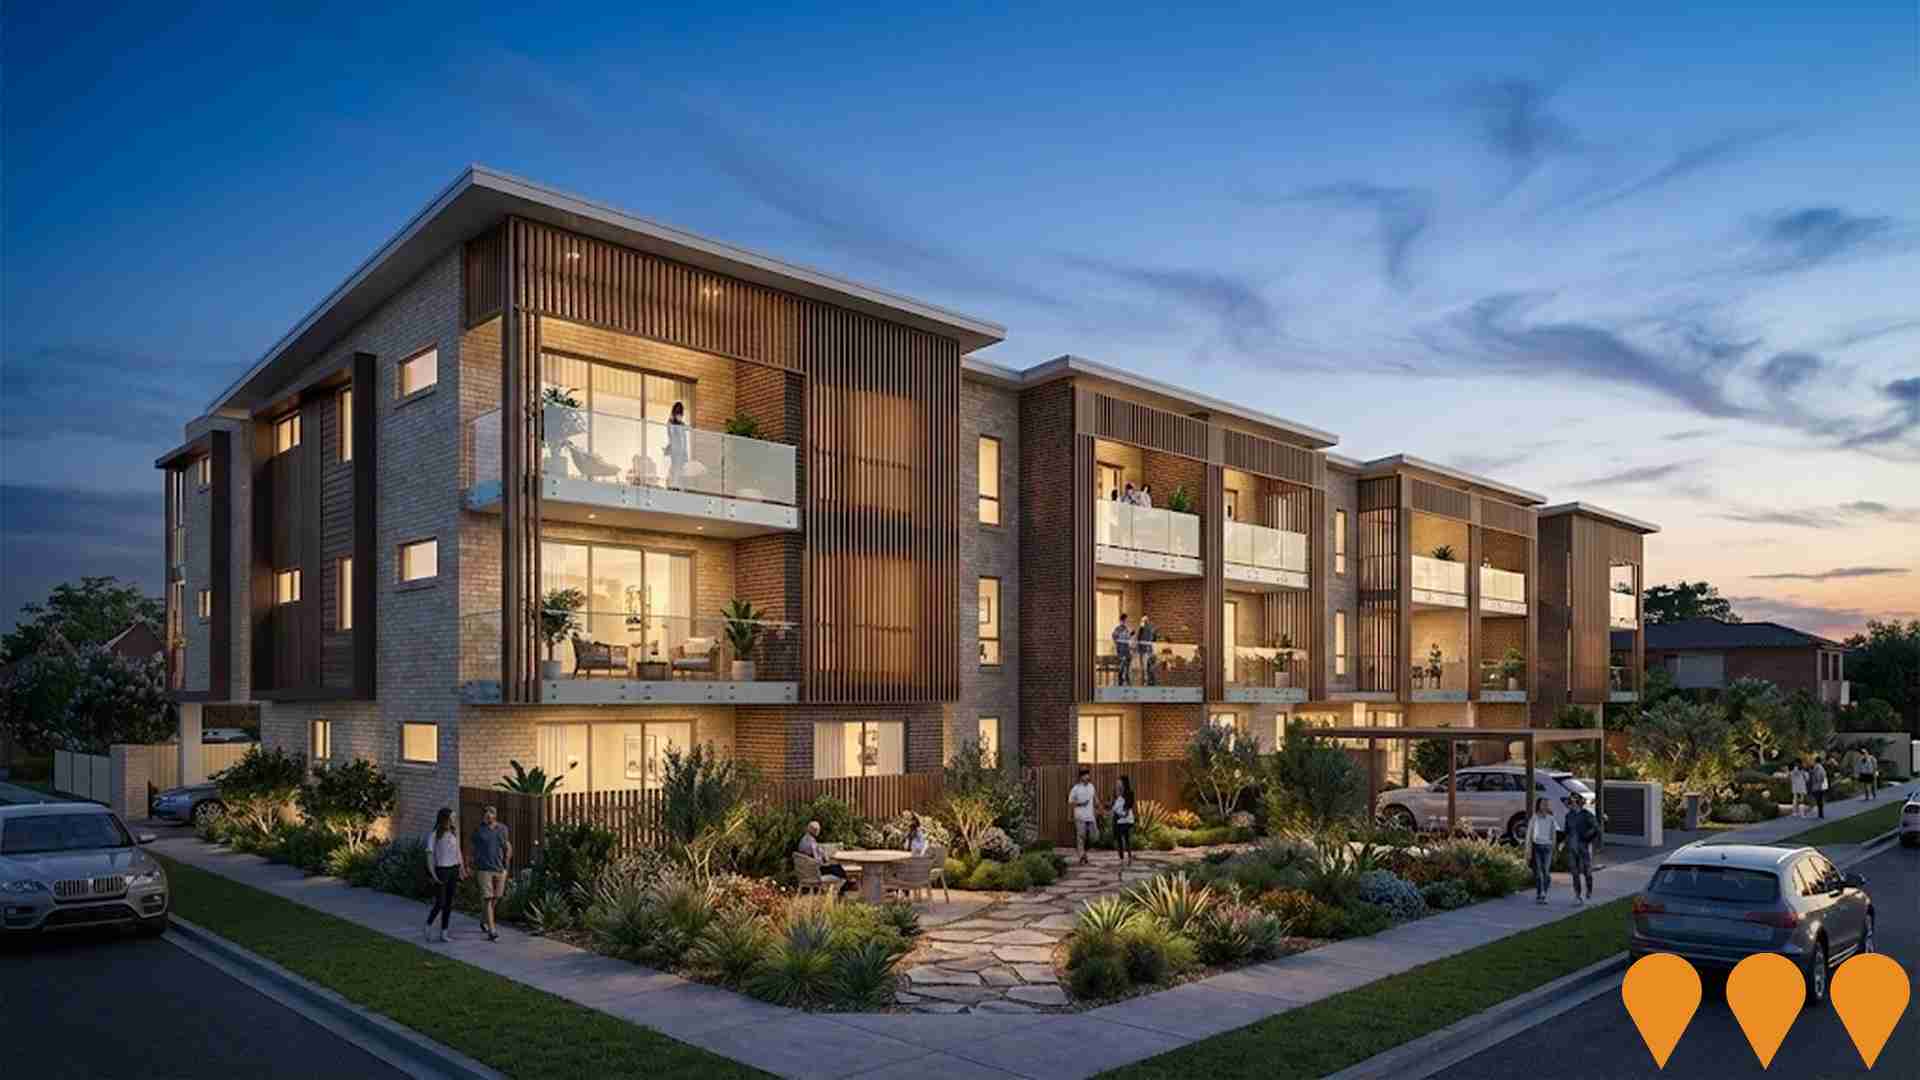
FLAIR offers a luxurious living experience with brand new 1, 2 & 3 bedroom apartments in Canley Heights. 74 residences with contemporary finishes, quality appliances and smart interior design. Features landscaped rooftop terrace with BBQ facilities, shared green space, secure underground parking, Caesarstone benchtops, Caroma tapware, and AEG appliances. Developed by Ascot, constructed by Tricon, and designed by Zhinar Architects. Six-floor mid-rise building with contemporary design featuring classic brick fa‡ade and vertical wooden slats.

Project Image

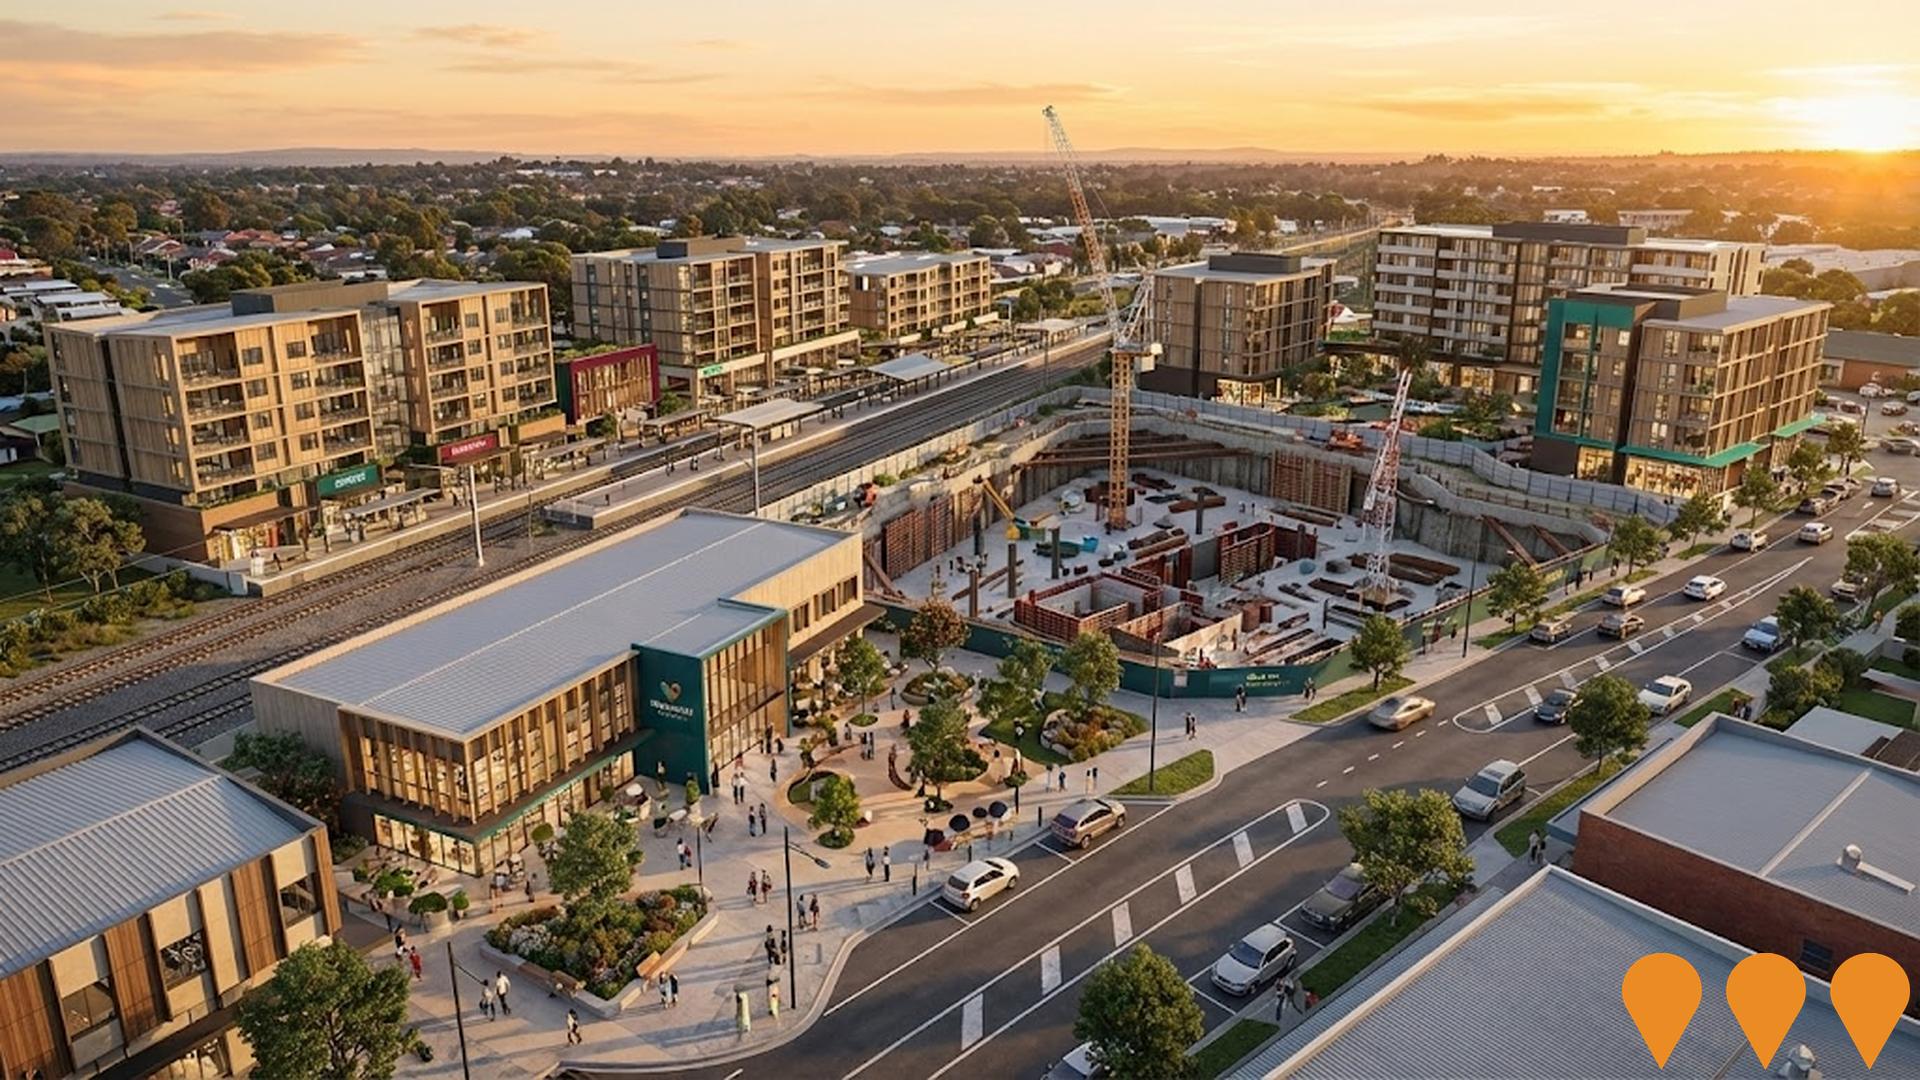
Mounties Mount Pritchard Upgrade
Category: Sports & Recreation
Stage: Construction | Est. Comp: N/A
Source / Links: Link 1   Link 2  

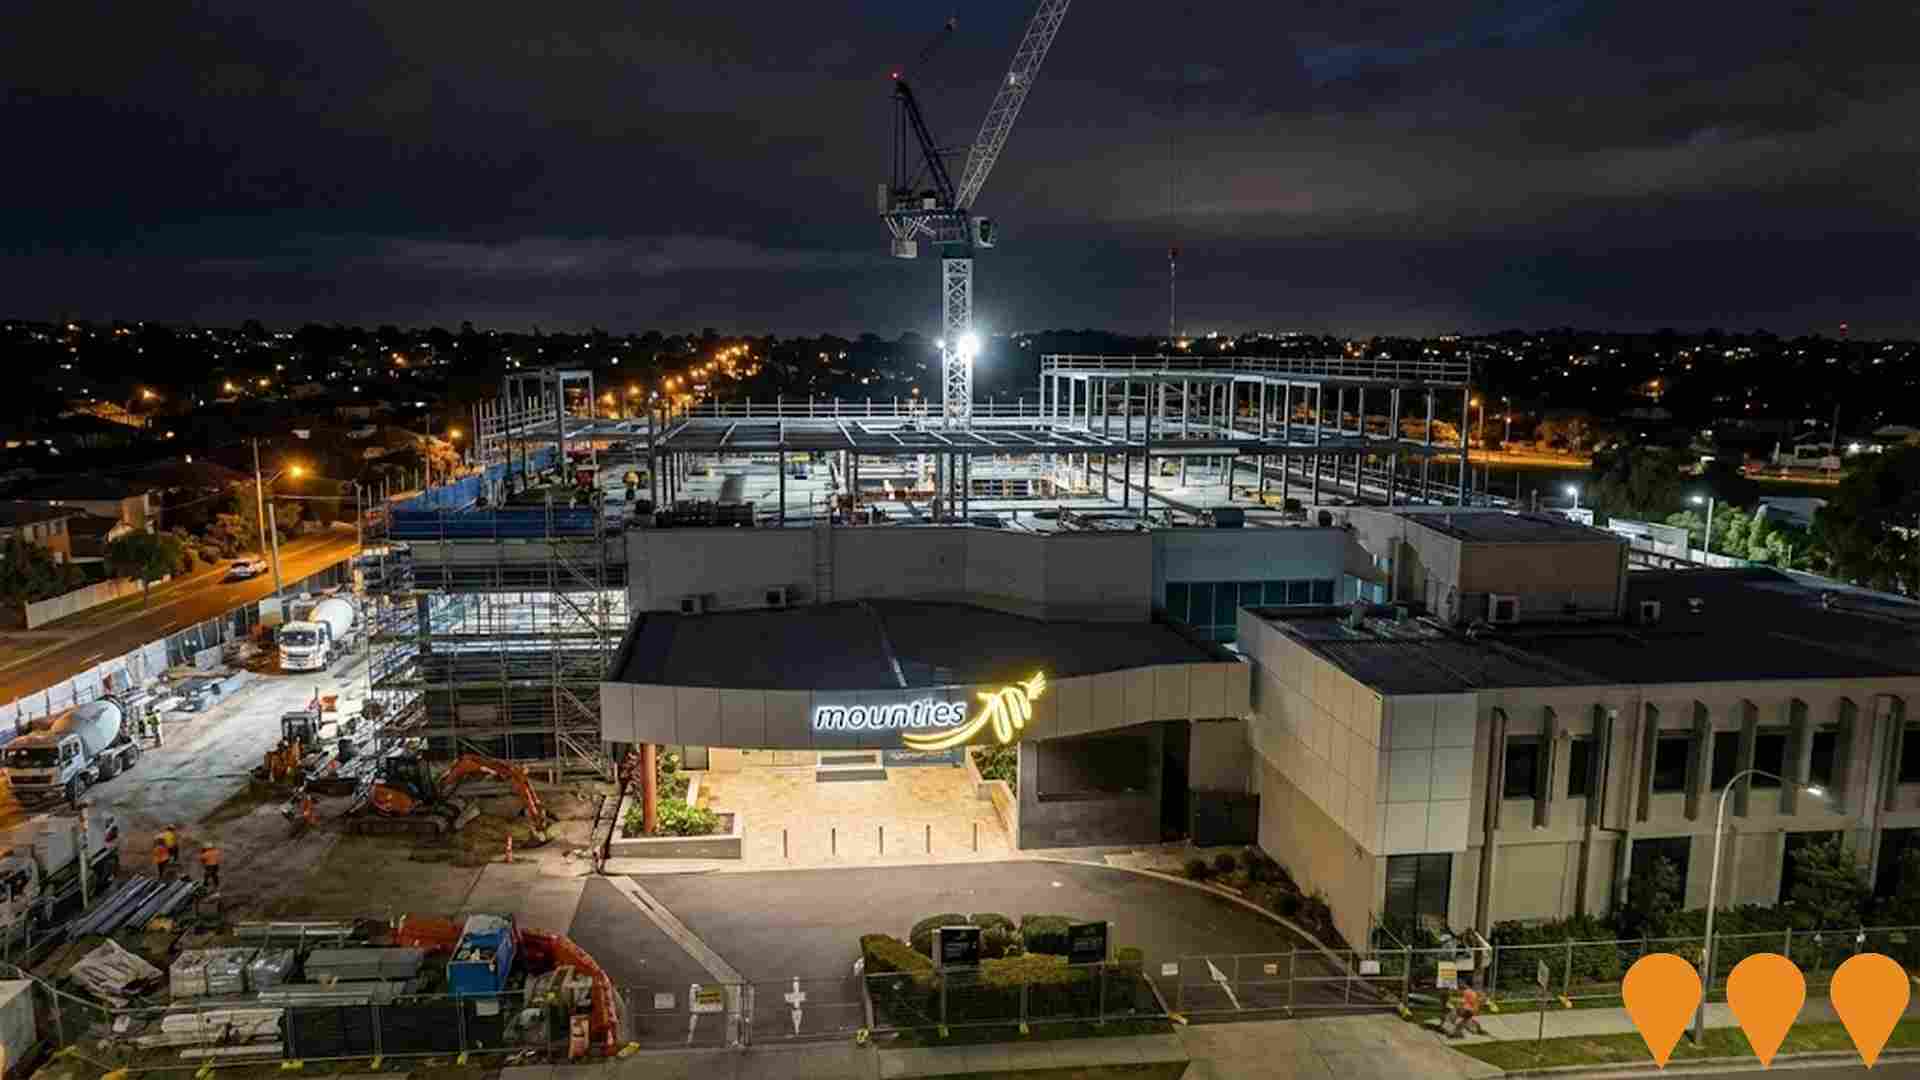
Staged master plan redevelopment of the Mounties club including a new four level basement car park, gaming refurbishments and extensions, new bars and dining, an auditorium and function facilities, a hotel component, and significant site infrastructure upgrades to expand capacity and improve member experience.
Project Image

Hurlstone Agricultural High School Redevelopment
Category: Education & Training
Stage: Construction | Est. Comp: 2025
Source / Links: Link 1   Link 2  

Major redevelopment by School Infrastructure NSW including two new student accommodation buildings, upgraded learning facilities, modernized agricultural teaching spaces, and enhanced residential facilities for this selective agricultural school.

Project Image

Employment

Table Chart PROFILE FAQ

AreaSearch analysis reveals Cabramatta West - Mount Pritchard recording weaker employment conditions than most comparable areas nationwide

Cabramatta West - Mount Pritchard has a skilled workforce with manufacturing and industrial sectors prominently featured. Its unemployment rate was 6.8% in the past year, with an estimated employment growth of 6.1%.

As of June 2025, 7,930 residents were employed while the unemployment rate stood at 2.6% above Greater Sydney's rate of 4.2%. Workforce participation was significantly lower at 42.9%, compared to Greater Sydney's 60.0%. Key industries of employment among residents included manufacturing, retail trade, and health care & social assistance, with manufacturing particularly notable at 2.3 times the regional average. Conversely, professional & technical services had a lower representation at 4.5% versus the regional average of 11.5%.

The area appeared to offer limited local employment opportunities, as indicated by the count of Census working population versus resident population. Between June 2024 and June 2025, employment levels increased by 6.1%, and labour force increased by 4.9%, resulting in a decrease in unemployment by 1.1 percentage points. In comparison, Greater Sydney recorded employment growth of 2.6% during the same period. State-level data from Sep-25 showed NSW employment had contracted by 0.41% (losing 19,270 jobs), with the state unemployment rate at 4.3%, favourably comparing to the national unemployment rate of 4.5%. Jobs and Skills Australia's national employment forecasts from May 2025 projected national employment growth of 6.6% over five years and 13.7% over ten years, with varying growth rates between industry sectors. Applying these projections to Cabramatta West - Mount Pritchard's employment mix suggested local growth of approximately 5.7% over five years and 12.3% over ten years.

Frequently Asked Questions - Employment

What is the employment situation in Cabramatta West - Mount Pritchard?
As of June 2025, Cabramatta West - Mount Pritchard has approximately 7,930 employed residents with an unemployment rate of 6.8%. The unemployment rate is moderate, indicating some available workforce capacity. The area faces employment challenges compared to other regions nationally.
How does Cabramatta West - Mount Pritchard's unemployment rate compare to the broader region?
As of June 2025, the unemployment rate in Cabramatta West - Mount Pritchard stands at 6.8%, which is 2.6 percentage points above Greater Sydney's rate of 4.2%. This higher unemployment rate may indicate local labour market challenges. For comparison, the national unemployment rate is 4.1%.
What are the major employment sectors in Cabramatta West - Mount Pritchard?
The employment landscape in Cabramatta West - Mount Pritchard is dominated by several key sectors. The largest employers are manufacturing (13.3% of employment), retail trade (13.1%), and health care & social assistance (12.2%). Other significant employers include transport, postal & warehousing and construction.
How has employment changed recently in Cabramatta West - Mount Pritchard?
Over the past year to June 2025, Cabramatta West - Mount Pritchard has experienced employment growth, with total employment increasing while the labour force increased. As a result, the unemployment rate has fall. By comparison, Greater Sydney saw employment increased and its unemployment rate rose.
What is the workforce participation rate in Cabramatta West - Mount Pritchard?
The workforce participation rate in Cabramatta West - Mount Pritchard is 42.9%, which represents the proportion of working-age residents who are either employed or actively seeking work. The relatively low participation rate may indicate limited job opportunities or demographic factors affecting workforce engagement. The local rate trailing the Greater Sydney average of 60.0%, suggesting potential for increased workforce participation.
Which industries are over-represented in Cabramatta West - Mount Pritchard's employment market?
Cabramatta West - Mount Pritchard shows notable specialization in manufacturing, which employs 13.3% of the local workforce compared to 5.7% regionally. With a local vs regional employment ratio of 2.3, this represents a significant industry cluster that likely serves markets beyond the local area. The area also shows above-average employment in 2 other sectors, contributing to a distinctive economic profile.
What are the employment growth prospects for Cabramatta West - Mount Pritchard?
Based on Jobs and Skills Australia projections applied to Cabramatta West - Mount Pritchard's industry mix, employment is expected to grow by 5.7% over the next five years and 12.3% over ten years. This compares to national growth expectations of 6.6% over five years. Steady growth is anticipated across multiple sectors, providing diverse employment opportunities.
How does the job market in Cabramatta West - Mount Pritchard compare nationally?
Cabramatta West - Mount Pritchard's employment market shows weaker performance compared to most areas nationally. This suggests the need for targeted economic development initiatives. Recent job advertisement trends show the broader employment region saw a 13.1% decline, ranking 19.0th out of 37 regions nationally.
What employment opportunities exist for skilled workers in Cabramatta West - Mount Pritchard?
Skilled workers will find good opportunities in Cabramatta West - Mount Pritchard, with skilled sectors accounting for 29.2% of employment. Key sectors for skilled workers include health care & social assistance (12.2%), education & training (6.5%), and finance & insurance (4.7%). With projected employment growth of 5.7% over five years, demand for skilled workers is expected to remain strong.

Income

Table Chart PROFILE FAQ

Income levels sit below national averages according to AreaSearch assessment

According to AreaSearch's aggregation of the latest postcode level ATO data released for financial year 2022, Cabramatta West - Mount Pritchard had a median income among taxpayers of $45,272. The average level stood at $53,525. This was below the national average and compared to levels of $56,994 and $80,856 across Greater Sydney respectively. Based on Wage Price Index growth of 10.6% since financial year 2022, current estimates would be approximately $50,071 (median) and $59,199 (average) as of March 2025. According to 2021 Census figures, individual incomes lagged at the 4th percentile with $497 weekly income. Household income performed better at the 32nd percentile. Distribution data showed that 30.6% of the population (5,682 individuals) fell within the $1,500 - $2,999 income range, reflecting patterns seen regionally where 30.9% similarly occupied this range. Housing affordability pressures were severe with only 80.1% of income remaining, ranking at the 27th percentile.

Frequently Asked Questions - Income

What is the median taxable income in Cabramatta West - Mount Pritchard?
Based on Wage Price Index adjustments to March 2025, the estimated median taxable income in Cabramatta West - Mount Pritchard is approximately $50,071. The official ATO data from FY-22 recorded a median of $45,272.
What is the average taxable income in Cabramatta West - Mount Pritchard?
Based on Wage Price Index adjustments to March 2025, the estimated average taxable income in Cabramatta West - Mount Pritchard is approximately $59,199. The official ATO data from FY-22 recorded an average of $53,525.
How does the median taxable income in Cabramatta West - Mount Pritchard compare to the region?
Based on Wage Price Index adjustments to March 2025, the estimated median taxable income in Cabramatta West - Mount Pritchard is approximately $50,071 compared to $63,035 in Greater Sydney. The official ATO data from FY-22 shows $45,272 and $56,994 respectively.
How does the average taxable income in Cabramatta West - Mount Pritchard compare to the region?
Based on Wage Price Index adjustments to March 2025, the estimated average taxable income in Cabramatta West - Mount Pritchard is approximately $59,199 compared to $89,427 in Greater Sydney. The official ATO data from FY-22 shows $53,525 and $80,856 respectively.
What are the main income cohorts in Cabramatta West - Mount Pritchard according to the 2021 Census?
As per the 2021 Census, the income bracket containing the largest proportion (~30.6% / 5,682 persons) of Cabramatta West - Mount Pritchard's population is the $1,500 - 2,999 cohort.
How do the main income cohorts in Cabramatta West - Mount Pritchard compare to the region?
The largest income cohort in Cabramatta West - Mount Pritchard is the $1,500 - 2,999 group, representing about 30.6% of the population. In comparison, Greater Sydney's largest income cohort is the $1,500 - 2,999 group, representing 30.9% of its population, according to the 2021 Census.
What is the median household income in Cabramatta West - Mount Pritchard according to the 2021 Census?
The 2021 Census data indicates that the median household income in Cabramatta West - Mount Pritchard is $1,440/wk.
What is the median family income in Cabramatta West - Mount Pritchard according to the 2021 Census?
According to the 2021 Census, the median family income in Cabramatta West - Mount Pritchard is $1,520/wk.
What is the median personal income in Cabramatta West - Mount Pritchard according to the 2021 Census?
The 2021 Census shows that the median personal income in Cabramatta West - Mount Pritchard is $497/wk.
How does Cabramatta West - Mount Pritchard's income rank nationally?
Cabramatta West - Mount Pritchard's income level is below the national average according to the latest ATO data aggregated by AreaSearch for FY-22. Cabramatta West - Mount Pritchard's median income among taxpayers is $45,272 and the average income stands at $53,525, which compares to figures for Greater Sydney's of $56,994 and $80,856 respectively. Based on Wage Price Index growth of 10.6% since FY-22, current estimates would be approximately $50,071 (median) and $59,199 (average) as of March 2025.
What is the disposable income in Cabramatta West - Mount Pritchard?
The estimated disposable income in Cabramatta West - Mount Pritchard is $4,999 per year according to AreaSearch analysis.
How does Cabramatta West - Mount Pritchard's disposable income compare to the region?
Cabramatta West - Mount Pritchard's disposable income is $4,999 compared to $7,412 for Greater Sydney, based on AreaSearch analysis.

Housing

Table Chart PROFILE FAQ

Cabramatta West - Mount Pritchard is characterized by a predominantly suburban housing profile, with ownership patterns similar to the broader region

Cabramatta West - Mount Pritchard had 86.5% houses and 13.4% other dwellings as of the latest Census, compared to Sydney metro's 73.3% houses and 26.7% other dwellings. Home ownership in Cabramatta West - Mount Pritchard was 30.7%, with mortgaged dwellings at 32.5% and rented ones at 36.9%. The median monthly mortgage repayment was $1,950, below Sydney metro's average of $2,000. The median weekly rent was $380, compared to Sydney metro's $400. Nationally, Cabramatta West - Mount Pritchard's mortgage repayments were higher at $1,950 versus the Australian average of $1,863, and rents were also higher at $380 compared to the national figure of $375.

Frequently Asked Questions - Housing

What percentage of homes are owned vs rented in Cabramatta West - Mount Pritchard?
In Cabramatta West - Mount Pritchard, 30.7% of homes are owned outright, 32.5% are owned with a mortgage, and 36.9% are rented.
What percentage of dwellings in Cabramatta West - Mount Pritchard are houses?
According to the latest data, 86.5% of dwellings in Cabramatta West - Mount Pritchard are houses.
What percentage of dwellings in Cabramatta West - Mount Pritchard are apartments or units?
In Cabramatta West - Mount Pritchard, 3.2% of dwellings are apartments or units, with an additional 10.0% being semi-detached dwellings.
What is the level of outright home ownership in Cabramatta West - Mount Pritchard?
Outright home ownership in Cabramatta West - Mount Pritchard stands at 30.7%, compared to 33.4% in Greater Sydney.
What is the median monthly mortgage repayment in Cabramatta West - Mount Pritchard?
The median monthly mortgage repayment in Cabramatta West - Mount Pritchard is $1,950, compared to $2,000 in Greater Sydney.
What is the median weekly rent in Cabramatta West - Mount Pritchard?
The median weekly rent in Cabramatta West - Mount Pritchard is $380, compared to $400 in Greater Sydney.
What is the distribution of rental prices in Cabramatta West - Mount Pritchard?
In Cabramatta West - Mount Pritchard, 12.3% of rentals are $0-149/week, 27.9% are $150-349/week, 56.8% are $350-649/week, 2.6% are $650-949/week, and 0.3% are $950+/week.
What is the average monthly housing cost in Cabramatta West - Mount Pritchard?
The aggregate monthly housing cost in Cabramatta West - Mount Pritchard is $1,241, which represents the average monthly cost across all housing types.
What percentage of income do residents spend on housing?
In Cabramatta West - Mount Pritchard, households with mortgages typically spend 31.2% of their income on mortgage repayments, while renters spend 26.4% of their income on rent.
How crowded are homes in Cabramatta West - Mount Pritchard?
The average persons per bedroom ratio in Cabramatta West - Mount Pritchard is 1.0, indicating the level of household density.
How does housing affordability in Cabramatta West - Mount Pritchard compare to the region?
Housing affordability in Cabramatta West - Mount Pritchard shows mortgage holders spending 31.2% of income on repayments (vs 32.7% regionally), while renters spend 26.4% of income on rent (vs 28.3% regionally).
What types of dwellings are most common in Cabramatta West - Mount Pritchard?
The dwelling mix in Cabramatta West - Mount Pritchard consists of 86.5% detached houses, 10.0% semi-detached dwellings, 3.2% apartments, and 0.2% other dwelling types.
What is the weighted average housing cost based on tenure mix in Cabramatta West - Mount Pritchard?
Based on the area's tenure composition, the weighted average monthly housing cost is approximately $1,241. This accounts for outright owners paying no housing costs, mortgage holders paying $1,950.0/month, and renters paying $1,645/month.
How affordable is housing in Cabramatta West - Mount Pritchard relative to local incomes?
Housing in Cabramatta West - Mount Pritchard consumes approximately 19.9% of median household income ($6,235 monthly), indicating costs are highly affordable. The generally accepted benchmark is that housing should not exceed 30% of household income.
How do proposed developments compare to existing housing types in Cabramatta West - Mount Pritchard?
Recent development applications in Cabramatta West - Mount Pritchard show attached dwellings contributing 28% of approvals compared to 14% of existing stock, while detached houses represent 72% of applications versus 86% of current dwellings. This suggests increasing densification. Housing density growth is around the national average.

Household Composition

Table Chart PROFILE FAQ

Cabramatta West - Mount Pritchard features high concentrations of family households, with a higher-than-average median household size

Family households account for 80.2% of all households, including 39.7% couples with children, 16.2% couples without children, and 22.3% single parent families. Non-family households make up the remaining 19.8%, consisting of 17.9% lone person households and 2.0% group households. The median household size is 3.3 people, which is larger than the Greater Sydney average of 3.2.

Frequently Asked Questions - Households

How many households are in Cabramatta West - Mount Pritchard?
As of the 2021 Census, Cabramatta West - Mount Pritchard had 5,154 households. Based on population growth patterns, this has grown by approximately 1.8% to an estimated 5,245 households today.
What is the typical household size?
The median household size in Cabramatta West - Mount Pritchard is 3.3 people. This compares to 3.2 in Greater Sydney and reflects the area's household composition mix.
What types of households are most common?
Family households dominate at 80.2% of all households. The remaining households consist of lone person households (17.9%), group households (2.0%), and other household types (0.0%).
How are families structured in the area?
Among the 4,133 family households, 39.7% are couples with children, 16.2% are couples without children at home, and 22.3% are single parent families. This mix shapes local demand for schools, family services, and housing types.
How does Cabramatta West - Mount Pritchard compare to regional household patterns?
Compared to Greater Sydney, Cabramatta West - Mount Pritchard shows distinct household patterns. This higher proportion of single-person households drives demand for smaller dwellings and different community services.
What is the average family size?
Families in Cabramatta West - Mount Pritchard have an average of 1.8 children, matching the Greater Sydney average of 1.8. This influences local demand for child-related services and larger family homes.
What are the marriage patterns in Cabramatta West - Mount Pritchard?
Marriage patterns reveal 42.2% of the adult population are currently married, while 37.2% have never married. This compares to 46.7% married and 34.7% never married across Greater Sydney.
How significant are single-person households?
Single-person households represent 17.9% of all households in Cabramatta West - Mount Pritchard, similar to the regional average of 16.8%. This affects demand for smaller dwellings and single-person accommodation.
Are shared living arrangements common?
Group households (unrelated people sharing) account for 2.0% of households, well below the Greater Sydney average of 2.2%. This low rate suggests limited student or young professional shared accommodation.
Loading household composition data...

Local Schools & Education

Table Chart PROFILE FAQ

Cabramatta West - Mount Pritchard faces educational challenges, with performance metrics placing it in the bottom quartile of areas assessed nationally

The area faces educational challenges, with university qualification rates at 15.9%, substantially below the Greater Sydney average of 38.0%. This presents both a challenge and an opportunity for targeted educational initiatives. Bachelor degrees lead at 12.8%, followed by postgraduate qualifications at 2.3% and graduate diplomas at 0.8%. Trade and technical skills are prominent, with 25.2% of residents aged 15+ holding vocational credentials - advanced diplomas at 8.5% and certificates at 16.7%.

Educational participation is high, with 32.5% of residents currently enrolled in formal education, including 10.6% in primary education, 10.1% in secondary education, and 5.8% pursuing tertiary education. The area's four schools have a combined enrollment of 1,447 students, with typical Australian school conditions (ICSEA: 957) offering balanced educational opportunities. The educational mix includes three primary schools and one K-12 school. Limited local school capacity (7.8 places per 100 residents vs 17.4 regionally) means many families travel to nearby areas for schooling.

Frequently Asked Questions - Education

What percentage of people in Cabramatta West - Mount Pritchard have university qualifications?
15.9% of people aged 15 and over in Cabramatta West - Mount Pritchard have university qualifications, compared to 16.8% in the broader region.
What percentage of people in Cabramatta West - Mount Pritchard have no formal qualifications?
58.9% of people aged 15 and over in Cabramatta West - Mount Pritchard have no formal qualifications, compared to 58.2% regionally.
How does Cabramatta West - Mount Pritchard's education level compare to national averages?
Cabramatta West - Mount Pritchard ranks in the 15th percentile nationally for education based on AreaSearch's analysis of qualification and performance metrics.
What types of qualifications are most common in Cabramatta West - Mount Pritchard?
The most common qualifications in Cabramatta West - Mount Pritchard are: Certificate (16.7%), Bachelor Degree (12.8%), Advanced Diploma (8.5%).
What proportion of Cabramatta West - Mount Pritchard's population is currently attending educational institutions?
32.5% of the population in Cabramatta West - Mount Pritchard is currently engaged in formal education, with 10.6% in primary school, 10.1% in secondary school, 5.8% at university.
What is the ICSEA score for schools in Cabramatta West - Mount Pritchard?
The average ICSEA (Index of Community Socio-Educational Advantage) score for schools in Cabramatta West - Mount Pritchard is 957, indicating below-average socio-educational advantage compared to the national average of 1000.
How many schools are located within Cabramatta West - Mount Pritchard?
There are 4 schools within Cabramatta West - Mount Pritchard, with a combined enrollment of approximately 1,447 students.
What types of schools are available in Cabramatta West - Mount Pritchard?
Cabramatta West - Mount Pritchard includes 3 primary schools, 1 combined school.

Schools Detail

Nearby Services & Amenities

PROFILE FAQ

Transport

Table Chart PROFILE FAQ

Transport servicing is good compared to other areas nationally based on assessment of service frequency, route connectivity and accessibility

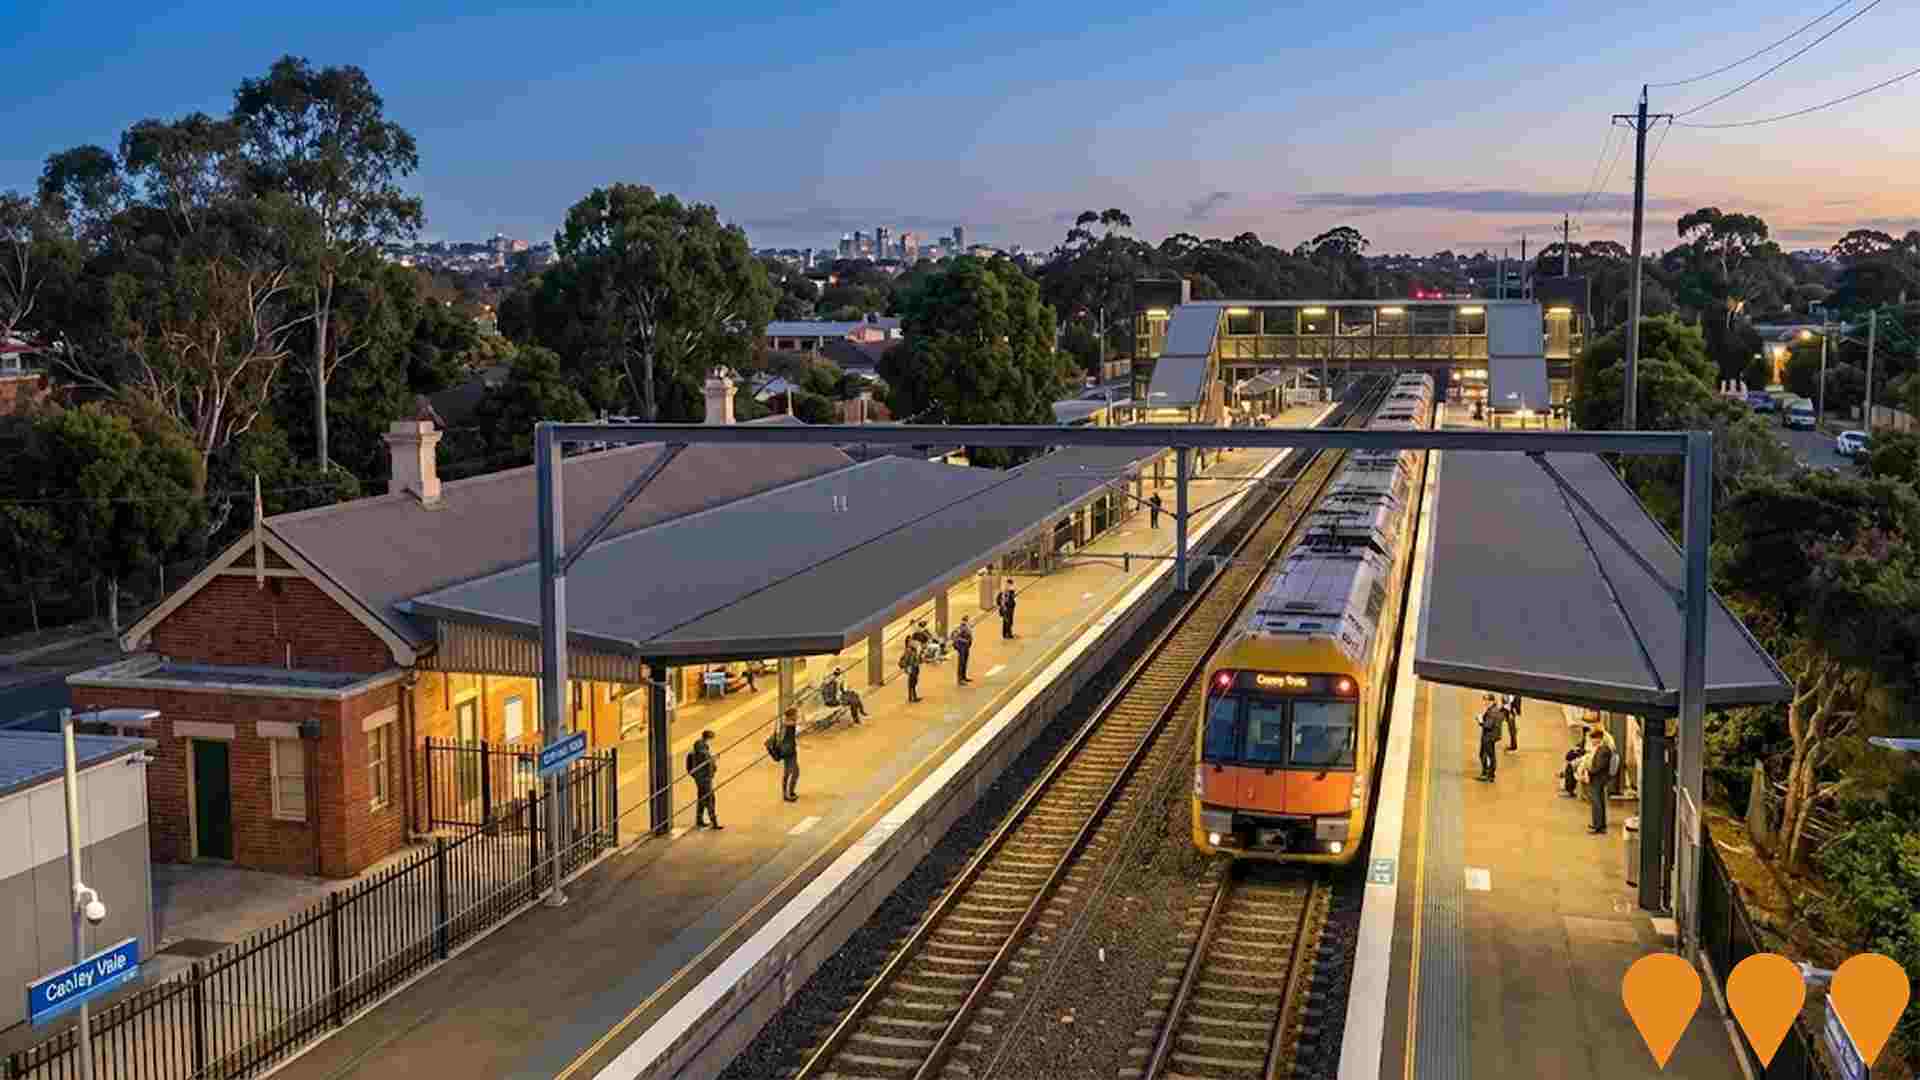
The analysis of public transport in Cabramatta West - Mount Pritchard shows that there are currently 119 active transport stops operating. These stops offer a variety of bus services. There are 42 individual routes servicing these stops, which together provide a total of 2,008 weekly passenger trips.

The accessibility to public transport in the area is rated as excellent, with residents on average being located just 139 meters away from the nearest transport stop. The service frequency across all routes averages at 286 trips per day, which equates to approximately 16 weekly trips per individual stop.

Frequently Asked Questions - Transport

How many public transport stops are in Cabramatta West - Mount Pritchard?
There are 119 public transport stops within Cabramatta West - Mount Pritchard.
How frequent are the transport services in Cabramatta West - Mount Pritchard?
Cabramatta West - Mount Pritchard has 2,008 weekly trips across 42 routes, averaging 286 trips per day.
How far are residents from public transport in Cabramatta West - Mount Pritchard?
On average, residential properties are 139 meters from the nearest transport stop.

Transport Stops Detail

Health

Table Chart PROFILE FAQ

Cabramatta West - Mount Pritchard's residents are extremely healthy with both young and old age cohorts seeing low prevalence of common health conditions

Analysis of health metrics shows strong performance throughout Cabramatta West - Mount Pritchard, with both young and old age cohorts seeing low prevalence of common health conditions. The rate of private health cover is found to be very low at approximately 47% of the total population (~8,727 people), compared to the national average of 55.3%.

The most common medical conditions in the area are arthritis and diabetes, impacting 6.0 and 6.0% of residents respectively, while 76.5% declared themselves as completely clear of medical ailments, compared to 75.6% across Greater Sydney. The area has 17.0% of residents aged 65 and over (3,156 people), which is lower than the 19.0% in Greater Sydney. Health outcomes among seniors are above average, broadly in line with the general population's health profile.

Frequently Asked Questions - Health

How many people in Cabramatta West - Mount Pritchard have private health insurance?
Around 47.0% of people in Cabramatta West - Mount Pritchard are covered by private health insurance, which compares to 47.7% in the broader region of Greater Sydney.
What percentage of the population requires ongoing medical assistance in Cabramatta West - Mount Pritchard?
In Cabramatta West - Mount Pritchard, 7.7% of the population is identified as requiring ongoing medical assistance. This figure is slightly different from the regional average, where 9.3% of people in Greater Sydney require similar assistance.
How prevalent is asthma in Cabramatta West - Mount Pritchard?
5.5% of people in Cabramatta West - Mount Pritchard are diagnosed with asthma. In comparison, 5.0% of the population across Greater Sydney is affected by asthma.
What percentage of people have diabetes in Cabramatta West - Mount Pritchard?
Diabetes affects 6.0% of the Cabramatta West - Mount Pritchard population, while in the surrounding region, 6.4% of people are diagnosed with diabetes.
What is the percentage of people with heart disease in Cabramatta West - Mount Pritchard?
2.9% of people in Cabramatta West - Mount Pritchard have heart disease. Across the region of Greater Sydney, 3.4% of the population is affected by heart disease.
How does Cabramatta West - Mount Pritchard compare to the region in terms of overall private health coverage?
In Cabramatta West - Mount Pritchard, 47.0% of the population are estimated to have private health insurance. Comparatively, Greater Sydney sees an estimated private health coverage rate of 47.7%.

Cultural Diversity

Table Chart PROFILE FAQ

Cabramatta West - Mount Pritchard is among the most culturally diverse areas in the country based on AreaSearch assessment of a range of language and cultural background related metrics

Cabramatta West-Mount Pritchard is one of Australia's most culturally diverse areas, with 52.8% of its population born overseas and 70.8% speaking a language other than English at home. The predominant religion in Cabramatta West-Mount Pritchard is Christianity, comprising 42.9% of the population. However, Buddhism is significantly overrepresented, making up 28.2% of the population compared to Greater Sydney's average of 21.7%.

In terms of ancestry, Vietnamese people comprise 25.3%, which is higher than the regional average of 17.8%. The category 'Other' comprises 19.9%, lower than the regional average of 32.7%. Chinese people make up 11.7% of the population. Notably, Serbian (3.5%), Samoan (2.2%), and Lebanese (3.1%) ethnic groups are overrepresented compared to their respective regional averages of 1.8%, 1.0%, and 1.8%.

Frequently Asked Questions - Diversity

What is the level of cultural diversity in Cabramatta West - Mount Pritchard?
Cabramatta West - Mount Pritchard is among the most culturally diverse areas in the country, with 52.8% of its population born overseas and 70.8% speaking a language other than English at home.
What is the most common religion in Cabramatta West - Mount Pritchard?
The main religion in Cabramatta West - Mount Pritchard was found to be Christianity, which makes up 42.9% of people in Cabramatta West - Mount Pritchard. However, the most apparent overrepresentation was in Buddhism, which comprises 28.2% of the population, substantially higher than the Greater Sydney average of 21.7%.
What are the top countries of origin in Cabramatta West - Mount Pritchard?
In terms of ancestry (country of birth of parents), the top three represented groups in Cabramatta West - Mount Pritchard are Vietnamese, comprising 25.3% of the population, which is substantially higher than the regional average of 17.8%, Other, comprising 19.9% of the population, which is notably lower than the regional average of 32.7%, and Chinese, comprising 11.7% of the population. Additionally, there are notable divergences in the representation of certain other ethnic groups: Serbian is notably overrepresented at 3.5% of Cabramatta West - Mount Pritchard (vs 1.8% regionally), Samoan at 2.2% (vs 1.0%) and Lebanese at 3.1% (vs 1.8%).
How does the percentage of people born overseas compare to the regional average?
52.8% of the Cabramatta West - Mount Pritchard population was born overseas, compared to 59.2% regionally.
What percentage of the Cabramatta West - Mount Pritchard population speaks a language other than English at home?
70.8% of the population in Cabramatta West - Mount Pritchard speaks a language other than English at home, compared to 74.6% in the wider region.
How many people in Cabramatta West - Mount Pritchard identify as Australian Aboriginal?
1.2% of the Cabramatta West - Mount Pritchard population identifies as Australian Aboriginal, compared to 0.7% in the region.
What is the citizenship status of the population in Cabramatta West - Mount Pritchard?
81.7% of the Cabramatta West - Mount Pritchard population holds citizenship, compared to 78.5% in the wider region.

Age

Table Chart PROFILE FAQ

Cabramatta West - Mount Pritchard's population is slightly younger than the national pattern

Cabramatta West - Mount Pritchard has a median age of 37, matching Greater Sydney's figure of 37 and closely aligning with Australia's median age of 38 years. The age group of 55-64 is notably represented at 12.9%, higher than Greater Sydney's percentage, while the 35-44 cohort is less prevalent at 11.9%. Between 2021 and present, the 65 to 74 age group has increased from 8.1% to 9.6% of the population. Conversely, the 5 to 14 age group has decreased from 13.6% to 12.0%. By 2041, demographic projections indicate significant shifts in Cabramatta West - Mount Pritchard's age structure. The 75 to 84 age group is expected to grow by 85%, reaching 1,778 people from a previous count of 961, totaling an increase of 816 individuals. This growth reflects the aging population trend, with those aged 65 and above accounting for 85% of projected population growth. Meanwhile, the 25 to 34 and 0 to 4 age cohorts are anticipated to experience population declines in the coming years.

Frequently Asked Questions - Age

What is the median age in Cabramatta West - Mount Pritchard?
According to the latest data, the median age in Cabramatta West - Mount Pritchard is 37 years.
How does Cabramatta West - Mount Pritchard's median age compare to broader areas?
At 37 years, Cabramatta West - Mount Pritchard is equal to the Greater Sydney average and similarly aligned with comparable to the national average (38 years).
What age groups are over-represented in Cabramatta West - Mount Pritchard?
The most over-represented age group in Cabramatta West - Mount Pritchard compared to the Greater Sydney region is the 55 - 64 group, making up 12.9% of the population.
What age groups are under-represented in Cabramatta West - Mount Pritchard?
The most under-represented age group in Cabramatta West - Mount Pritchard compared to the Greater Sydney region is the 35 - 44 group, making up 11.9% of the population.
Are there age groups with notable population variances?
No, the age distribution in Cabramatta West - Mount Pritchard is broadly in line with the Greater Sydney region.
What is the percentage of children (0-14 years) in Cabramatta West - Mount Pritchard?
The percentage of children aged 0-14 years in Cabramatta West - Mount Pritchard is 17.3%.
What is the percentage of older people (65+ years) in Cabramatta West - Mount Pritchard?
The percentage of people aged 65 and over in Cabramatta West - Mount Pritchard is 17.0%.

Nearby Areas