Chart Color Schemes
This analysis uses ABS Statistical Areas Level 2 (SA2) boundaries, which can materially differ from Suburbs and Localities (SAL) even when sharing similar names.
SA2 boundaries are defined by the Australian Bureau of Statistics and are designed to represent communities for statistical reporting (e.g., census and ERP).
Suburbs and Localities (SAL) represent commonly-used suburb/locality names (postal-style areas) and may use different geographic boundaries. For comprehensive analysis, consider reviewing both boundary types if available.
est. as @ -- *
ABS ERP | -- people | --
2021 Census | -- people
Sales Activity
Curious about local property values? Filter the chart to assess the volume and appreciation (including resales) trends and regional comparisons, or scroll to the map below view this information at an individual property level.
Find a Recent Sale
Sales Detail
Population
Population growth drivers in Liverpool - West are above average based on AreaSearch's ranking of recent, and medium to long-term trends
Liverpool - West's population is around 14,929 as of November 2025. This reflects an increase of 1,192 people since the 2021 Census, which reported a population of 13,737 people. The change is inferred from the estimated resident population of 14,900 in June 2024 and an additional 365 validated new addresses since the Census date. This level of population equates to a density ratio of 3,677 persons per square kilometer. Liverpool - West's growth rate of 8.7% since the 2021 census exceeded the state's growth rate of 6.7%, marking it as a growth leader in the region. Overseas migration contributed approximately 76.4% of overall population gains during recent periods.
AreaSearch is adopting ABS/Geoscience Australia projections for each SA2 area, released in 2024 with 2022 as the base year. For areas not covered by this data, AreaSearch utilises NSW State Government's SA2 level projections, released in 2022 with 2021 as the base year. Growth rates by age group are applied to all areas for years 2032 to 2041. Based on projected demographic shifts, Liverpool - West is forecasted to increase its population by 3,638 persons by 2041, reflecting a gain of 24.1% over the 17-year period.
Frequently Asked Questions - Population
Development
AreaSearch assessment of residential development activity positions Liverpool - West among the top 25% of areas assessed nationwide
Liverpool - West has seen approximately 84 new homes approved annually over the past five financial years, from FY21 to FY25. A total of 422 homes were approved during this period, with an additional 24 approved so far in FY26. On average, around two new residents have arrived per new home each year over these five years, indicating a balanced supply and demand scenario that has recently accelerated to approximately 5.5 people per dwelling over the past two financial years. The average construction cost of new homes is $238,000, which is lower than the regional average, suggesting more affordable housing options for buyers.
This year alone, around $200,000 worth of commercial approvals have been registered, indicating minimal commercial development activity in the area compared to Greater Sydney. Liverpool - West records about three-quarters the building activity per person and ranks among the 79th percentile nationally in terms of development activity. Recent periods have seen an increase in this activity. The new building stock comprises approximately 32% detached houses and 68% townhouses or apartments, marking a significant shift from the current housing pattern of 54% houses. This trend may indicate diminishing developable land availability and reflects evolving lifestyle preferences and housing affordability needs.
With around 144 people per dwelling approval, Liverpool - West is considered a growth area. According to the latest AreaSearch quarterly estimate, Liverpool - West is projected to add approximately 3,592 residents by 2041. Current construction rates appear balanced with future demand, fostering steady market conditions without excessive price pressure.
Frequently Asked Questions - Development
Infrastructure
Liverpool - West has very high levels of nearby infrastructure activity, ranking in the top 20% nationally
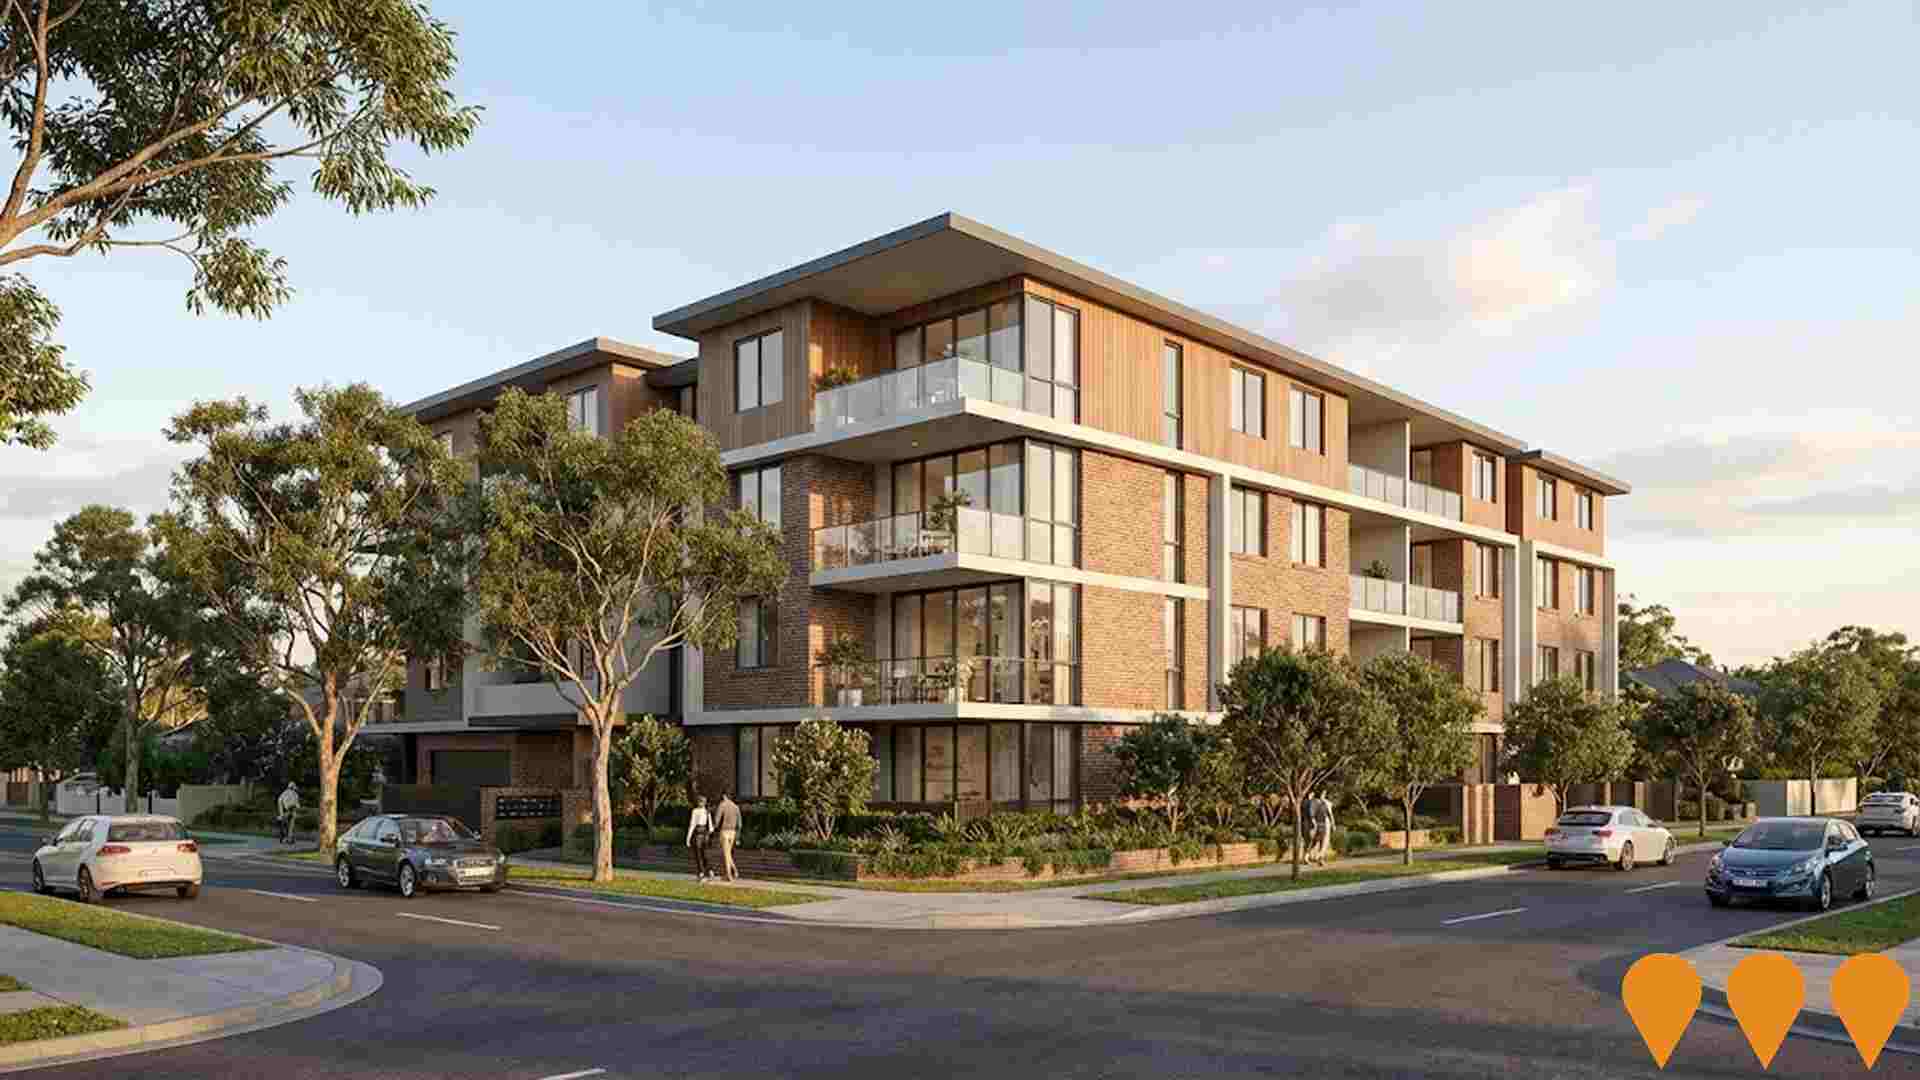
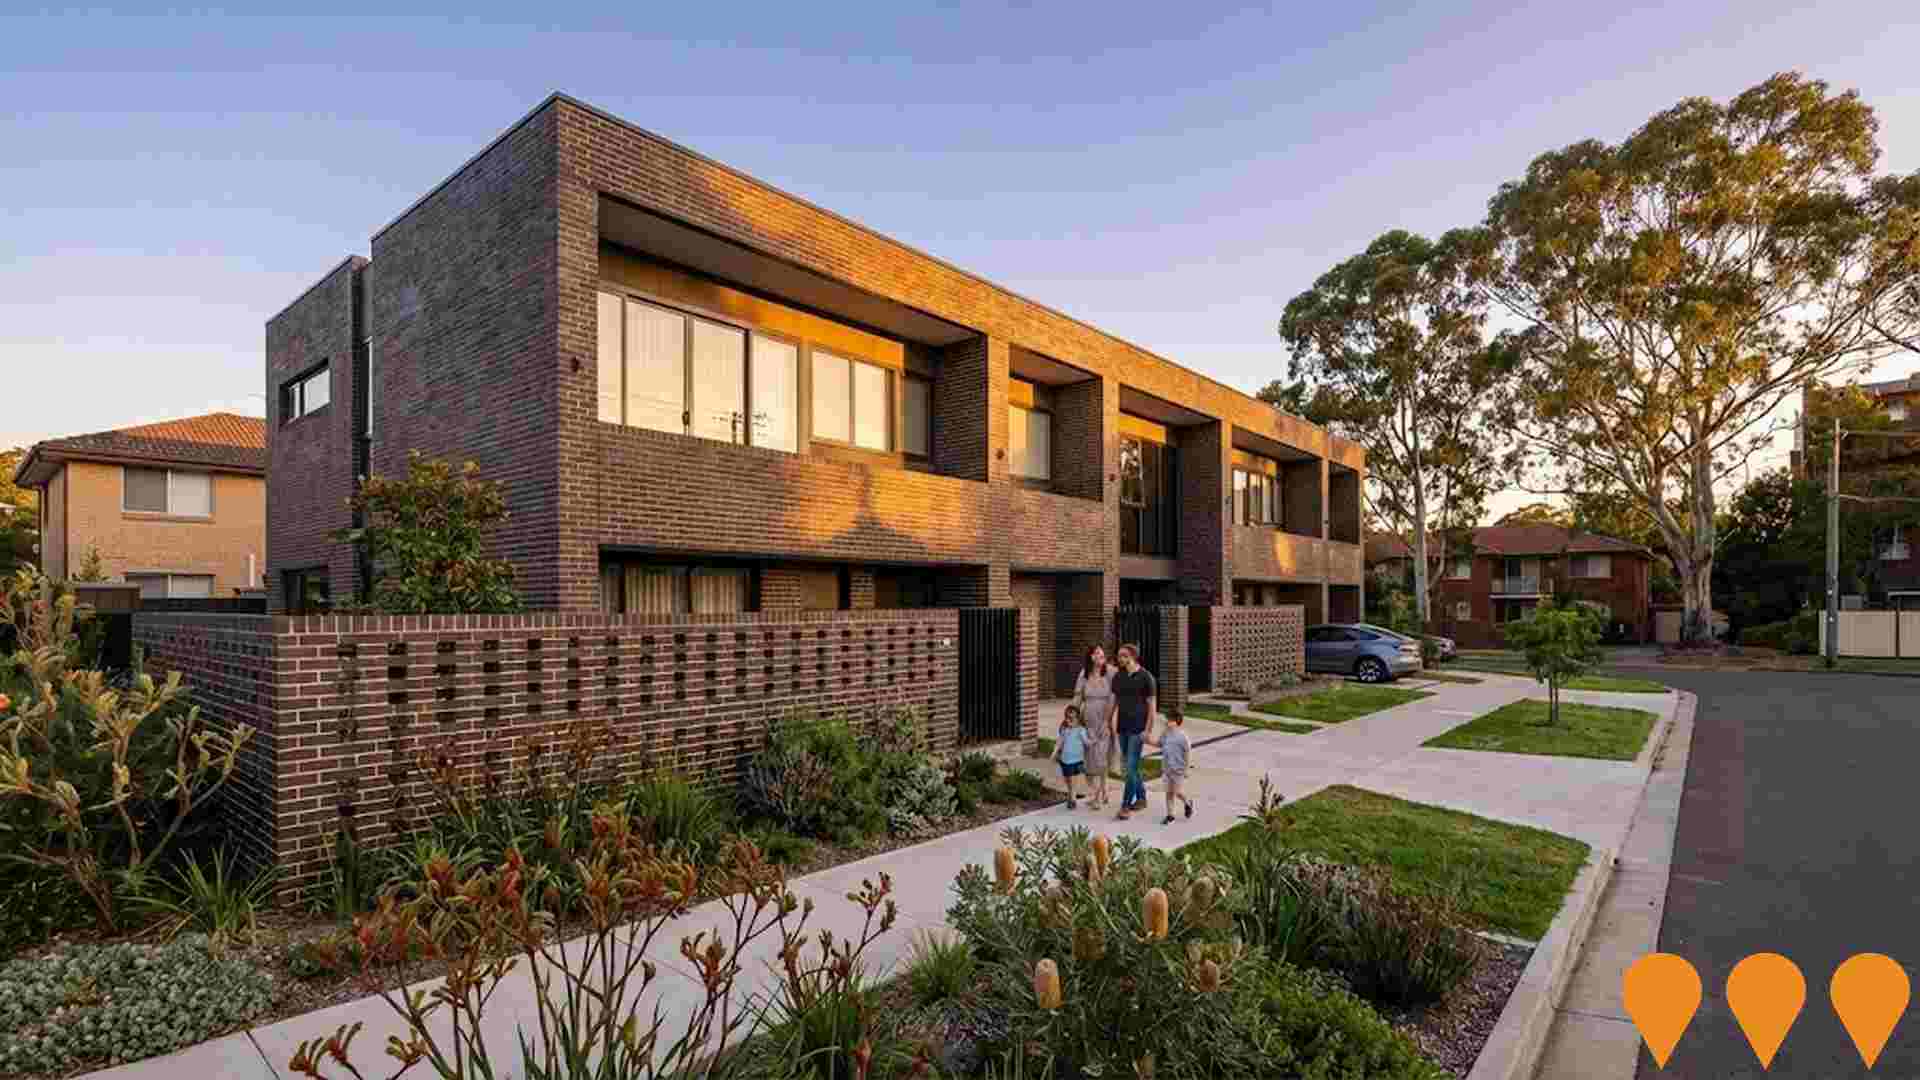
Changes to local infrastructure significantly influence an area's performance. AreaSearch has identified 31 projects that are expected to impact the area. Notable projects include Frangipane Avenue Apartments, Liverpool Civic Place, Liverpool Health and Academic Precinct, and Liverpool Innovation Precinct. The following list details those considered most relevant.
Professional plan users can use the search below to filter and access additional projects.
INFRASTRUCTURE SEARCH
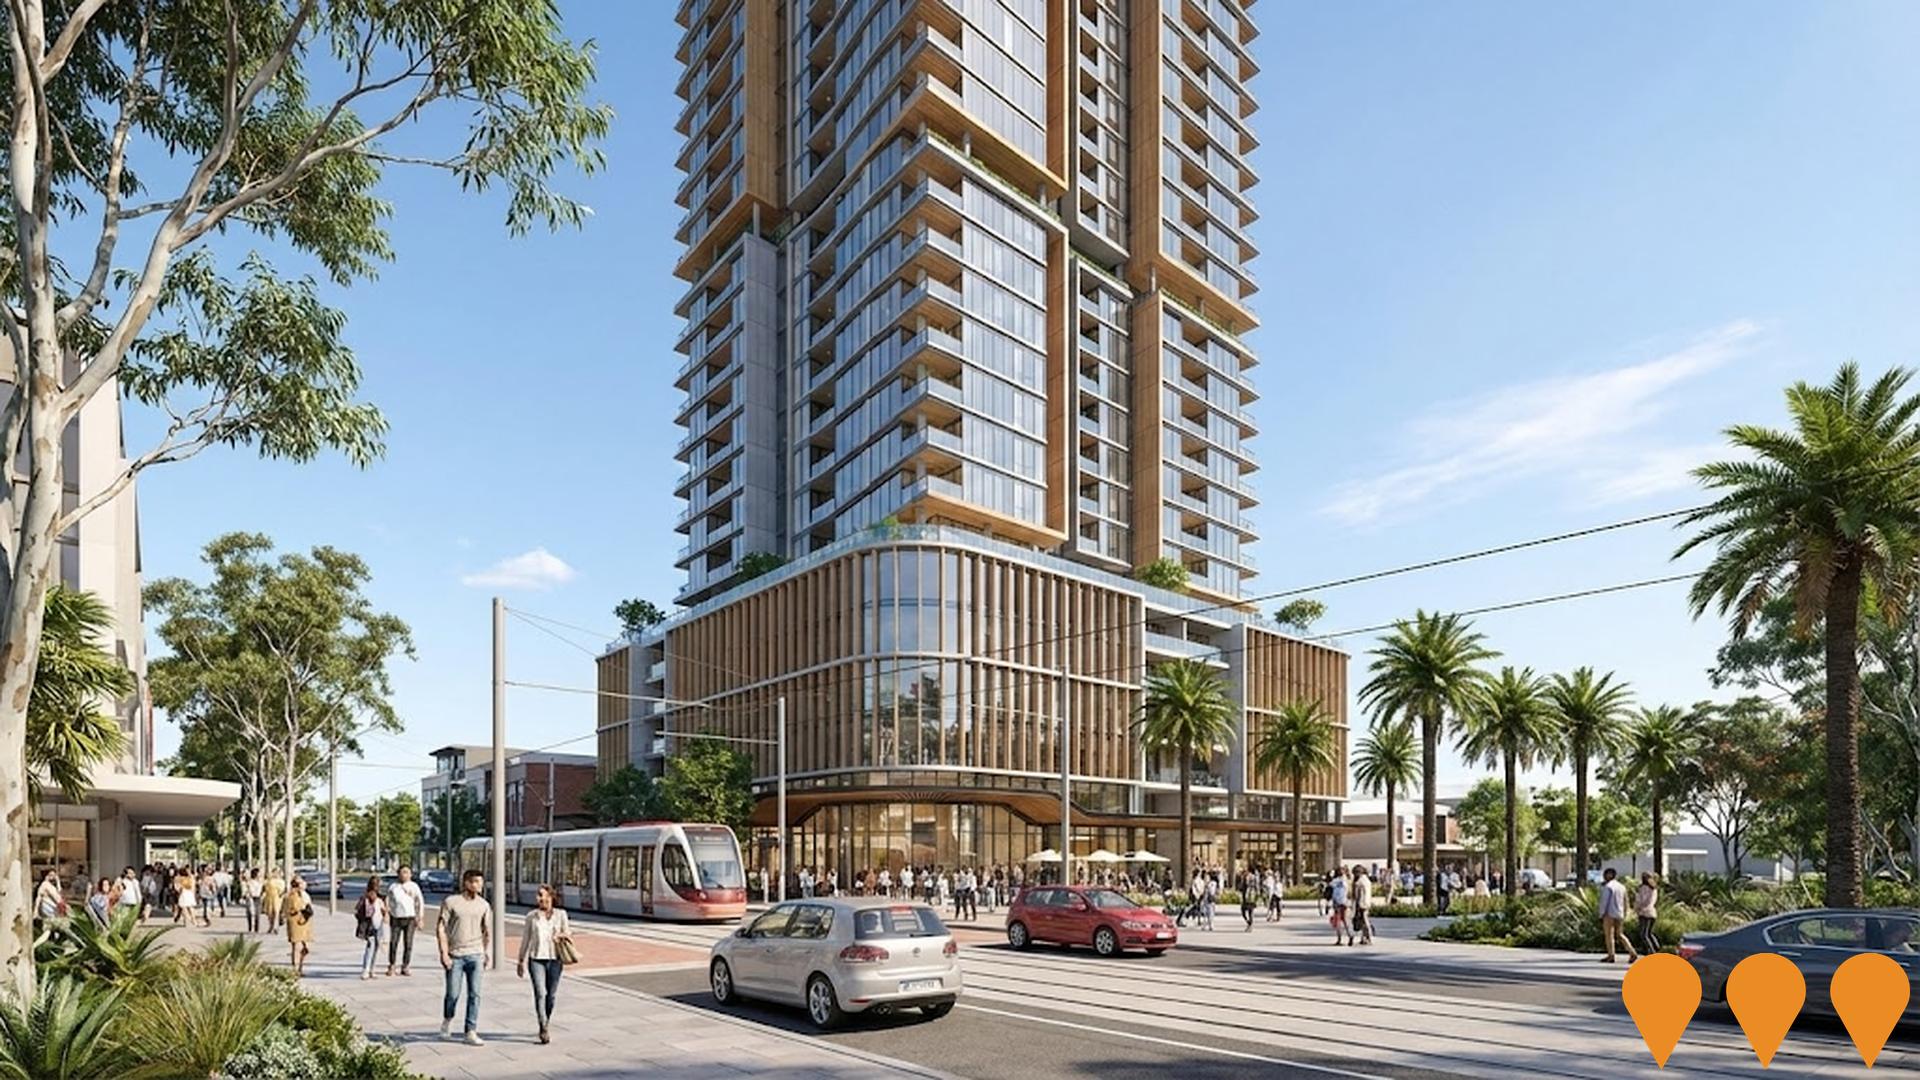
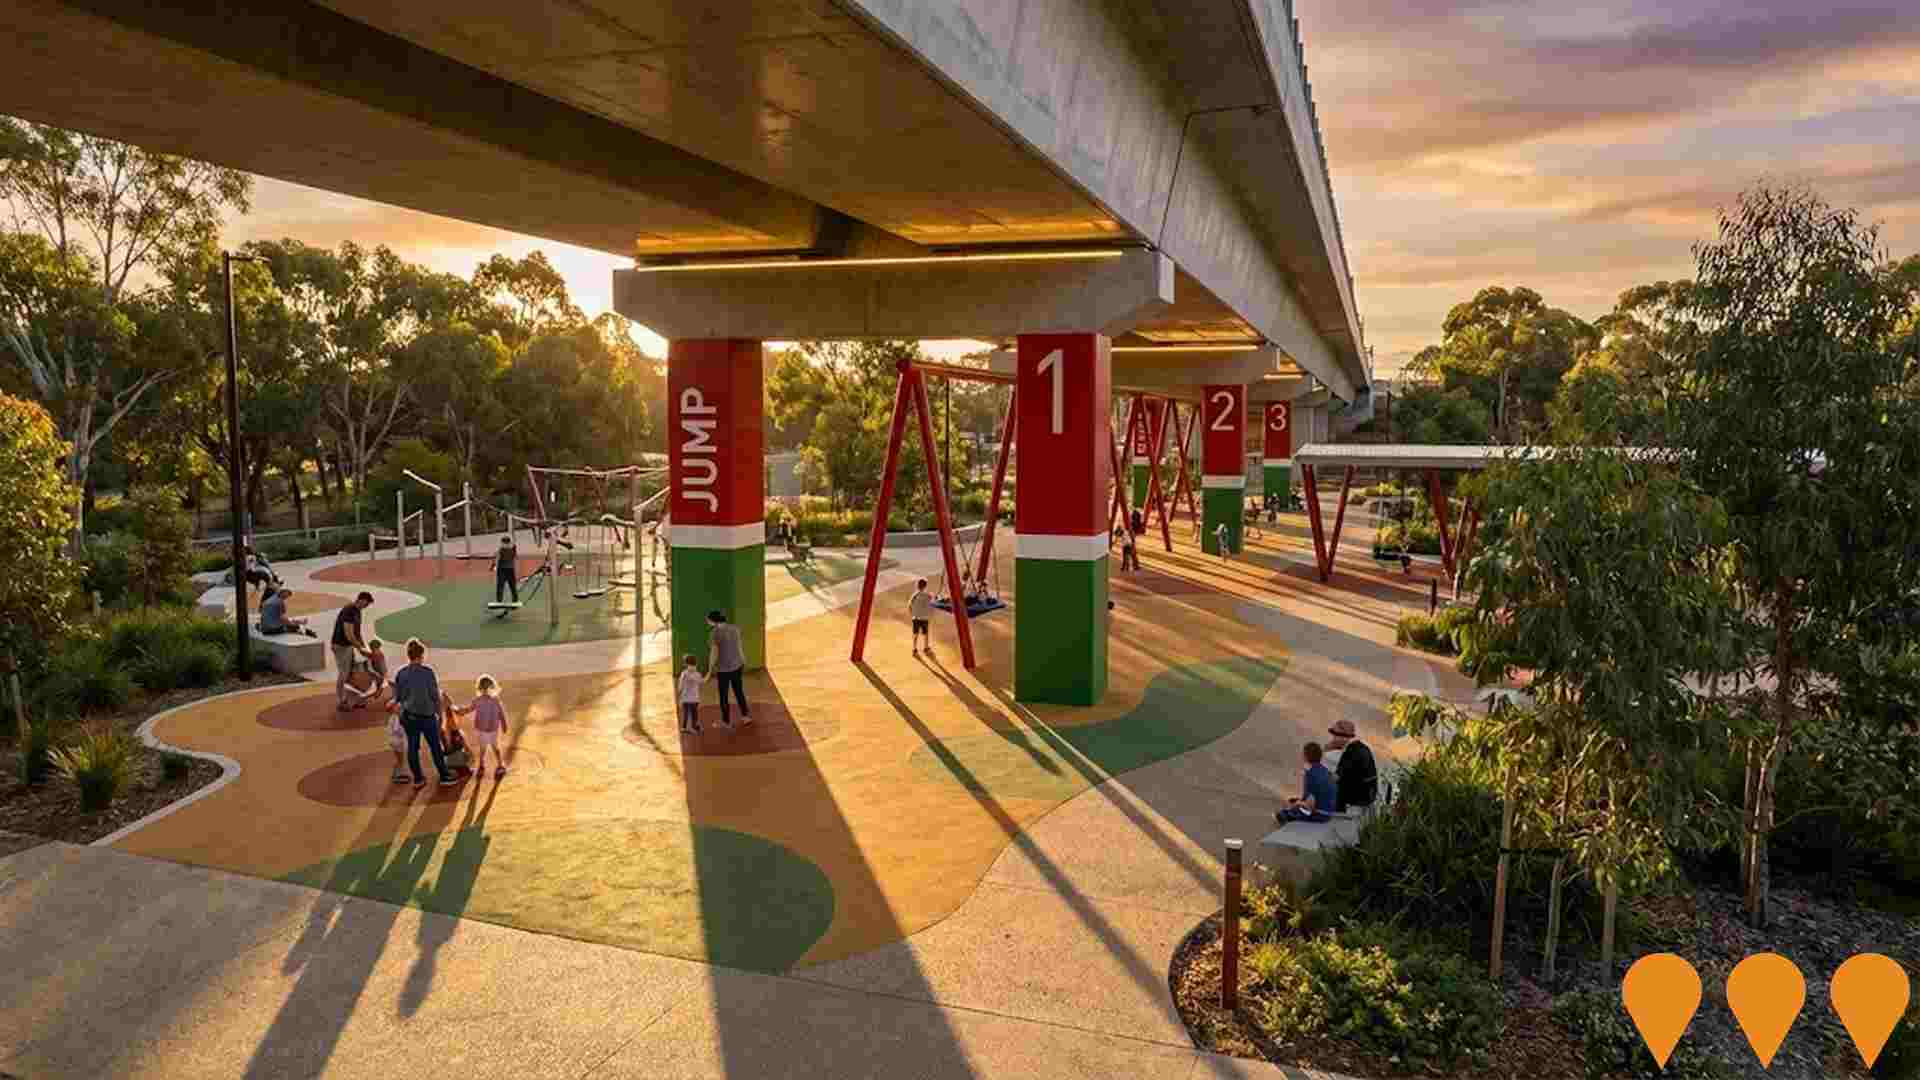
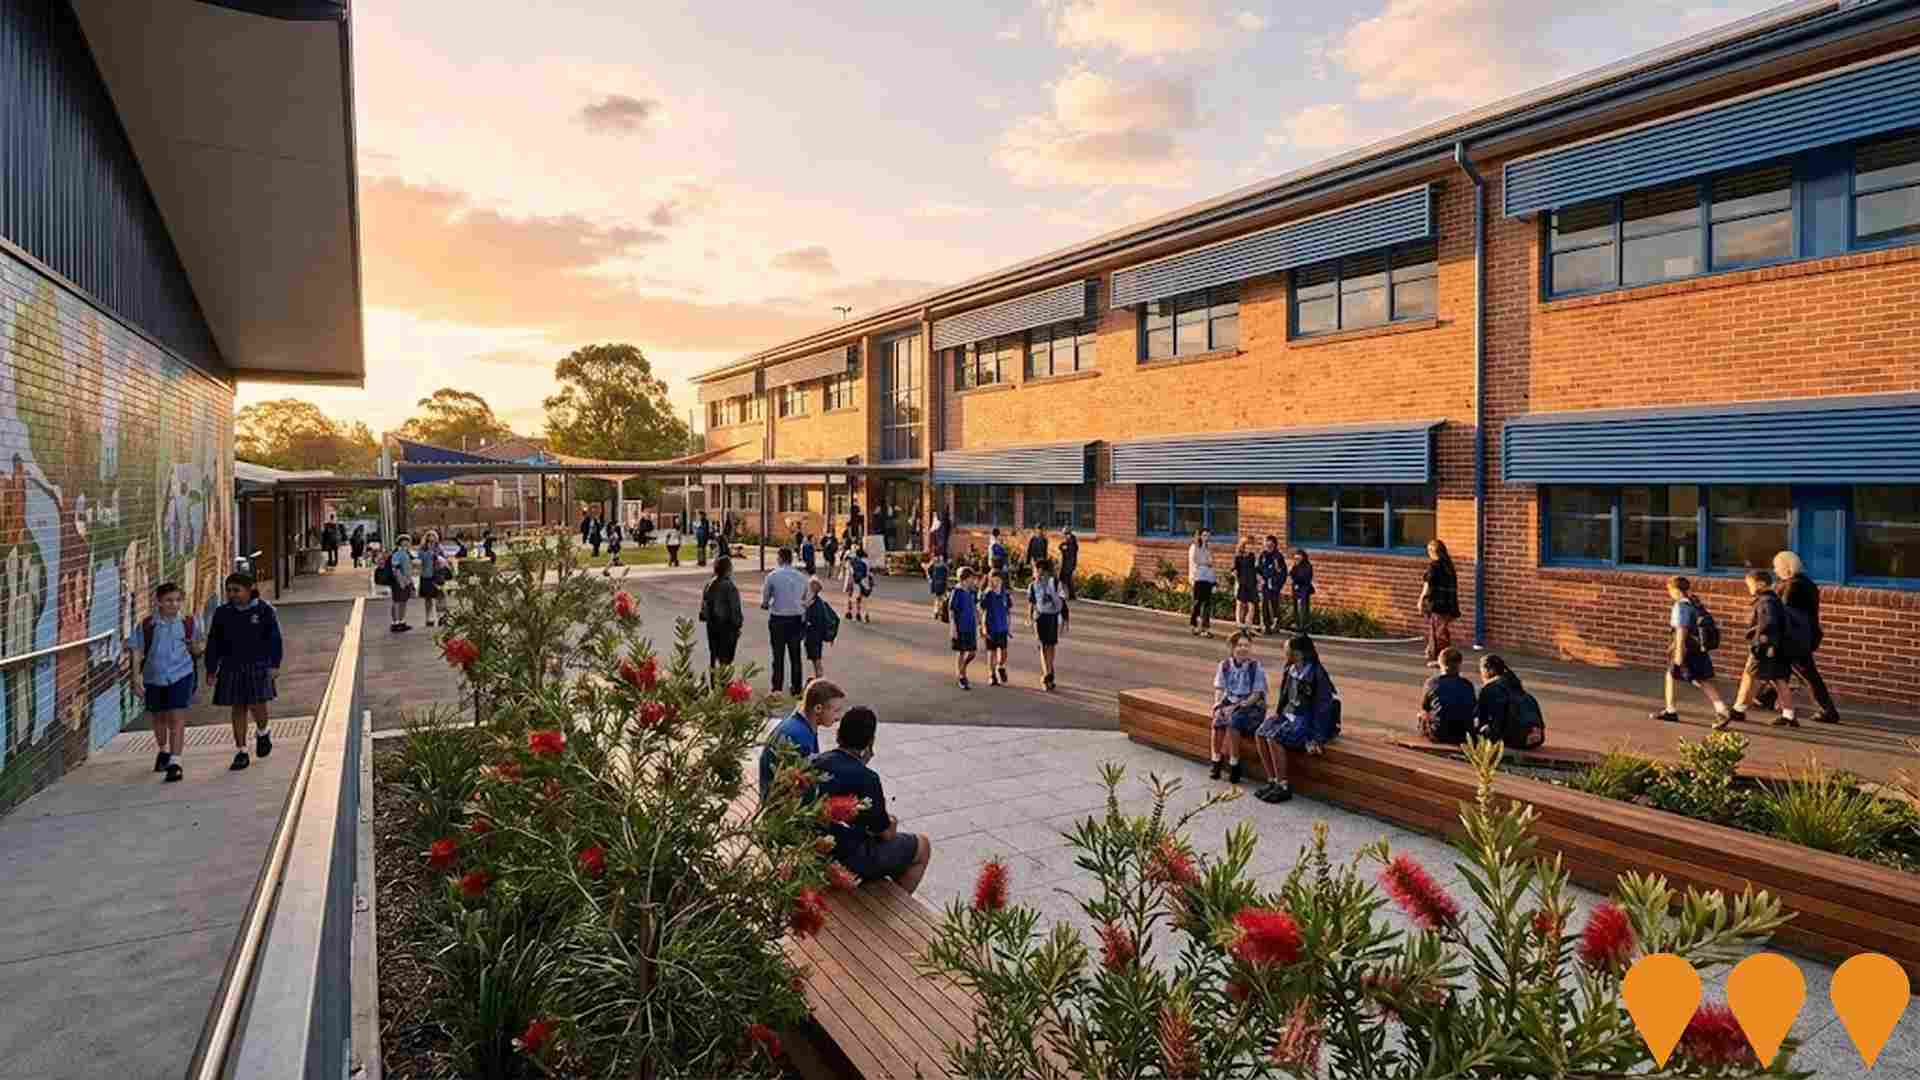
 Denotes AI-based impression for illustrative purposes only, not to be taken as definitive under any circumstances. Please follow links and conduct other investigations from the project's source for actual imagery. Developers and project owners wishing us to use original imagery please Contact Us and we will do so.
Frequently Asked Questions - Infrastructure
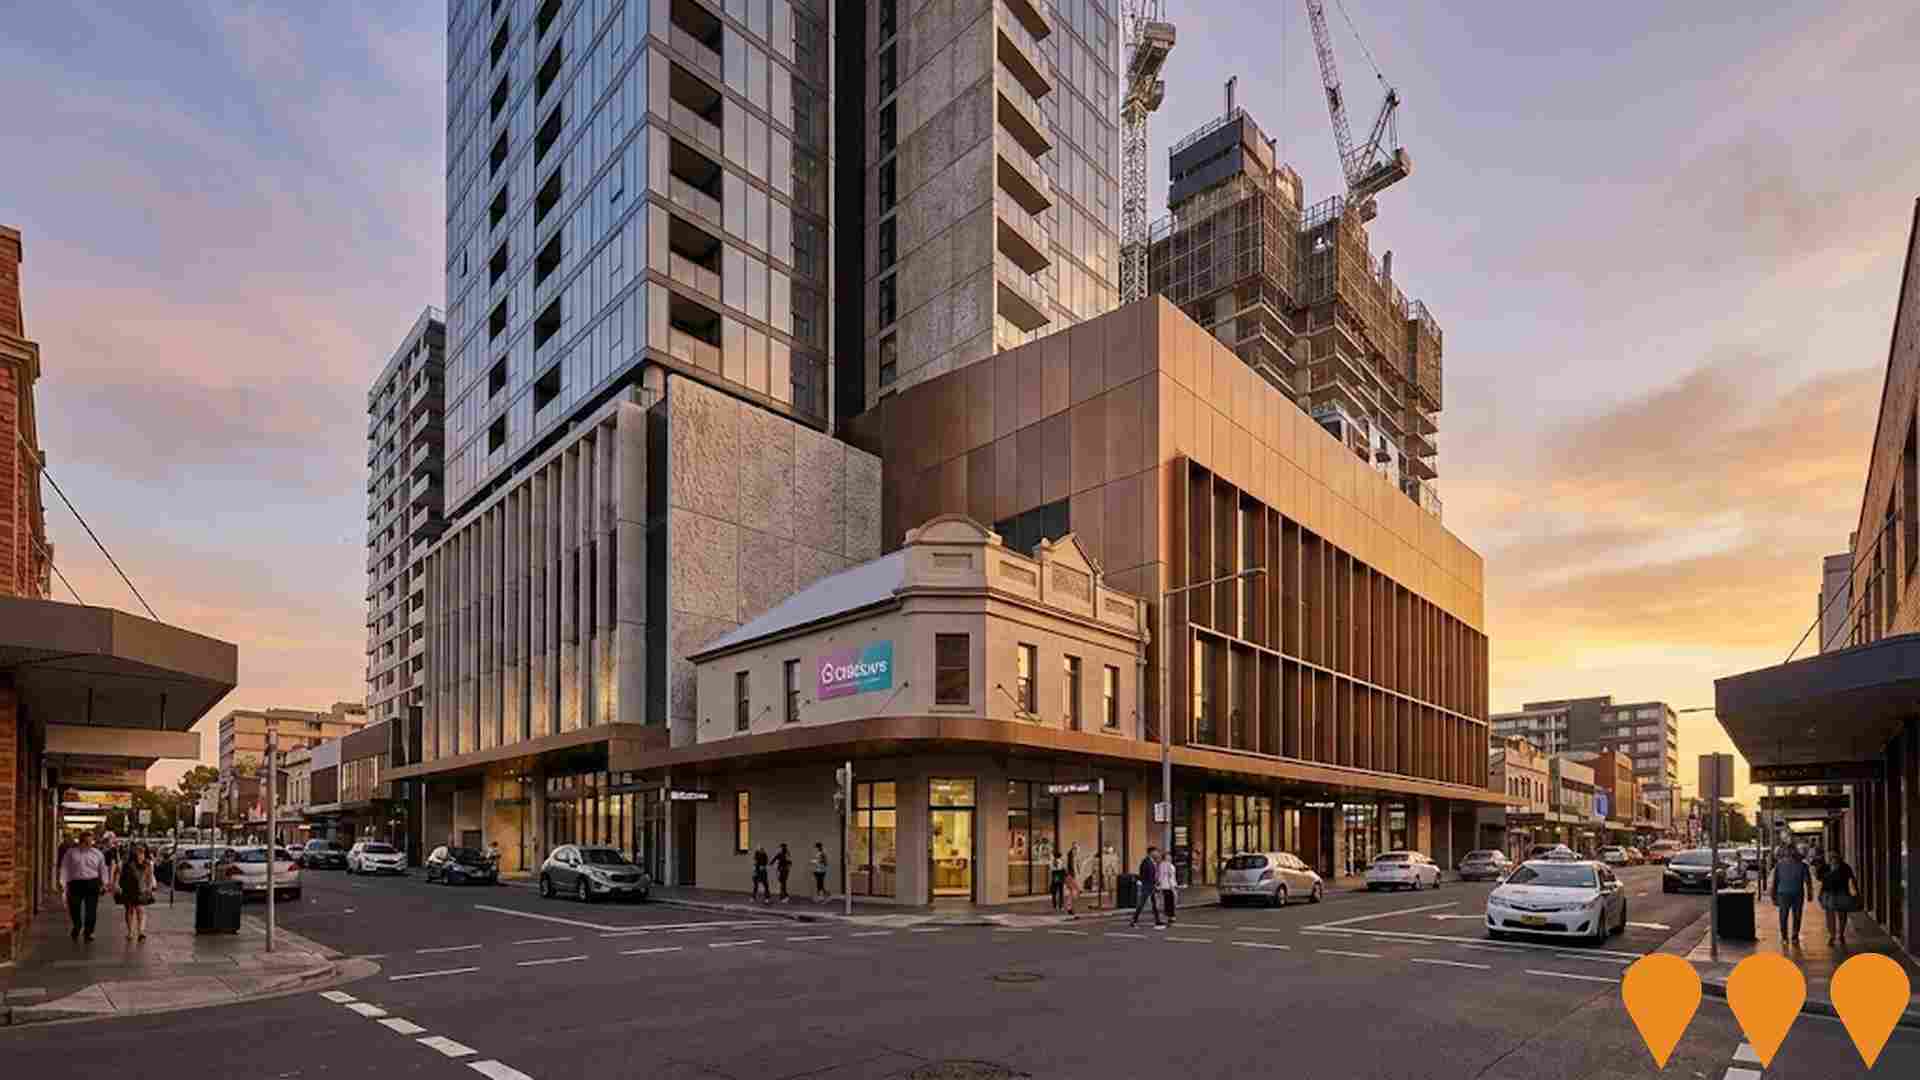
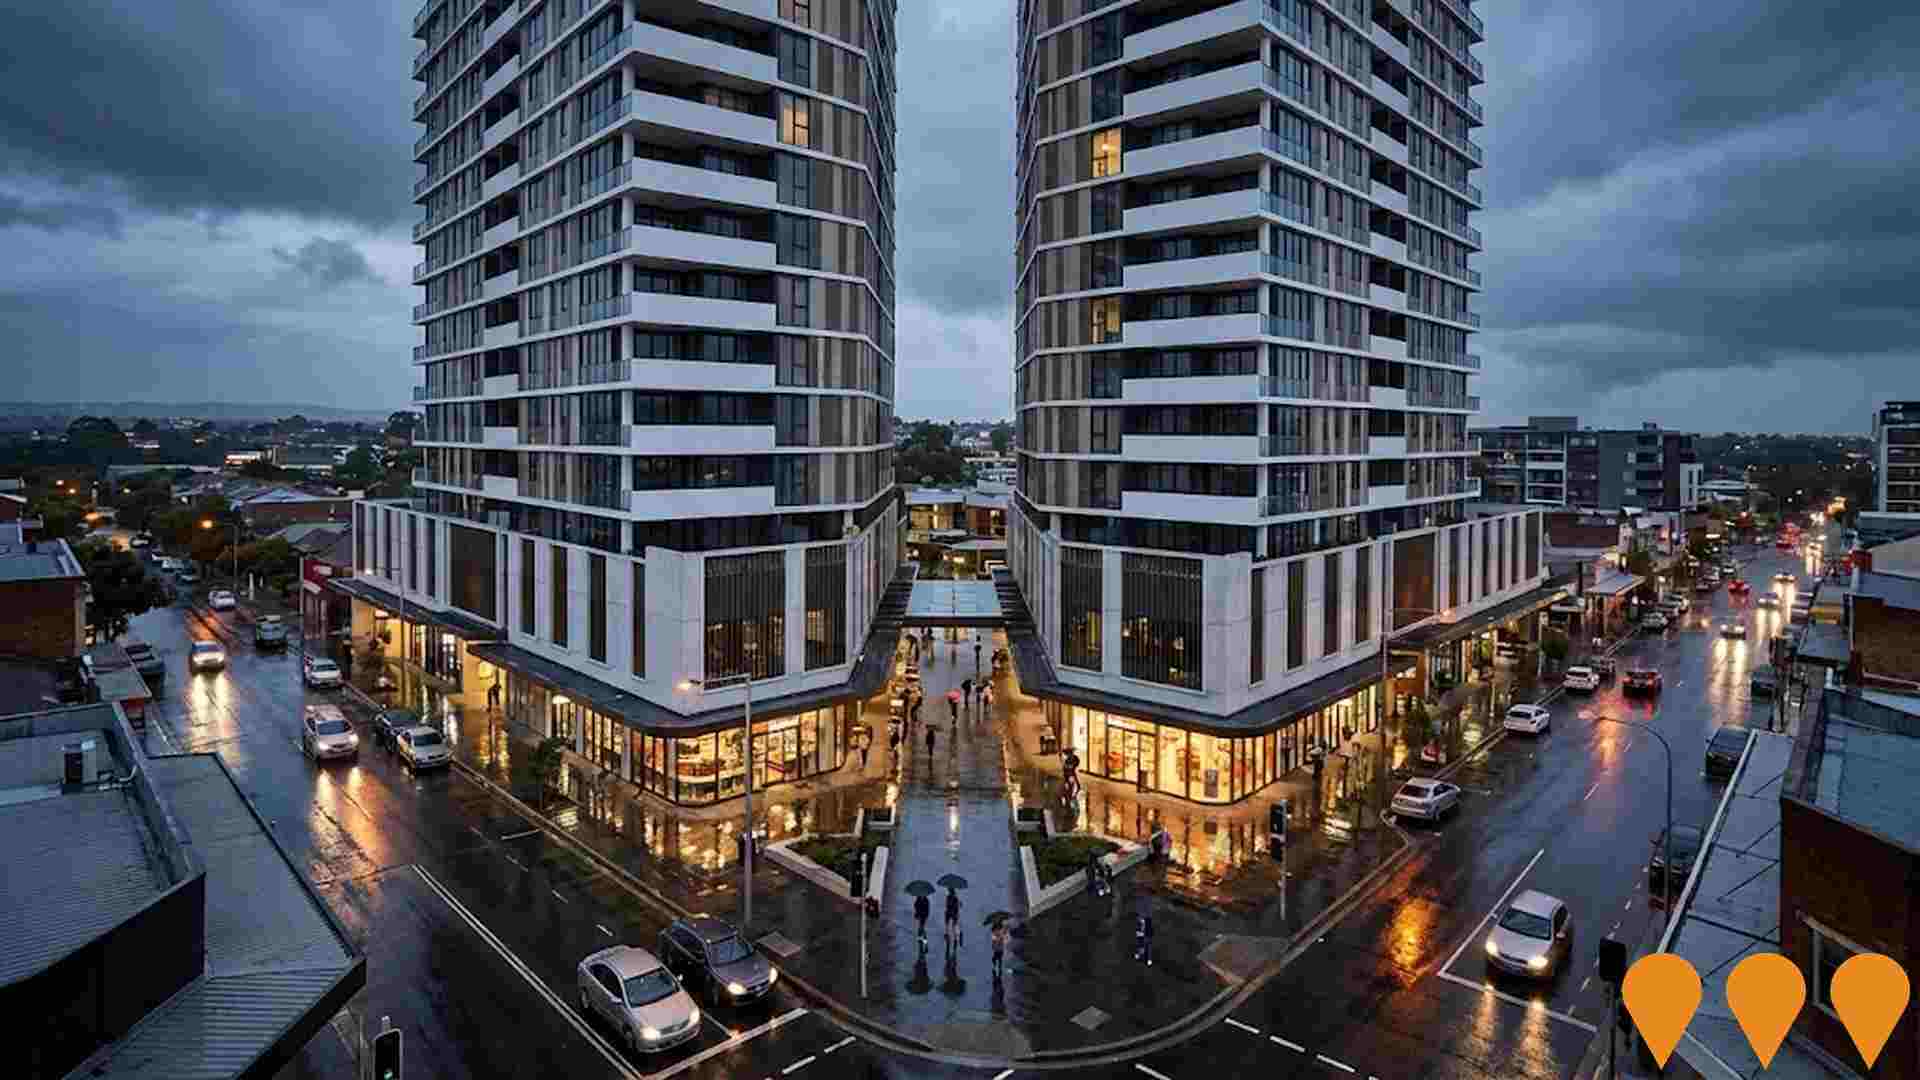
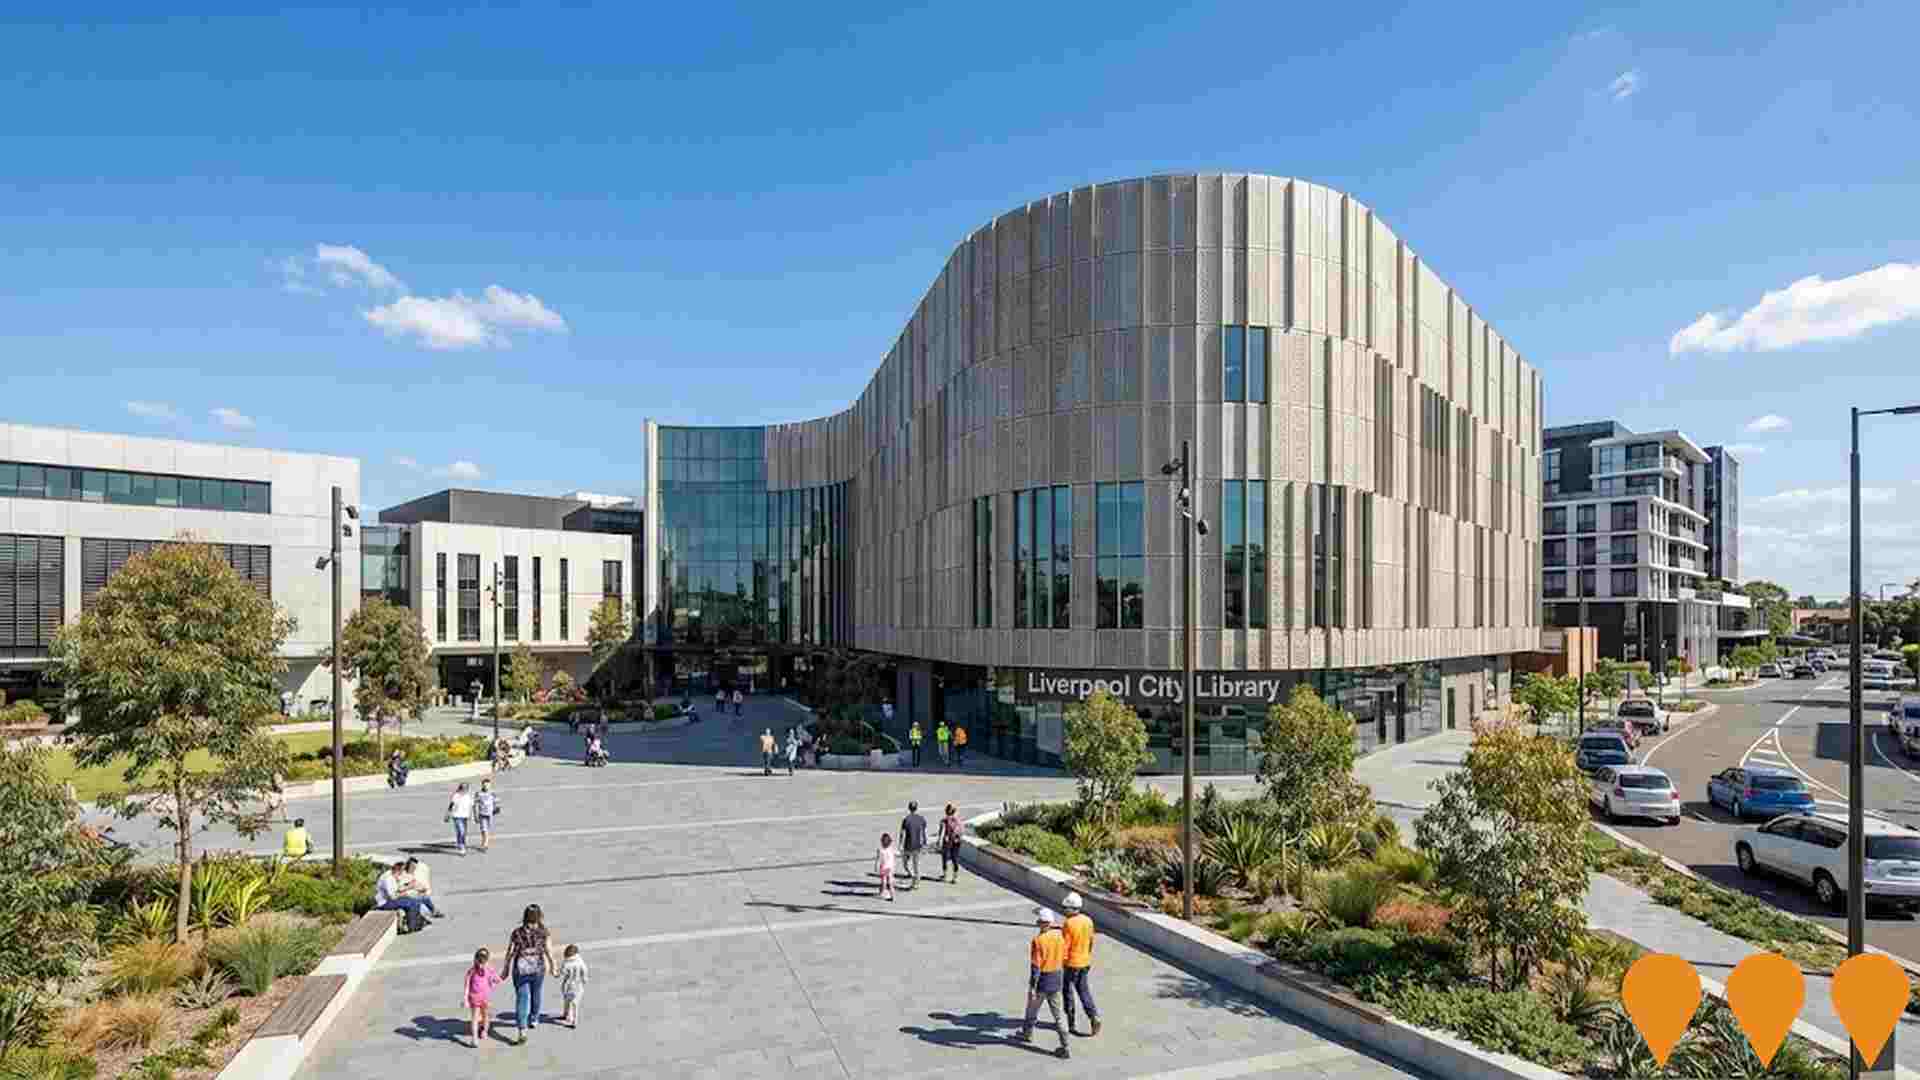
Liverpool Civic Place
790 million mixed-use civic and commercial precinct in Liverpool CBD. Stage 1 (civic hub including new Council chambers, library, TAFE NSW, childcare, plaza and 450-space car park) completed and opened December 2023. Stage 2 (two towers: one civic/commercial/university building and one build-to-rent residential tower with 320 apartments) is under construction with practical completion expected mid-2027.
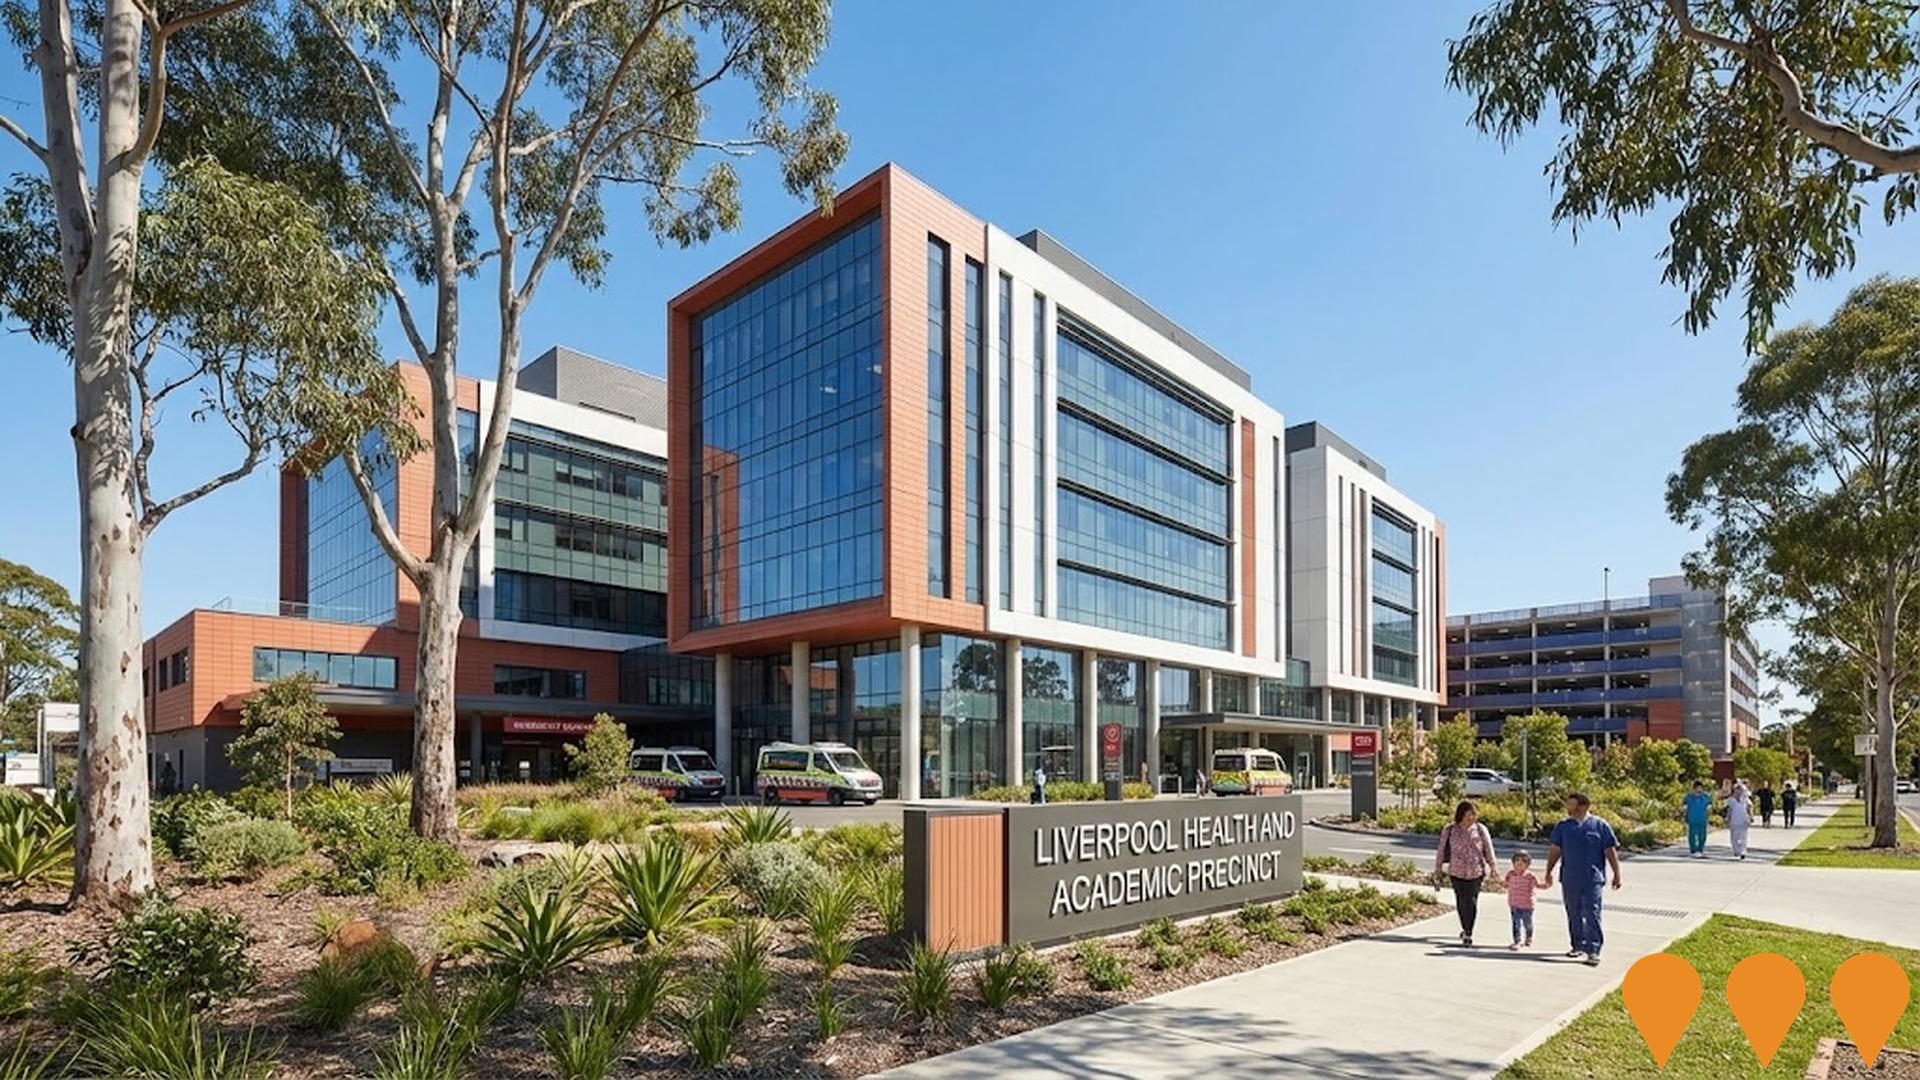
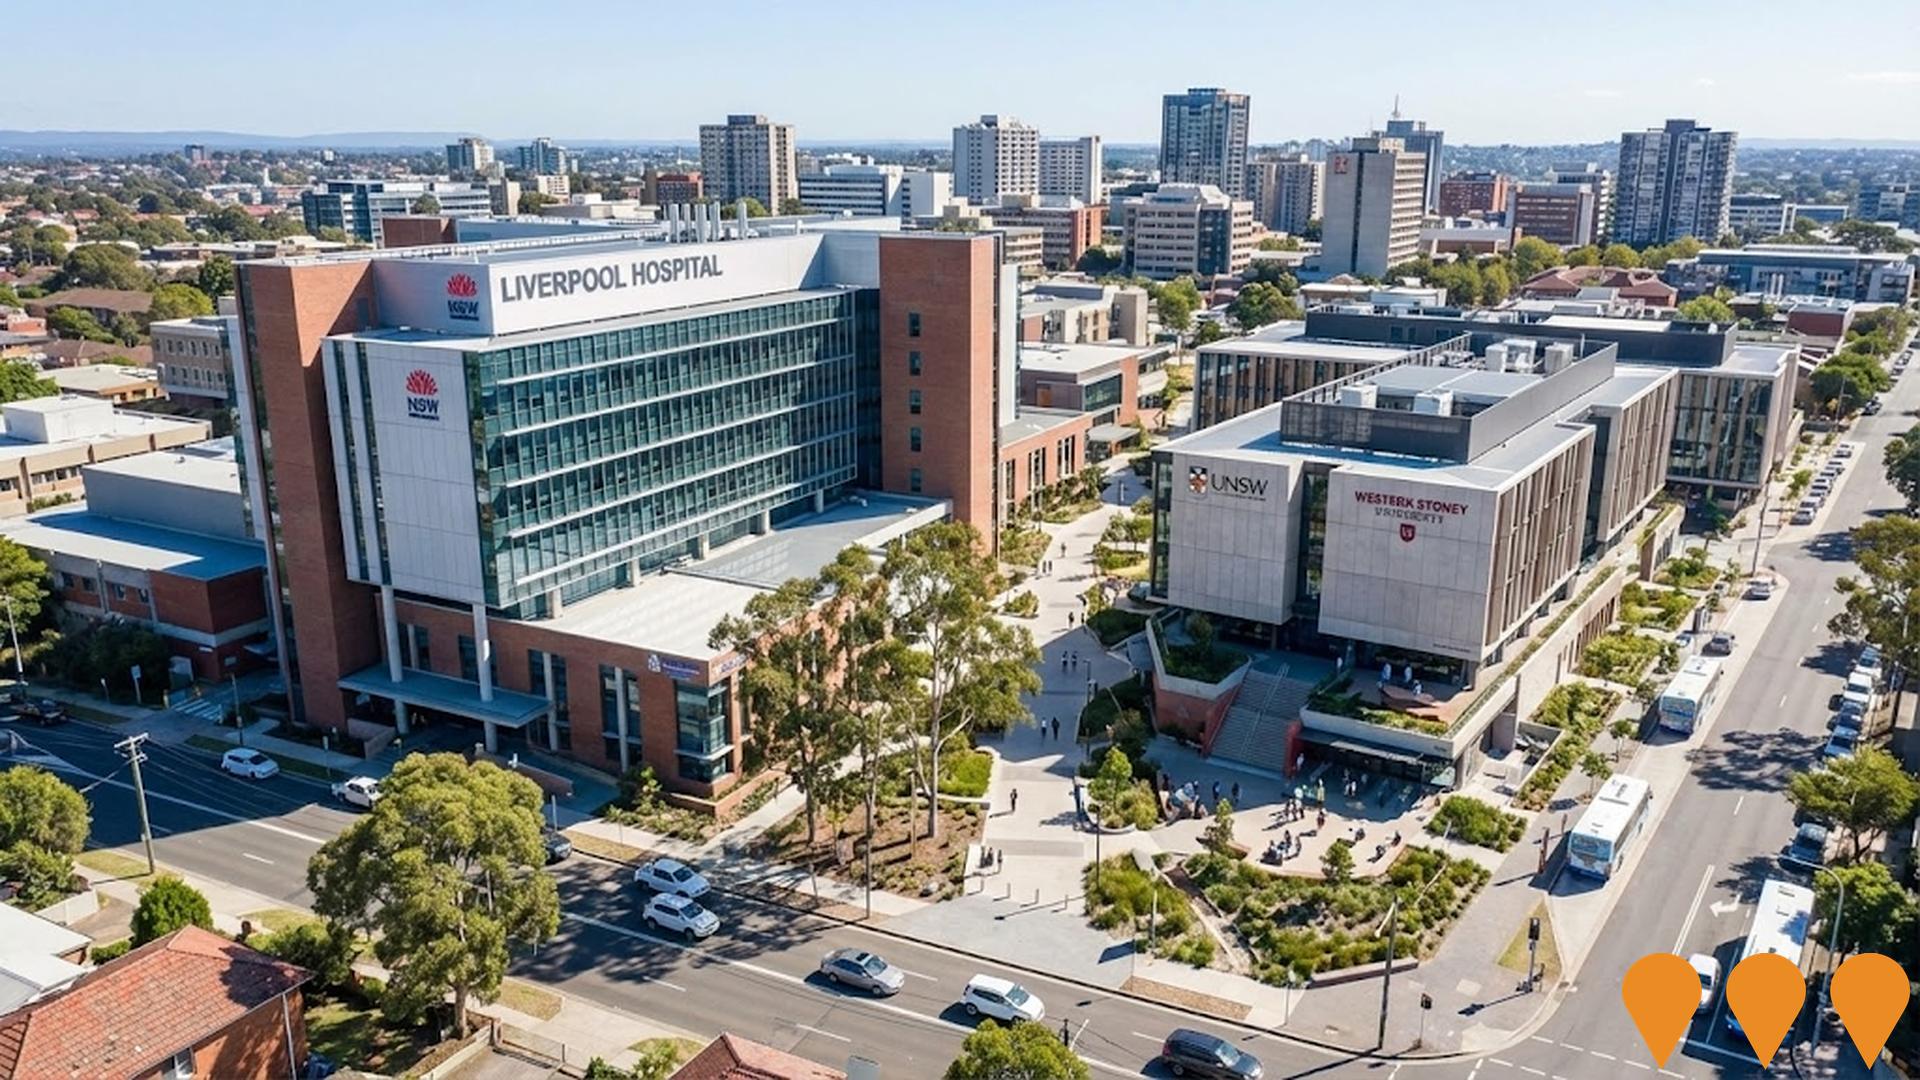
Liverpool Health and Academic Precinct
The $830 million Liverpool Health and Academic Precinct (LHAP) is a major redevelopment of Liverpool Hospital creating an international hub for clinical innovation, medical research, and education in South Western Sydney. Phase 1 delivered a new five-storey Integrated Services Building (completed October 2024) with expanded Emergency Department, neonatal intensive care unit, birthing suites, maternity and children's services, pathology, and ambulatory care. Phase 2 (underway, completion 2027) includes a new multi-storey Integrated Services Building with inpatient units, integrated cancer centre featuring the ACRF Oasis Wellness Centre, expanded women's and children's services, additional inpatient beds, research facilities, and supporting infrastructure. The precinct serves one of NSW's fastest-growing regions and includes prior multi-storey car park (2022).
Liverpool Innovation Precinct
A health, education, and research innovation precinct anchored by the ongoing $790 million Liverpool Hospital redevelopment. The precinct is a collaboration focused on health technologies, cancer care, translational research, and robotics, supported by a multi-university education hub (UNSW, Western Sydney University) and city centre public domain upgrades to create a vibrant economic hub.
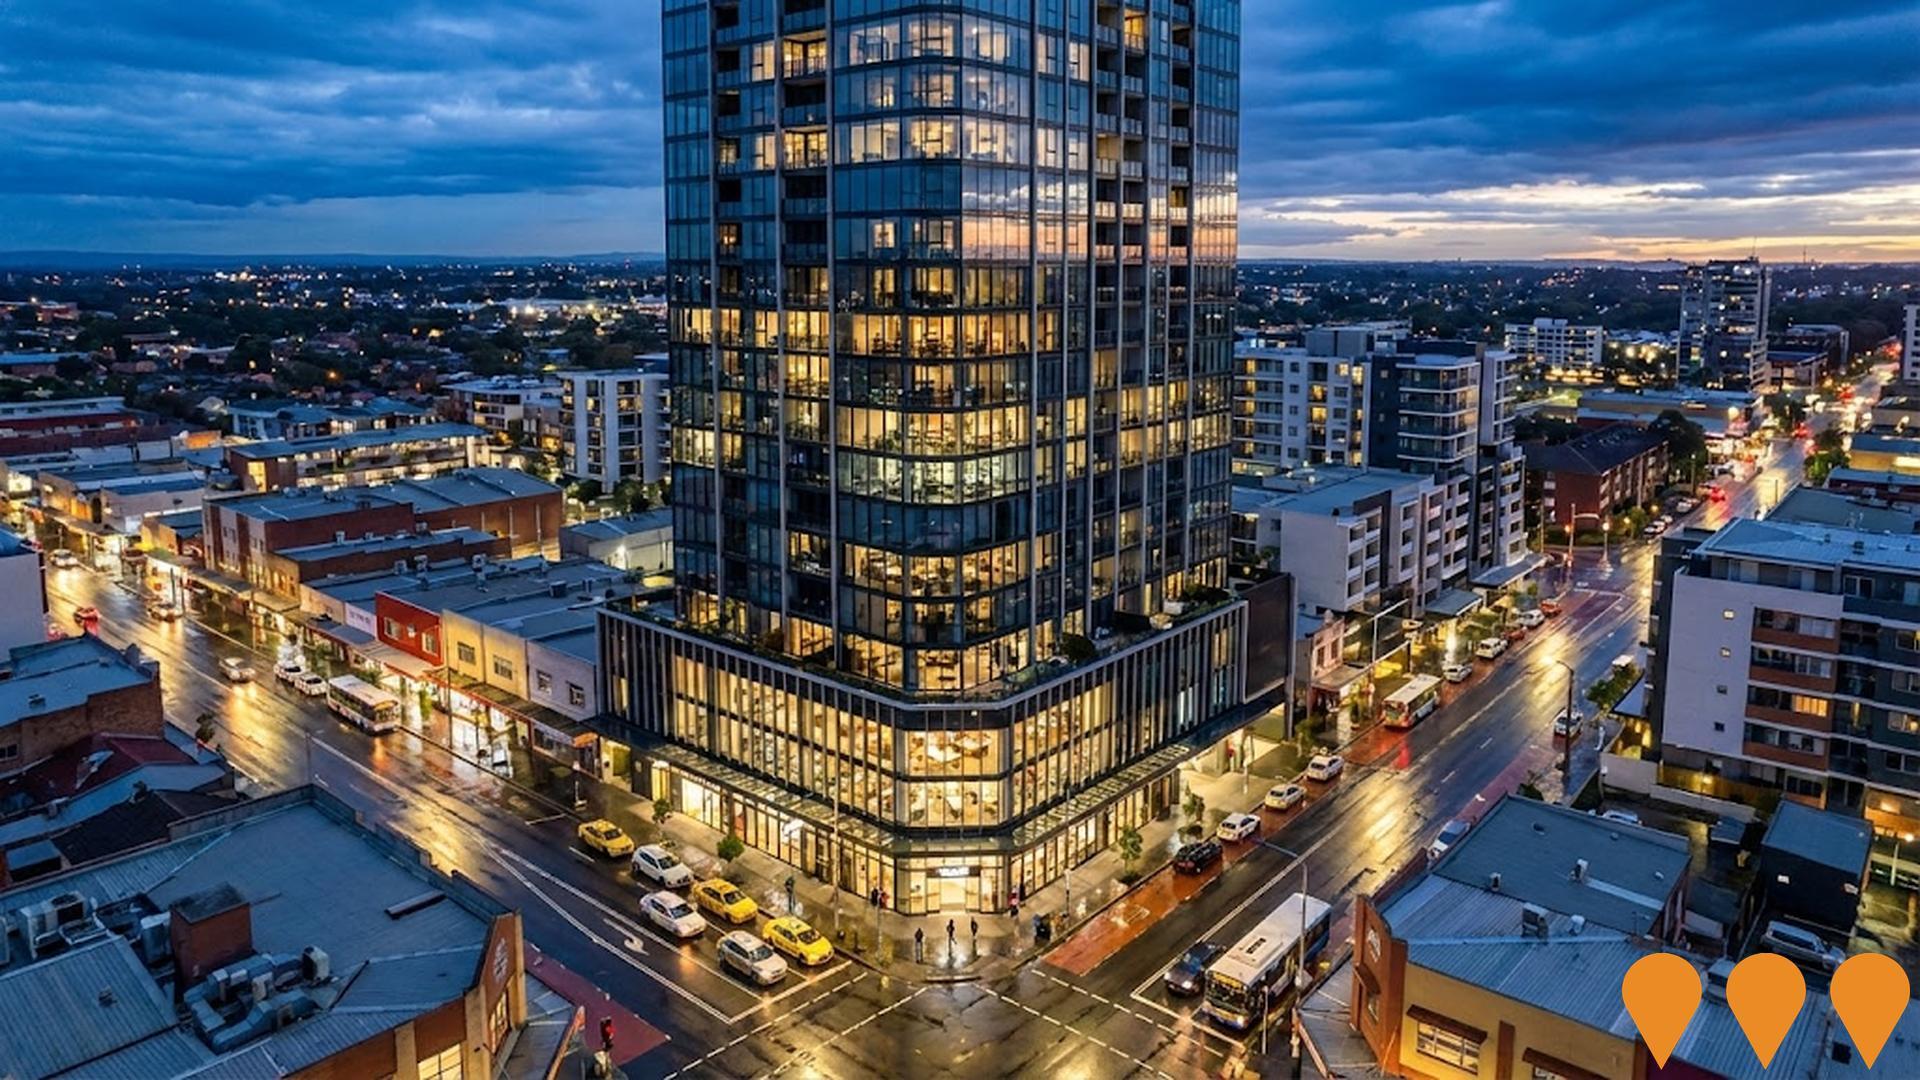
Liverpool City Centre Renewal - Sydney's Third CBD
Ongoing strategic renewal of Liverpool City Centre as Sydney's Third CBD. The 2018 rezoning (LLEP Amendment 52) enables high-density mixed-use development across approximately 25 hectares. Multiple private and public projects are now in planning, development application or construction stages, guided by the Liverpool Collaboration Area Place Strategy (2023) and Liverpool Local Strategic Planning Statement. Focus on residential, commercial, retail, civic and public domain upgrades to support population and job growth to 2036 and beyond.
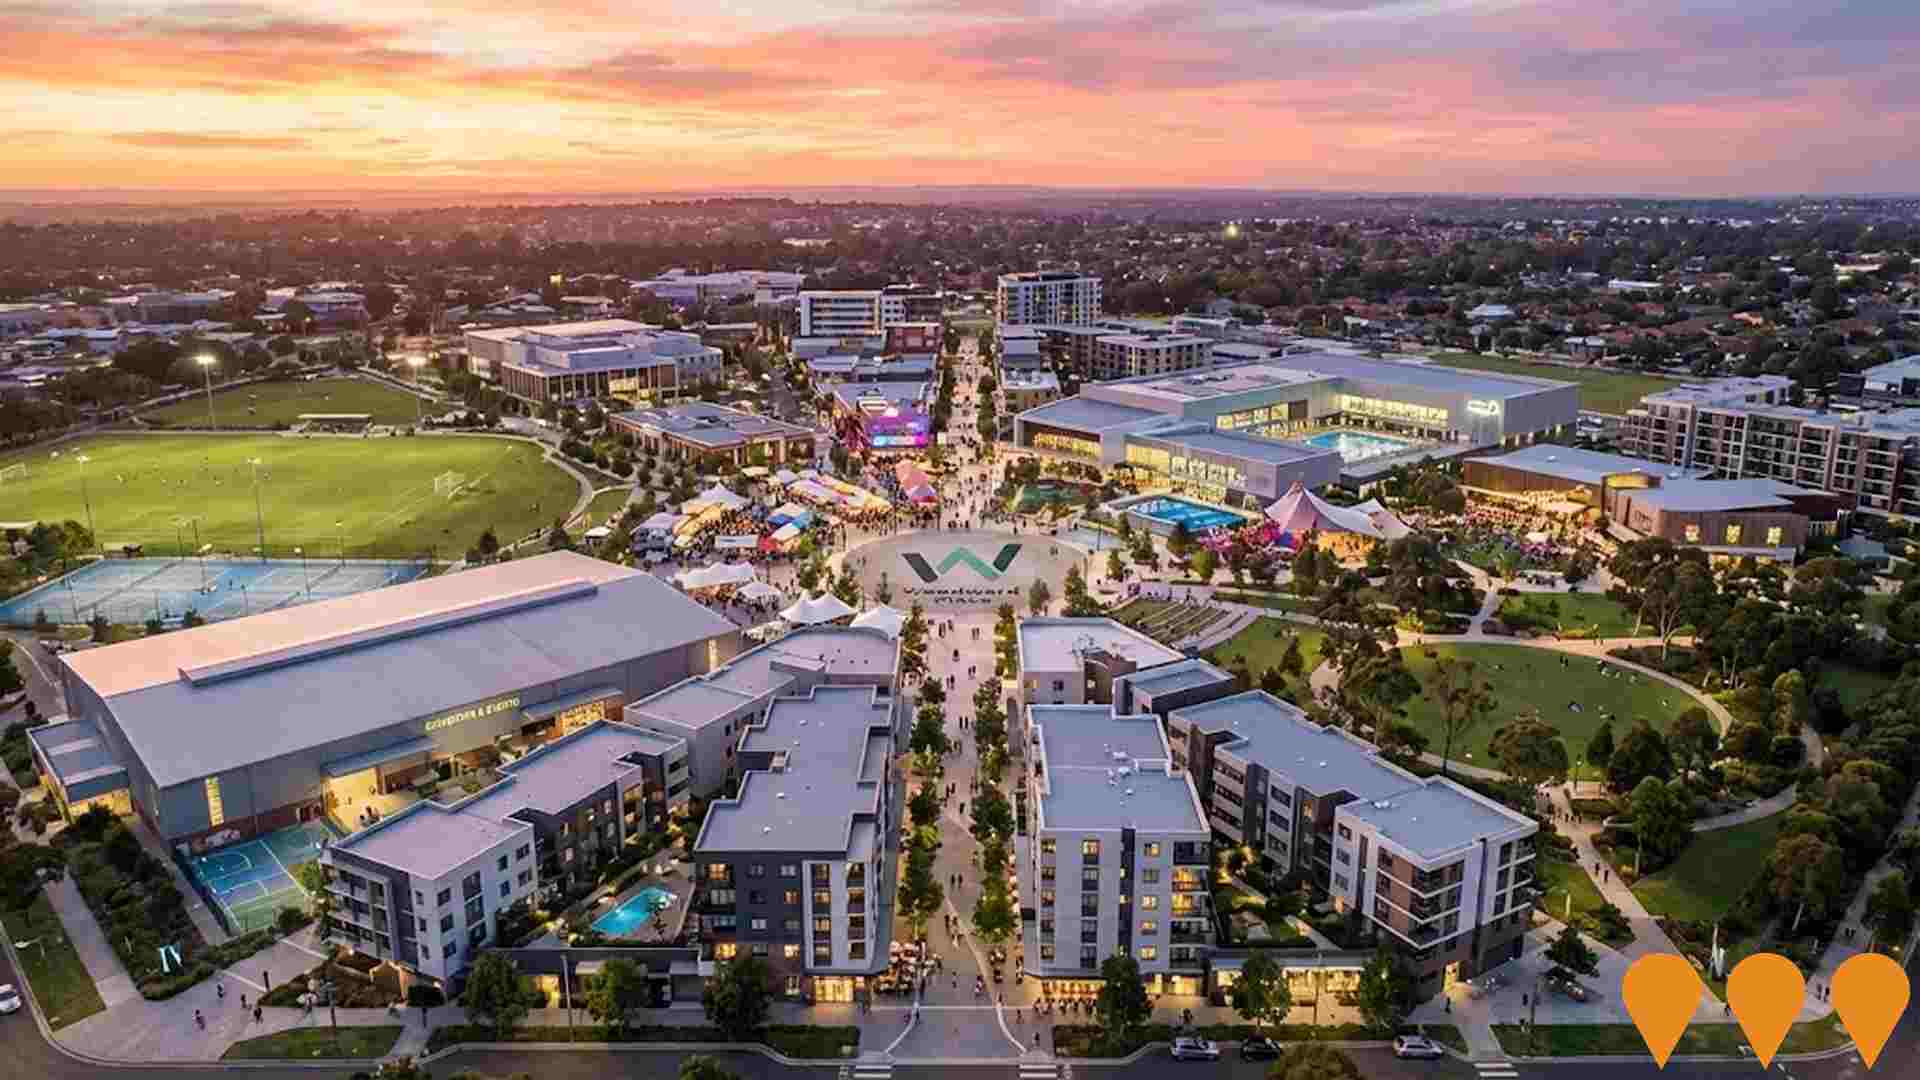
Woodward Place Masterplan
A 30-year masterplan to transform the 28-hectare Woodward Park site in Liverpool into a major lifestyle, cultural, recreational and community precinct, including new sports facilities, cultural venues, public spaces and potential future residential and mixed-use development to support Liverpool's growing population.
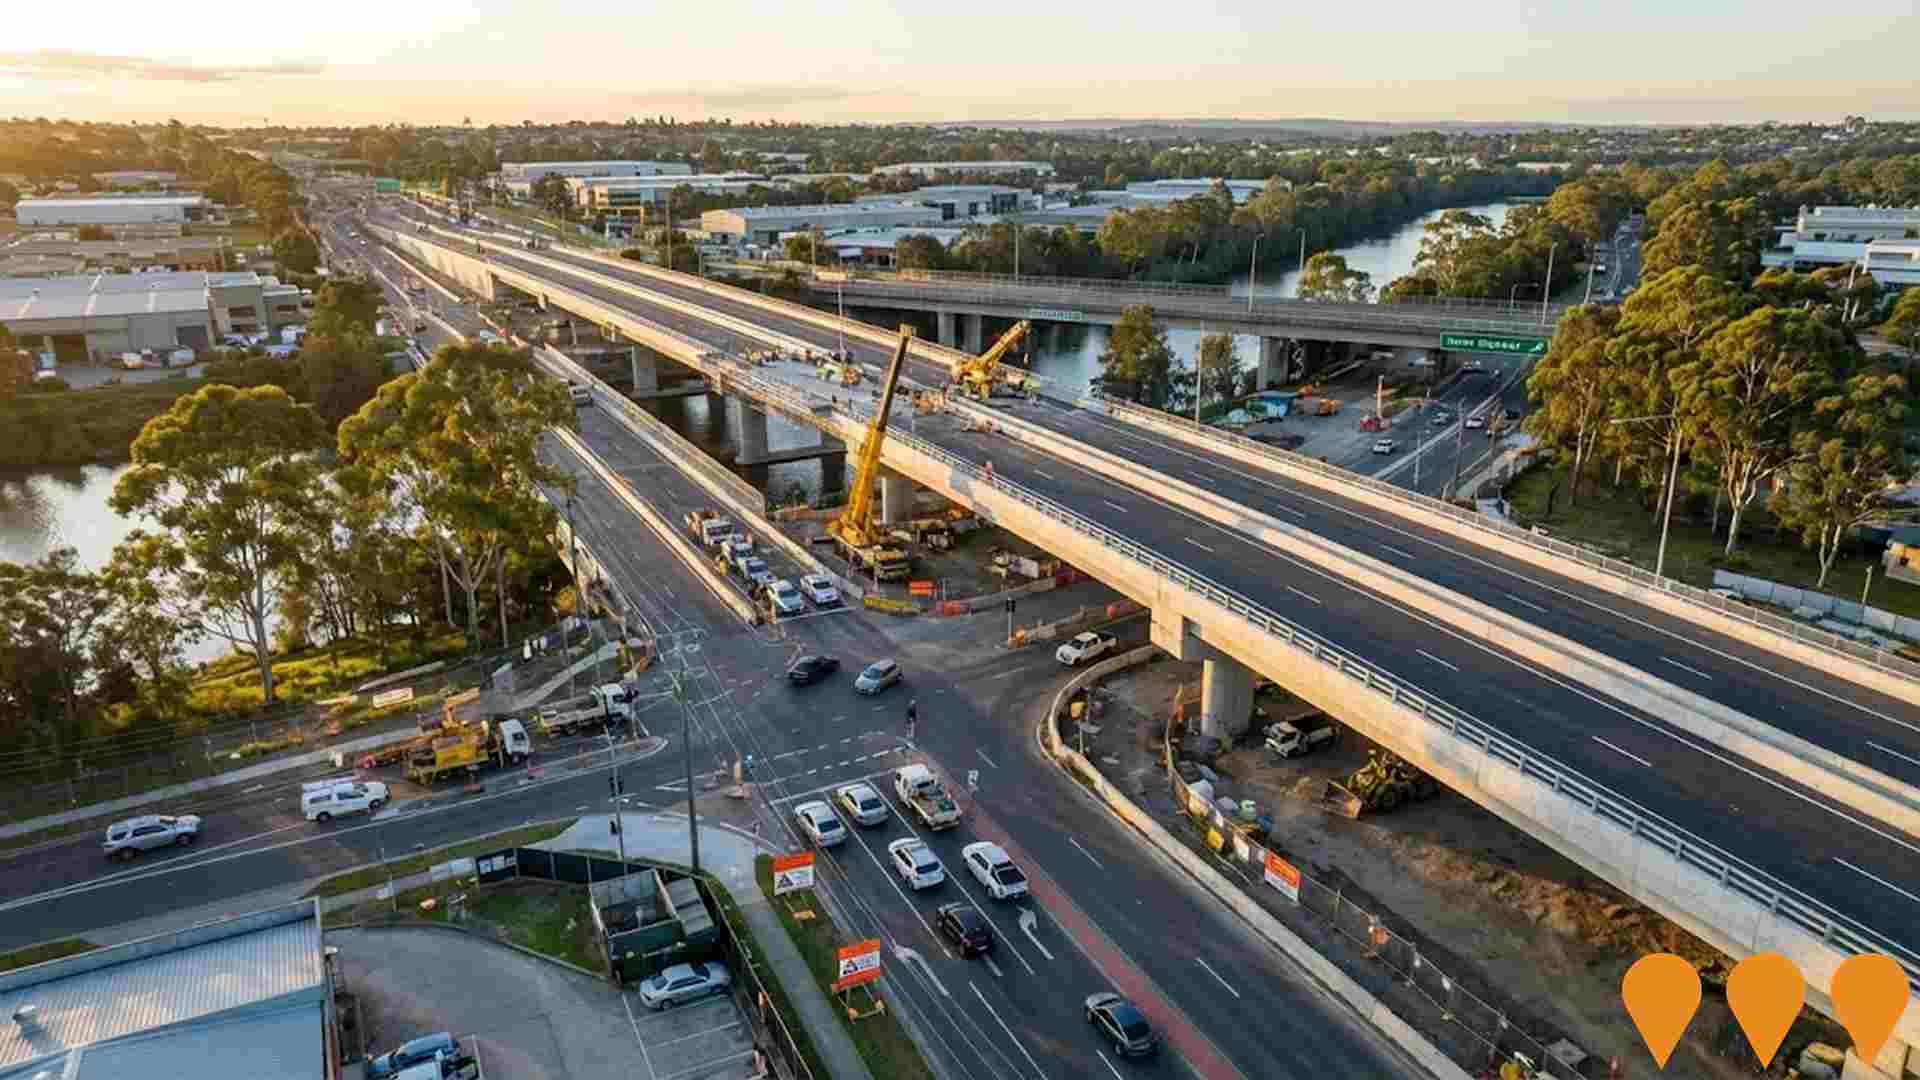
M5 Motorway Westbound Upgrade
Upgrade of the M5 Motorway westbound between Moorebank Avenue and the Hume Highway to reduce congestion and improve safety. Key features include a new three-lane bridge over the Georges River and rail corridors, removal of the traffic weave, additional lanes, improved freight access, and a new shared user path for pedestrians and cyclists.
Light Horse Park Redevelopment
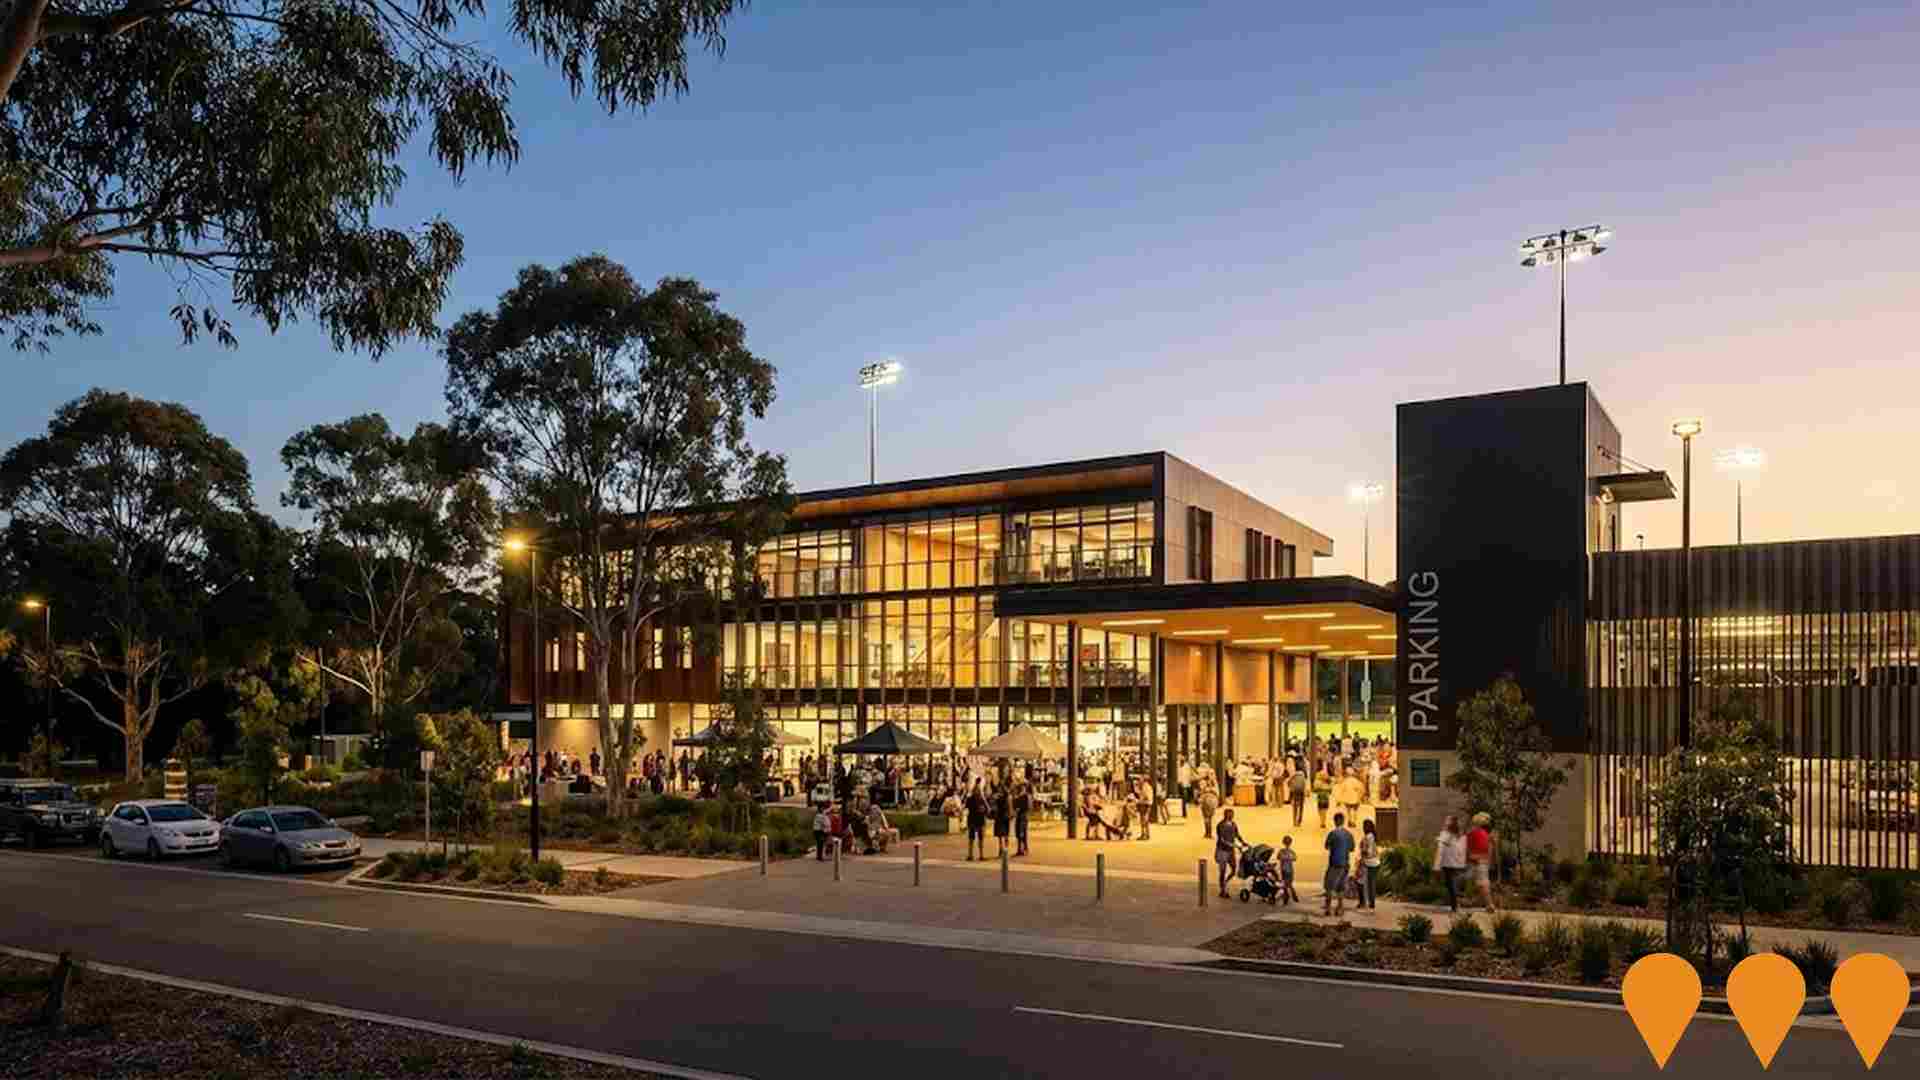
Council-led multi-stage redevelopment of Light Horse Park into a vibrant, inclusive riverfront destination. Stage 1 (accessible kayak launch) complete. Current works (Stage 2) include carpark upgrades, lighting, CCTV, landscaping and EV infrastructure (expected completion April 2026). Future stages include enhanced play spaces, fitness stations, riverbank restoration, viewing platforms, pavilions, picnic areas, oval upgrades and a new community hub. Total project value approximately $36.7 million, funded by NSW Government (WestInvest/WSIG) in association with Liverpool City Council. Expected overall completion early 2027.
Liverpool West Public School Upgrade
NSW Department of Education, via School Infrastructure NSW, delivered a two-stage upgrade of Liverpool West Public School to increase capacity and modernize facilities. Stage 1 (handed over early 2023) delivered 16 flexible learning spaces, 4 special programs rooms, a new hall with COLA, and a new library. Stage 2 facilities were scheduled for Day 1, Term 1, 2024 and included 28 additional flexible learning spaces, 4 support rooms, and a refurbished Mainsbridge House with 2 preschool rooms for Coota Gulla Preschool. Works substantially completed by early 2024.
Employment
AreaSearch assessment indicates Liverpool - West faces employment challenges relative to the majority of Australian markets
Liverpool - West has an unemployment rate of 8.8% and experienced a 6.8% growth in employment over the past year as of September 2025. There are 5,527 residents currently employed, with an unemployment rate of 4.6%, which is higher than Greater Sydney's rate of 4.2%.
The workforce participation rate lags behind Greater Sydney at 38.6% compared to 60.0%. Employment in Liverpool - West is concentrated in health care & social assistance, retail trade, and manufacturing, with a particularly strong specialization in manufacturing at 1.7 times the regional level. However, professional & technical services are under-represented, making up only 4.7% of the workforce compared to Greater Sydney's 11.5%. Over the year to September 2025, employment increased by 6.8%, while labour force grew by 4.7%, leading to a decrease in unemployment rate by 1.8 percentage points.
In contrast, Greater Sydney saw employment grow by 2.1% and unemployment rise slightly by 0.2%. At the state level, NSW experienced a contraction in employment of 0.03% between November 25 and September 25, with an unemployment rate of 3.9%, lower than the national average of 4.3%. Jobs and Skills Australia's projections suggest that national employment will expand by 6.6% over five years and 13.7% over ten years. Applying these projections to Liverpool - West's employment mix indicates local employment should increase by 6.3% over five years and 13.3% over ten years, though this is a simple extrapolation for illustrative purposes and does not account for localized population projections.
Frequently Asked Questions - Employment
Income
Income metrics place the area in the bottom 10% of locations nationally according to AreaSearch analysis
AreaSearch's latest postcode level ATO data for financial year ending June 2022 indicates that median income in Liverpool - West SA2 was $34,480 and average income was $40,538. This is lower than national averages of $56,994 (median) and $80,856 (average) for Greater Sydney. By September 2025, estimated median income in Liverpool - West SA2 would be approximately $38,828 and average income around $45,650 based on Wage Price Index growth of 12.61% since June 2022. The 2021 Census data shows household, family and personal incomes in Liverpool - West SA2 fall between the 2nd and 15th percentiles nationally. The earnings profile reveals that 28.7% (4,284 people) of locals earn between $1,500 and $2,999 annually, a pattern also seen in the region where 30.9% fall within this range. Housing affordability pressures are severe, with only 77.4% of income remaining after housing costs, ranking at the 11th percentile nationally.
Frequently Asked Questions - Income
Housing
Liverpool - West displays a diverse mix of dwelling types, with above-average rates of outright home ownership
Liverpool - West's dwelling structure, as per the latest Census, had 53.9% houses and 46.1% other dwellings (including semi-detached, apartments, 'other' dwellings). In comparison, Sydney metro had 63.3% houses and 36.8% other dwellings. Home ownership in Liverpool - West stood at 25.1%, with mortgaged dwellings at 24.0% and rented dwellings at 50.9%. The median monthly mortgage repayment was $1,733, below Sydney metro's average of $2,167. The median weekly rent figure was $360, compared to Sydney metro's $400. Nationally, Liverpool - West's mortgage repayments were lower than the Australian average of $1,863, and rents were less than the national figure of $375.
Frequently Asked Questions - Housing
Household Composition
Liverpool - West has a typical household mix, with a lower-than-average median household size
Family households constitute 73.3% of all households, including 36.9% couples with children, 17.0% couples without children, and 17.7% single parent families. Non-family households account for the remaining 26.7%, with lone person households at 24.2% and group households comprising 2.5%. The median household size is 2.9 people, which is smaller than the Greater Sydney average of 3.0.
Frequently Asked Questions - Households
Local Schools & Education
Educational outcomes in Liverpool - West fall within the lower quartile nationally, indicating opportunities for improvement in qualification attainment
The area's university qualification rate is 19.2%, significantly lower than Greater Sydney's average of 38.0%. Bachelor degrees are the most common at 13.8%, followed by postgraduate qualifications (4.4%) and graduate diplomas (1.0%). Vocational credentials are prevalent, with 29.7% of residents aged 15+ holding them, including advanced diplomas (11.4%) and certificates (18.3%). Educational participation is high, with 34.1% of residents currently enrolled in formal education.
This includes 11.4% in primary education, 8.7% in secondary education, and 5.6% pursuing tertiary education.
Frequently Asked Questions - Education
Schools Detail
Nearby Services & Amenities
Transport
Transport servicing is high compared to other areas nationally based on assessment of service frequency, route connectivity and accessibility
Liverpool - West has 89 active public transport stops operating within its boundaries. These stops are serviced by a total of 63 individual bus routes. Together, these routes provide a weekly passenger trip count of 4,976 trips.
The accessibility of transport in the area is rated as excellent, with residents typically located approximately 122 meters from their nearest transport stop. Across all routes, service frequency averages at 710 trips per day, which equates to about 55 weekly trips per individual stop.
Frequently Asked Questions - Transport
Transport Stops Detail
Health
Liverpool - West's residents are healthier than average in comparison to broader Australia with prevalence of common health conditions quite low among the general population though higher than the nation's average across older, at risk cohorts
Liverpool-West residents have a relatively positive health profile, with low prevalence rates for common health conditions among the general population. However, these rates are higher than the national average among older and at-risk cohorts. As of 2021, approximately 46% (~6,792 people) of the total population has private health cover, compared to Greater Sydney's 50.4%.
Nationally, this figure stands at 55.3%. Arthritis and diabetes are the most common medical conditions in the area, affecting 7.0 and 6.4% of residents respectively, as of 2021 data. Conversely, 72.9% of residents report being completely clear of medical ailments, compared to Greater Sydney's 76.4%. As of 2021, 16.6% (2,476 people) of Liverpool-West residents are aged 65 and over, higher than the 12.8% in Greater Sydney. Health outcomes among seniors require more attention due to presenting some challenges compared to the broader population.
Frequently Asked Questions - Health
Cultural Diversity
Liverpool - West is among the most culturally diverse areas in the country based on AreaSearch assessment of a range of language and cultural background related metrics
Liverpool-West has a population where 59.3% were born overseas, with 71.3% speaking languages other than English at home. Christianity is the predominant religion in Liverpool-West, accounting for 45.1%. The 'Other' category comprises 16.1%, significantly higher than Greater Sydney's average of 5.1%.
In terms of ancestry, 'Other' tops at 37.0% (higher than the regional average of 27.9%), followed by Australian at 10.5% and English at 8.6%. Notably, Serbian (6.3%) Vietnamese (5.6%), and Lebanese (4.4%) groups are overrepresented compared to regional averages of 2.4%, 3.6%, and 5.2%, respectively.
Frequently Asked Questions - Diversity
Age
Liverpool - West's population is slightly younger than the national pattern
Liverpool-West's median age is nearly matching Greater Sydney's average of 37 years, which is modestly under the Australian median of 38 years. Compared to Greater Sydney, Liverpool-West has a higher concentration of residents aged 0-4 (7.0%) but fewer residents aged 35-44 (13.1%). Between the 2021 Census and present, the population aged 15-24 has grown from 13.0% to 13.7%. Conversely, the population aged 45-54 has declined from 11.6% to 10.6%. Demographic modeling suggests Liverpool-West's age profile will significantly evolve by 2041. The 45-54 cohort is projected to grow strongly at 73%, adding 1,156 residents to reach 2,740. In contrast, both the 25-34 and 15-24 age groups are expected to decrease in numbers.
