Chart Color Schemes
This analysis uses ABS Statistical Areas Level 2 (SA2) boundaries, which can materially differ from Suburbs and Localities (SAL) even when sharing similar names.
SA2 boundaries are defined by the Australian Bureau of Statistics and are designed to represent communities for statistical reporting (e.g., census and ERP).
Suburbs and Localities (SAL) represent commonly-used suburb/locality names (postal-style areas) and may use different geographic boundaries. For comprehensive analysis, consider reviewing both boundary types if available.
est. as @ -- *
ABS ERP | -- people | --
2021 Census | -- people
Sales Activity
Curious about local property values? Filter the chart to assess the volume and appreciation (including resales) trends and regional comparisons, or scroll to the map below view this information at an individual property level.
Find a Recent Sale
Sales Detail
Population
Population growth drivers in Bonnyrigg Heights - Bonnyrigg are above average based on AreaSearch's ranking of recent, and medium to long-term trends
Bonnyrigg Heights - Bonnyrigg's population is approximately 17,473 as of November 2025. This figure represents a rise of 319 individuals, a 1.9% increase from the 2021 Census which recorded a population of 17,154. The growth is inferred from the estimated resident population of 17,421 in June 2024 and an additional 61 validated new addresses since the Census date. This results in a population density ratio of 3,366 persons per square kilometer, placing Bonnyrigg Heights - Bonnyrigg in the upper quartile relative to national locations assessed by AreaSearch. Over the past decade, from 2015 to 2025, Bonnyrigg Heights - Bonnyrigg has exhibited resilient growth patterns with a compound annual growth rate of 0.6%, outperforming the SA3 area. Overseas migration contributed approximately 71.2% of overall population gains during recent periods.
AreaSearch is adopting ABS/Geoscience Australia projections for each SA2 area, released in 2024 using 2022 as the base year. For areas not covered by this data, AreaSearch utilises NSW State Government's SA2 level projections, released in 2022 with 2021 as the base year. Growth rates by age group from these aggregations are applied to all areas for years 2032 to 2041. According to population projections, an above median growth is expected for Bonnyrigg Heights - Bonnyrigg, with a projected increase of 3,544 persons by 2041 based on the latest annual ERP population numbers. This reflects a total increase of 20.0% over the 17-year period from 2024 to 2041.
Frequently Asked Questions - Population
Development
Residential development activity is lower than average in Bonnyrigg Heights - Bonnyrigg according to AreaSearch's national comparison of local real estate markets
Bonnyrigg Heights - Bonnyrigg averaged approximately 44 new dwelling approvals annually. Over the past five financial years, from FY21 to FY25223 homes were approved, with a further 19 approved in FY26 so far. This results in an average of about one new resident per year arriving for each new home over these five years.
New construction is meeting or exceeding demand, providing more options for buyers and facilitating population growth that may exceed current projections. The average expected construction cost value of new dwellings is $237,000, which is below the regional average, suggesting more affordable housing options. In FY26, $6.1 million in commercial development approvals have been recorded, indicating the area's predominantly residential character. Compared to Greater Sydney, Bonnyrigg Heights - Bonnyrigg shows approximately 56% of construction activity per person and ranks among the 34th percentile nationally, suggesting relatively constrained buyer choice and supporting interest in existing homes.
New building activity comprises 94.0% detached dwellings and 6.0% medium and high-density housing, preserving the area's suburban nature and attracting space-seeking buyers. With around 469 people per dwelling approval, Bonnyrigg Heights - Bonnyrigg indicates a developed market. According to AreaSearch's latest quarterly estimate, the area is projected to add approximately 3,492 residents by 2041. If current development rates continue, housing supply may struggle to keep pace with population growth, potentially intensifying buyer competition and supporting price increases.
Frequently Asked Questions - Development
Infrastructure
Bonnyrigg Heights - Bonnyrigg has strong levels of nearby infrastructure activity, ranking in the top 30% nationally
Changes to local infrastructure significantly influence an area's performance. AreaSearch identified 23 projects likely impacting the area. Key projects include Canvas at Bonnyrigg, Bonnyrigg Estate Renewal - Humphries Precinct, Bonnyrigg Town Hub Precinct (Stages 12-13), and Bonnyrigg Estate Renewal. The following list details those most relevant.
Professional plan users can use the search below to filter and access additional projects.
INFRASTRUCTURE SEARCH
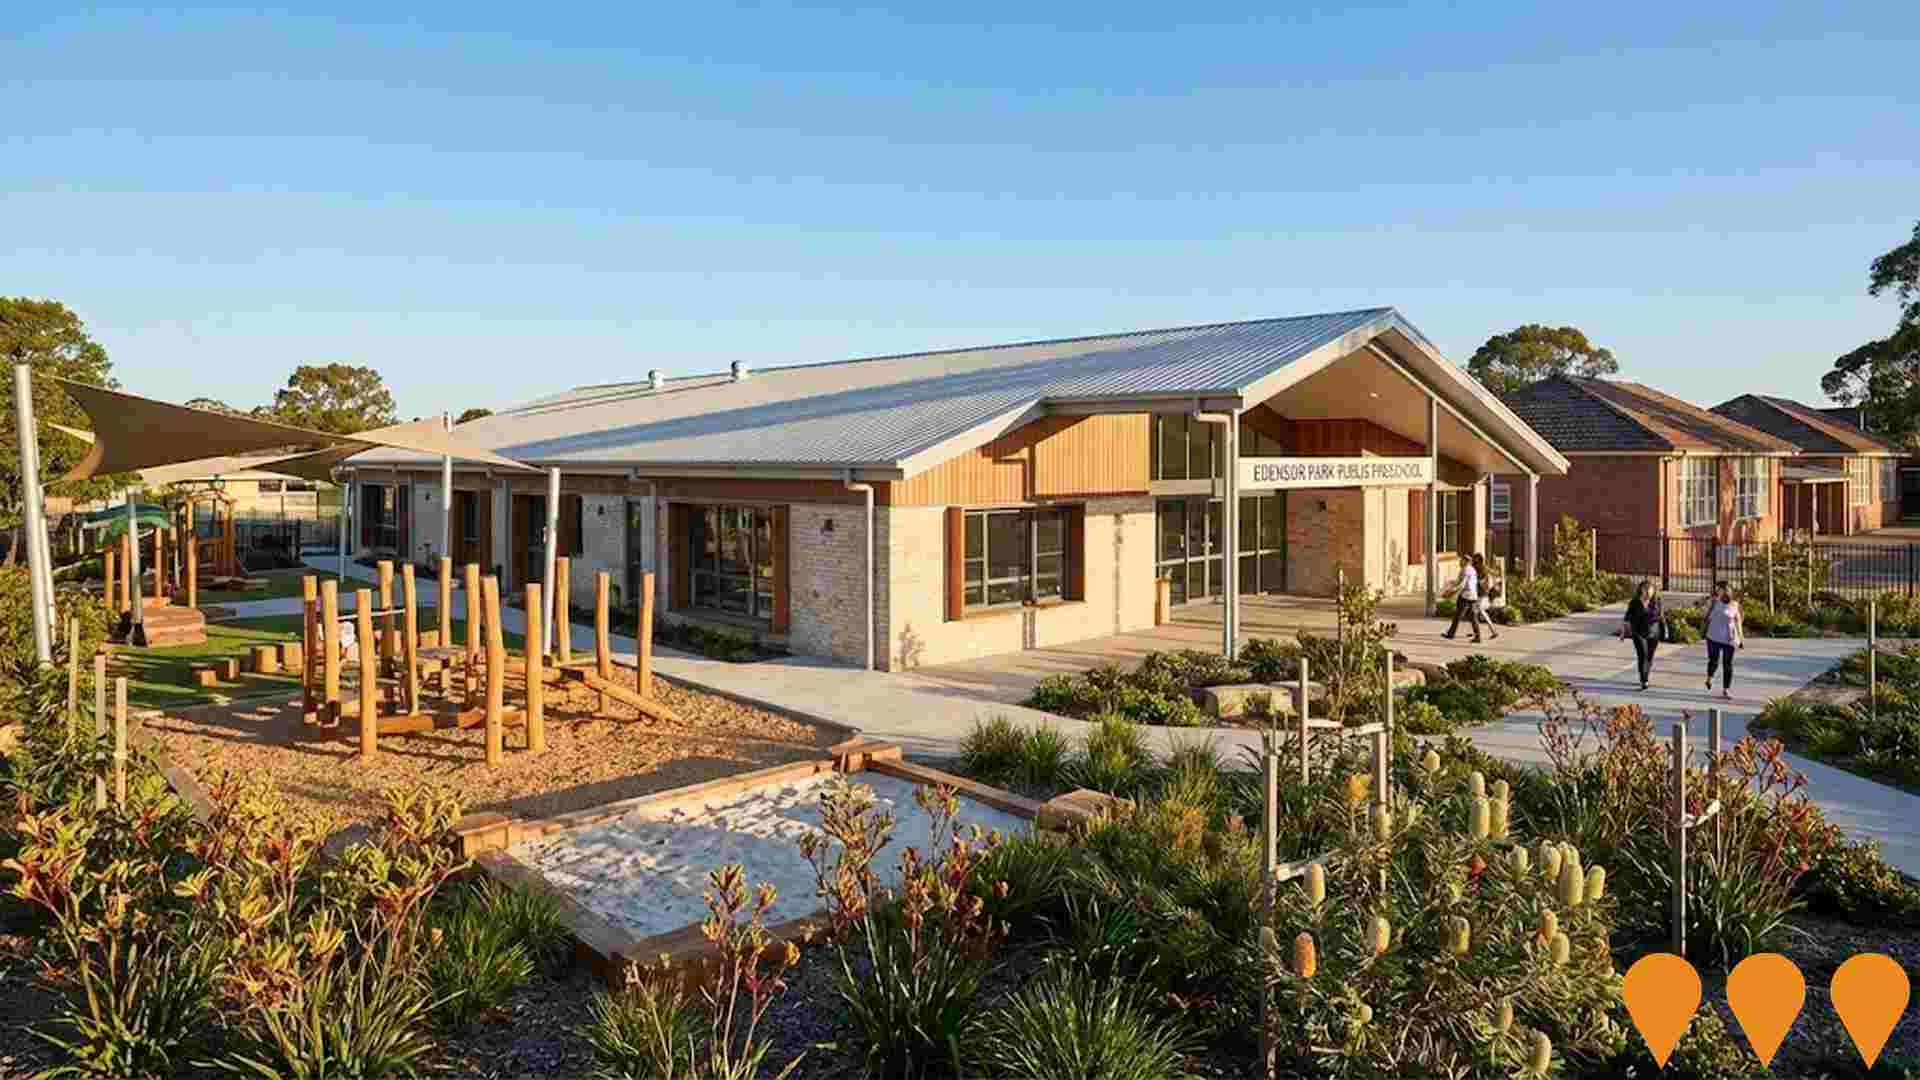
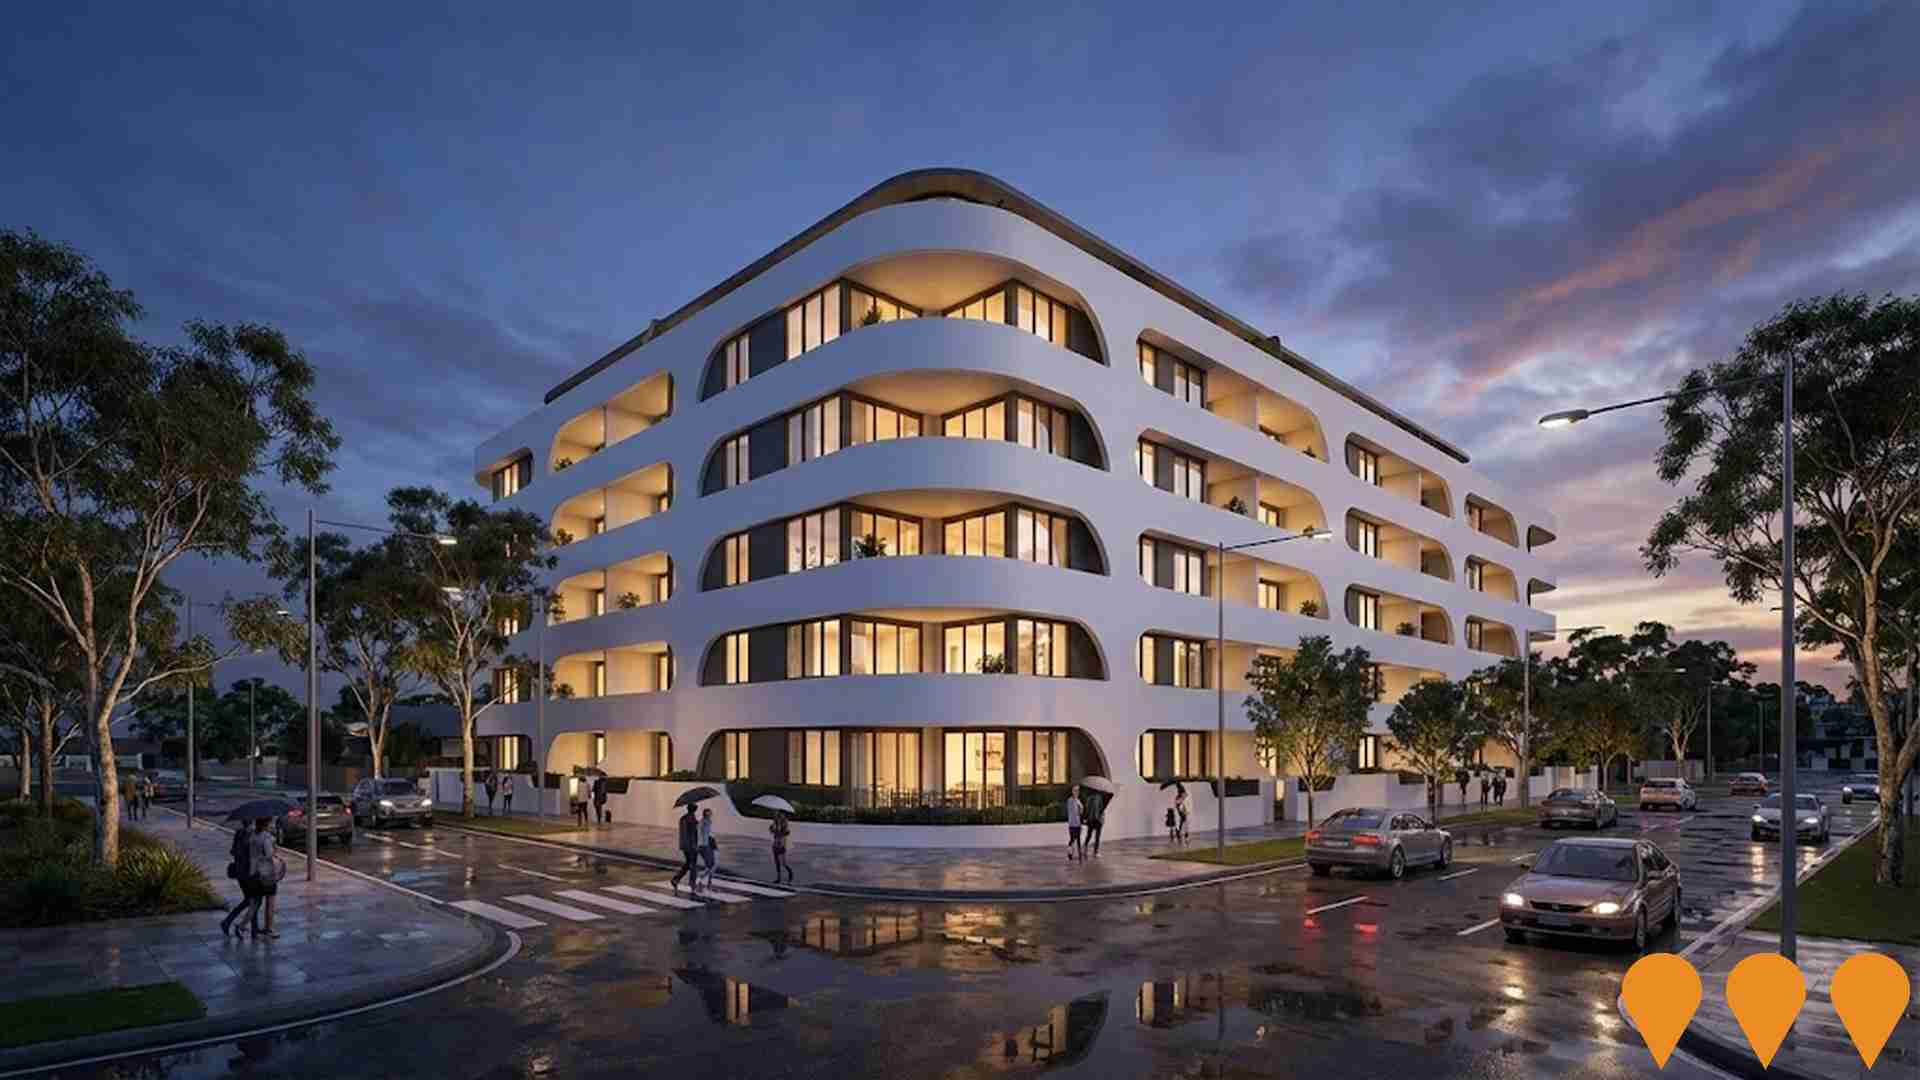
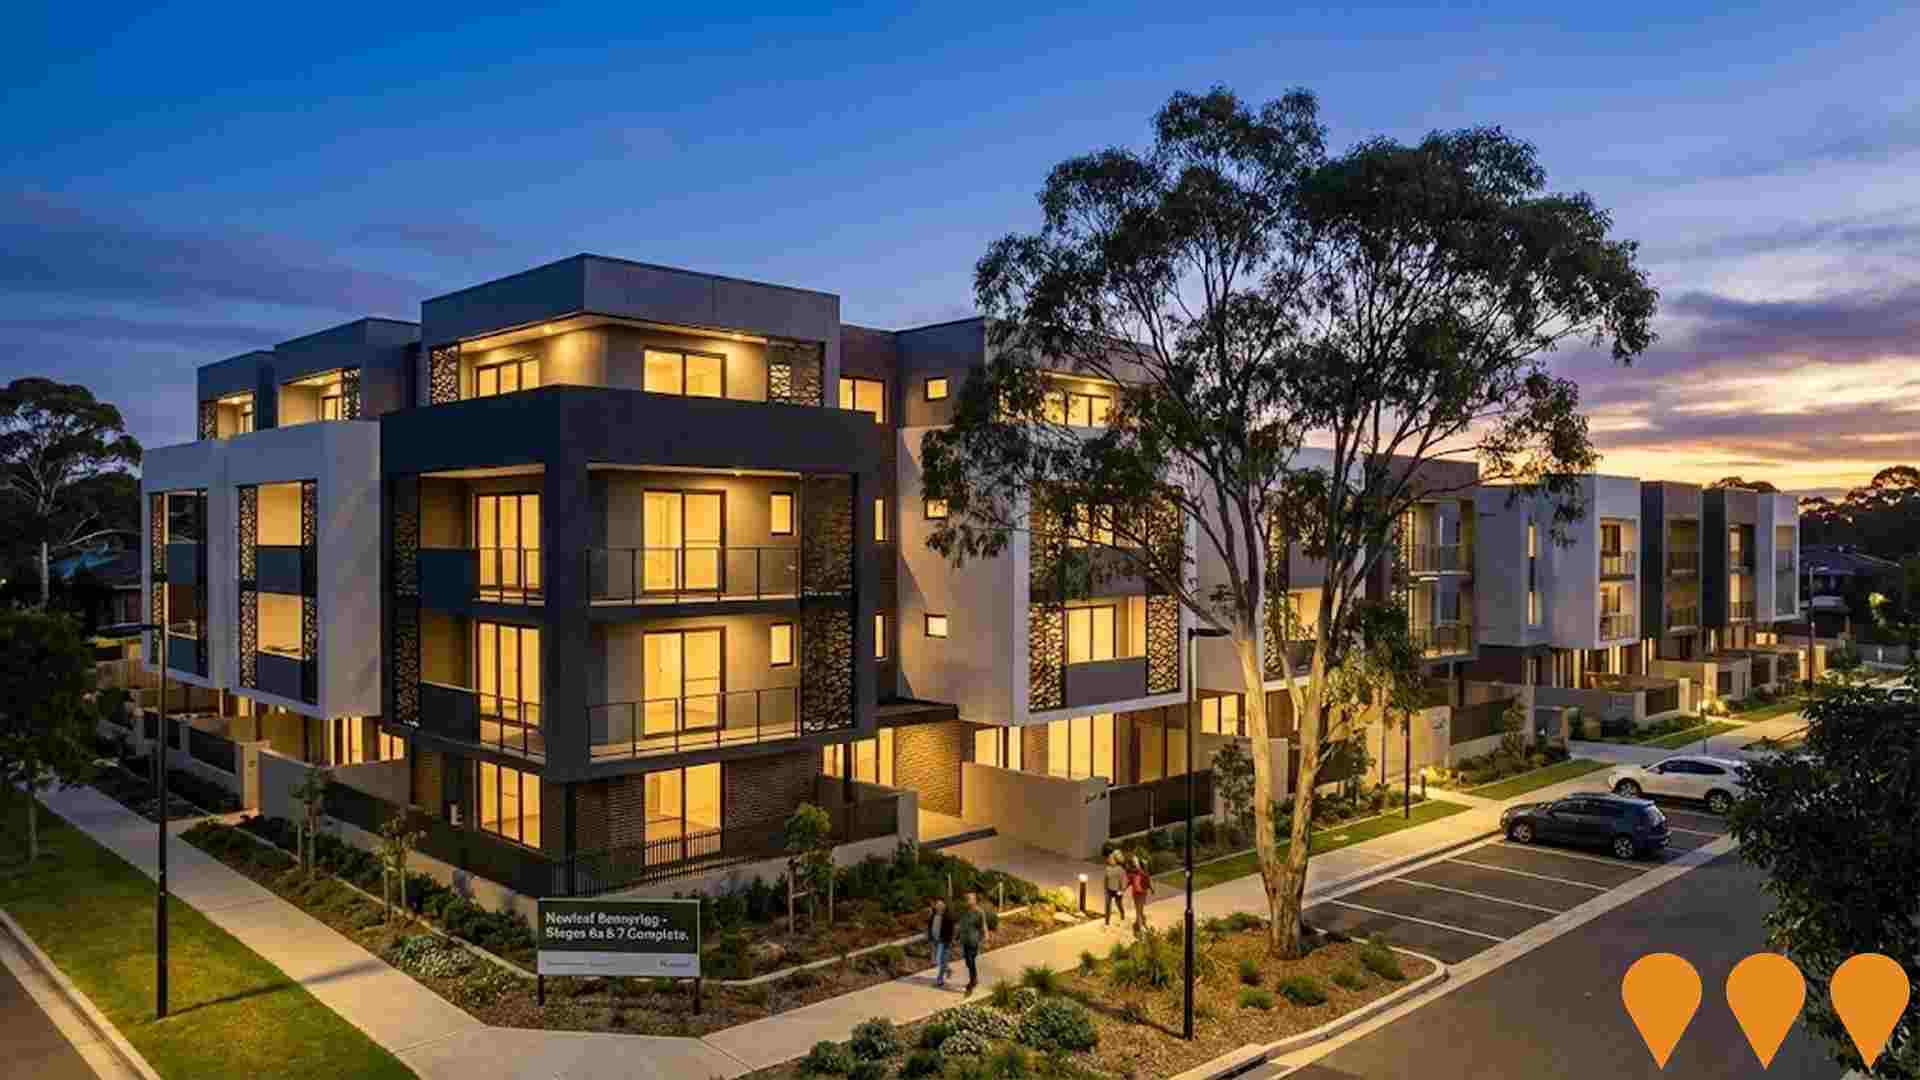
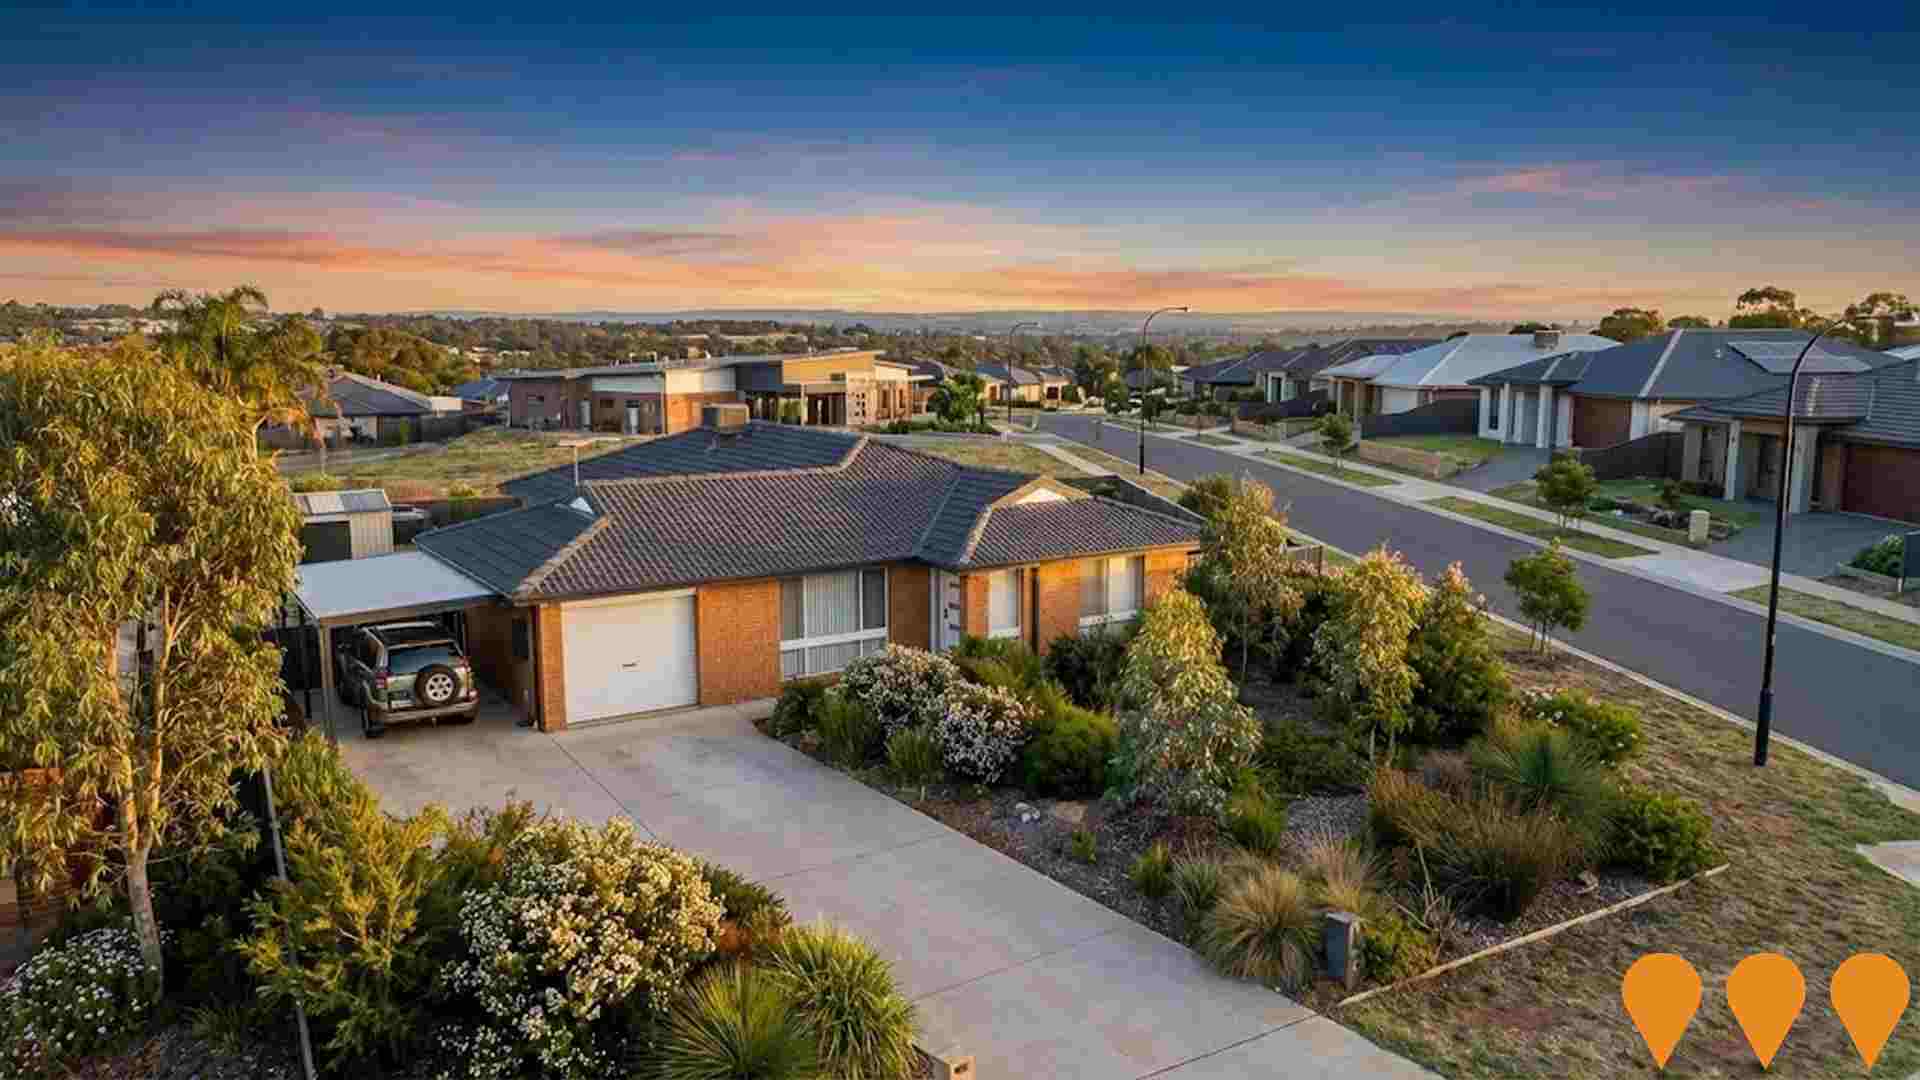
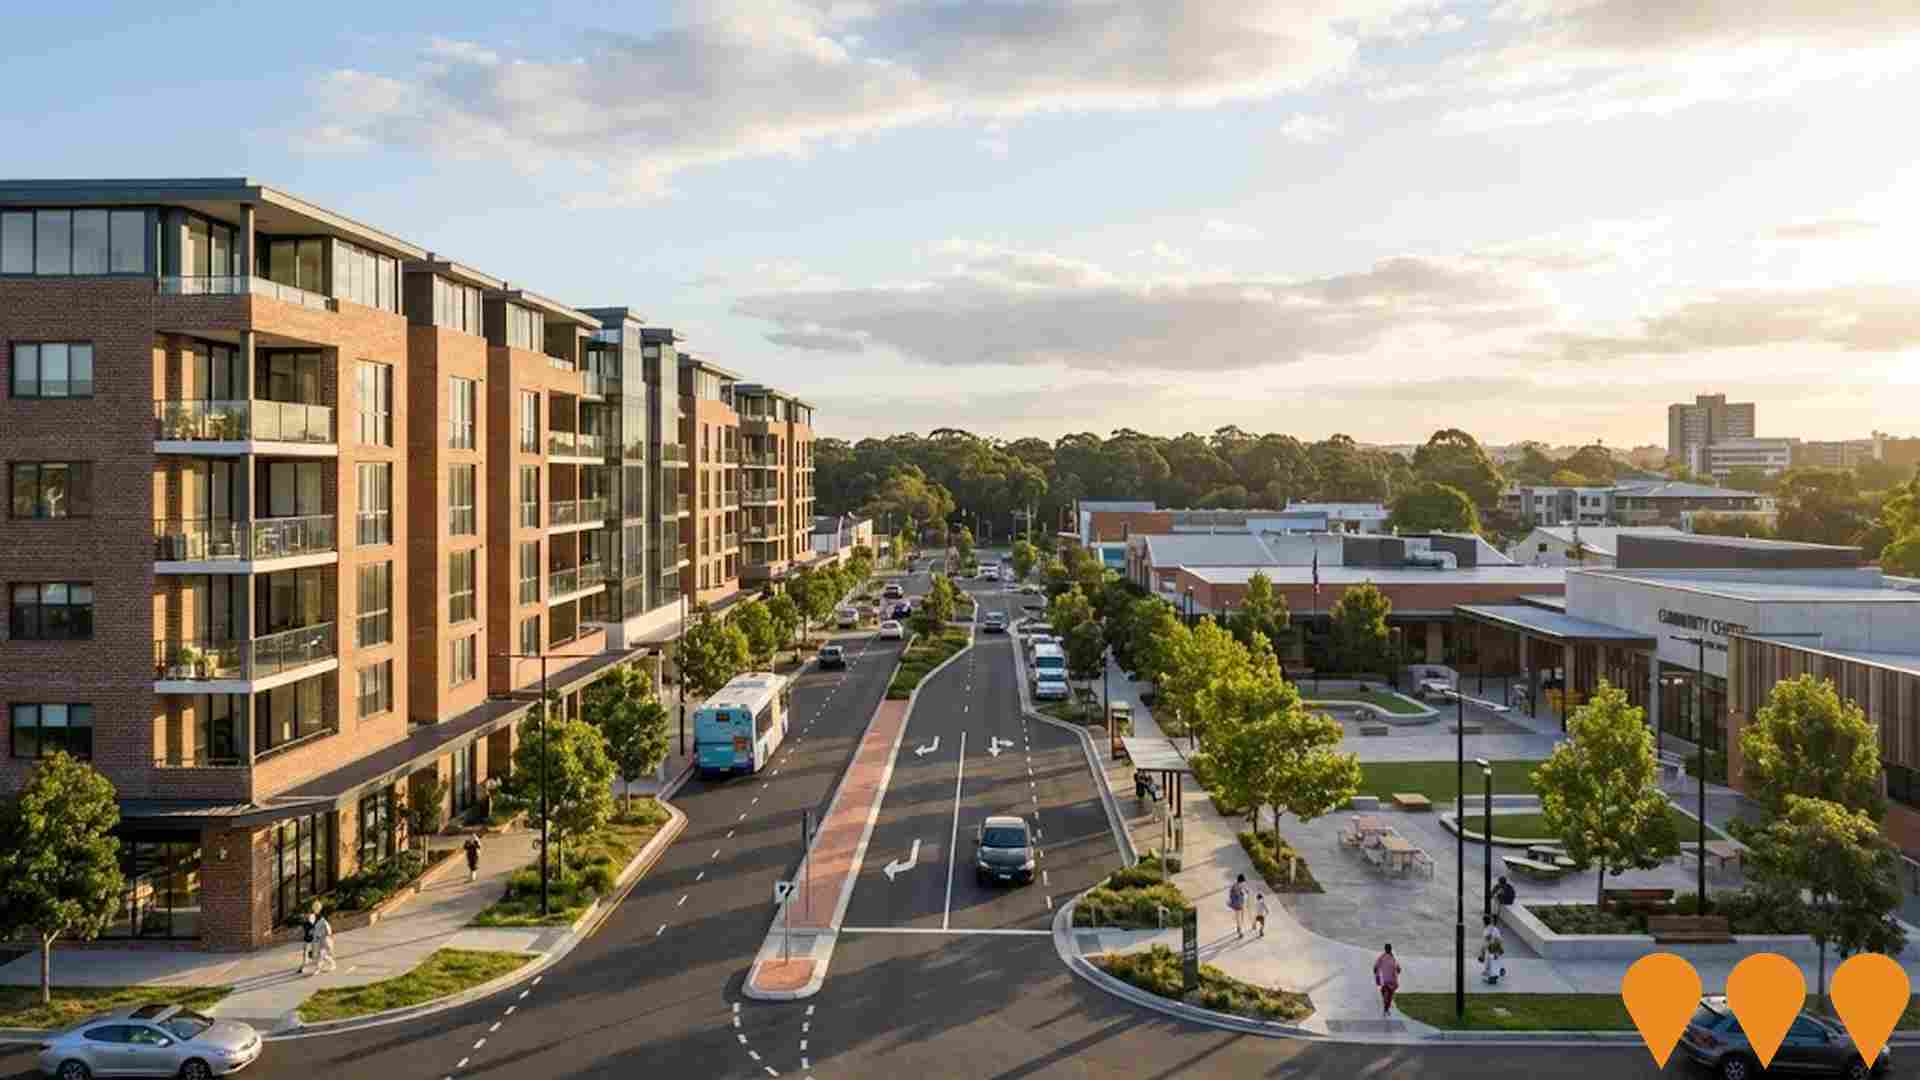
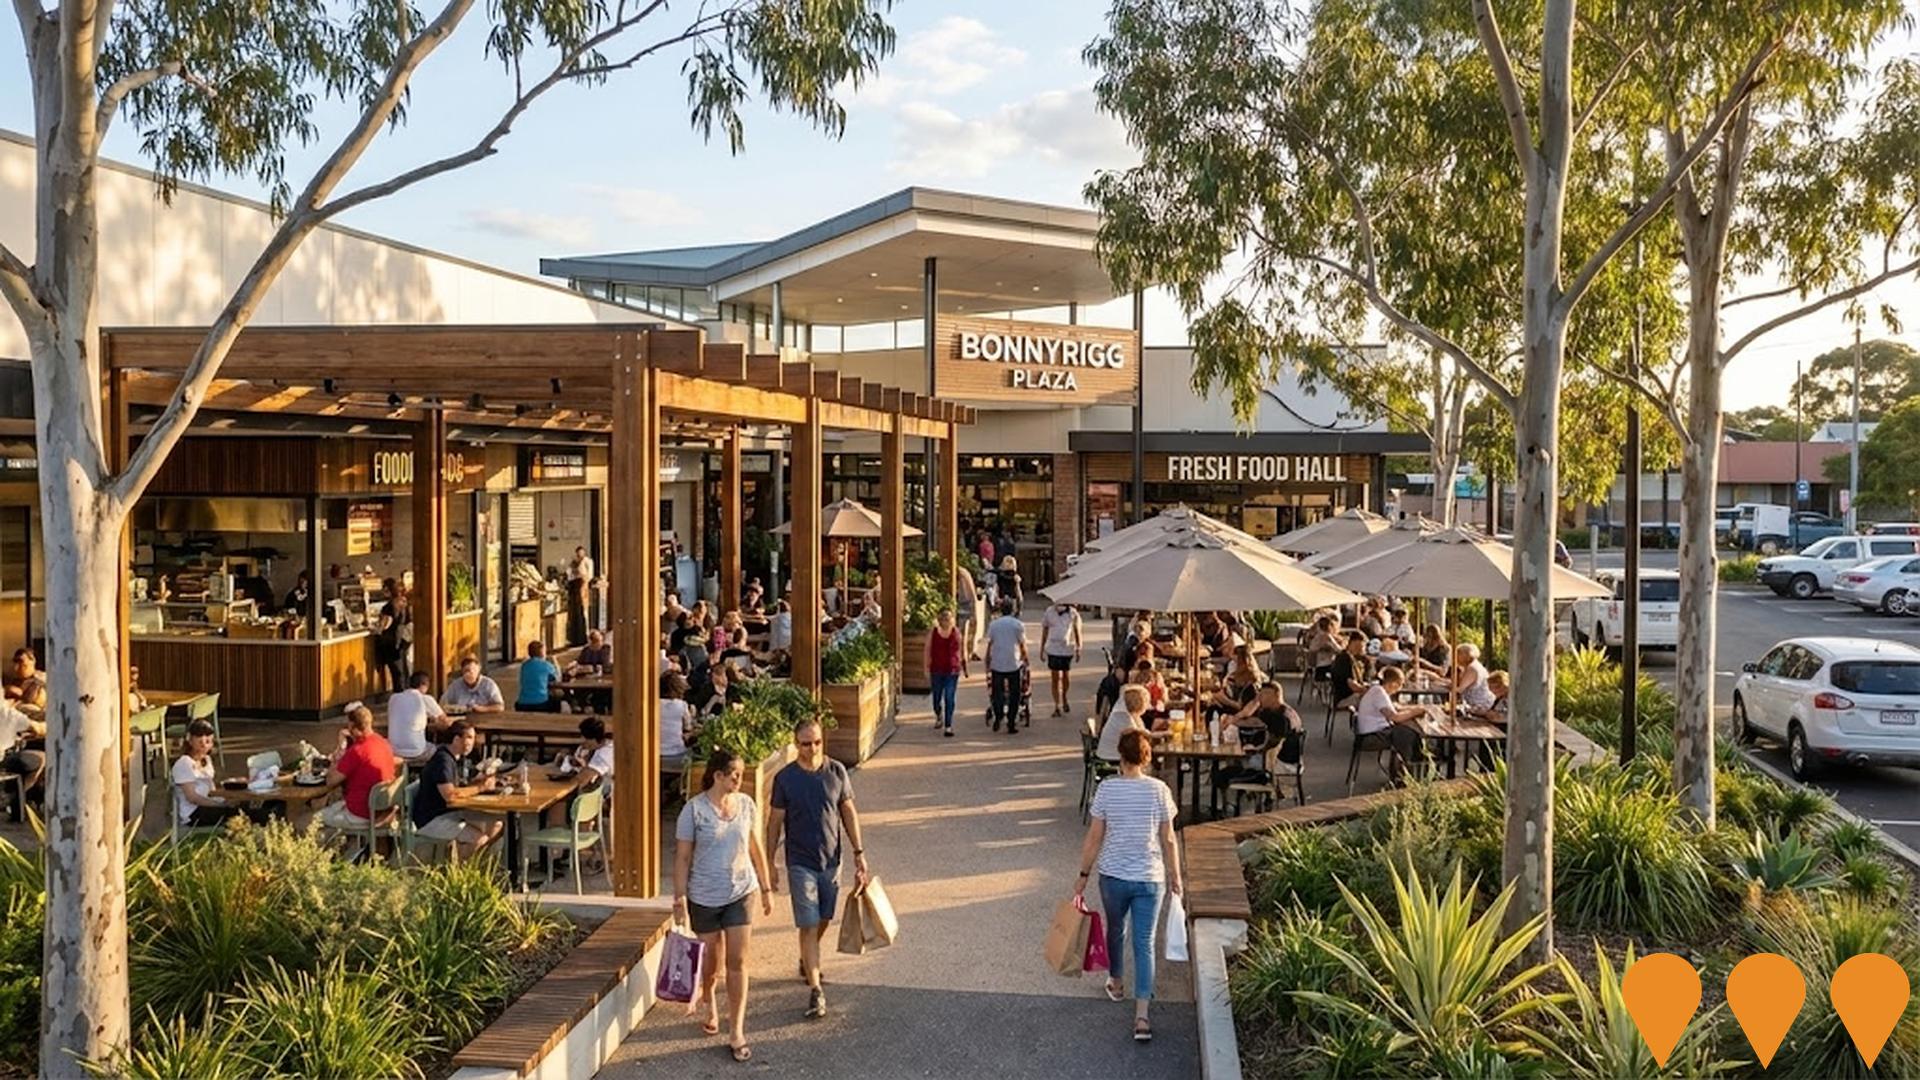
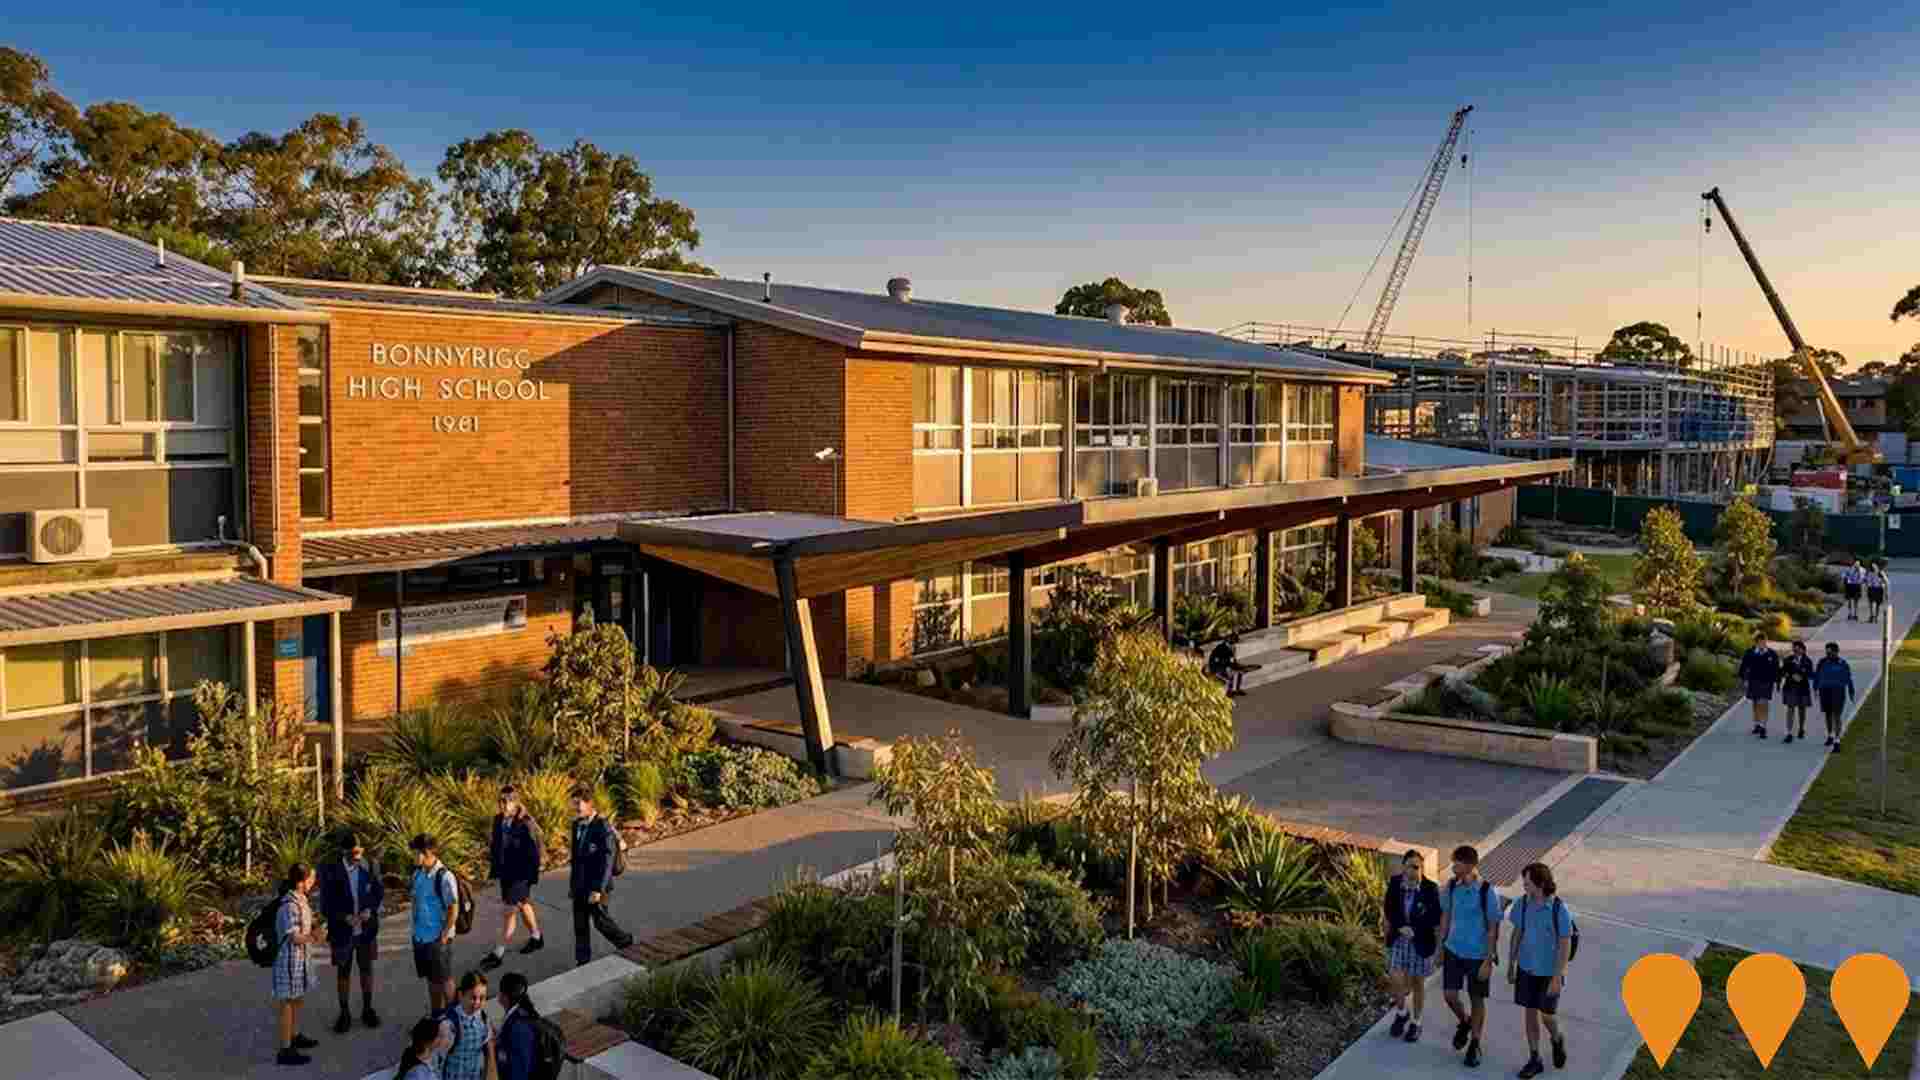
 Denotes AI-based impression for illustrative purposes only, not to be taken as definitive under any circumstances. Please follow links and conduct other investigations from the project's source for actual imagery. Developers and project owners wishing us to use original imagery please Contact Us and we will do so.
Frequently Asked Questions - Infrastructure
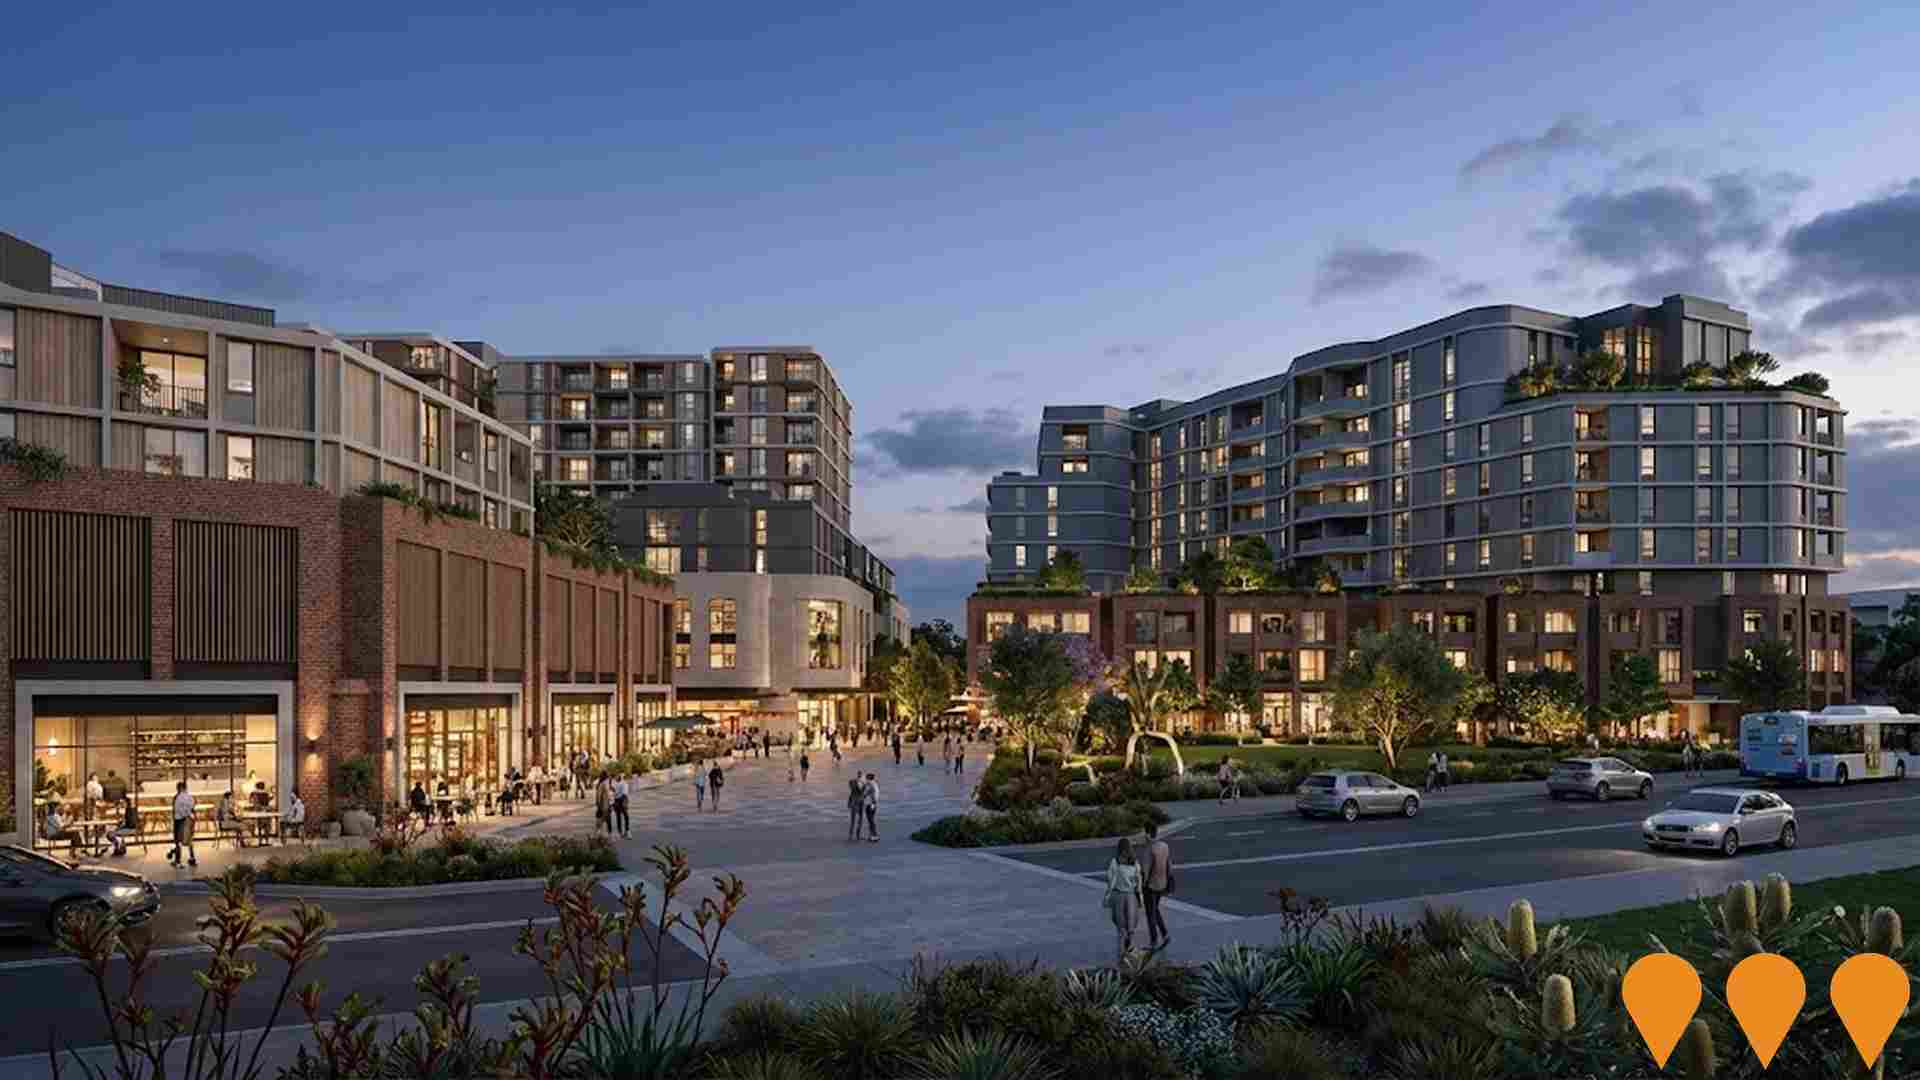
Bonnyrigg Estate Renewal - Humphries Precinct
$400 million urban renewal project transforming former Bonnyrigg public housing estate into mixed-income community. Stage 3 (Humphries Precinct) includes 340 new homes with a mix of social, affordable, and private housing, plus a community centre, park upgrades, and retail spaces. Part of NSW Government's Communities Plus program.
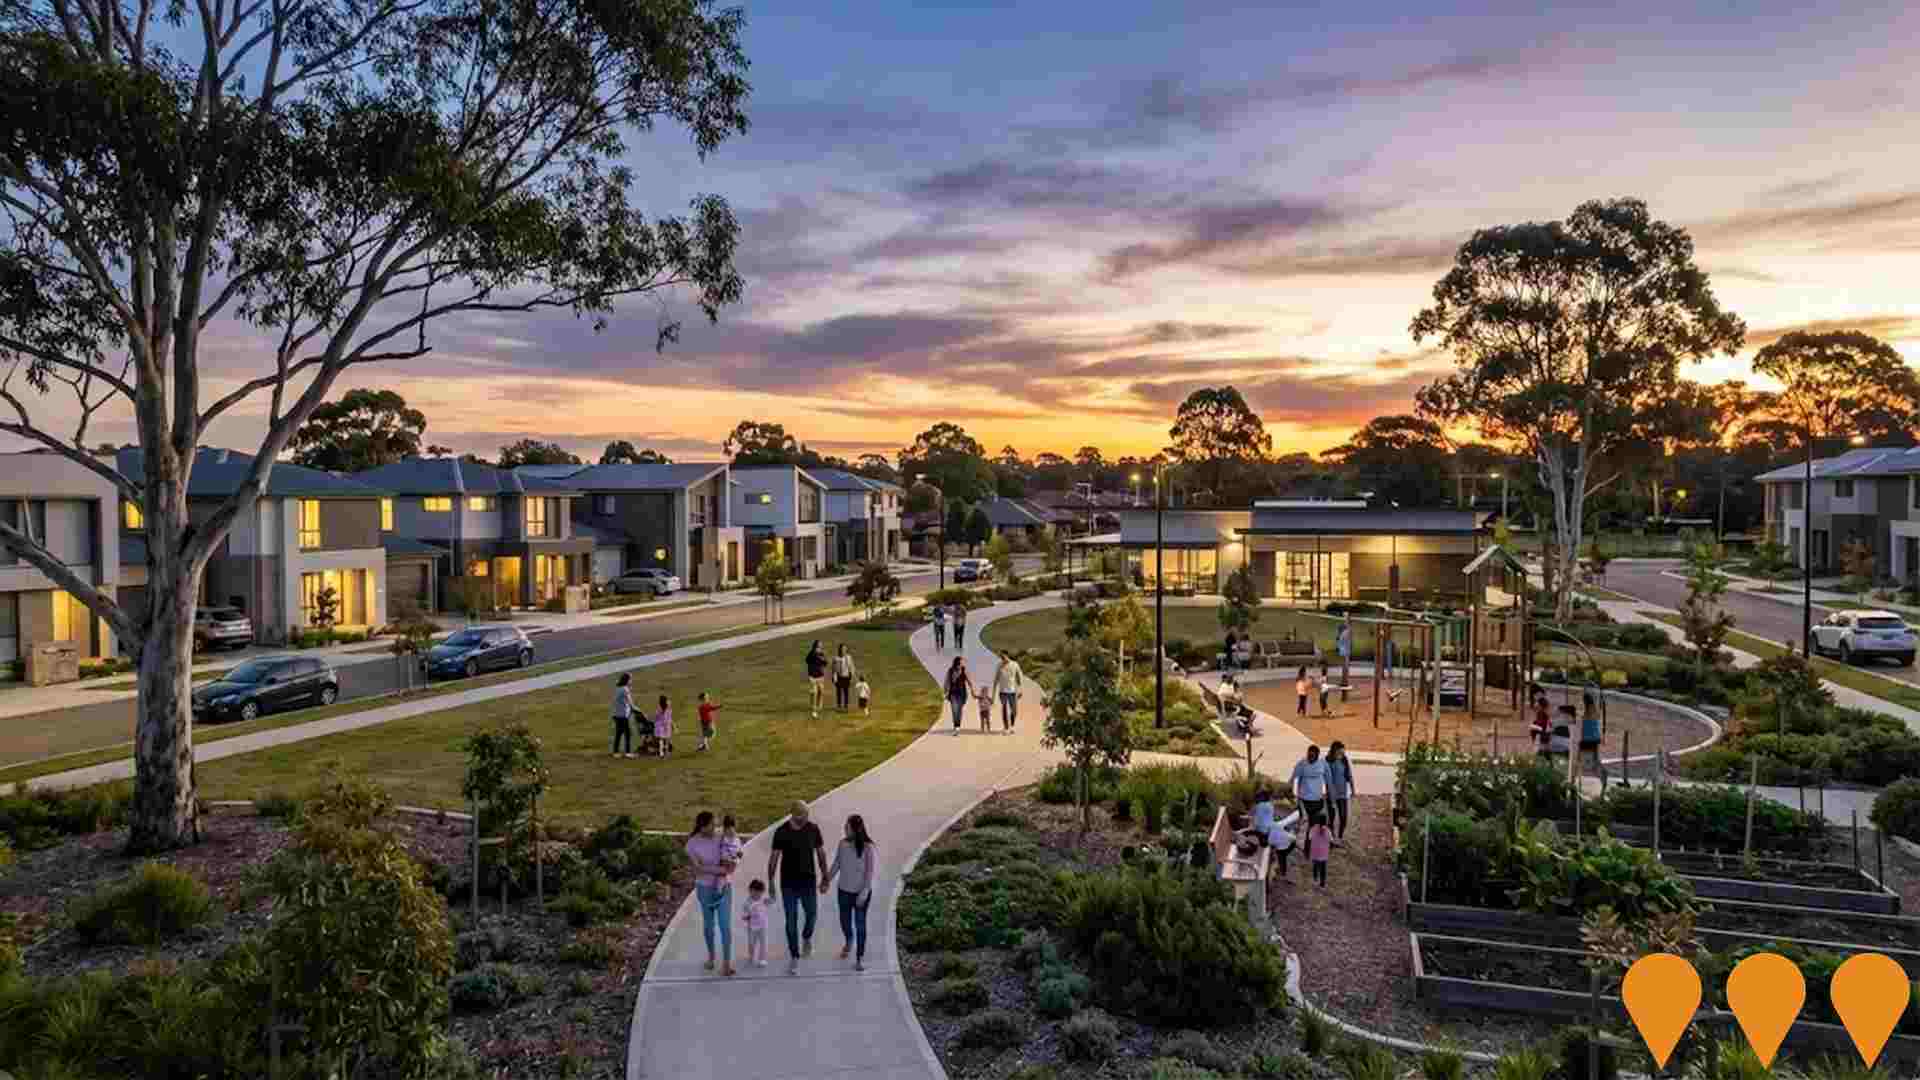
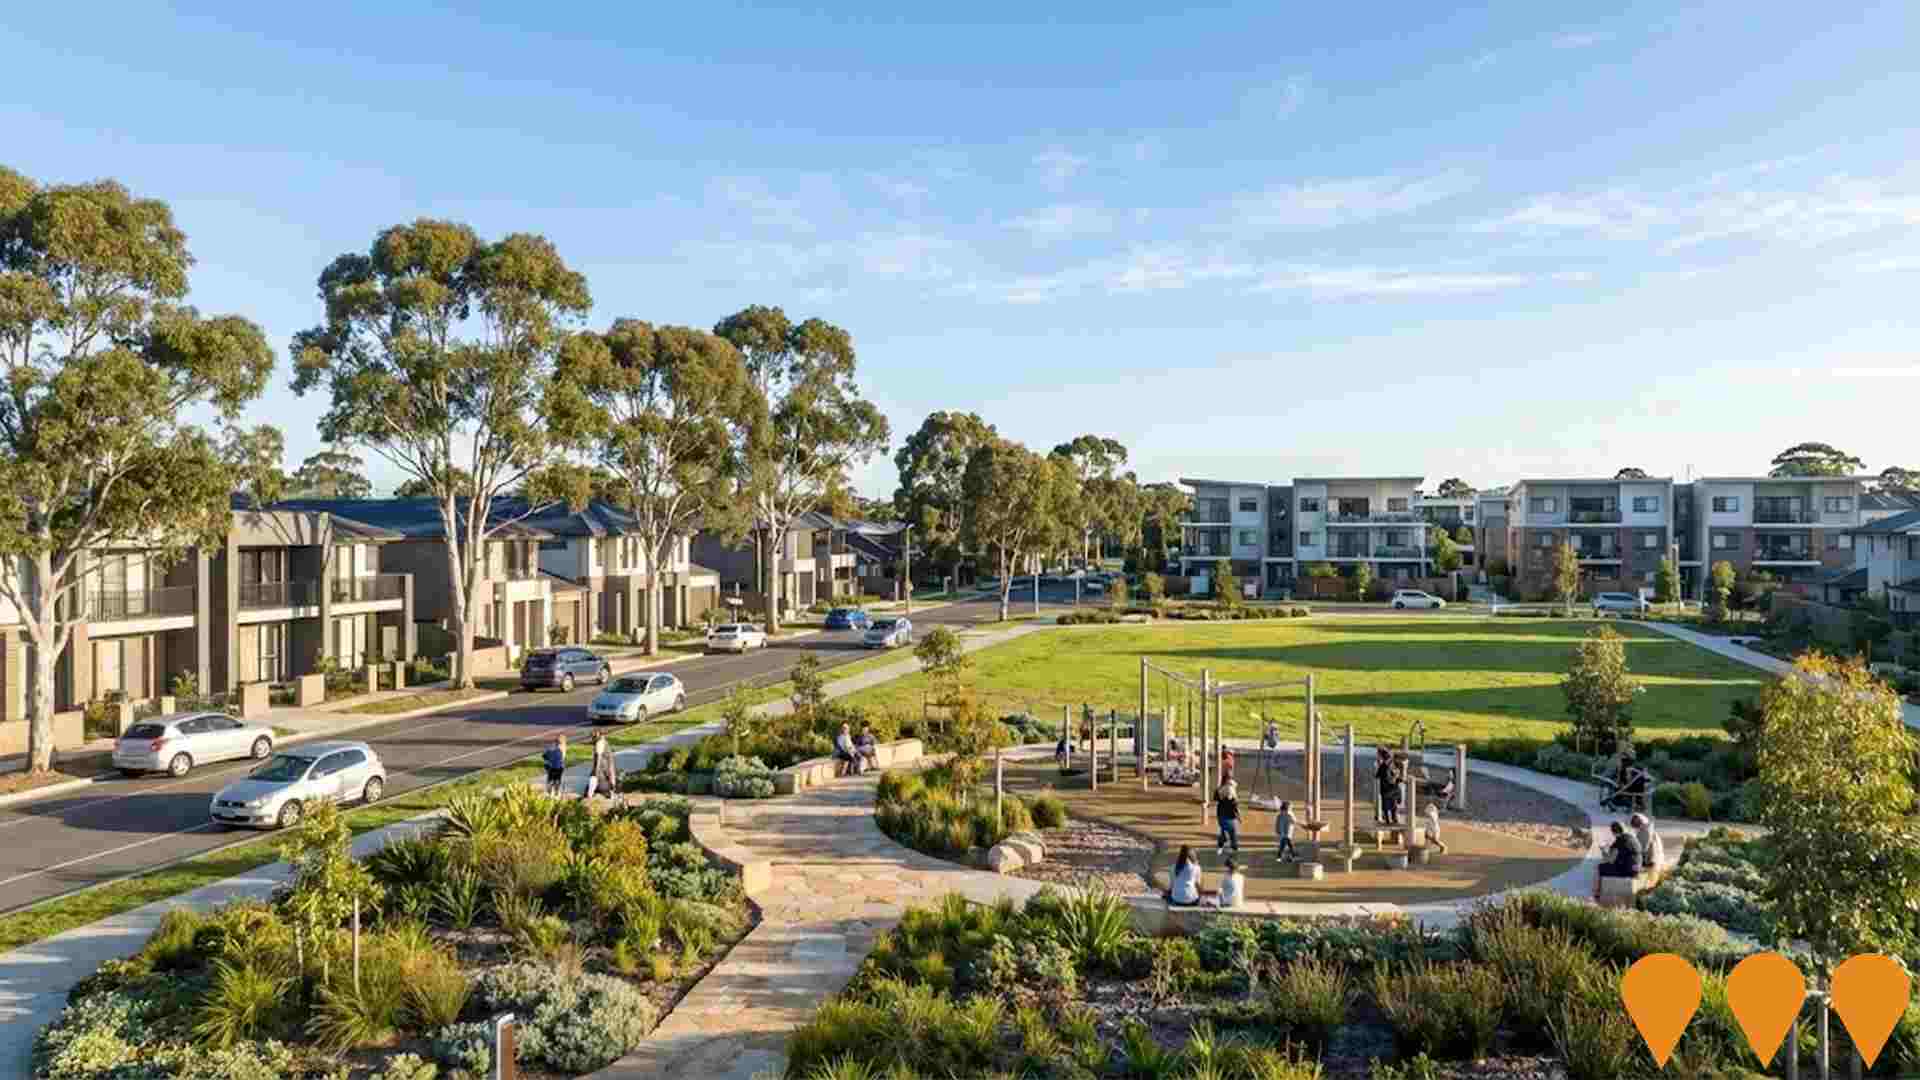
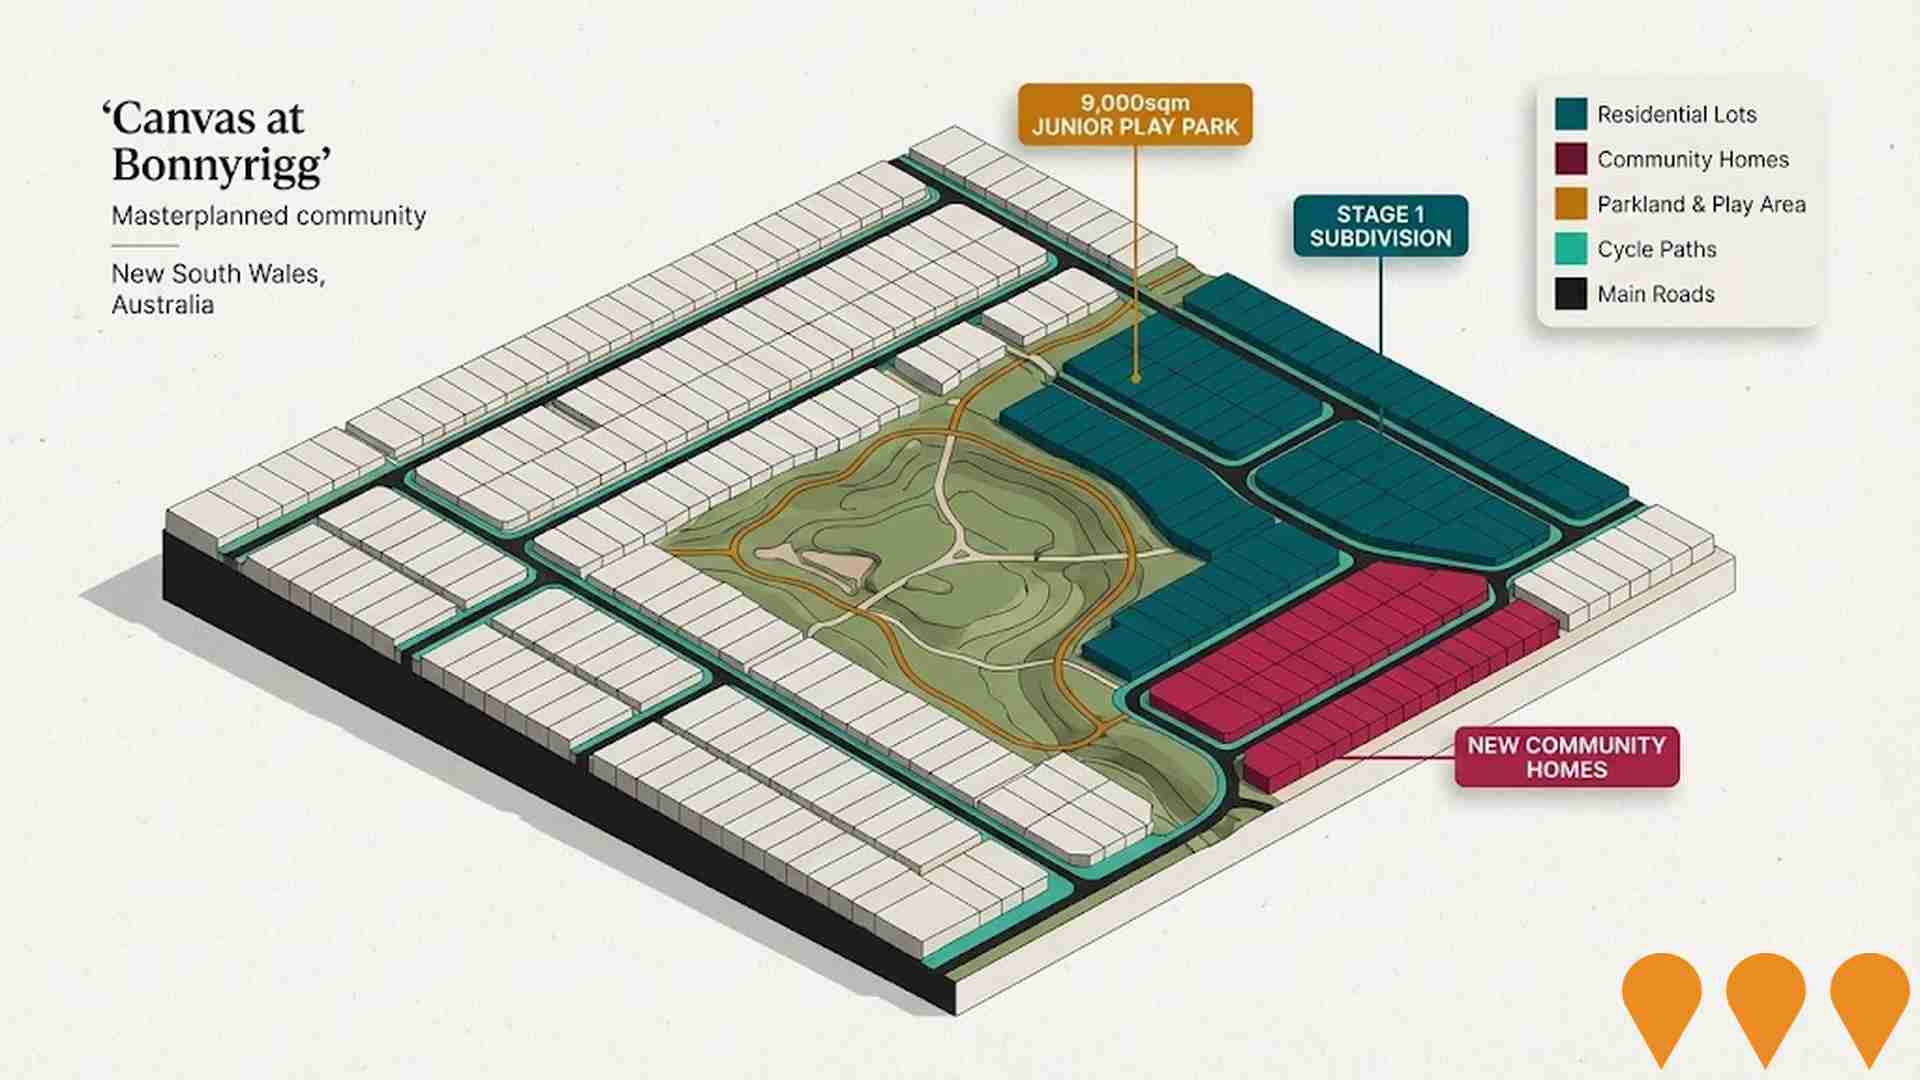
Canvas at Bonnyrigg
Canvas is a masterplanned community being developed as part of the Bonnyrigg Estate renewal. It will deliver 210 land lots for private sale and 65 new community homes, with the potential for more social homes in later stages. The project includes new and extended roads, as well as a new 9,000sqm public junior play park with play equipment, cycle paths, and picnic areas. Stage 1 subdivision works are currently progressing, with completion anticipated by the end of 2025. Land lots are available for purchase with an anticipated settlement in 2026.
Bonnyrigg Town Hub Precinct (Stages 12-13)
Part of the larger Bonnyrigg Renewal project, the Town Hub Precinct (Stages 12-13) involves the construction of a new link road and super lots for future apartment and townhouse buildings. It will eventually include 185 new social homes and a total of 600 homes in a mixed-tenure model, alongside a new plaza and parkland areas. Subdivision works for the new road and lots have commenced.
Bonnyrigg Plaza Revitalisation Project
Revitalisation project completed in late 2018/early 2019 to modernise the 30-year-old shopping centre. The works included upgrading the food and retail offerings, creating a new food market hall and fresh food precinct, adding new food and beverage tenancies, reconfiguring existing spaces, and adding an alfresco dining area.
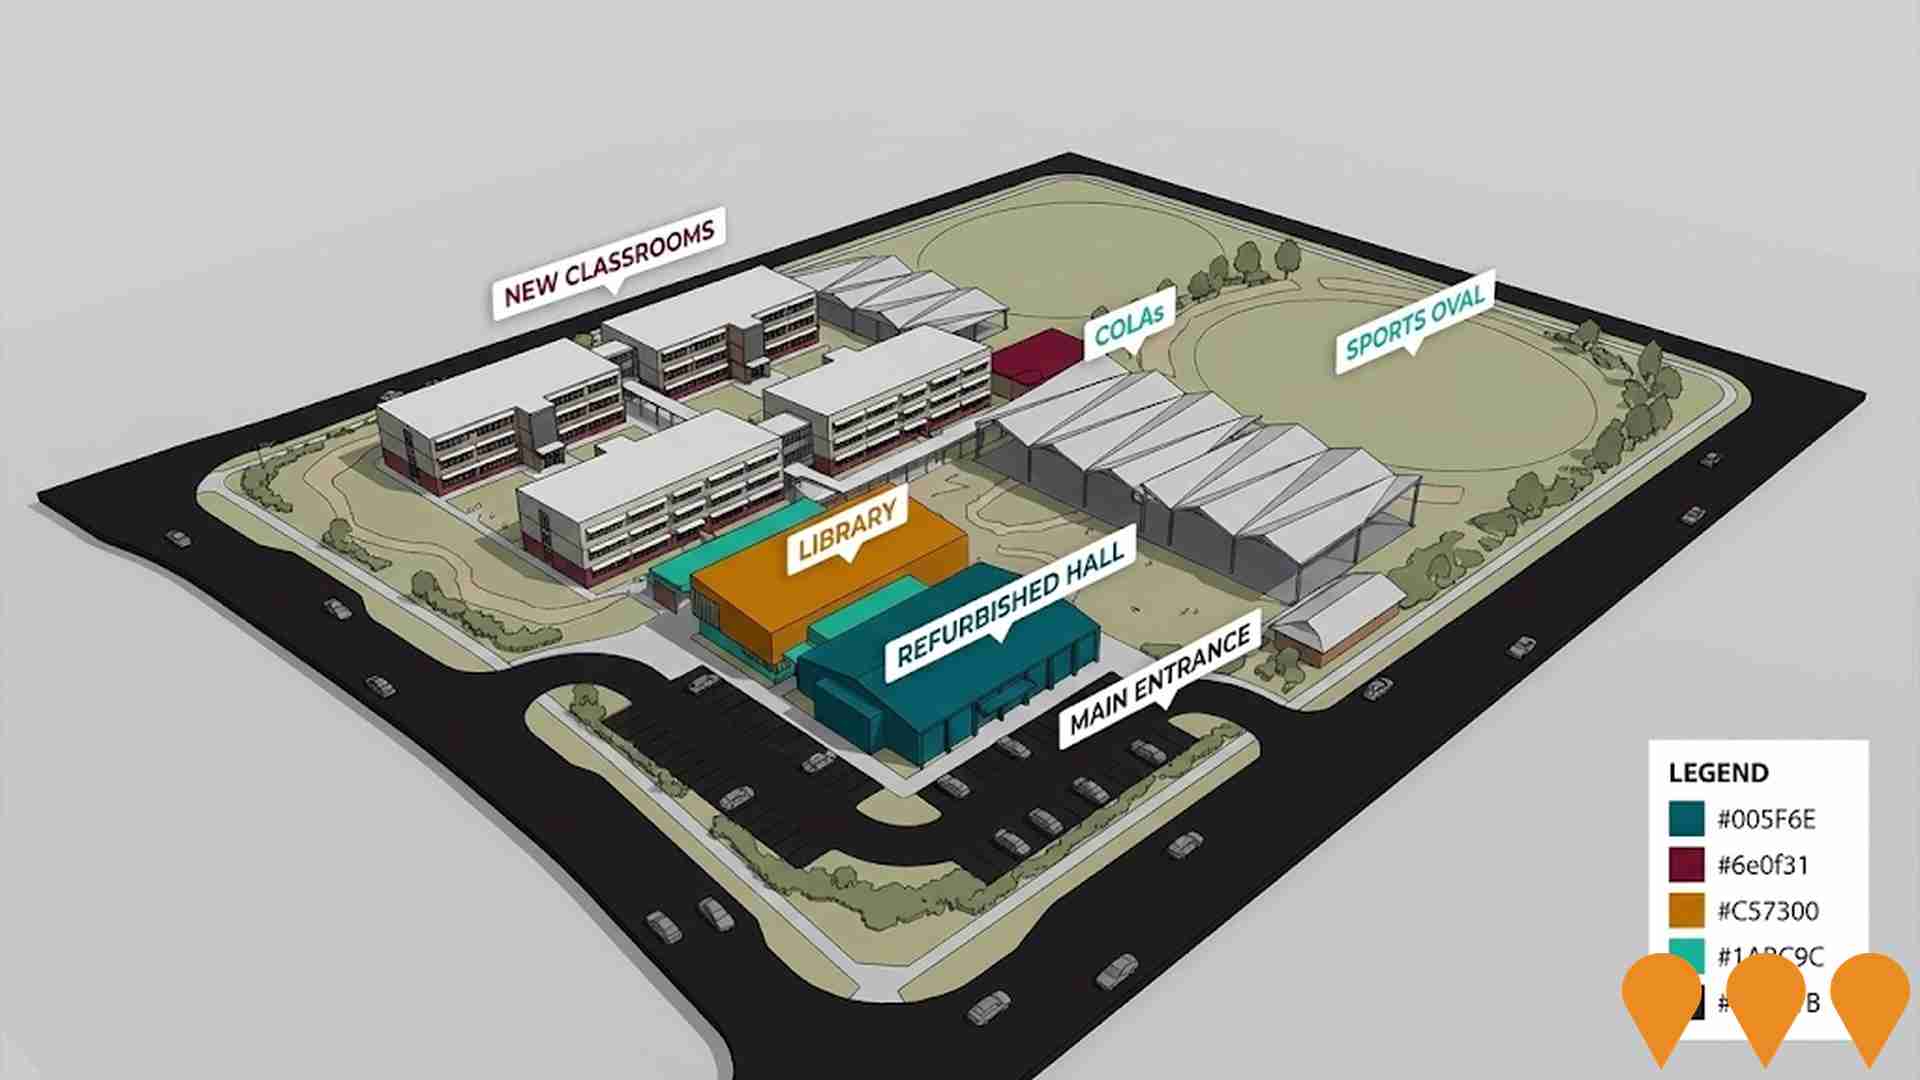
Bonnyrigg High School Upgrade
Part of 1.08 billion NSW Government investment in school facilities. Bonnyrigg High School will receive significant infrastructure upgrades including new learning spaces, library, and recreational facilities.
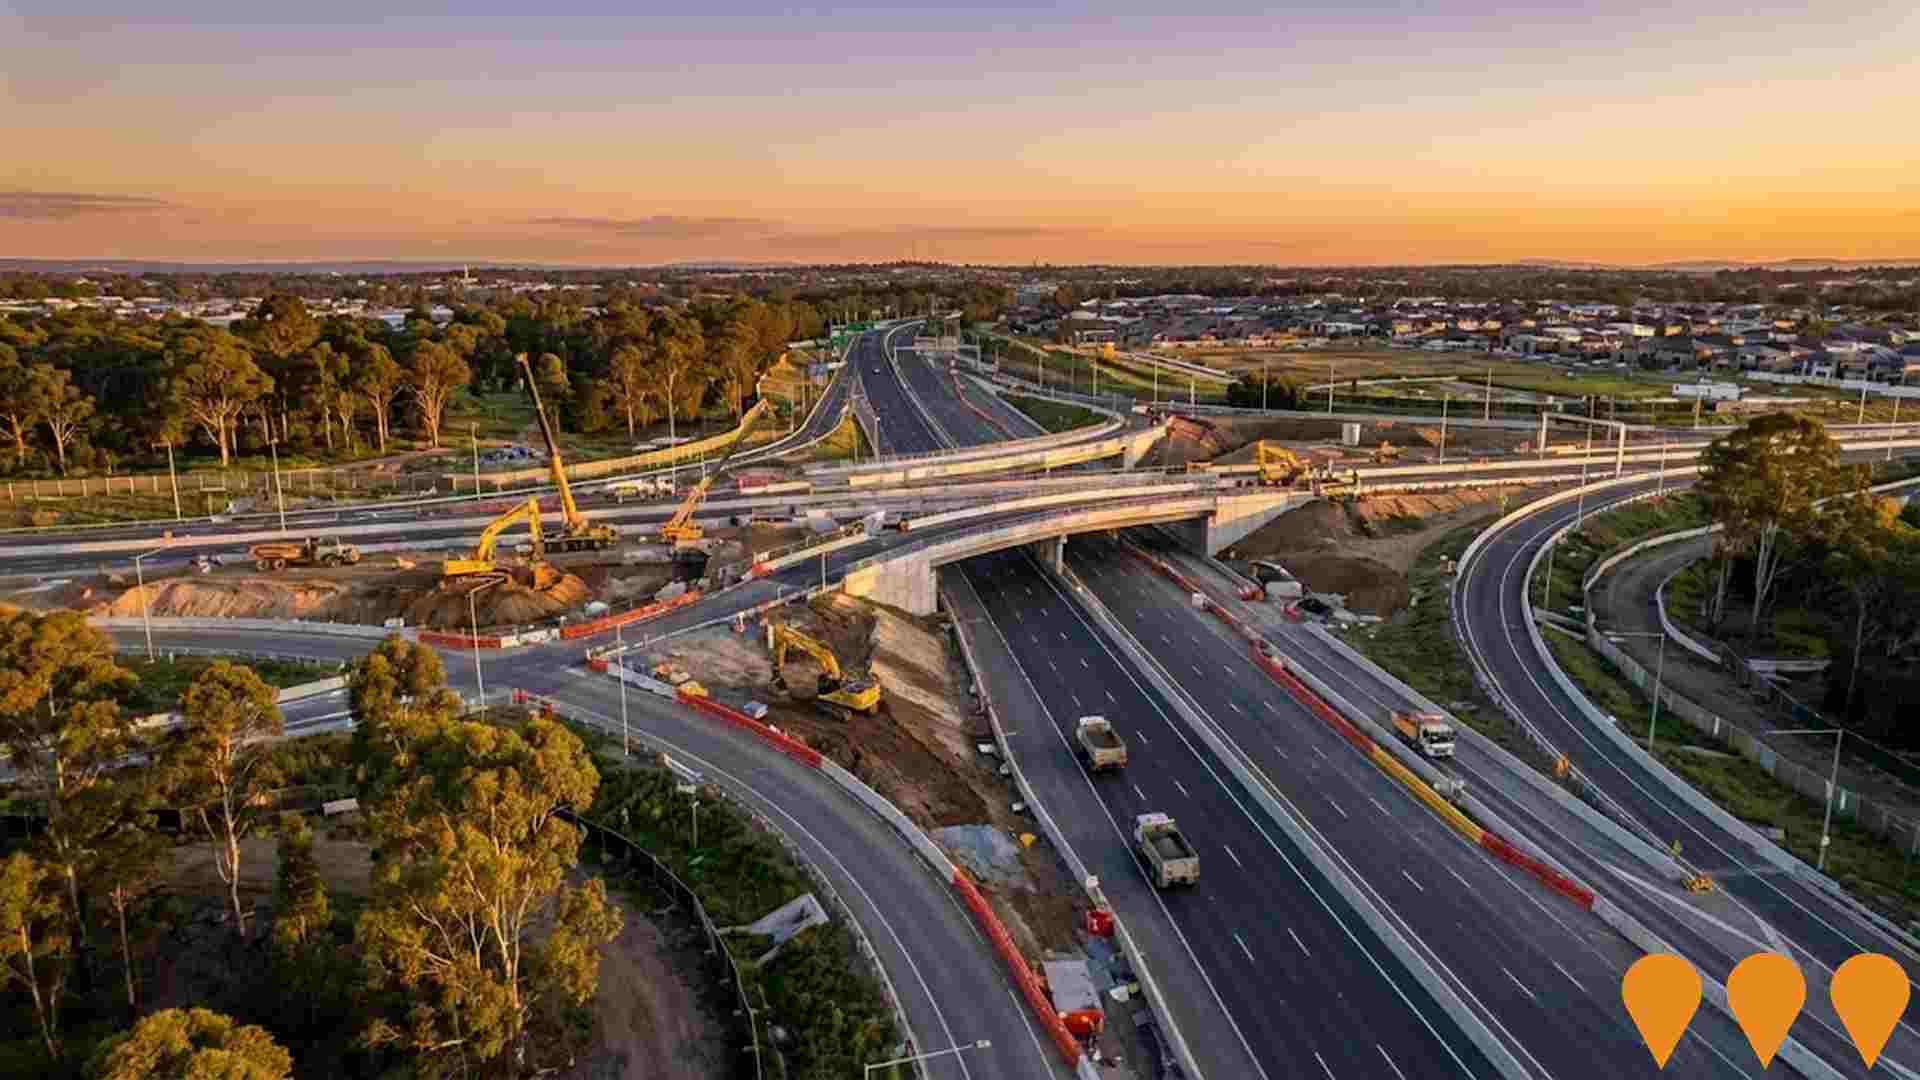
M7-M12 Integration Project
A $1.7 billion road network upgrade project in Western Sydney comprising three key elements: the M7 Motorway Widening (adding one lane in each direction within the existing median for 26 kilometres between the M5 at Prestons and Richmond Road at Glendenning), the M7-M12 Interchange (constructing a direct motorway-to-motorway connection between the M7 and the new M12 Motorway), and the Elizabeth Drive Connection (upgrading Elizabeth Drive and realigning Wallgrove and Cecil Roads to connect the M12 to the local road network). The project aims to support Western Sydney's growth, improve travel times, reduce congestion, and provide direct access to the Western Sydney International Airport. Construction commenced in August 2023 and is expected to open mid-2026.
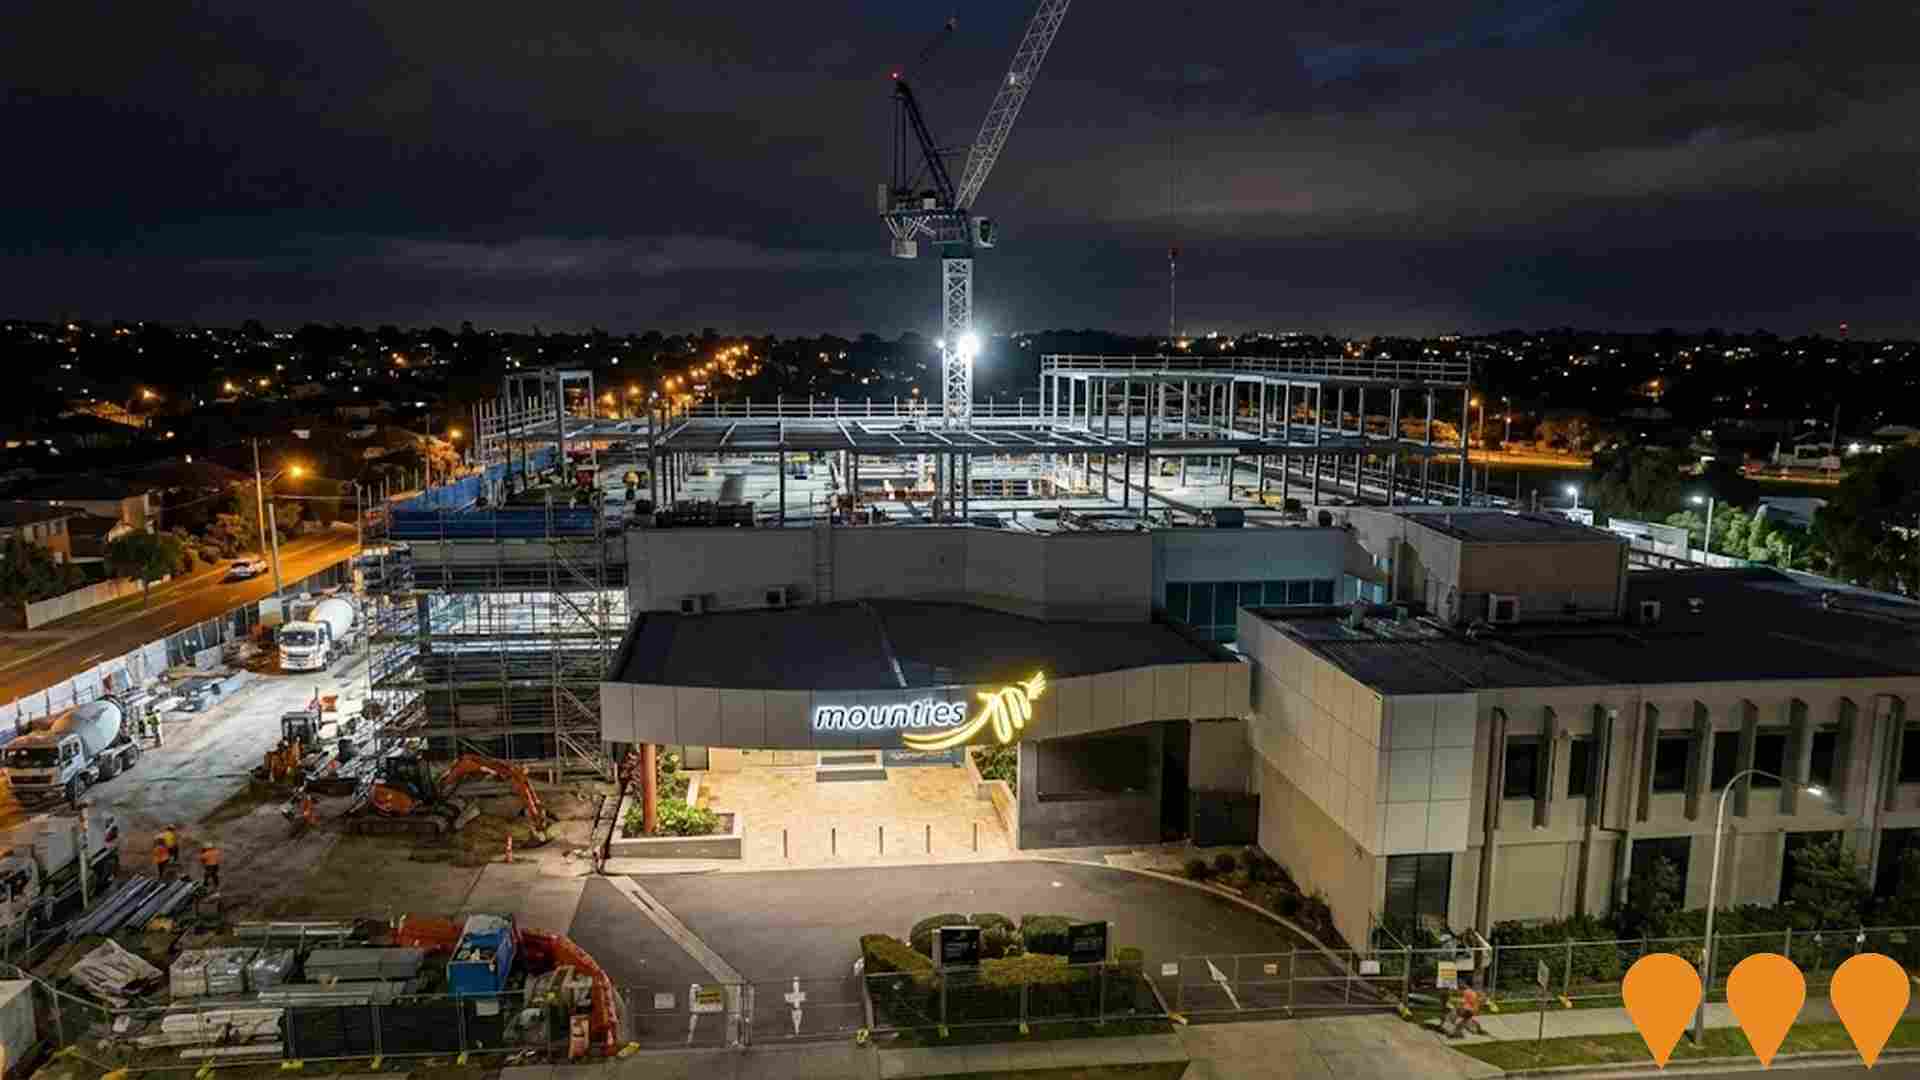
Mounties Mount Pritchard Upgrade
Staged master plan redevelopment of the Mounties club including a new four level basement car park, gaming refurbishments and extensions, new bars and dining, an auditorium and function facilities, a hotel component, and significant site infrastructure upgrades to expand capacity and improve member experience.
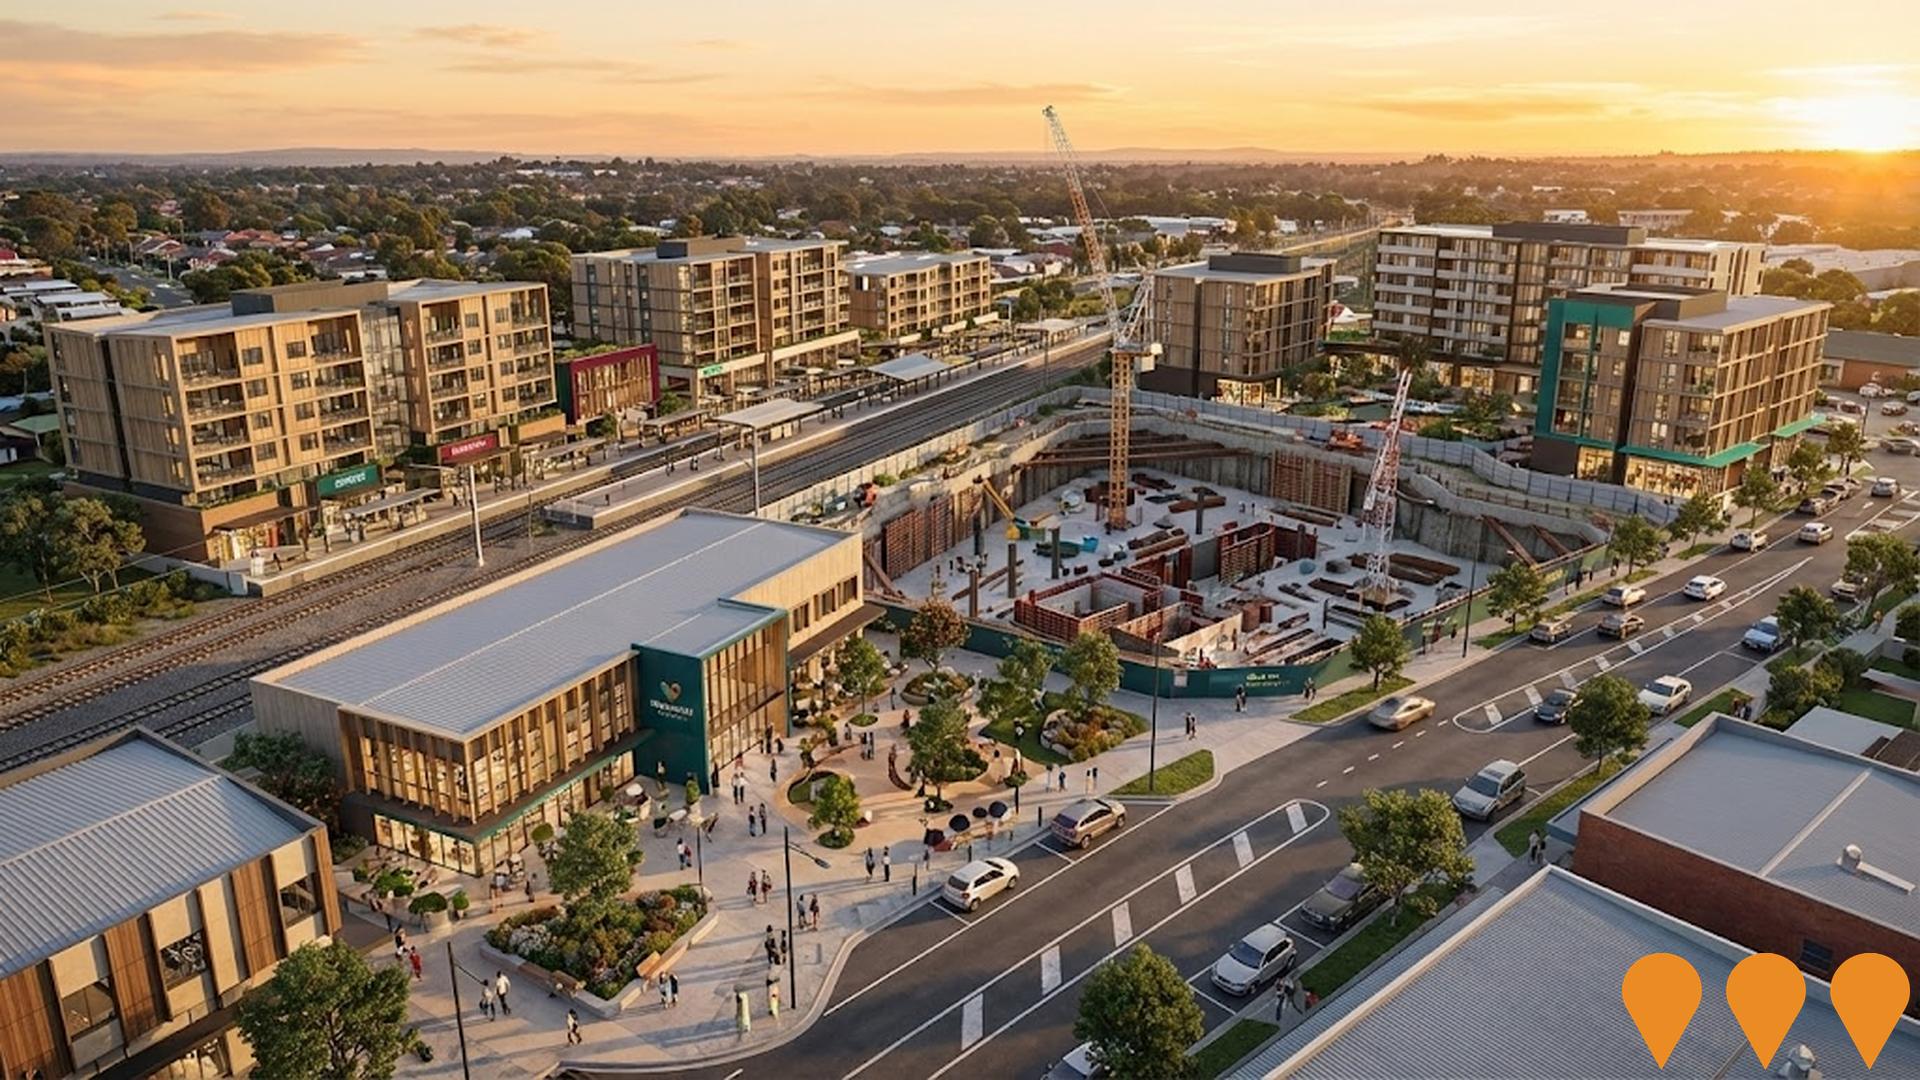
Villawood Town Centre Renewal
A comprehensive $112 million town centre renewal project aimed at revitalizing Villawood with new commercial, retail, and residential developments. The project will deliver almost 400 new homes including 55 social dwellings, a supermarket, and community spaces near the train station.
Employment
Employment performance in Bonnyrigg Heights - Bonnyrigg has been below expectations when compared to most other areas nationally
Bonnyrigg Heights, as of September 2025, has an unemployment rate of 5.3% with estimated employment growth of 5.3% over the past year. The area has a workforce participation rate of 44.5%, compared to Greater Sydney's 60.0%.
Employment is concentrated in manufacturing, retail trade, and health care & social assistance sectors. Manufacturing shows strong specialization with an employment share of 2.3 times the regional level. Conversely, professional & technical services show lower representation at 5.5% versus the regional average of 11.5%. Over a 12-month period ending in September 2025, employment increased by 5.3%, labour force grew by 4.2%, and unemployment rate fell by 1.0 percentage points.
In contrast, Greater Sydney experienced employment growth of 2.1% and labour force growth of 2.4%. State-level data to 25-Nov-25 shows NSW employment contracted by 0.03%, with the state unemployment rate at 3.9%. National employment forecasts from May-25 project a 6.6% increase over five years and 13.7% over ten years, but local growth patterns may differ based on industry-specific projections applied to Bonnyrigg Heights' employment mix.
Frequently Asked Questions - Employment
Income
Income levels sit below national averages according to AreaSearch assessment
AreaSearch's aggregation of the latest postcode level ATO data released for financial year 2022 shows Bonnyrigg Heights - Bonnyrigg SA2 had a median income among taxpayers of $46,093. The average income stood at $54,376, which is lower than national averages and compares to levels of $56,994 in Greater Sydney. Based on Wage Price Index growth of 12.61% since financial year 2022, current estimates would be approximately $51,905 (median) and $61,233 (average) as of September 2025. Census 2021 income data shows individual incomes lag at the 4th percentile ($513 weekly), while household income performs better at the 39th percentile. The earnings profile indicates that 31.3% of locals (5,469 people) fall within the $1,500 - 2,999 income category, similar to the surrounding region where 30.9% occupy this bracket. Housing affordability pressures are severe, with only 81.4% of income remaining, ranking at the 37th percentile.
Frequently Asked Questions - Income
Housing
Bonnyrigg Heights - Bonnyrigg is characterized by a predominantly suburban housing profile, with ownership patterns similar to the broader region
Bonnyrigg Heights - Bonnyrigg, as per the latest Census, had 82.8% houses and 17.2% other dwellings, compared to Sydney metro's 73.3% houses and 26.7% other dwellings. Home ownership in Bonnyrigg Heights - Bonnyrigg was 32.2%, with mortgaged dwellings at 33.1% and rented ones at 34.8%. The median monthly mortgage repayment was $2,000, aligning with Sydney metro's average, while the median weekly rent was $400, matching Sydney metro's figure. Nationally, Bonnyrigg Heights - Bonnyrigg's mortgage repayments were higher at $2,000 compared to Australia's average of $1,863, and rents exceeded the national figure of $375 by $25.
Frequently Asked Questions - Housing
Household Composition
Bonnyrigg Heights - Bonnyrigg features high concentrations of family households, with a higher-than-average median household size
Family households account for 85.7% of all households, including 44.6% couples with children, 17.7% couples without children, and 21.6% single parent families. Non-family households constitute the remaining 14.3%, with lone person households at 13.3% and group households making up 1.1%. The median household size is 3.3 people, larger than the Greater Sydney average of 3.2.
Frequently Asked Questions - Households
Local Schools & Education
Educational outcomes in Bonnyrigg Heights - Bonnyrigg fall within the lower quartile nationally, indicating opportunities for improvement in qualification attainment
The area's university qualification rate is 16.9%, significantly lower than Greater Sydney's average of 38.0%. Bachelor degrees are the most prevalent at 13.9%, followed by postgraduate qualifications (2.3%) and graduate diplomas (0.7%). Vocational credentials are common, with 25.9% of residents aged 15+ holding them, including advanced diplomas (9.7%) and certificates (16.2%). Educational participation is high, with 31.9% of residents currently enrolled in formal education.
This includes secondary education (10.2%), primary education (9.8%), and tertiary education (6.0%).
Frequently Asked Questions - Education
Schools Detail
Nearby Services & Amenities
Transport
Transport servicing is high compared to other areas nationally based on assessment of service frequency, route connectivity and accessibility
Bonnyrigg Heights - Bonnyrigg has 110 active public transport stops. All are bus stops serviced by 70 routes. These routes provide a total of 4085 weekly passenger trips.
Residents have excellent transport accessibility, with an average distance of 135 meters to the nearest stop. There are approximately 583 daily trips across all routes, equating to about 37 weekly trips per individual stop.
Frequently Asked Questions - Transport
Transport Stops Detail
Health
Bonnyrigg Heights - Bonnyrigg's residents are extremely healthy with both young and old age cohorts seeing low prevalence of common health conditions
Analysis of health metrics shows strong performance throughout Bonnyrigg Heights - Bonnyrigg. Both young and old age cohorts have low prevalence of common health conditions.
The rate of private health cover is very low at approximately 47% of the total population, which is around 8,247 people. This is lower than the national average of 55.3%. The most common medical conditions in the area are diabetes and arthritis, impacting 6.6% and 6.0% of residents respectively. A total of 75.6% of residents declared themselves completely clear of medical ailments, which is comparable to the 75.6% figure across Greater Sydney. The area has 17.6% of residents aged 65 and over, equating to approximately 3,066 people. This percentage is lower than the 19.0% recorded in Greater Sydney. Health outcomes among seniors are above average, broadly aligning with the general population's health profile.
Frequently Asked Questions - Health
Cultural Diversity
Bonnyrigg Heights - Bonnyrigg is among the most culturally diverse areas in the country based on AreaSearch assessment of a range of language and cultural background related metrics
Bonnyrigg Heights, located in Australia, is one of the most culturally diverse areas with 55.9% of its population born overseas and 73.8% speaking a language other than English at home. Christianity is the predominant religion in Bonnyrigg Heights as of 2016, comprising 49.1% of the population, while Buddhism is notably higher than the Greater Sydney average at 26.9%. In terms of ancestry, the top three groups are Other (31.1%), Vietnamese (20.2%), and Chinese (12.0%).
There are also significant differences in the representation of Serbian (4.0% vs regional 1.8%), Spanish (0.9% vs 1.0%), and Samoan (1.2% vs 1.0%) ethnic groups compared to the Greater Sydney average.
Frequently Asked Questions - Diversity
Age
Bonnyrigg Heights - Bonnyrigg's population is slightly younger than the national pattern
The median age in Bonnyrigg Heights - Bonnyrigg is 38 years, close to Greater Sydney's average of 37 and equivalent to Australia's median of 38. Compared to Greater Sydney, Bonnyrigg Heights - Bonnyrigg has a higher percentage of 15-24 year-olds (15.8%) but fewer 35-44 year-olds (11.6%). Between the 2016 and 2021 censuses, the 75 to 84 age group grew from 3.7% to 5.4%, while the 15 to 24 cohort increased from 14.6% to 15.8%. Conversely, the 45 to 54 cohort declined from 12.8% to 11.5%. By 2041, Bonnyrigg Heights - Bonnyrigg's age composition is expected to shift notably. The 75 to 84 group is projected to grow by 114%, adding 1,068 people and reaching 2,005 from 936. Those aged 65 and above are expected to comprise 59% of the population growth. Meanwhile, the 35 to 44 age group shows modest growth of 1%, with an increase of only 17 residents.
