Chart Color Schemes
This analysis uses ABS Statistical Areas Level 2 (SA2) boundaries, which can materially differ from Suburbs and Localities (SAL) even when sharing similar names.
SA2 boundaries are defined by the Australian Bureau of Statistics and are designed to represent communities for statistical reporting (e.g., census and ERP).
Suburbs and Localities (SAL) represent commonly-used suburb/locality names (postal-style areas) and may use different geographic boundaries. For comprehensive analysis, consider reviewing both boundary types if available.
est. as @ -- *
ABS ERP | -- people | --
2021 Census | -- people
Sales Activity
Curious about local property values? Filter the chart to assess the volume and appreciation (including resales) trends and regional comparisons, or scroll to the map below view this information at an individual property level.
Find a Recent Sale
Sales Detail
Population
Green Valley is positioned among the lower quartile of areas assessed nationally for population growth based on AreaSearch's assessment of recent, and medium term trends
Green Valley's population, as of November 2025, is approximately 12,817, indicating a decrease of 102 people since the 2021 Census. The 2021 Census reported a population of 12,919. This change is inferred from ABS's estimated resident population of 12,800 in June 2024 and an additional 16 validated new addresses since the Census date. This results in a population density ratio of 3,992 persons per square kilometer, placing Green Valley in the top 10% of national locations assessed by AreaSearch. Overseas migration contributed approximately 62.0% of overall population gains during recent periods.
AreaSearch uses ABS/Geoscience Australia projections for each SA2 area, released in 2024 with a base year of 2022. For areas not covered, NSW State Government's SA2 level projections released in 2022 with a base year of 2021 are used. Growth rates by age group from these aggregations are applied to all areas for years 2032 to 2041. By 2041, the area's population is expected to decline by 171 persons according to this methodology. However, specific age cohorts like the 75 to 84 age group are projected to increase by 661 people during this period.
Frequently Asked Questions - Population
Development
The level of residential development activity in Green Valley is very low in comparison to the average area assessed nationally by AreaSearch
Green Valley has averaged approximately 20 new dwelling approvals annually over the past five financial years, totalling 104 homes. As of FY-26, 9 approvals have been recorded so far. The area's population decline has resulted in adequate housing supply relative to demand, creating a balanced market with good buyer choice. New dwellings are developed at an average value of $222,000, which is below regional levels, indicating more affordable housing options for buyers.
In FY-26, there have been $1.1 million in commercial approvals, reflecting the area's residential nature. Compared to Greater Sydney, Green Valley shows significantly reduced construction activity, with 92.0% fewer approvals per person. This limited new supply generally supports stronger demand and values for established homes. Nationally, this activity is also below average, suggesting possible planning constraints. Recent construction comprises 88.0% detached dwellings and 12.0% medium to high-density housing, maintaining the area's traditional suburban character focused on family homes.
With around 660 people per dwelling approval, Green Valley reflects a highly mature market. Given stable or declining population forecasts, Green Valley may experience less housing pressure in the future, creating favourable conditions for buyers.
Frequently Asked Questions - Development
Infrastructure
Green Valley has very high levels of nearby infrastructure activity, ranking in the top 10% nationally
Changes to local infrastructure significantly impact an area's performance. AreaSearch has identified five projects likely to affect the region. Notable projects are the M7-M12 Integration Project, Fifteenth Avenue Smart Transit (FAST) Corridor, Canvas at Bonnyrigg, and Bonnyrigg Estate Renewal - Humphries Precinct. The following list details those most relevant.
Professional plan users can use the search below to filter and access additional projects.
INFRASTRUCTURE SEARCH
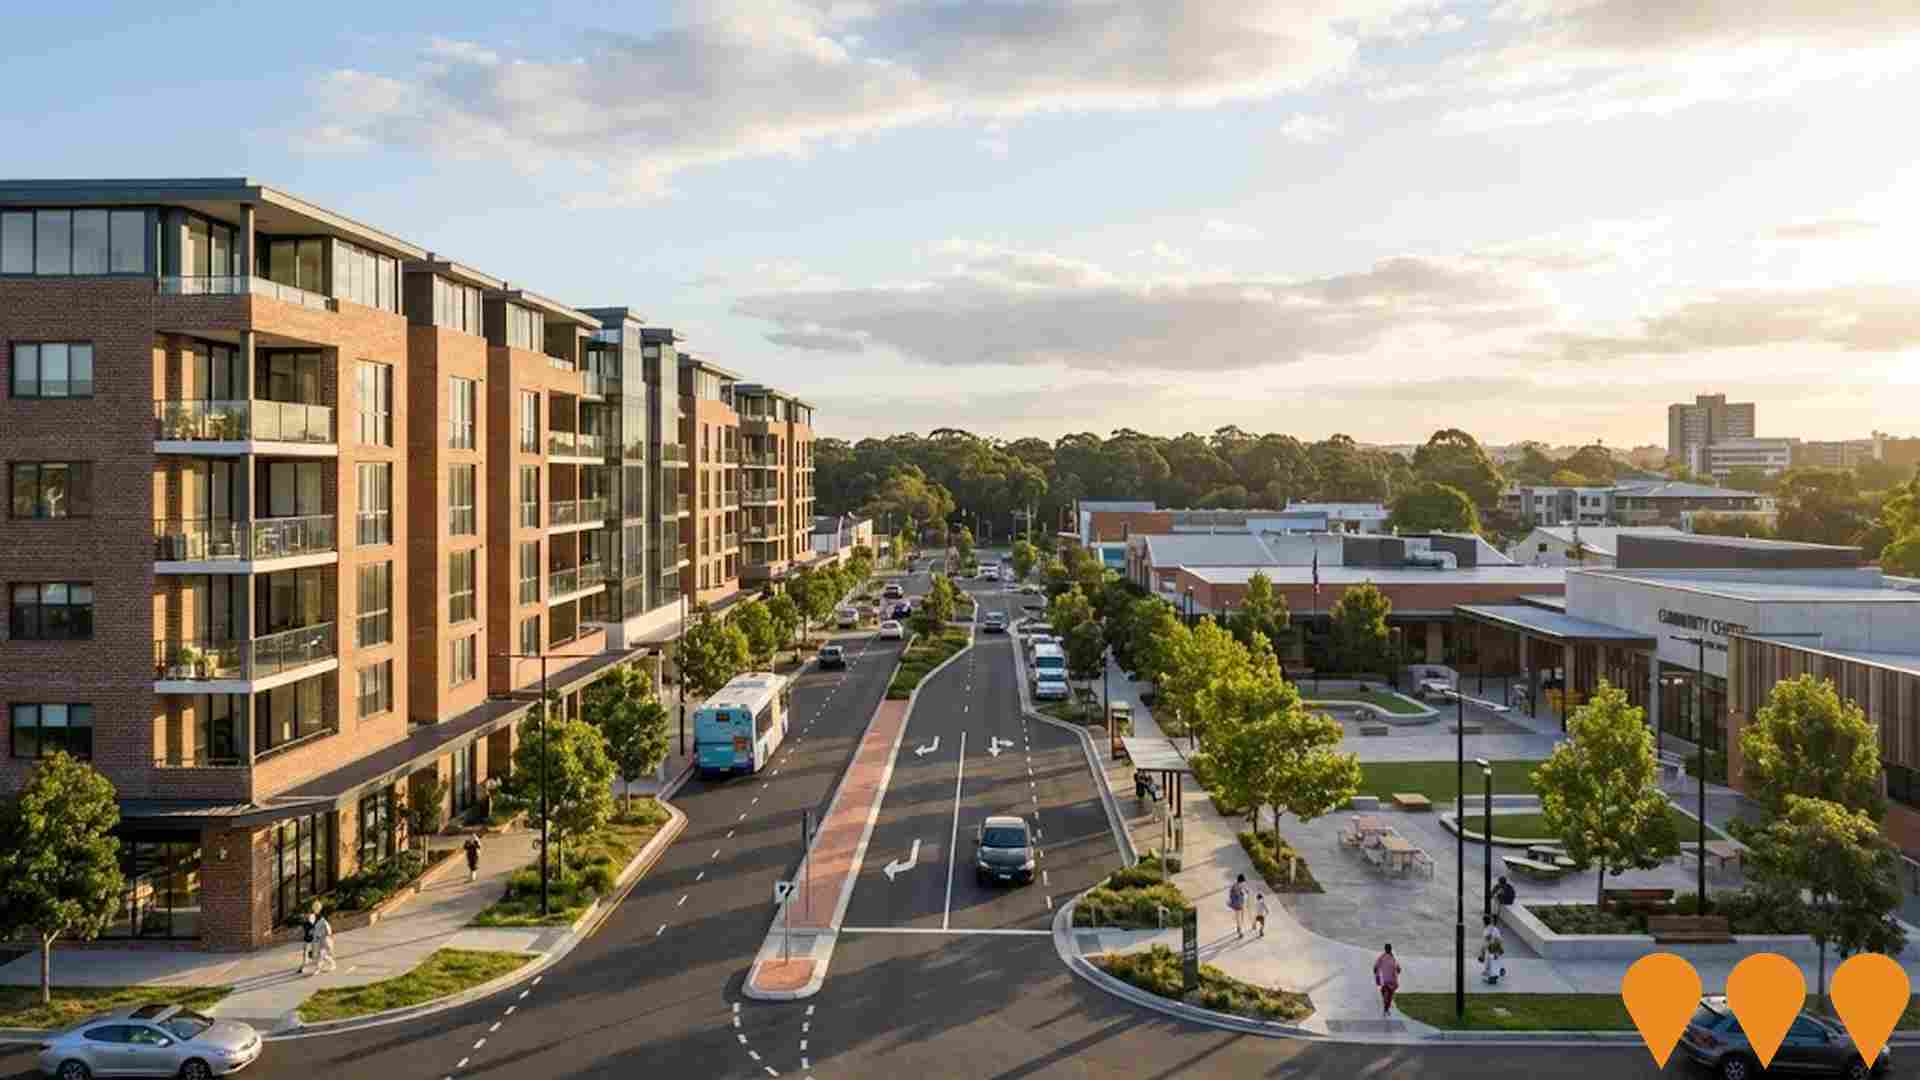
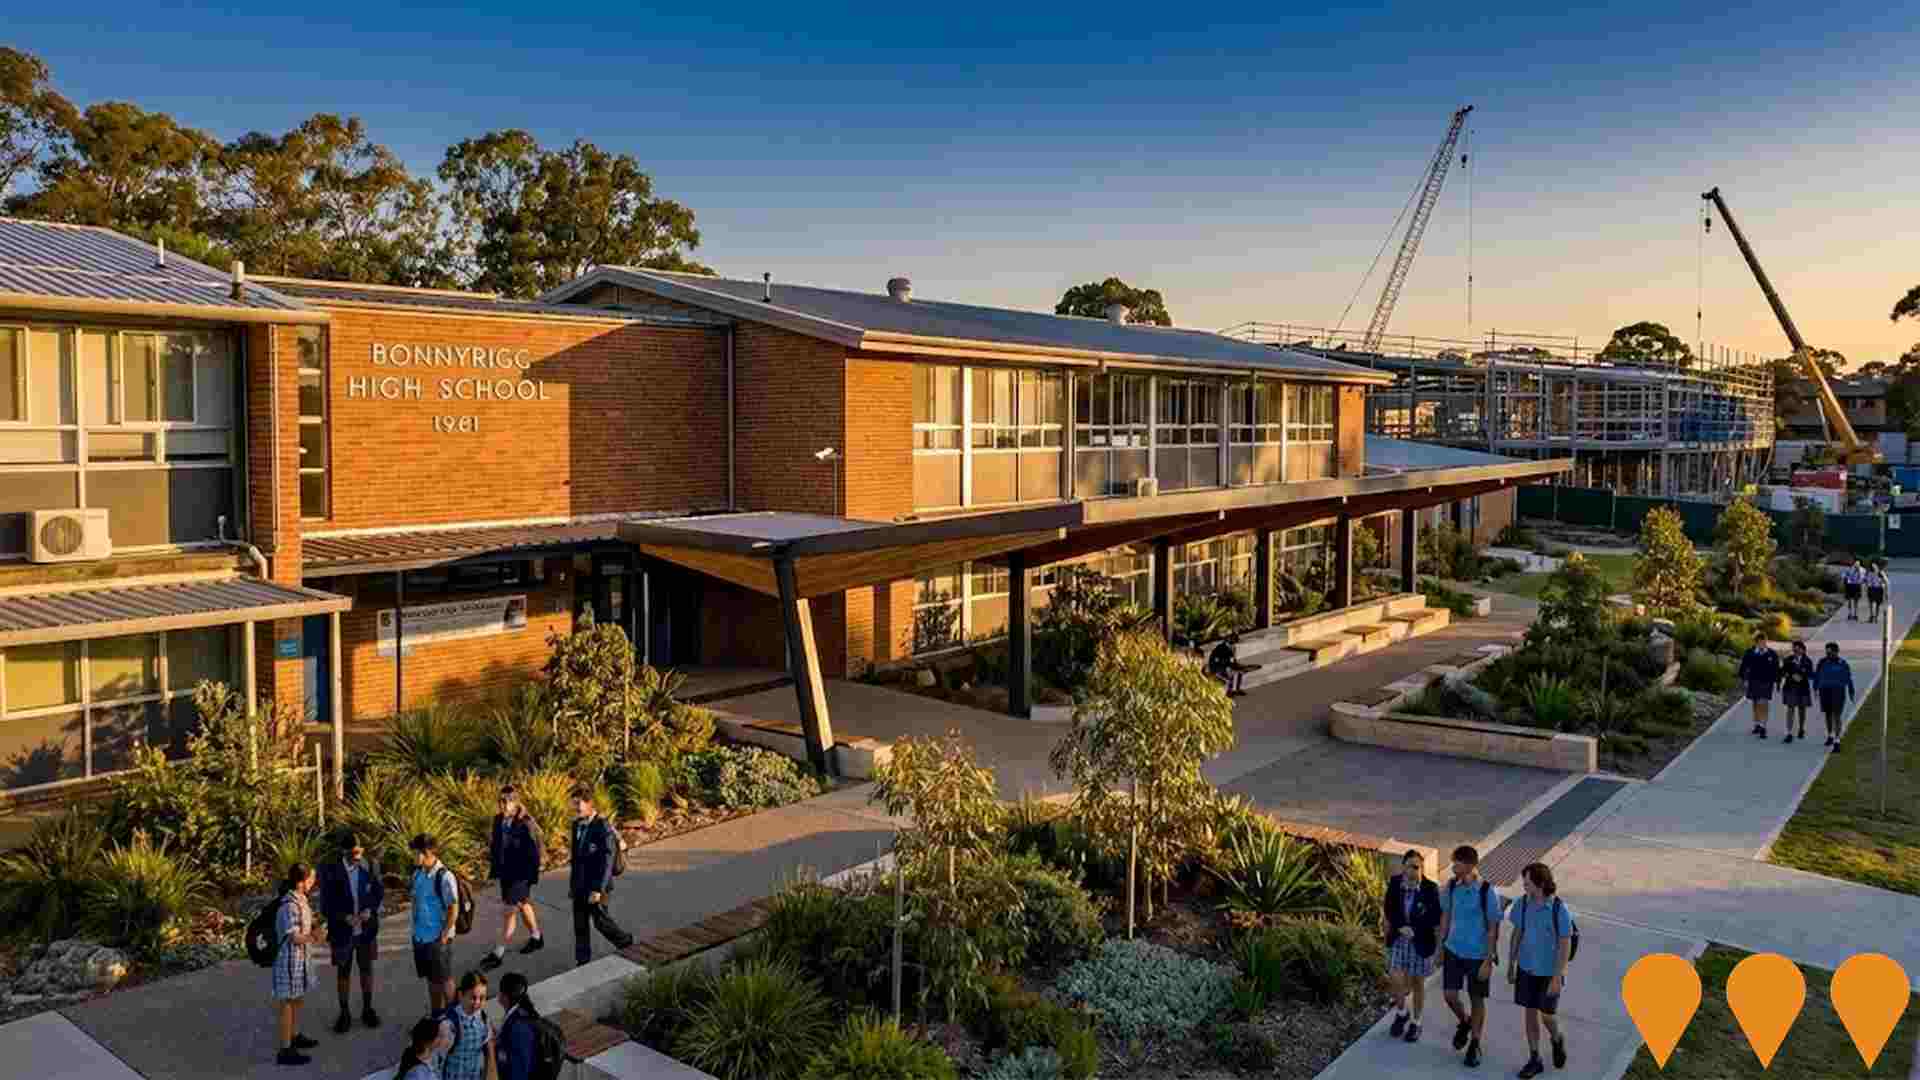
 Denotes AI-based impression for illustrative purposes only, not to be taken as definitive under any circumstances. Please follow links and conduct other investigations from the project's source for actual imagery. Developers and project owners wishing us to use original imagery please Contact Us and we will do so.
Frequently Asked Questions - Infrastructure
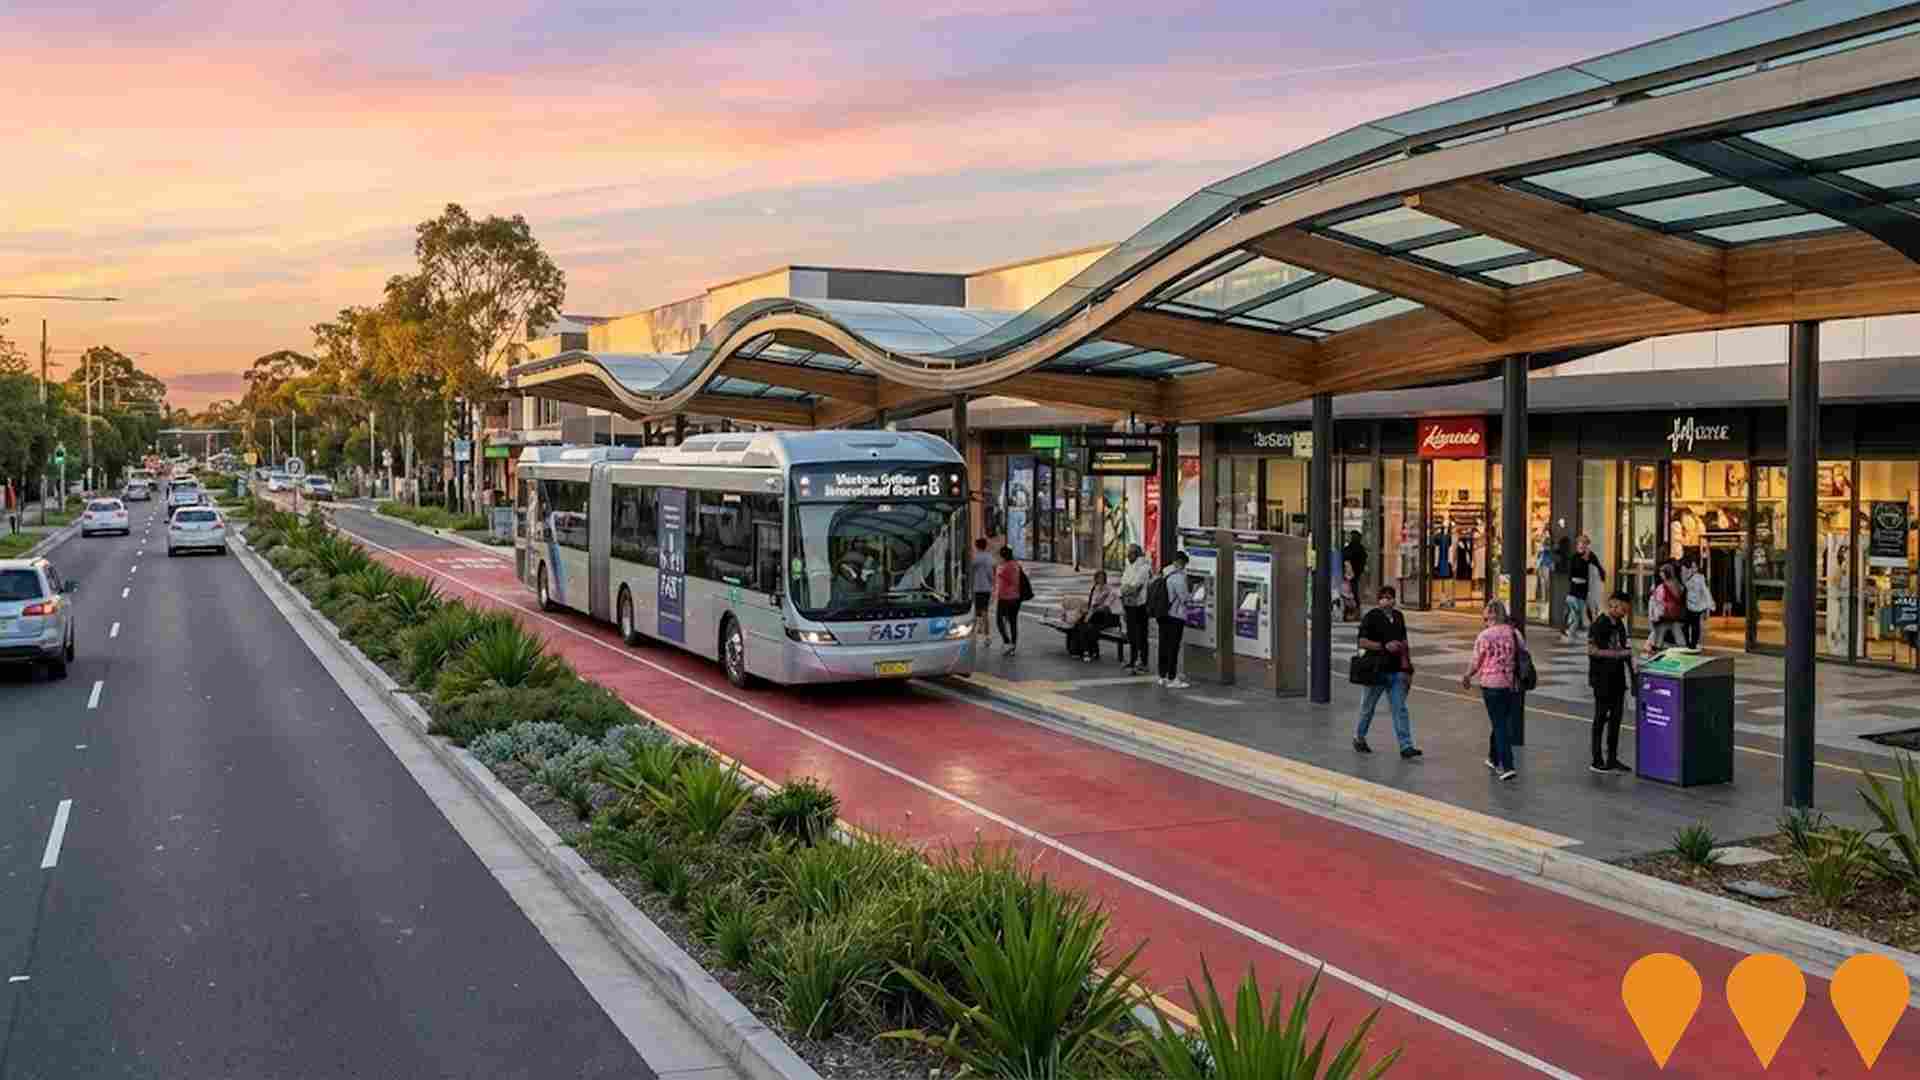
Fifteenth Avenue Smart Transit (FAST) Corridor
A $1 billion upgrade of the 8.1km corridor (5.9km Fifteenth Avenue, 2.2km Hoxton Park Road) connecting Liverpool CBD to Western Sydney International Airport and the new Bradfield city centre via priority growth areas. The project is a vital east-west public transport corridor that will initially involve widening a priority section of Fifteenth Avenue from two lanes to four lanes, with land protection for future bus lanes. It is jointly funded by the Australian and NSW governments. The project is designed to enhance productivity, unlock housing, and improve access to the airport and jobs for Sydney's growing west. The total $1 billion commitment was announced in January 2025, with construction expected to begin in 2027. Concept design work for the priority section is currently underway.
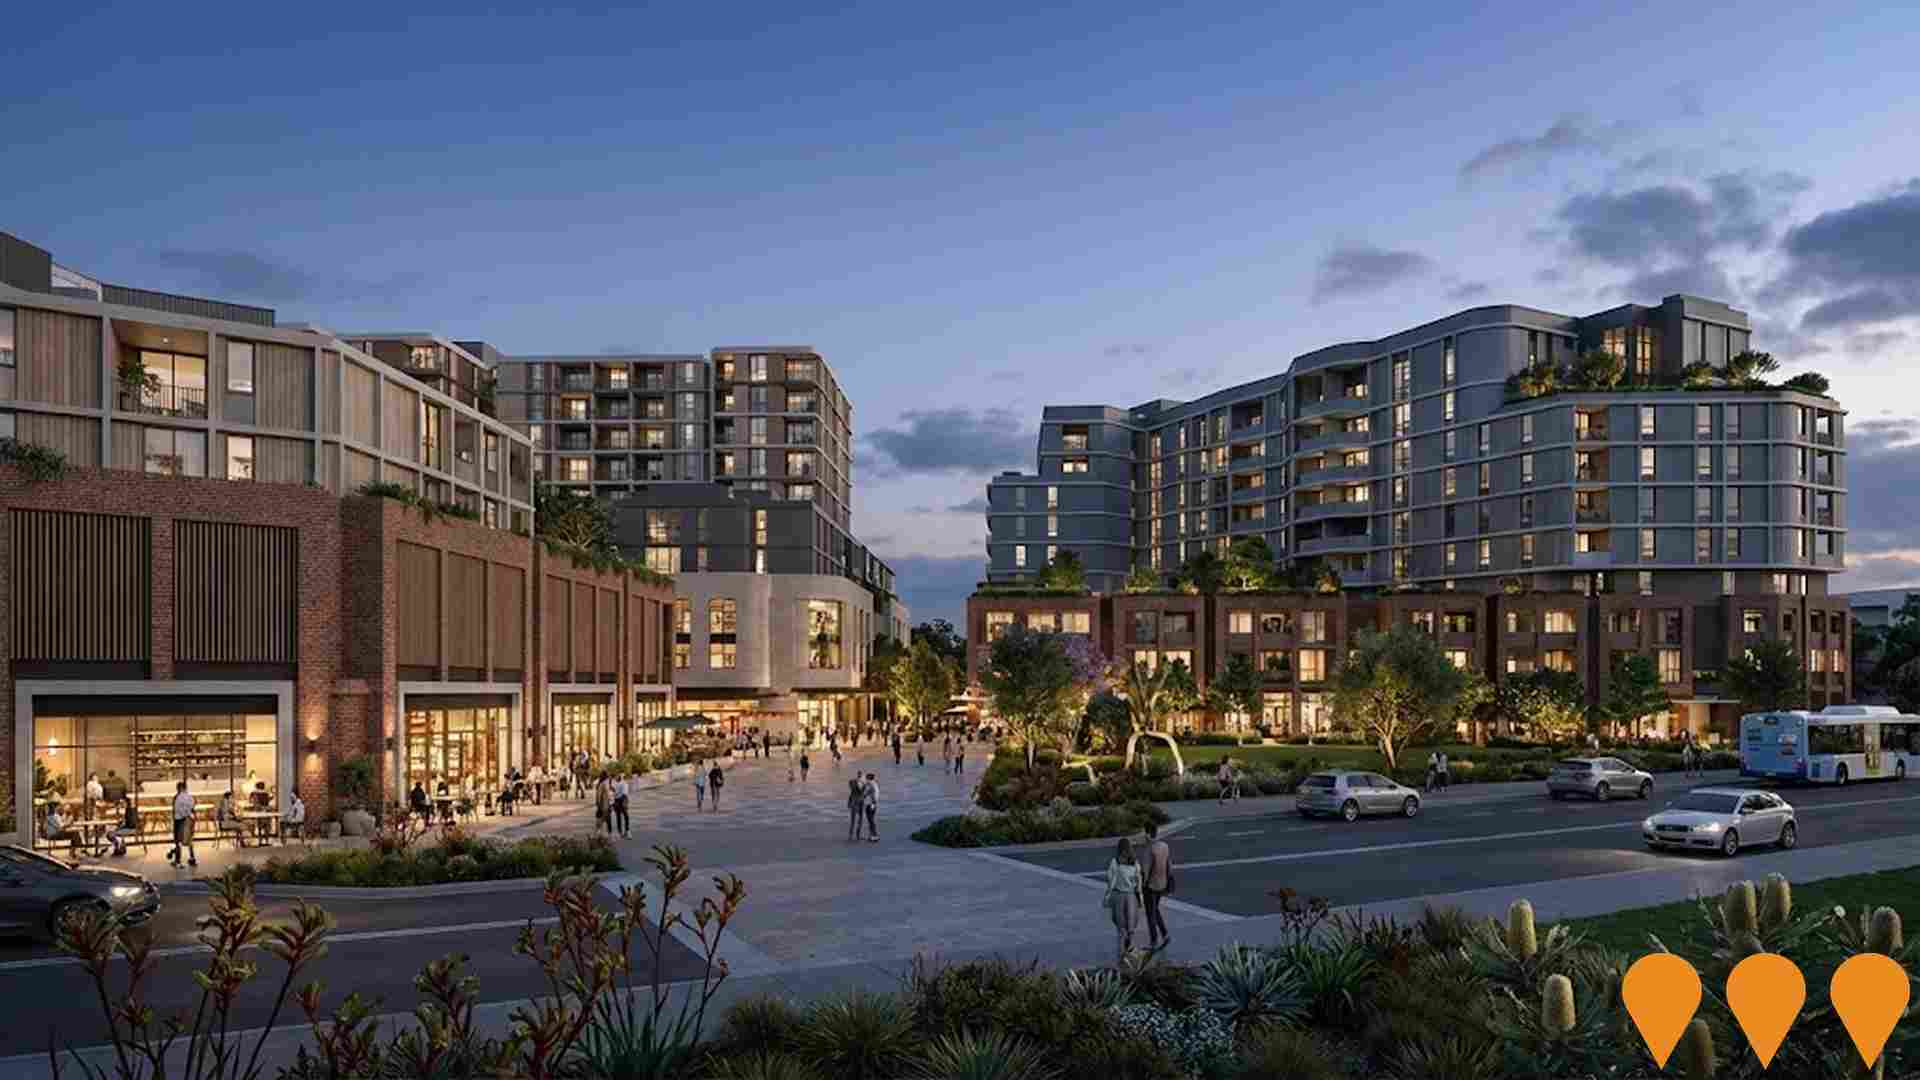
Bonnyrigg Estate Renewal - Humphries Precinct
$400 million urban renewal project transforming former Bonnyrigg public housing estate into mixed-income community. Stage 3 (Humphries Precinct) includes 340 new homes with a mix of social, affordable, and private housing, plus a community centre, park upgrades, and retail spaces. Part of NSW Government's Communities Plus program.
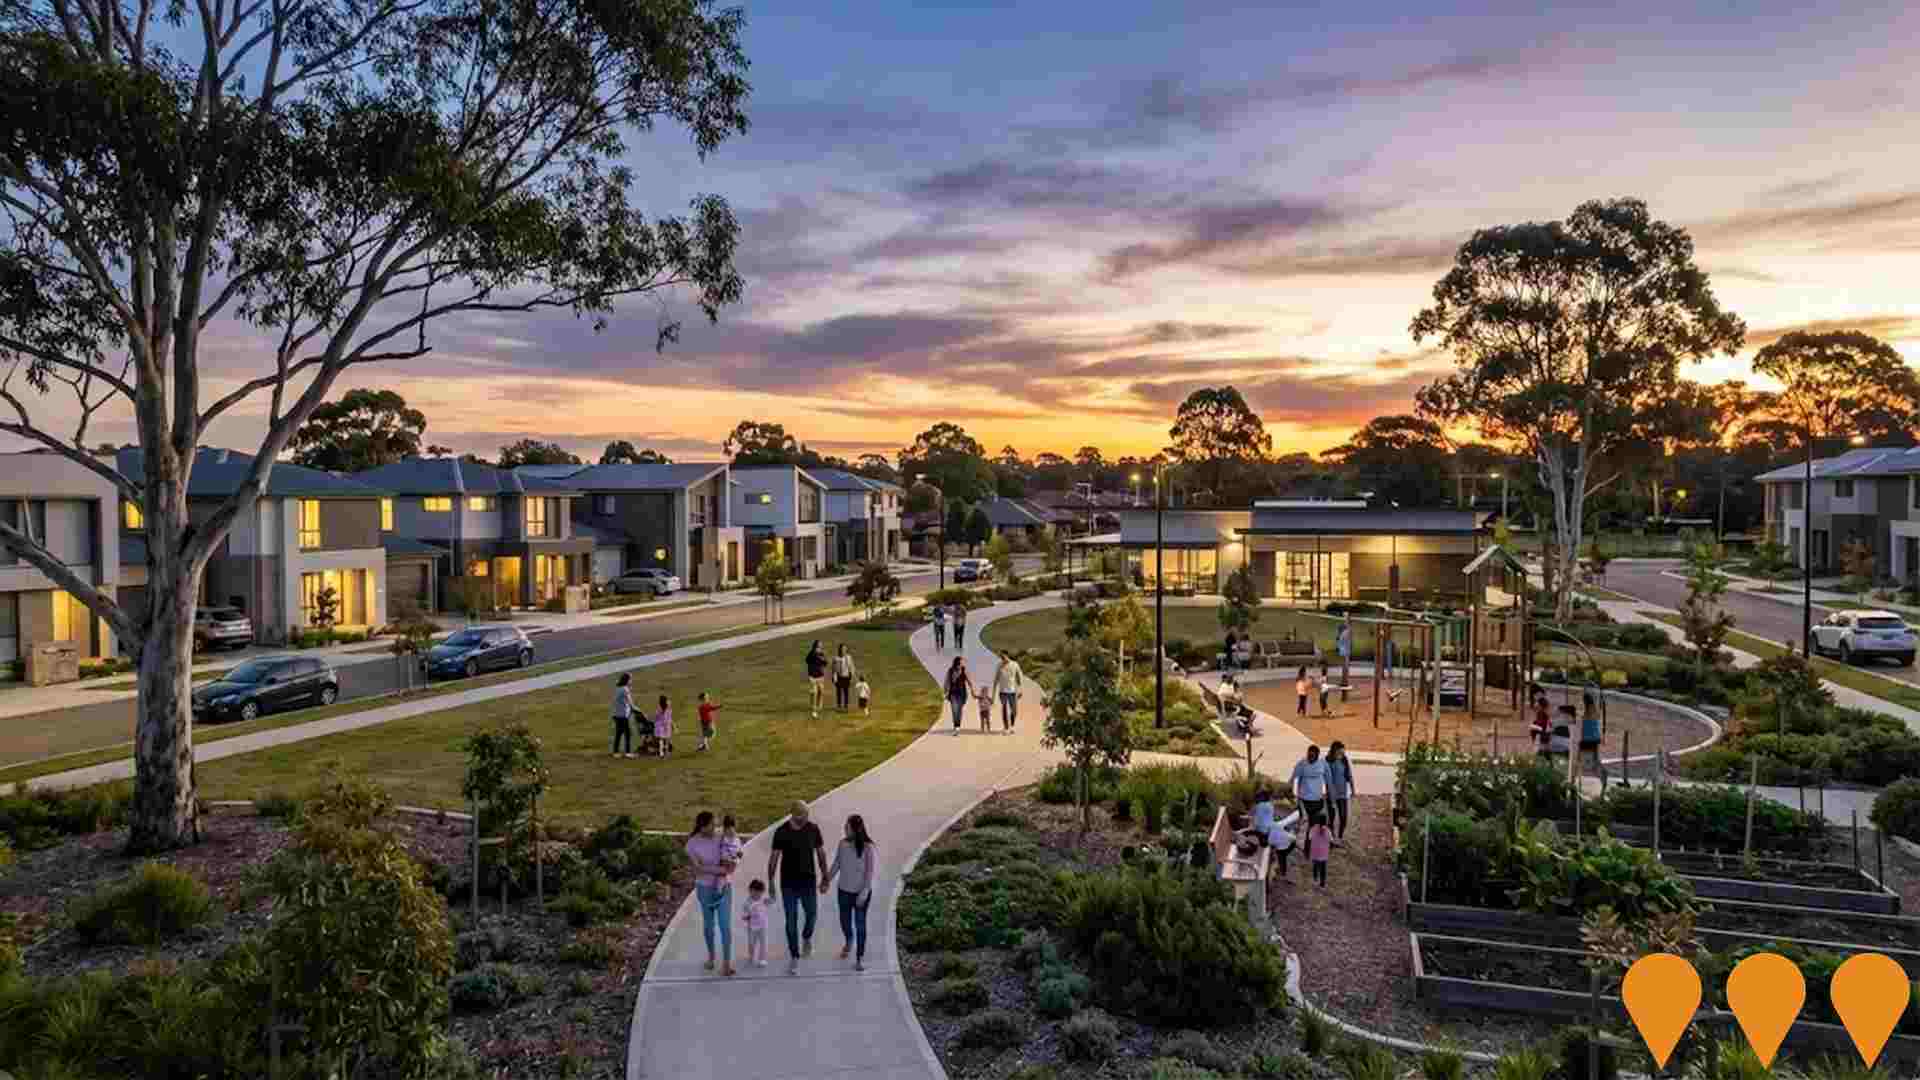
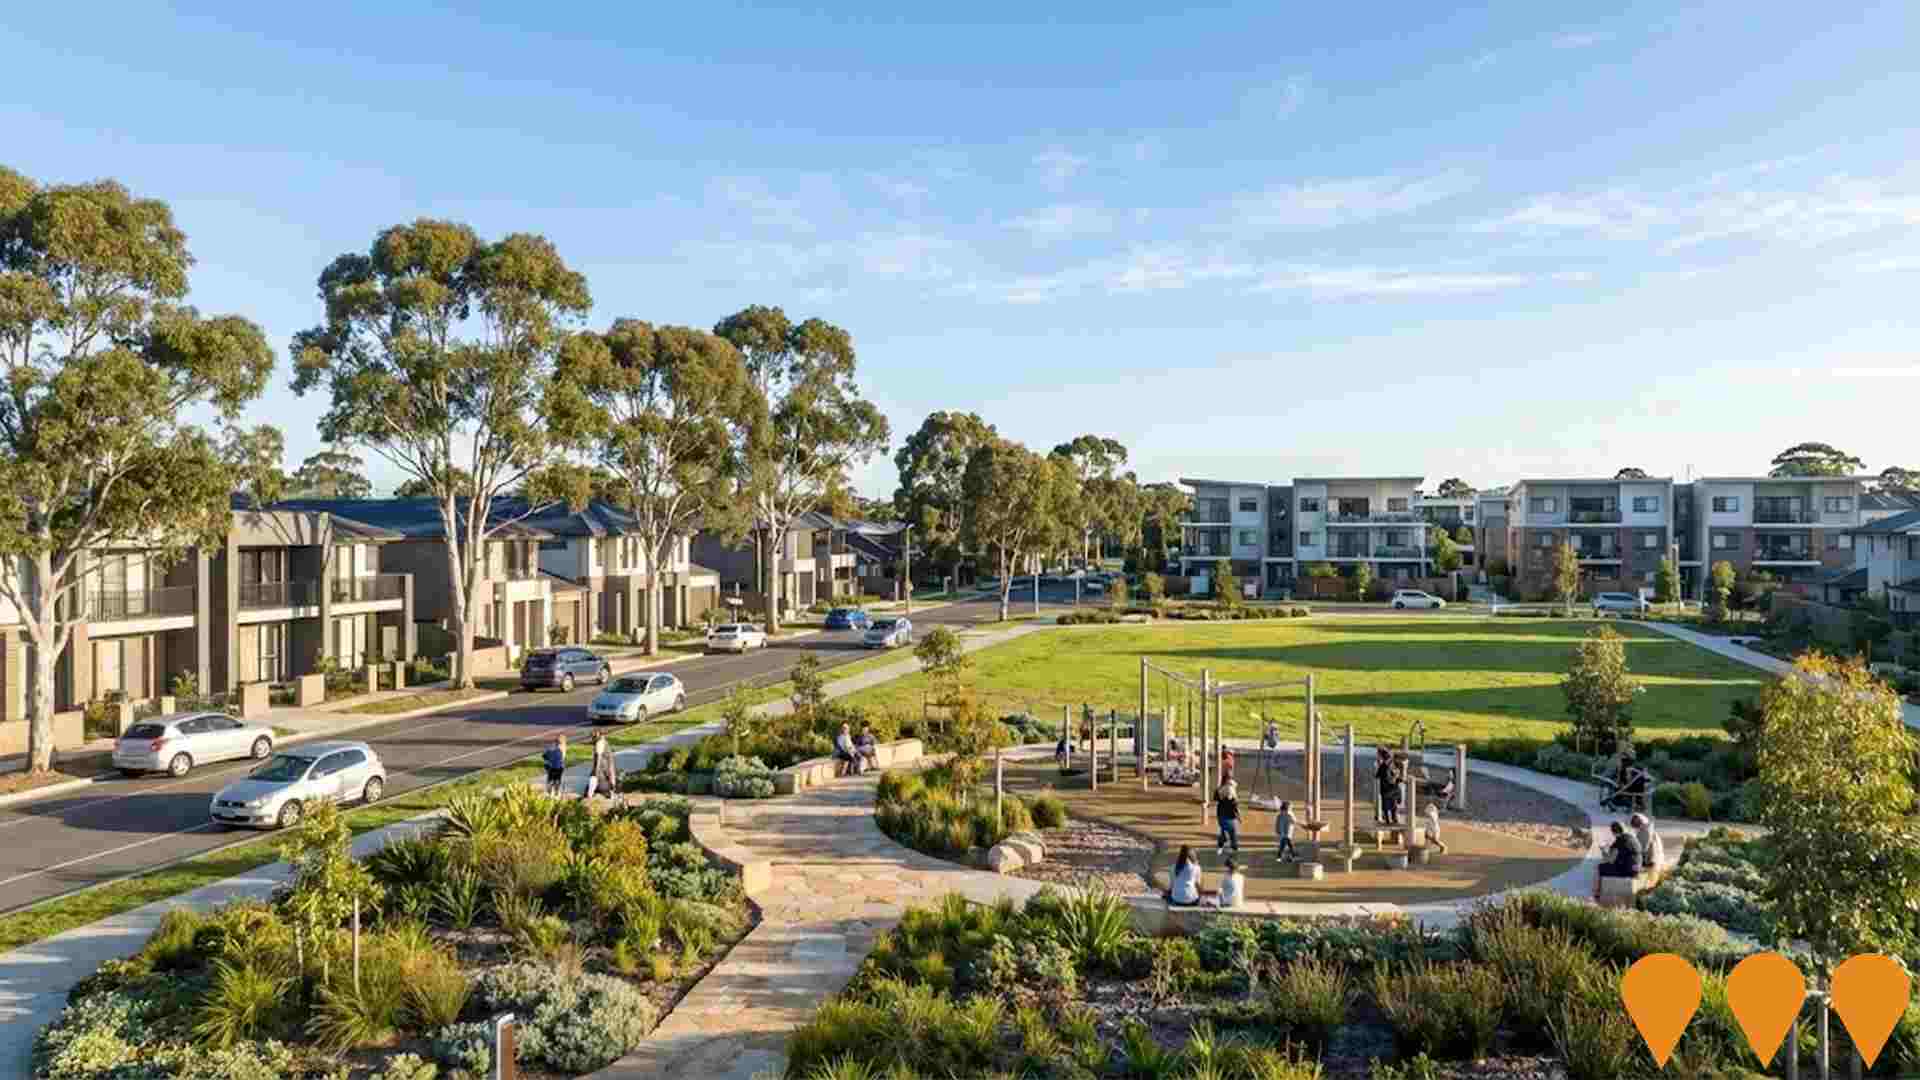
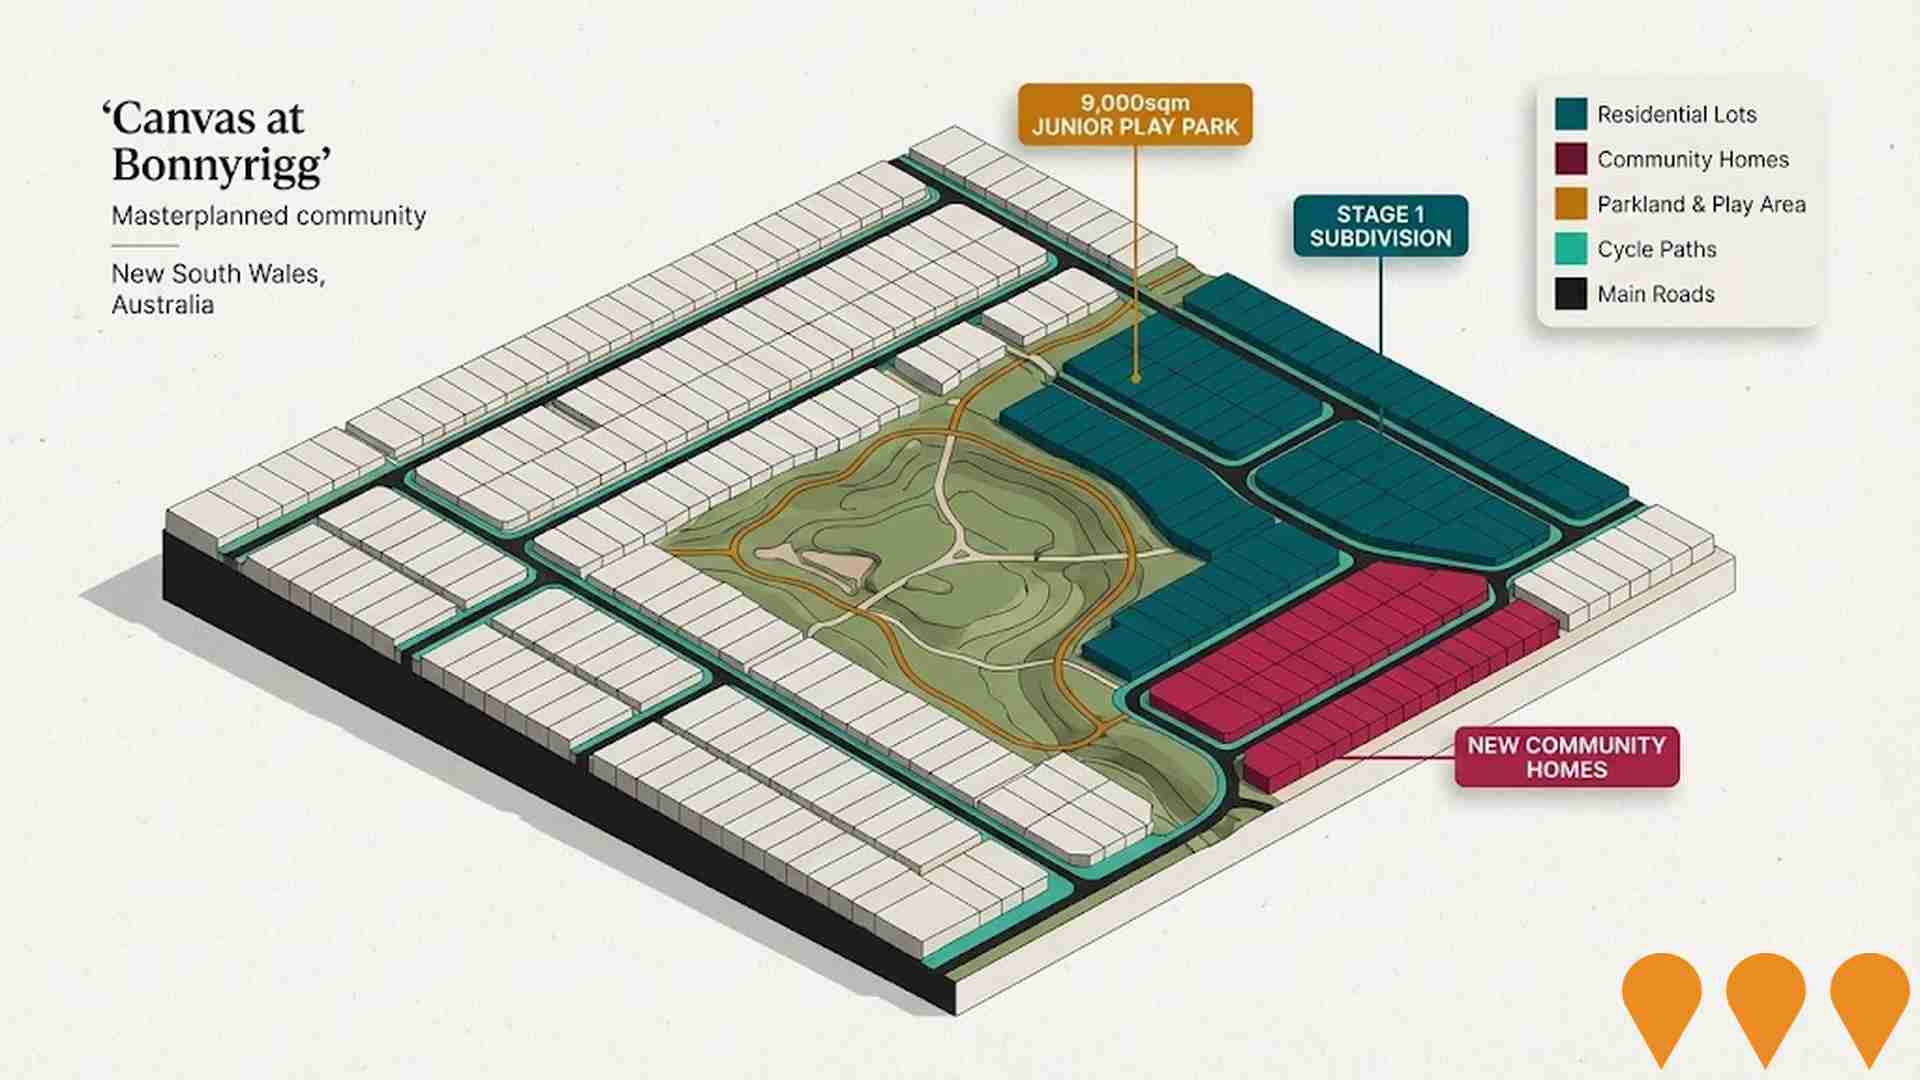
Canvas at Bonnyrigg
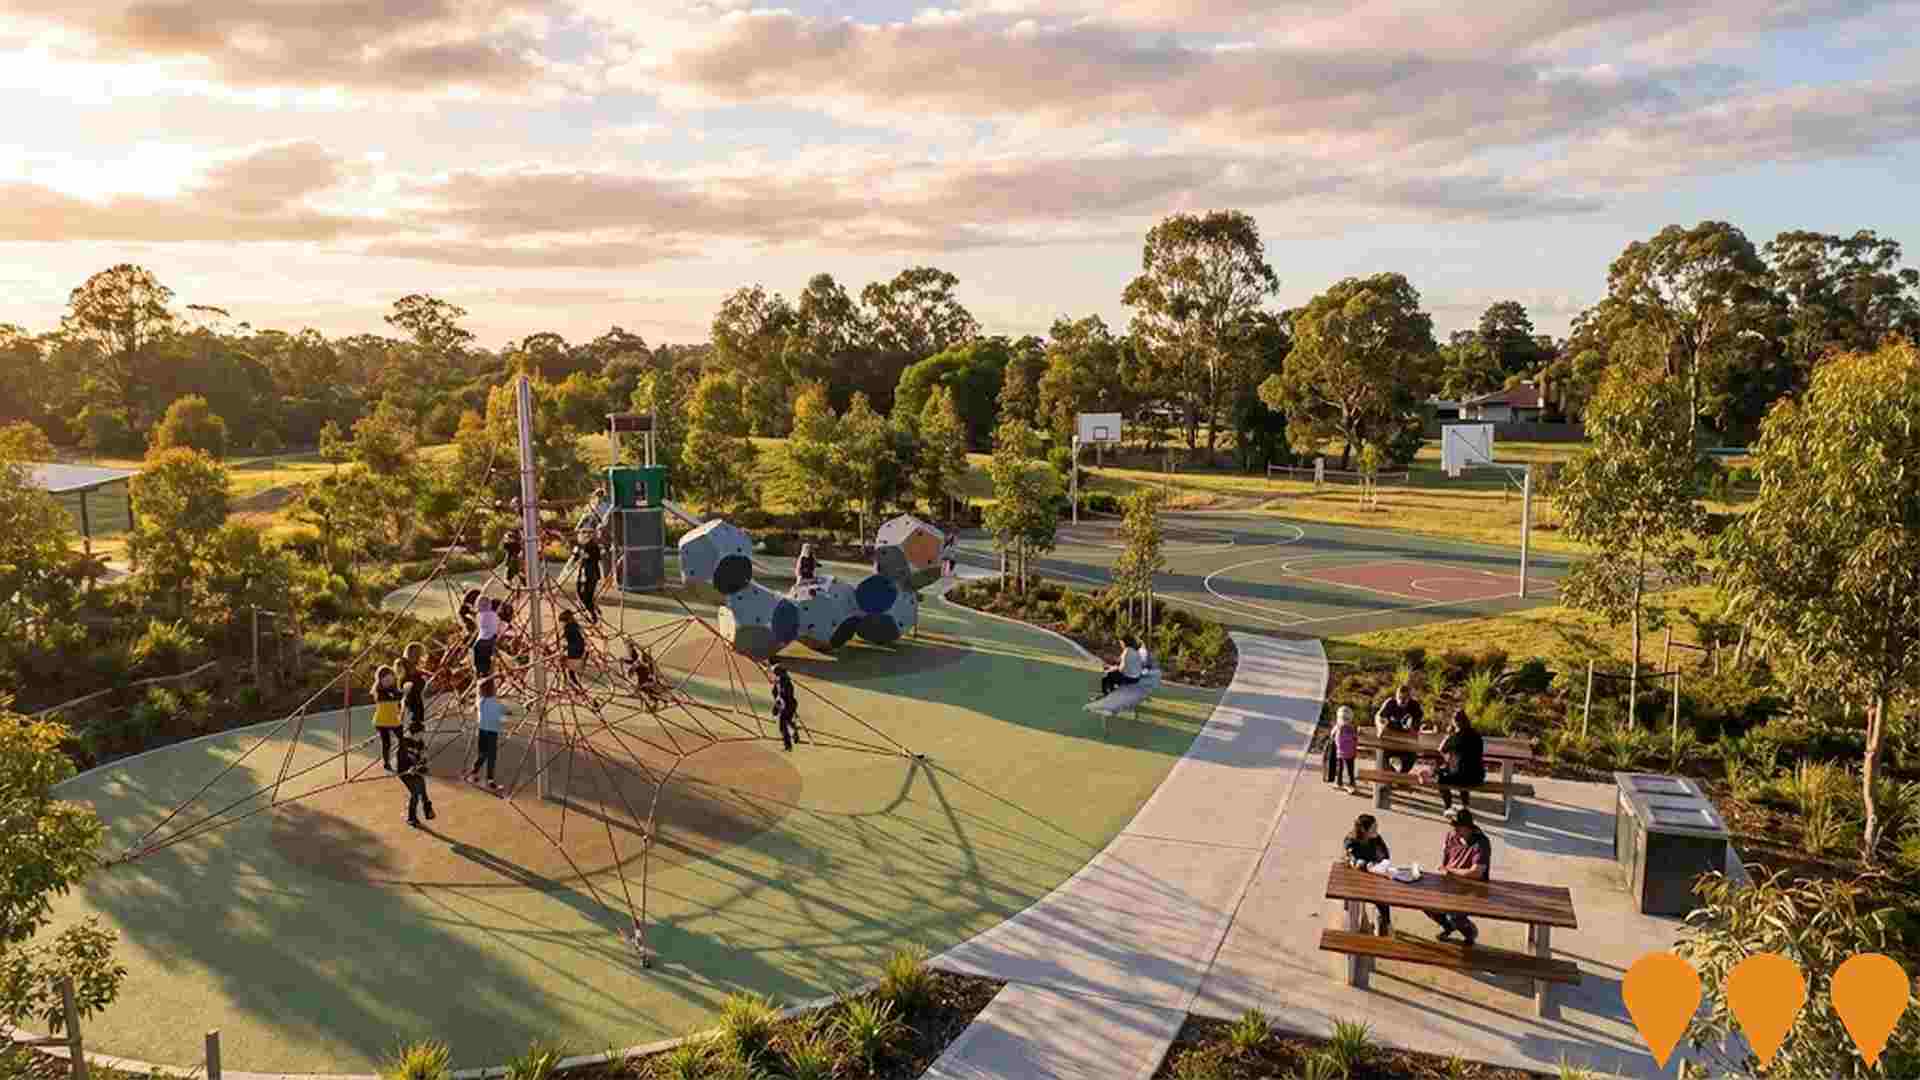
Canvas is a masterplanned community being developed as part of the Bonnyrigg Estate renewal. It will deliver 210 land lots for private sale and 65 new community homes, with the potential for more social homes in later stages. The project includes new and extended roads, as well as a new 9,000sqm public junior play park with play equipment, cycle paths, and picnic areas. Stage 1 subdivision works are currently progressing, with completion anticipated by the end of 2025. Land lots are available for purchase with an anticipated settlement in 2026.
Bonnyrigg Town Hub Precinct (Stages 12-13)
Part of the larger Bonnyrigg Renewal project, the Town Hub Precinct (Stages 12-13) involves the construction of a new link road and super lots for future apartment and townhouse buildings. It will eventually include 185 new social homes and a total of 600 homes in a mixed-tenure model, alongside a new plaza and parkland areas. Subdivision works for the new road and lots have commenced.
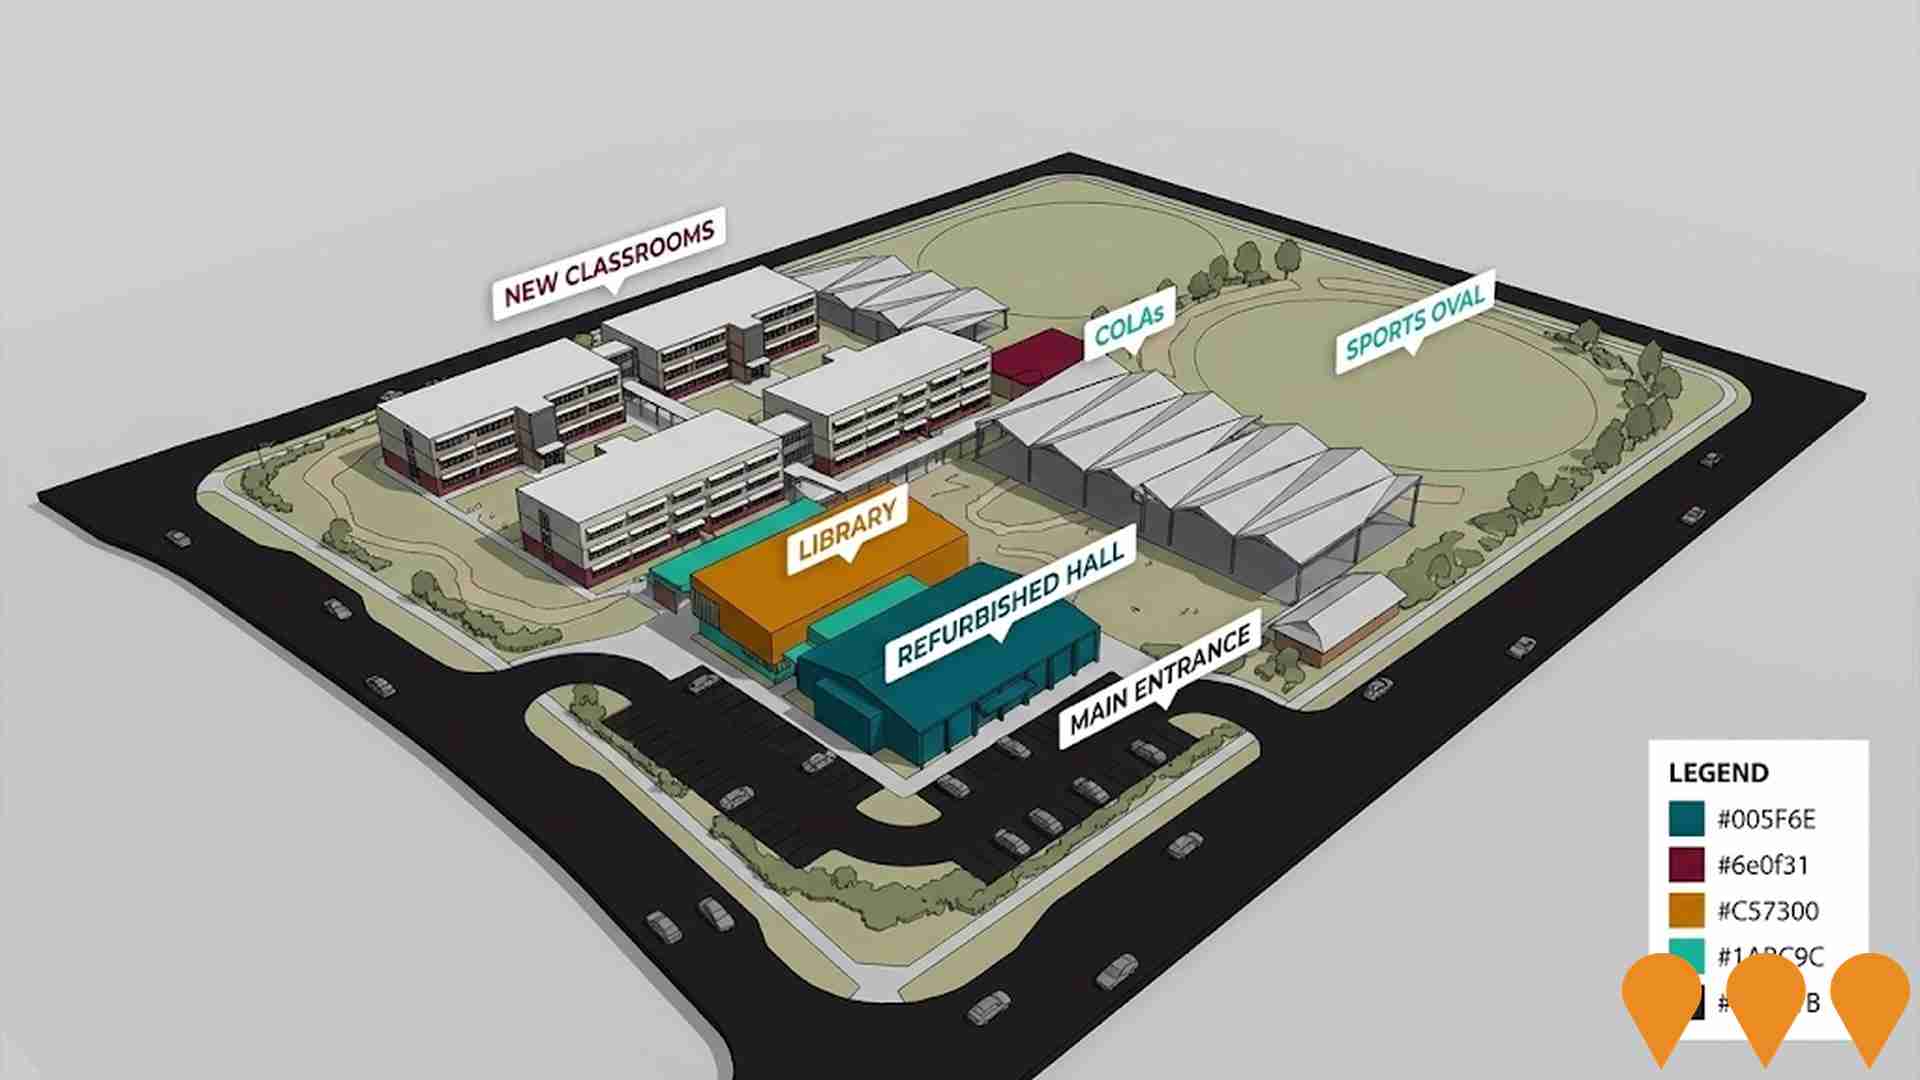
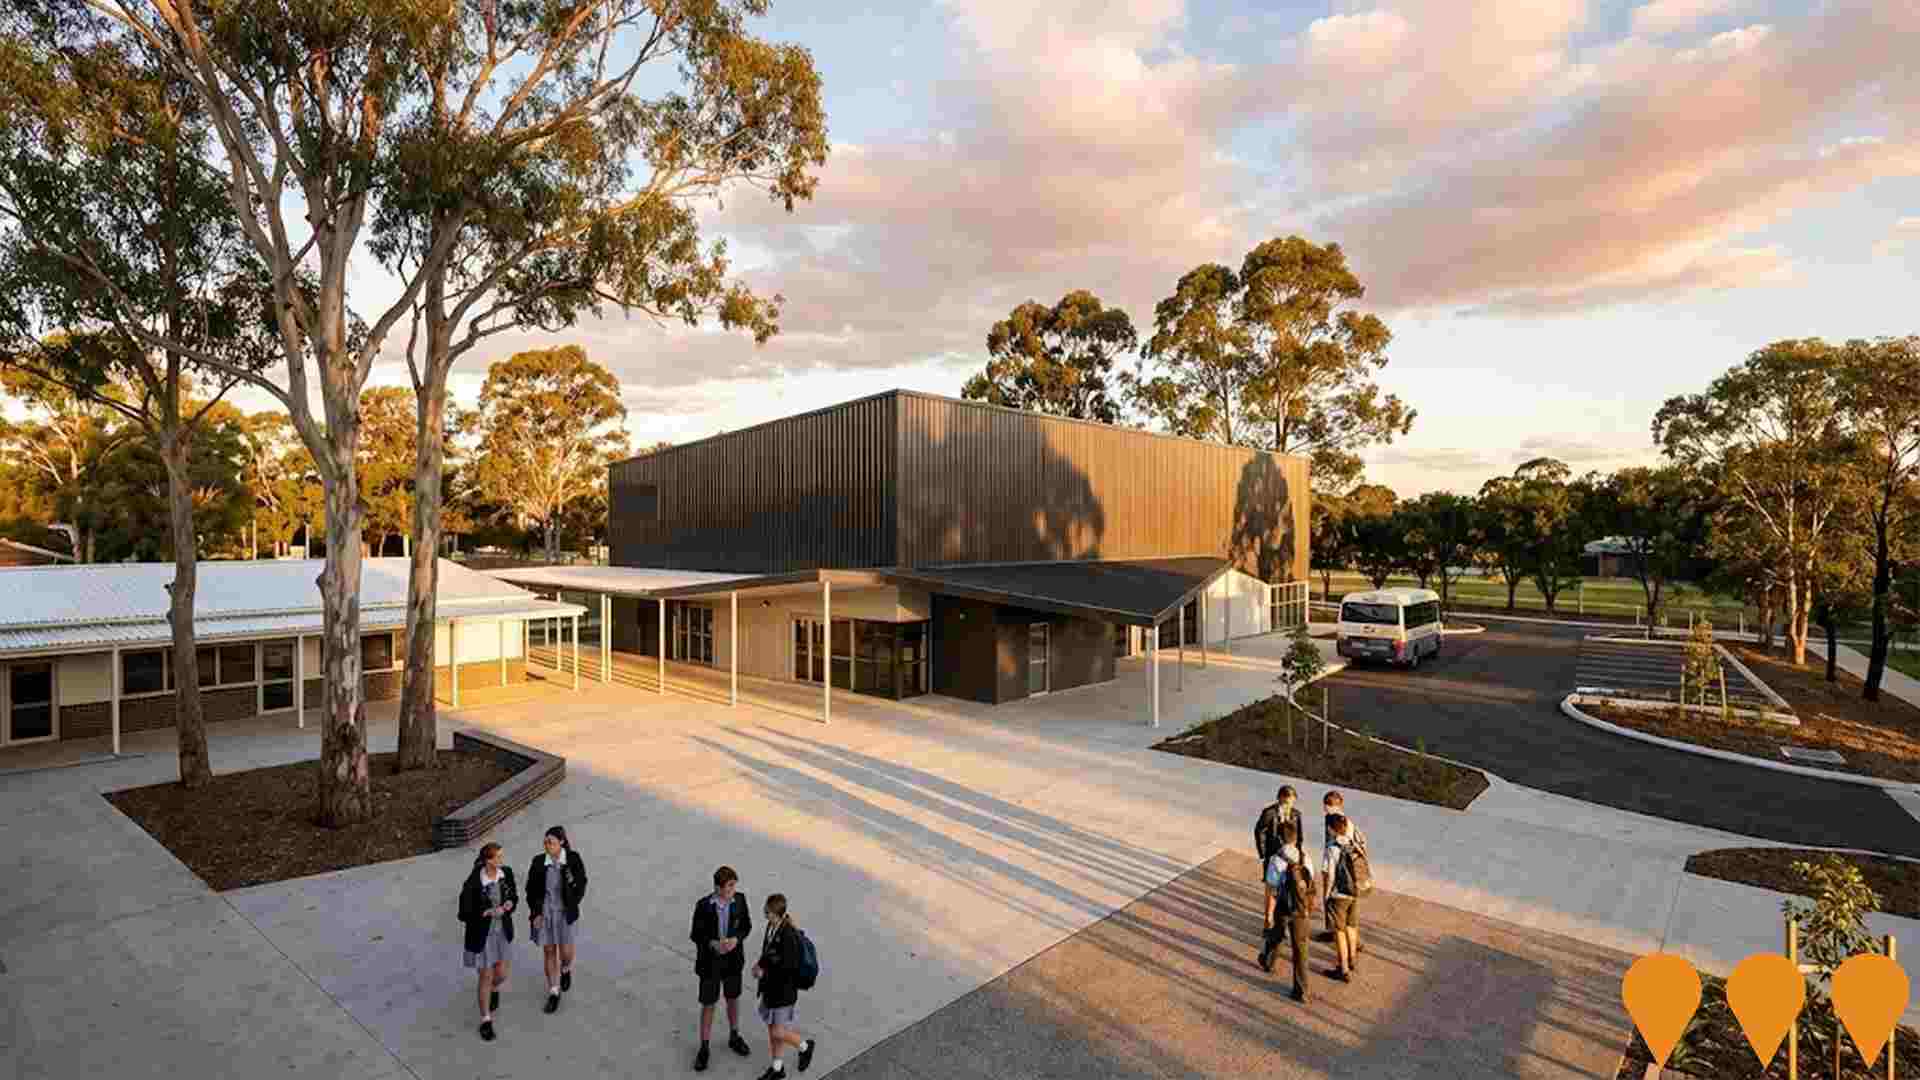
Bonnyrigg High School Upgrade
Part of 1.08 billion NSW Government investment in school facilities. Bonnyrigg High School will receive significant infrastructure upgrades including new learning spaces, library, and recreational facilities.
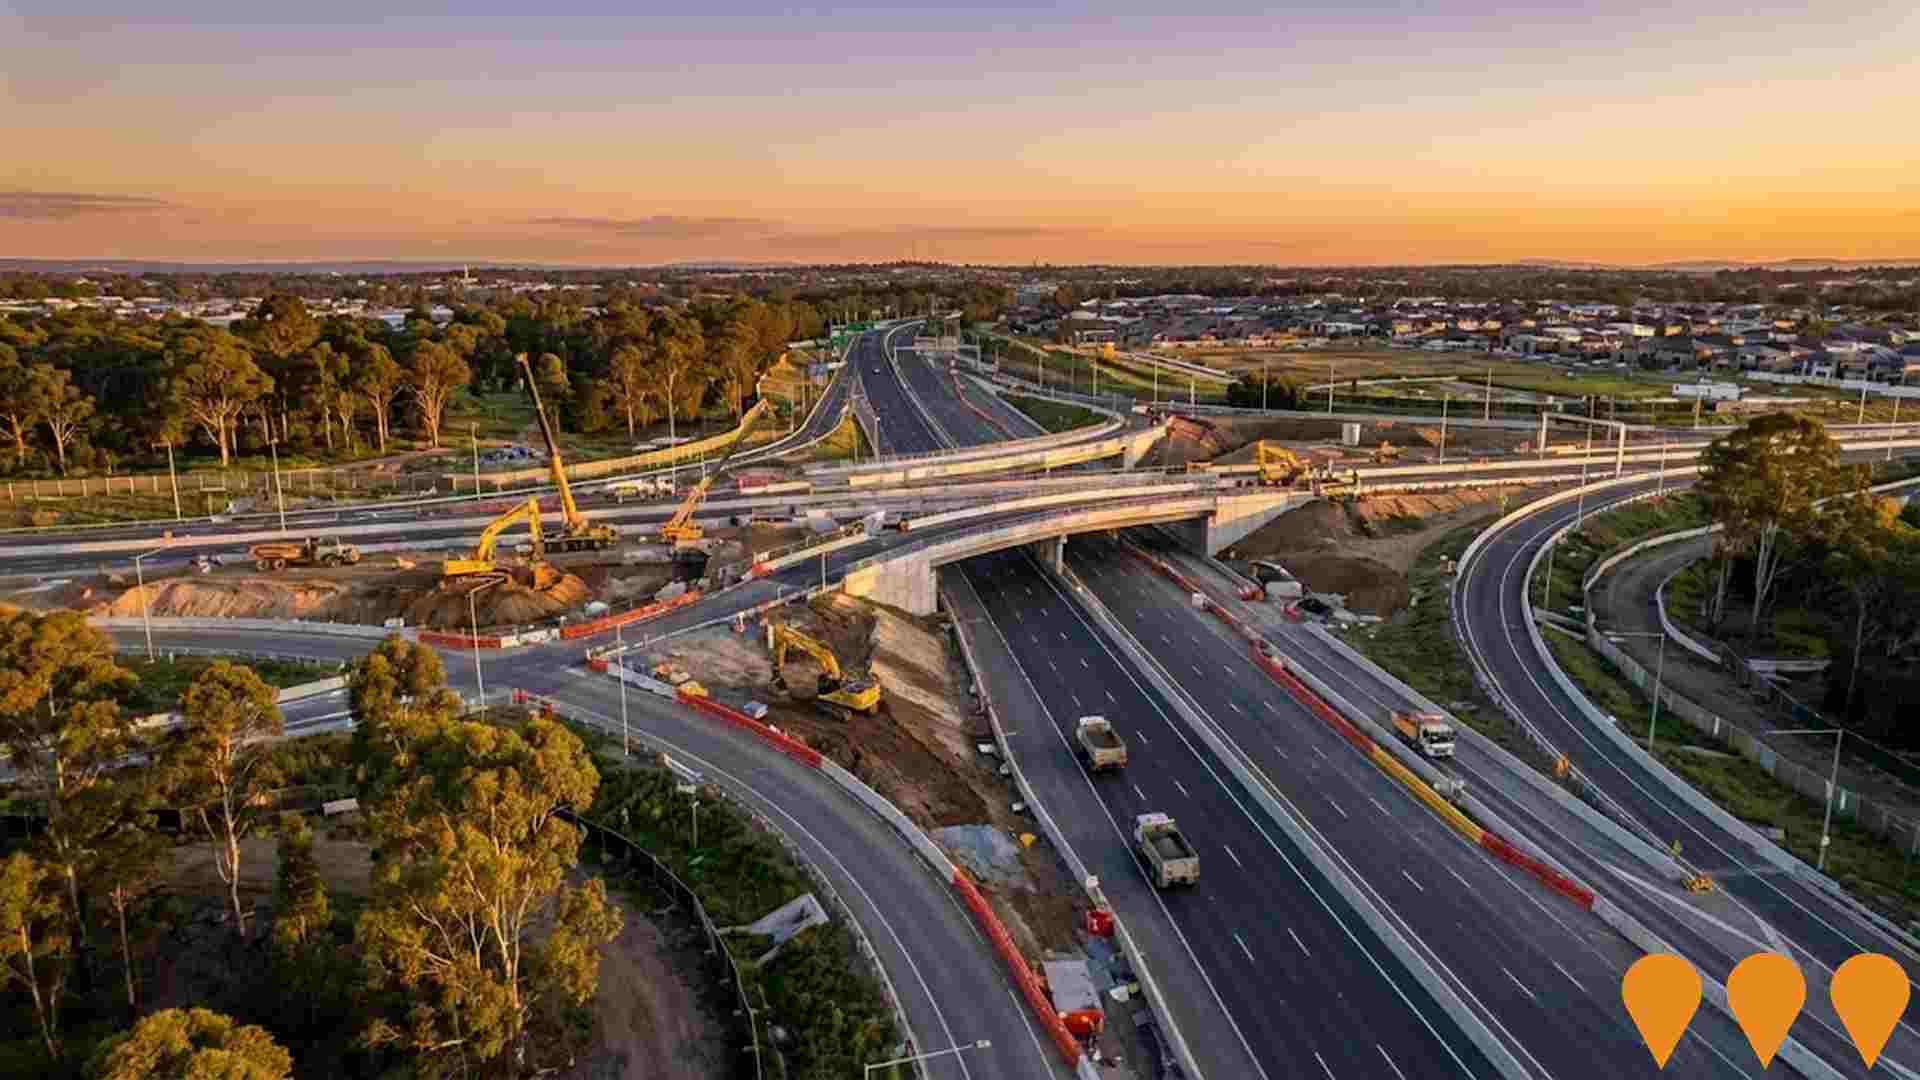
M7-M12 Integration Project
A $1.7 billion road network upgrade project in Western Sydney comprising three key elements: the M7 Motorway Widening (adding one lane in each direction within the existing median for 26 kilometres between the M5 at Prestons and Richmond Road at Glendenning), the M7-M12 Interchange (constructing a direct motorway-to-motorway connection between the M7 and the new M12 Motorway), and the Elizabeth Drive Connection (upgrading Elizabeth Drive and realigning Wallgrove and Cecil Roads to connect the M12 to the local road network). The project aims to support Western Sydney's growth, improve travel times, reduce congestion, and provide direct access to the Western Sydney International Airport. Construction commenced in August 2023 and is expected to open mid-2026.
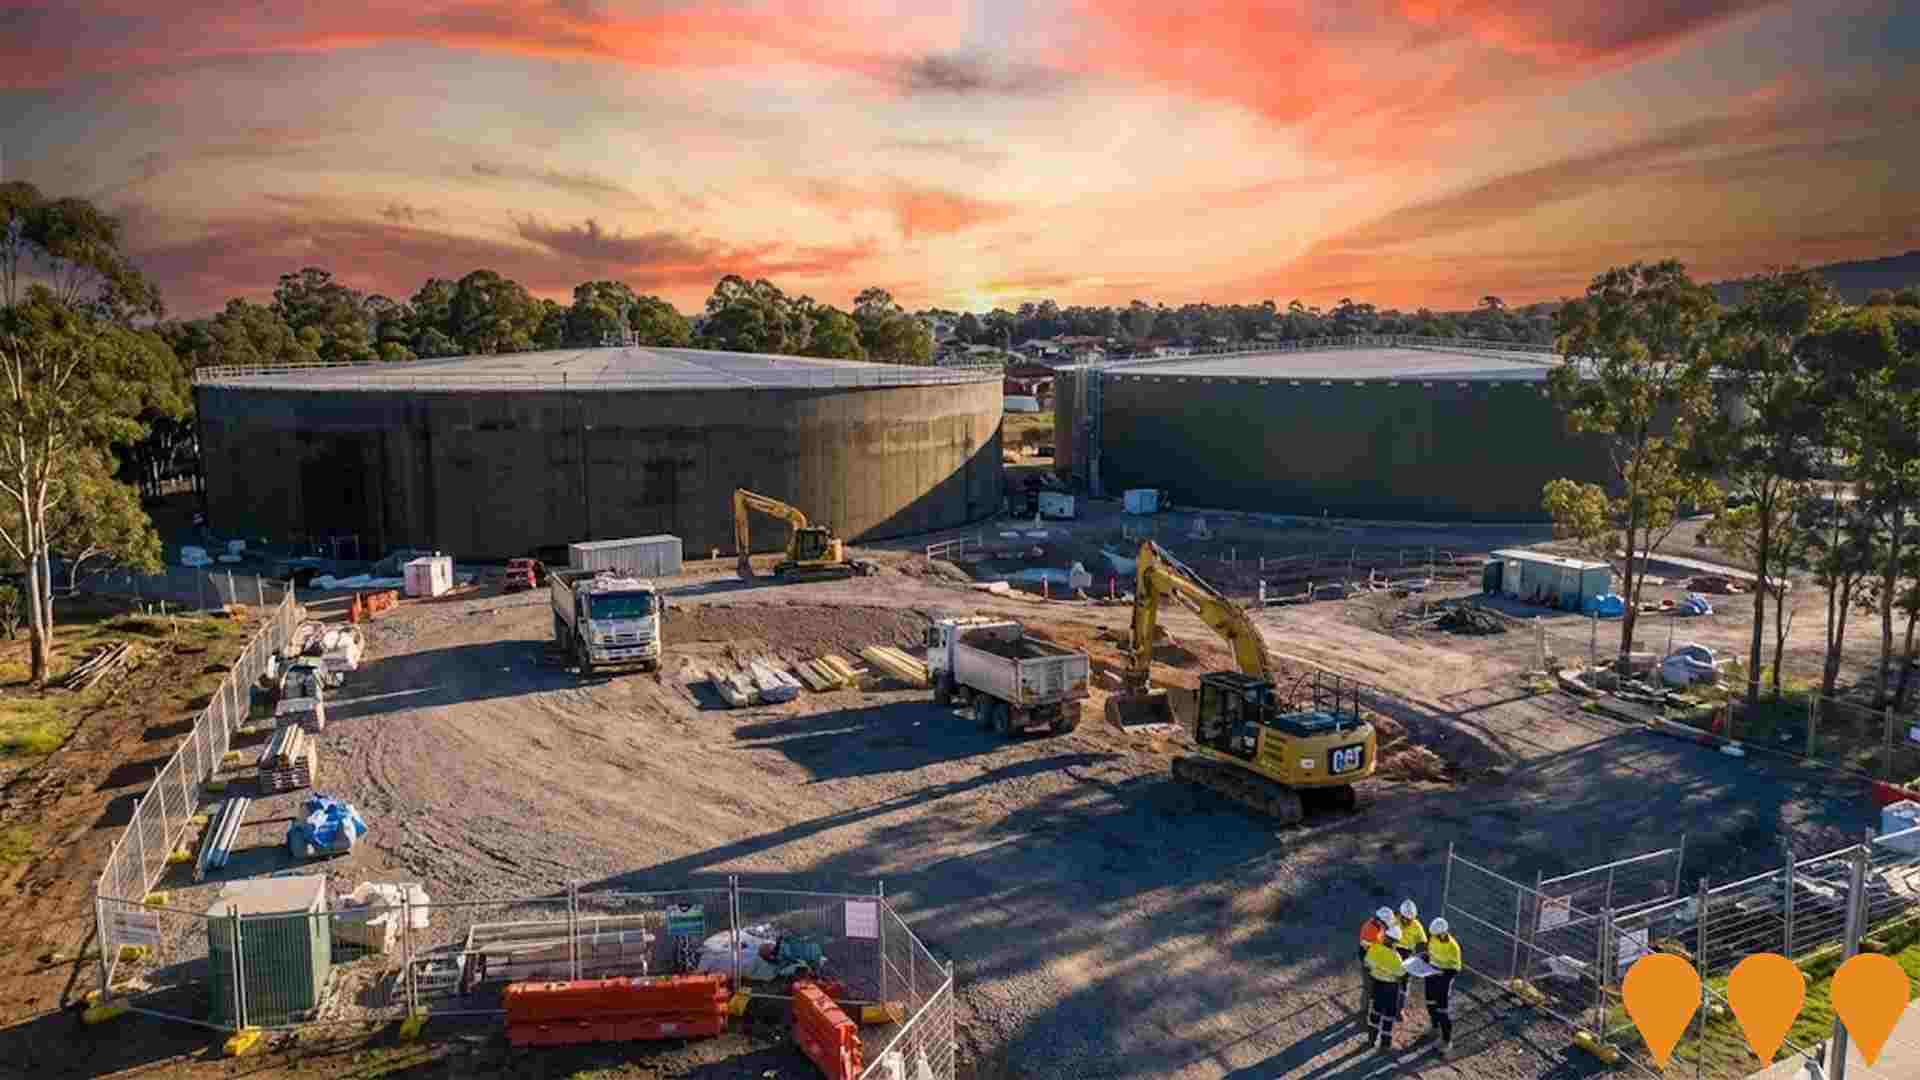
Liverpool Reservoir Water Infrastructure Upgrade
New 60ML reservoir tank and pumping station at Liverpool Reservoir facility in Cecil Hills. Part of Prospect to Macarthur (ProMac) project adding 115 megalitres capacity for South West Growth Area.
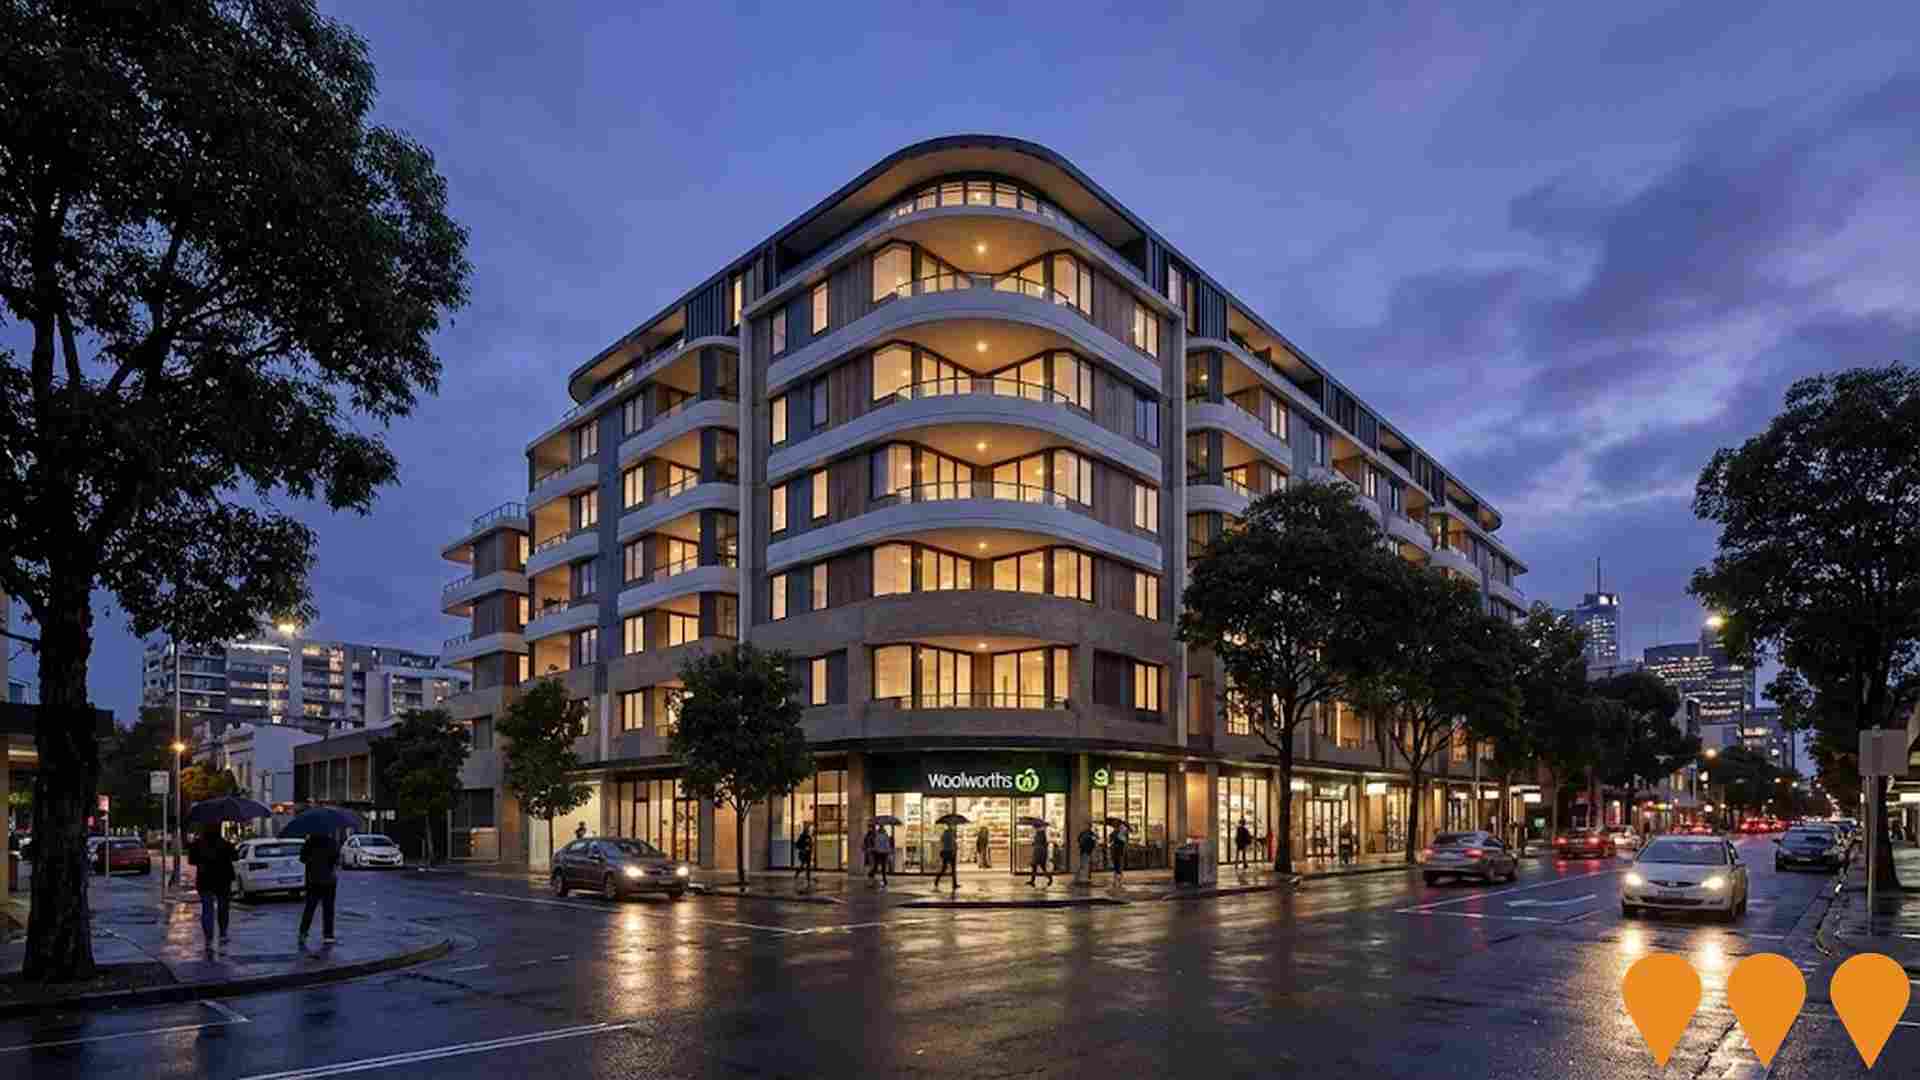
Avala Apartments Miller
Residential apartment development featuring 145 apartments across 3 buildings (9 storeys). Will include 380 car spaces, 66 bike spaces and communal open space areas.
Employment
Employment conditions in Green Valley remain below the national average according to AreaSearch analysis
Green Valley has a skilled workforce with prominent manufacturing and industrial sectors. Its unemployment rate is 4.8%, having grown by an estimated 4.6% over the past year as of September 2025.
At this time, 6,199 residents are employed while the unemployment rate stands at 4.8%, 0.6% higher than Greater Sydney's rate of 4.2%. Workforce participation is lower at 49.0% compared to Greater Sydney's 60.0%. Key industries employing residents include health care & social assistance, retail trade, and manufacturing, with manufacturing being particularly notable at twice the regional average. Conversely, professional & technical services employ only 4.7% of local workers, below Greater Sydney's 11.5%.
Over the year to September 2025, employment increased by 4.6%, while labour force grew by 4.0%, causing unemployment to fall by 0.5 percentage points. In comparison, Greater Sydney saw employment growth of 2.1% and a slight rise in unemployment. State-level data from November 25 shows NSW employment contracted slightly by 0.03%, with an unemployment rate of 3.9%. National forecasts suggest total employment will grow by 6.6% over five years and 13.7% over ten years, but industry-specific growth rates vary. Applying these projections to Green Valley's employment mix indicates local employment should increase by approximately 5.9% over five years and 12.7% over ten years, though this is a simplified extrapolation for illustrative purposes.
Frequently Asked Questions - Employment
Income
The area's income profile falls below national averages based on AreaSearch analysis
The Green Valley SA2's median income among taxpayers was $50,181 in financial year 2022. The average income stood at $58,213 during the same period. These figures compare to Greater Sydney's median and average incomes of $56,994 and $80,856 respectively. Based on Wage Price Index growth of 12.61% since financial year 2022, current estimates for Green Valley SA2 would be approximately $56,509 (median) and $65,554 (average) as of September 2025. According to Census 2021 income data, individual incomes in Green Valley SA2 lag at the 9th percentile ($580 weekly), while household income performs better at the 51st percentile. The income bracket indicating $1,500 - 2,999 earnings captures 34.6% of the community (4,434 individuals). This is consistent with broader trends across the metropolitan region showing 30.9% in the same category. High housing costs consume 17.7% of income, leaving disposable income at the 50th percentile.
Frequently Asked Questions - Income
Housing
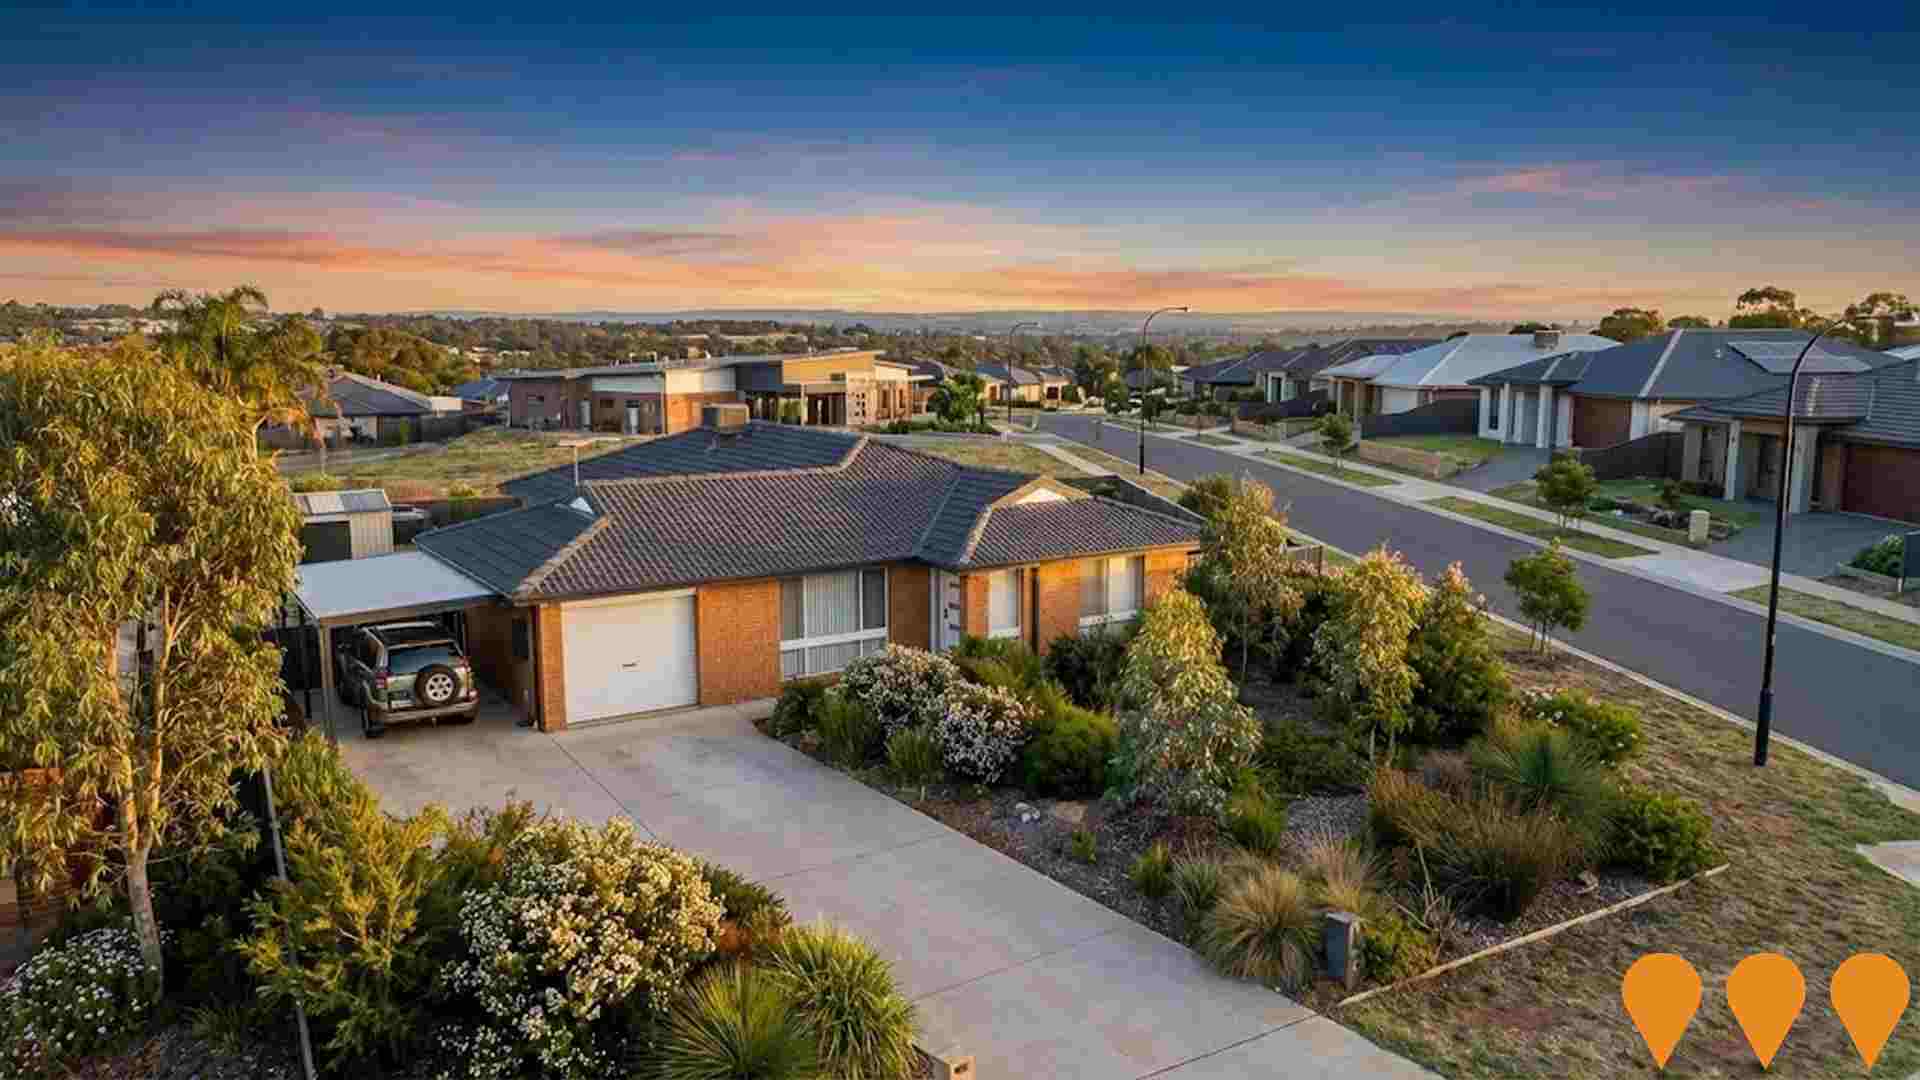
Green Valley is characterized by a predominantly suburban housing profile, with above-average rates of outright home ownership
Green Valley's dwelling structures, as per the latest Census, consisted of 82.1% houses and 17.9% other dwellings (semi-detached, apartments, 'other' dwellings), compared to Sydney metro's 90.4% houses and 9.6% other dwellings. Home ownership in Green Valley stood at 32.1%, with mortgaged dwellings at 39.3% and rented ones at 28.6%. The median monthly mortgage repayment was $2,041, below Sydney metro's average of $2,475. The median weekly rent in Green Valley was $450, compared to Sydney metro's $490. Nationally, Green Valley's mortgage repayments were higher at $2,041 than the Australian average of $1,863, and rents were substantially above the national figure of $375.
Frequently Asked Questions - Housing
Household Composition
Green Valley features high concentrations of family households, with a higher-than-average median household size
Family households compose 87.9% of all households, including 51.6% couples with children, 17.2% couples without children, and 17.7% single parent families. Non-family households account for the remaining 12.1%, with lone person households at 10.9% and group households comprising 1.2%. The median household size is 3.5 people, larger than the Greater Sydney average of 3.4.
Frequently Asked Questions - Households
Local Schools & Education
Green Valley faces educational challenges, with performance metrics placing it in the bottom quartile of areas assessed nationally
The area's university qualification rate is 17.5%, significantly lower than Greater Sydney's average of 38.0%. Bachelor degrees are the most common at 13.7%, followed by postgraduate qualifications (2.7%) and graduate diplomas (1.1%). Vocational credentials are prevalent, with 27.8% of residents aged 15+ holding them, including advanced diplomas (10.1%) and certificates (17.7%). Educational participation is high, with 31.4% currently enrolled in formal education, comprising 10.0% in primary, 9.7% in secondary, and 6.1% in tertiary education.
Educational participation is notably high, with 31.4% of residents currently enrolled in formal education. This includes 10.0% in primary education, 9.7% in secondary education, and 6.1% pursuing tertiary education.
Frequently Asked Questions - Education
Schools Detail
Nearby Services & Amenities
Transport
Transport servicing is good compared to other areas nationally based on assessment of service frequency, route connectivity and accessibility
Green Valley has 64 active public transport stops, all of which are bus stops. These stops are serviced by 40 different routes that together provide 2,702 weekly passenger trips. The accessibility of these stops is rated as excellent, with residents typically located just 151 meters from the nearest one.
On average, there are 386 trips per day across all routes, which equates to approximately 42 weekly trips per individual stop.
Frequently Asked Questions - Transport
Transport Stops Detail
Health
Green Valley's residents boast exceedingly positive health performance metrics with younger cohorts in particular seeing very low prevalence of common health conditions
Green Valley's health outcomes data shows excellent results, with younger cohorts having a very low prevalence of common health conditions. As of approximately mid-2020, around 49% (~6,267 people) had private health cover, lower than Greater Sydney's 52.5%, and the national average of 55.3%. Diabetes and arthritis were the most prevalent medical conditions in the area, affecting 6.5% and 5.7% of residents respectively, as of late-2021.
Around 77.3% declared themselves completely clear of medical ailments, comparable to Greater Sydney's 77.9%. As of mid-2021, approximately 15.8% (2,030 people) were aged 65 and over, higher than Greater Sydney's 10.1%. Despite this, health outcomes among seniors require particular attention.
Frequently Asked Questions - Health
Cultural Diversity
Green Valley is among the most culturally diverse areas in the country based on AreaSearch assessment of a range of language and cultural background related metrics
Green Valley has a culturally diverse population, with 53.4% born overseas and 71.0% speaking a language other than English at home. Christianity is the predominant religion in Green Valley, comprising 49.7% of its population. Buddhism, however, is substantially overrepresented at 17.1%, compared to Greater Sydney's average of 6.6%.
The top three ancestry groups are Other (34.6%), Vietnamese (11.9%), and Australian (8.8%). Notably, Serbian (2.8%) and Spanish (1.4%) are overrepresented while Lebanese (3.1%) is underrepresented compared to regional averages.
Frequently Asked Questions - Diversity
Age
Green Valley's population is slightly younger than the national pattern
Green Valley's median age in 2021 was 37 years, matching Greater Sydney's figure and closely resembling Australia's median age of 38 years. The 55-64 age group constituted 14.0% of Green Valley's population, higher than Greater Sydney's percentage. Conversely, the 35-44 cohort made up 11.2%, lower than Greater Sydney's figure. Between 2021 and present, the 65 to 74 age group has increased from 8.5% to 10.3% of Green Valley's population, while the 5 to 14 age group has decreased from 13.6% to 12.4%. By 2041, demographic projections indicate significant shifts in Green Valley's age structure. The 75 to 84 age group is expected to grow by 112%, adding 606 people and reaching a total of 1,147 from the previous figure of 540. This growth is driven entirely by an aging population dynamic, with those aged 65 and above comprising all projected growth. Meanwhile, the 55 to 64 and 45 to 54 age cohorts are anticipated to experience population declines.
