Chart Color Schemes
This analysis uses ABS Statistical Areas Level 2 (SA2) boundaries, which can materially differ from Suburbs and Localities (SAL) even when sharing similar names.
SA2 boundaries are defined by the Australian Bureau of Statistics and are designed to represent communities for statistical reporting (e.g., census and ERP).
Suburbs and Localities (SAL) represent commonly-used suburb/locality names (postal-style areas) and may use different geographic boundaries. For comprehensive analysis, consider reviewing both boundary types if available.
est. as @ -- *
ABS ERP | -- people | --
2021 Census | -- people
Sales Activity
Curious about local property values? Filter the chart to assess the volume and appreciation (including resales) trends and regional comparisons, or scroll to the map below view this information at an individual property level.
Find a Recent Sale
Sales Detail
Population
Mount Gambier - East is positioned among the lower quartile of areas assessed nationally for population growth based on AreaSearch's assessment of recent, and medium term trends
Mount Gambier - East's population was around 15,597 as of November 2025. This showed an increase of 650 people since the 2021 Census, which recorded a population of 14,947. The change was inferred from the estimated resident population of 15,490 in June 2024 and an additional 192 validated new addresses since the Census date. This resulted in a density ratio of 233 persons per square kilometer. Mount Gambier - East's growth rate of 4.3% since the census was within 1.1 percentage points of its SA3 area (5.4%), indicating competitive growth fundamentals. Overseas migration contributed approximately 81.1% of overall population gains during recent periods.
AreaSearch uses ABS/Geoscience Australia projections for each SA2 area, released in 2024 with a base year of 2022. For areas not covered and years post-2032, the SA State Government's Regional/LGA projections by age category are adopted, based on 2021 data and released in 2023, with adjustments made using a method of weighted aggregation of population growth from LGA to SA2 levels. Future population trends suggest an increase just below the median of Australian non-metropolitan areas, with the area expected to gain 850 persons by 2041 based on latest annual ERP population numbers, reflecting a total gain of 4.8% over the 17 years.
Frequently Asked Questions - Population
Development
AreaSearch analysis of residential development drivers sees Mount Gambier - East recording a relatively average level of approval activity when compared to local markets analysed countrywide
Mount Gambier - East has received approximately 77 dwelling approvals per year on average over the past five financial years, totalling 387 homes. As of FY26, 27 approvals have been recorded. On average, 0.4 new residents per year per dwelling were added between FY21 and FY25. This suggests that new construction is meeting or exceeding demand, offering more housing options and potentially driving population growth beyond current projections.
The average expected construction cost value of these properties is $259,000. In the current financial year, $89.6 million in commercial approvals have been registered, indicating high levels of local commercial activity. Compared to the Rest of SA, Mount Gambier - East maintains similar construction rates per capita, keeping market balance consistent with the broader area.
The majority of new building activity consists of detached dwellings (97.0%), with townhouses or apartments making up the remaining 3.0%, preserving the area's low-density nature and attracting space-seeking buyers. With approximately 228 people per approval, Mount Gambier - East reflects a low-density population. According to AreaSearch's latest quarterly estimate, Mount Gambier - East is projected to add 743 residents by 2041. Given current development rates, new housing supply should comfortably meet demand, providing favourable conditions for buyers and potentially supporting growth beyond current population projections.
Frequently Asked Questions - Development
Infrastructure
Mount Gambier - East has limited levels of nearby infrastructure activity, ranking in the 10thth percentile nationally
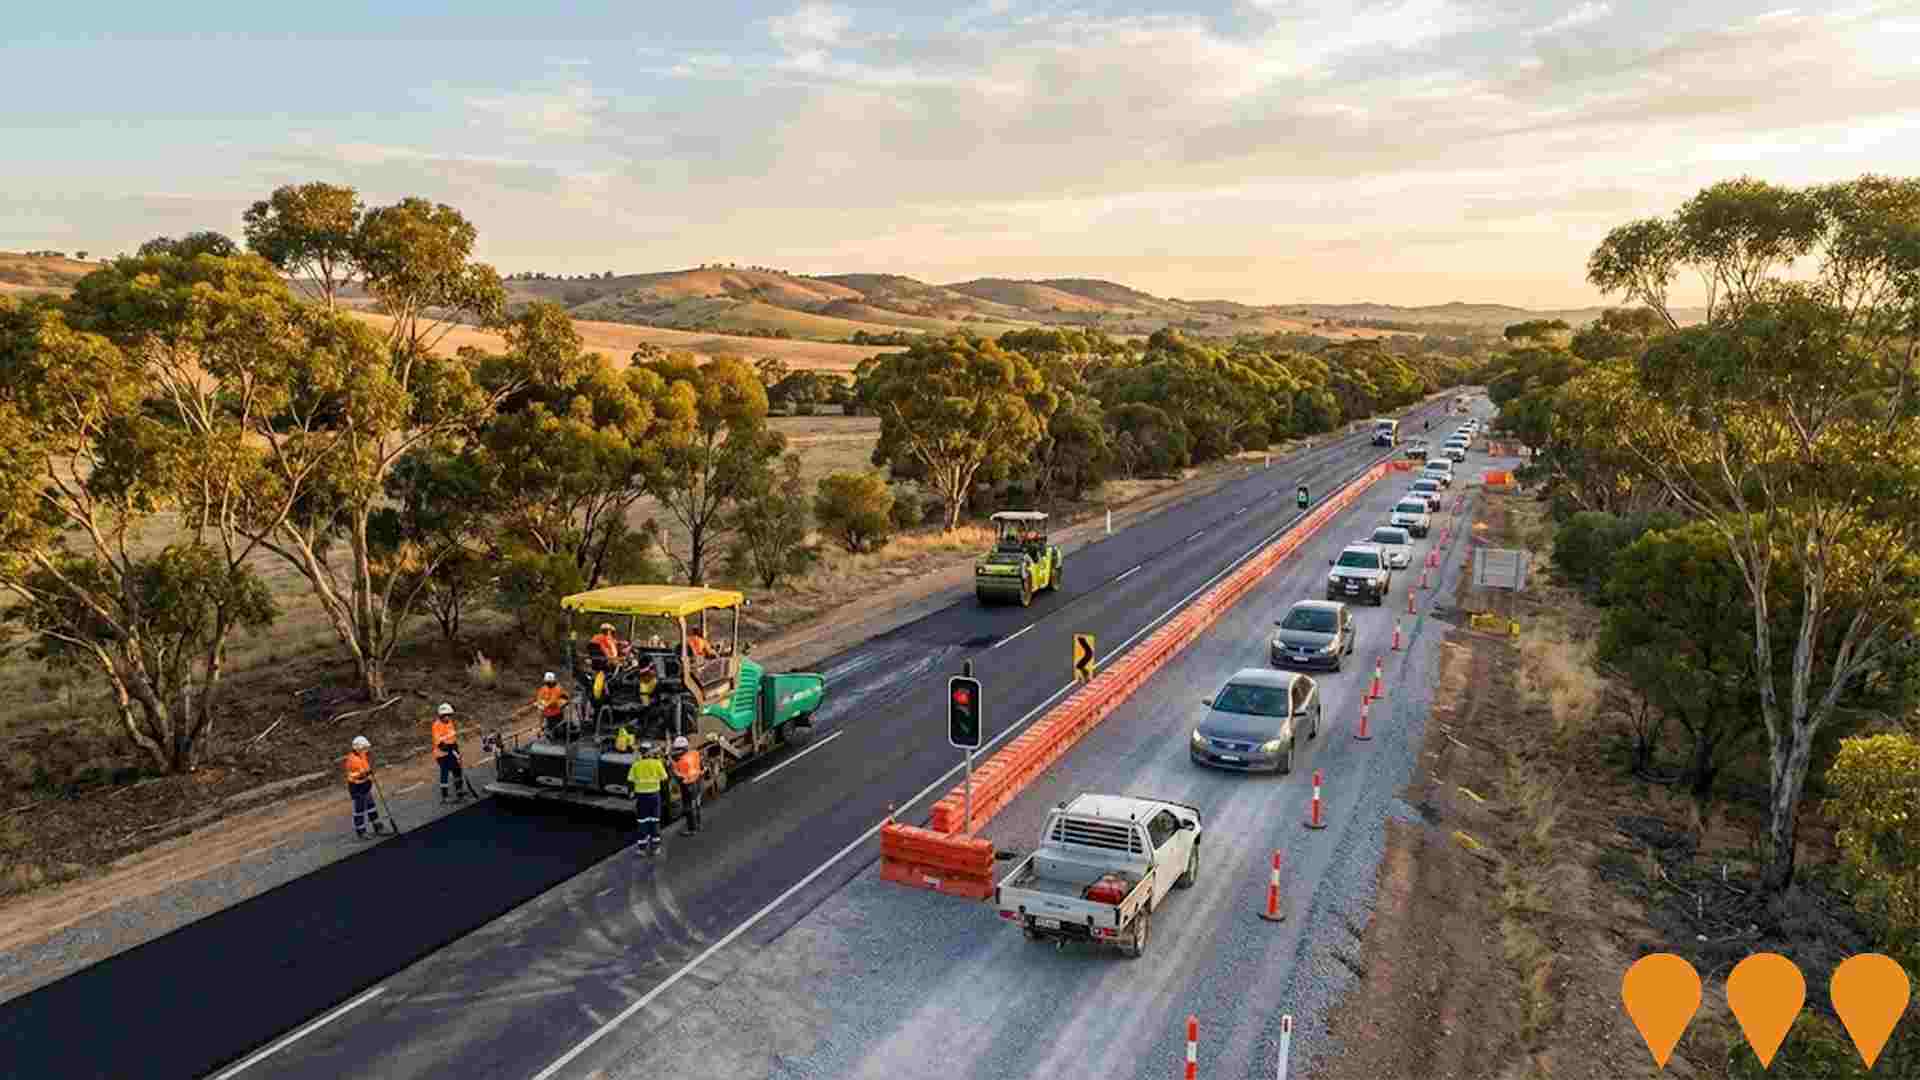
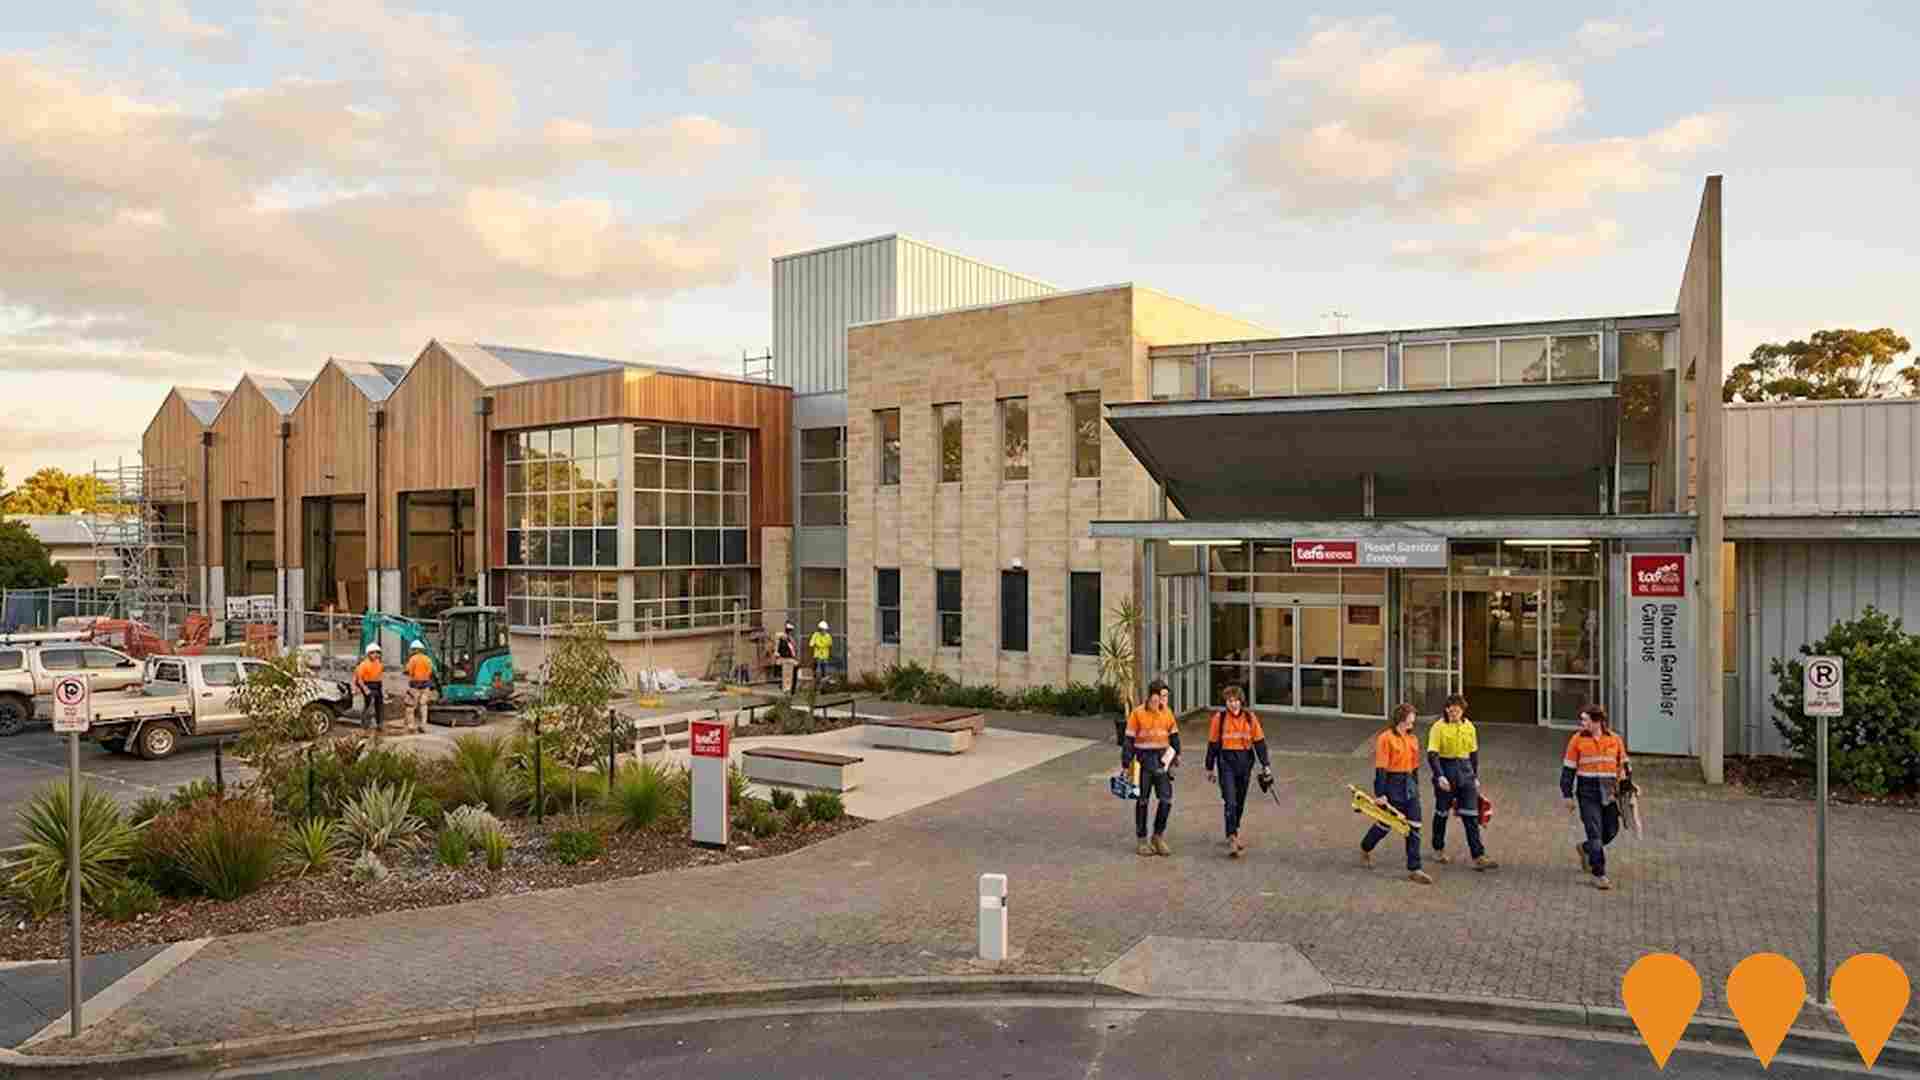
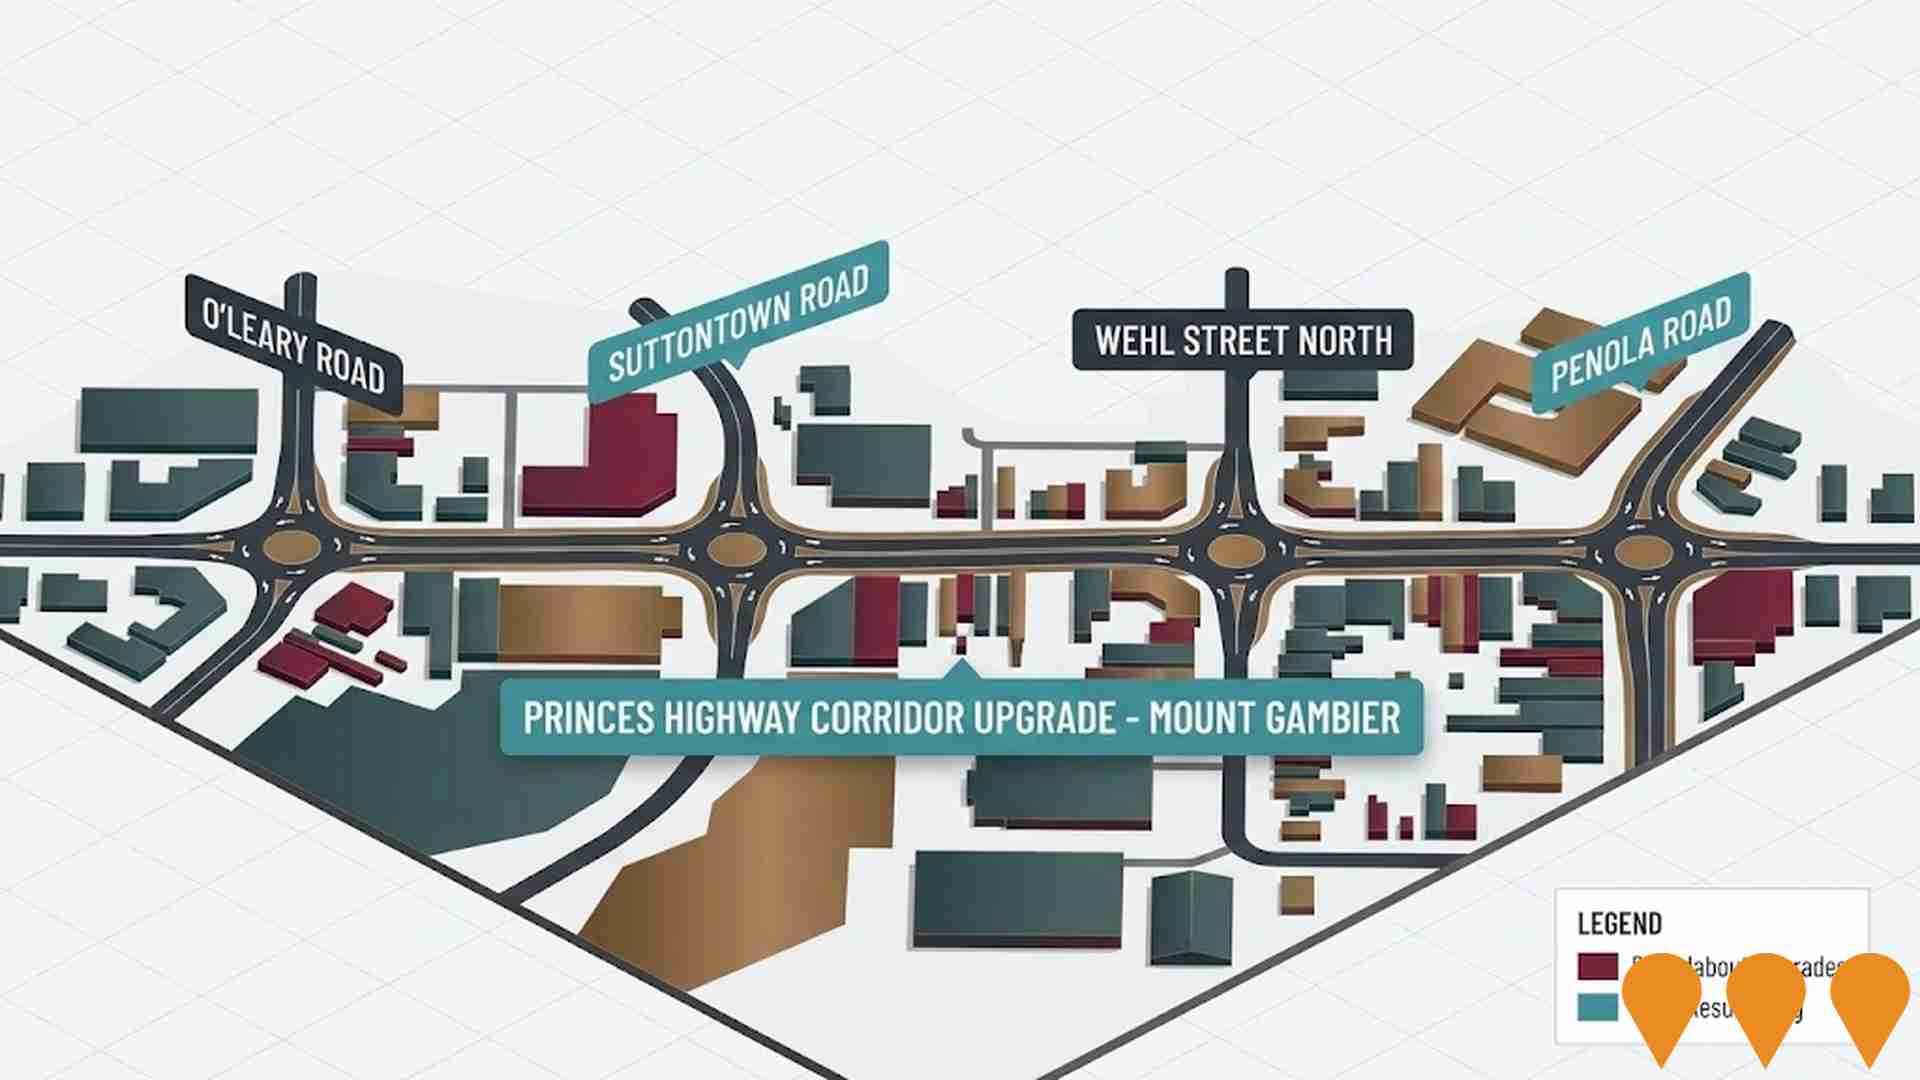
The performance of a region is significantly influenced by changes in local infrastructure. AreaSearch has identified 23 projects that could impact this area. Notable projects include the Mount Gambier Hospital Redevelopment, Mount Gambier Technical College & Research Education Training Precinct, Forestry Centre of Excellence, and Mount Gambier Marketplace Large Format Retail Expansion. The following list details those projects likely to be most relevant.
Professional plan users can use the search below to filter and access additional projects.
INFRASTRUCTURE SEARCH
 Denotes AI-based impression for illustrative purposes only, not to be taken as definitive under any circumstances. Please follow links and conduct other investigations from the project's source for actual imagery. Developers and project owners wishing us to use original imagery please Contact Us and we will do so.
Frequently Asked Questions - Infrastructure
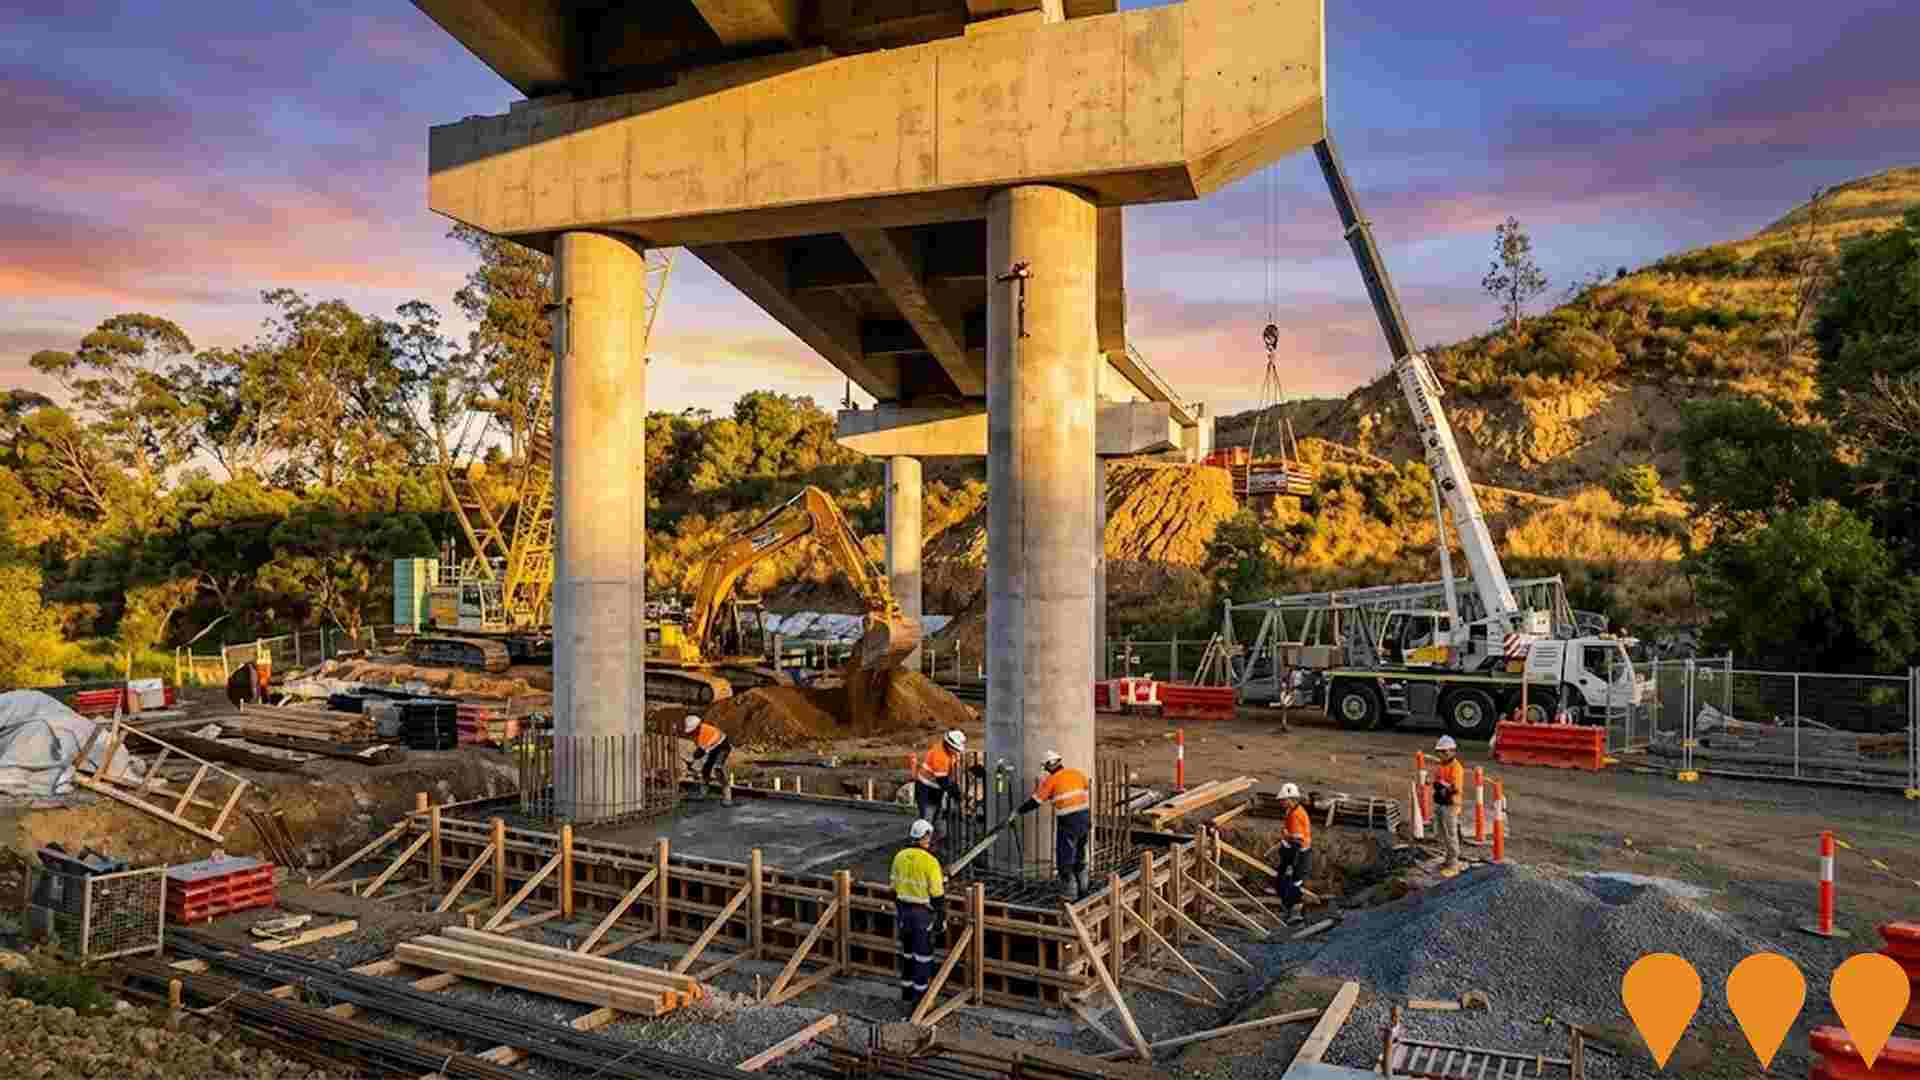
Mount Gambier Hospital Redevelopment
A $24 million redevelopment of the Mount Gambier and Districts Health Service. The project includes a recently completed $8 million Emergency Department Short Stay Unit, a new six-bed Mental Health Sub-Acute and Rehabilitation Service (Wari-ngu), and a two-bed Drug and Alcohol Withdrawal Unit. The upgrade also features an expansion of the SA Pathology service and a new Cancer Care Centre.
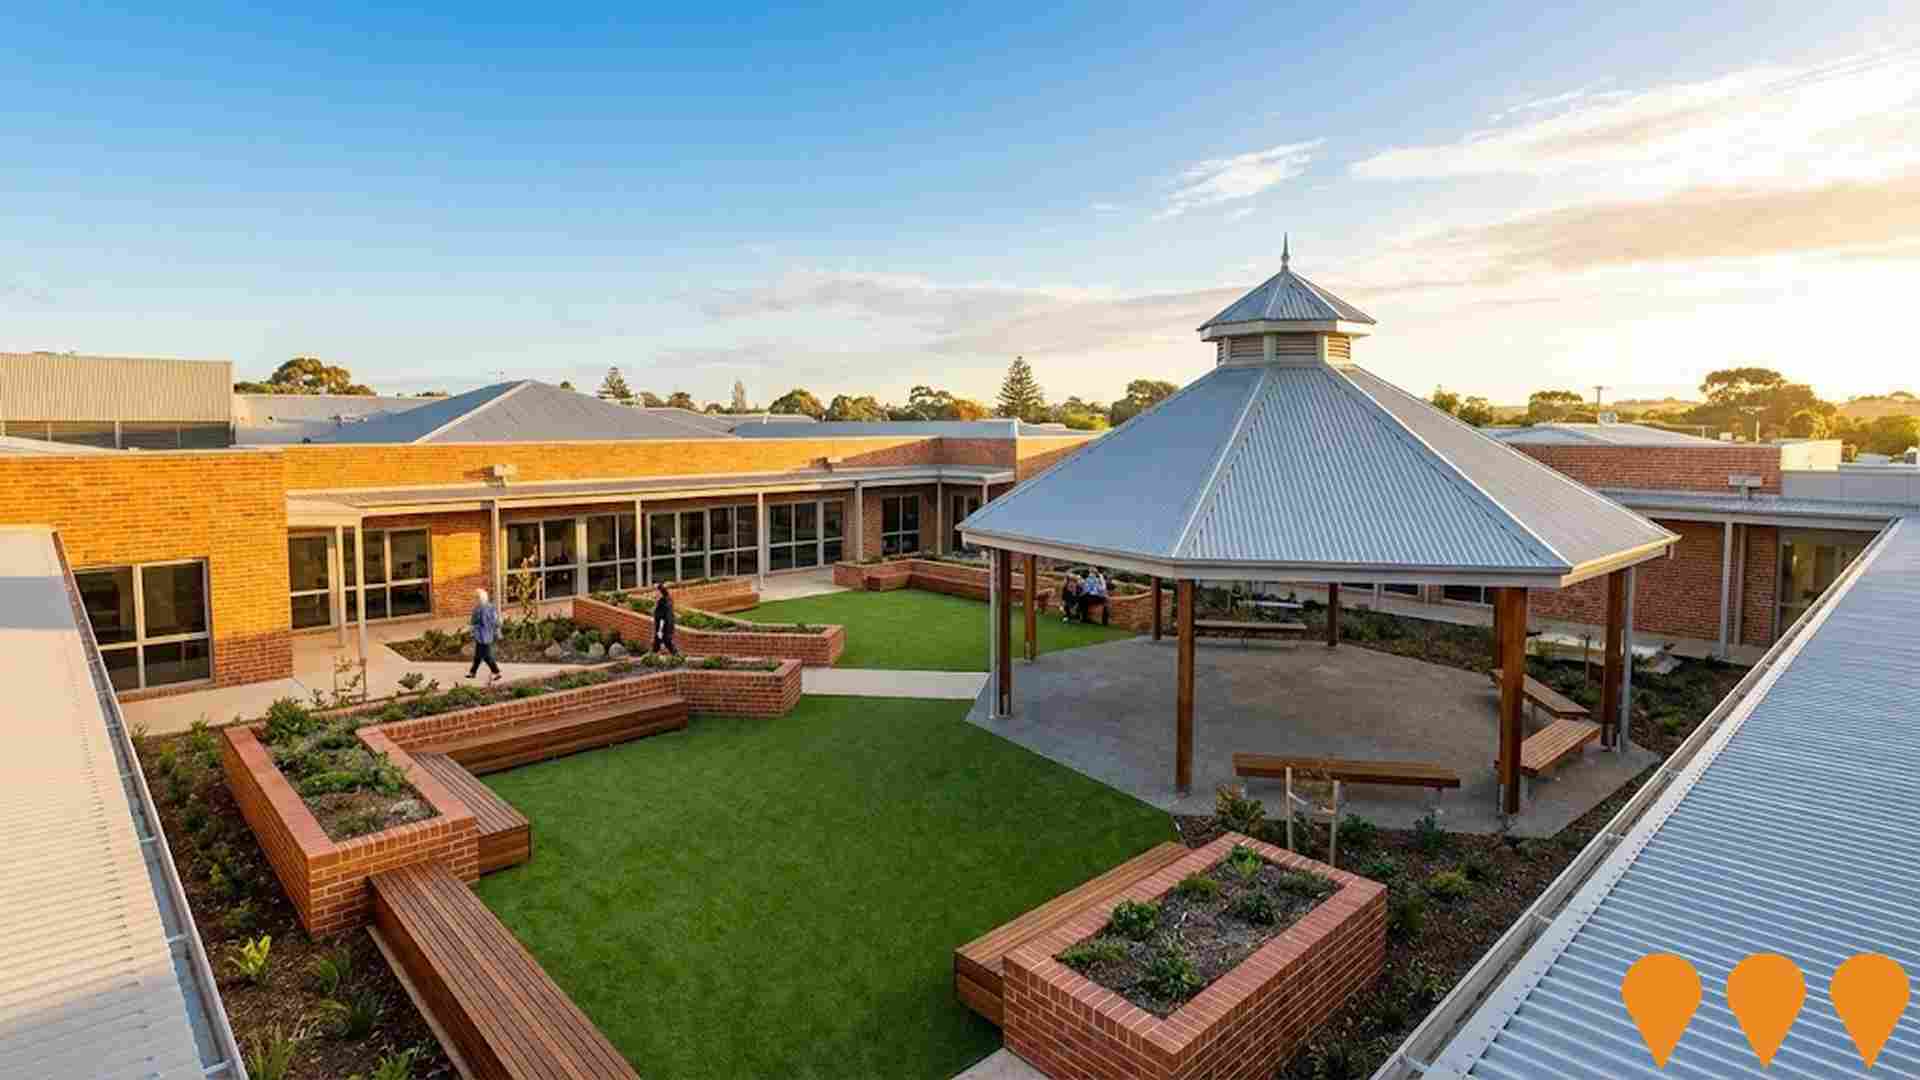
Wulanda Recreation and Convention Centre
State-of-the-art multi-purpose sport, aquatic and conference facility featuring 25m indoor pool, 50m outdoor pool, six multi-purpose courts, convention facilities for 1000+ people, and health club. Council's largest ever infrastructure project valued at $57 million.
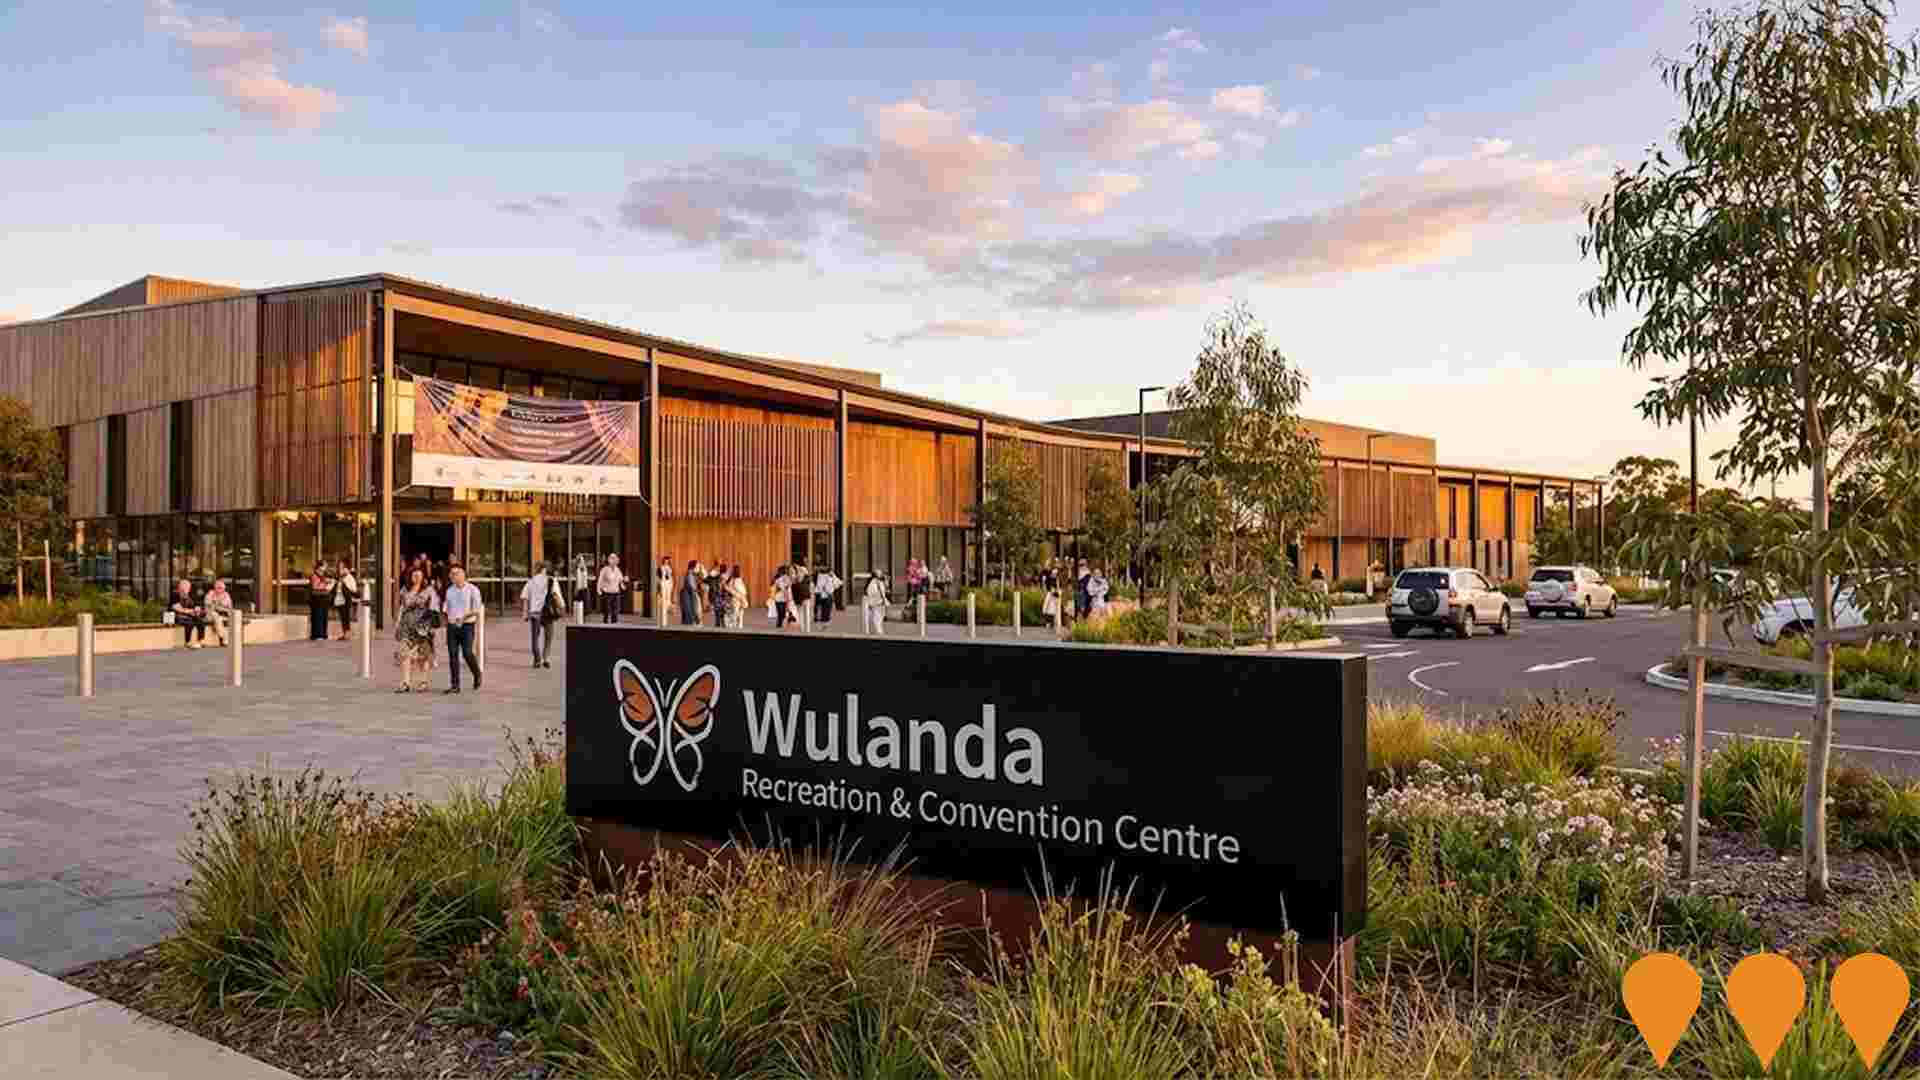
CBD Master Planning and Activation
Strategic revitalisation of the Mount Gambier CBD aimed at activating the city centre through short-term initiatives and long-term infrastructure improvements. The project involves the completion of a detailed Master Plan, Commercial Street pedestrianisation concepts, and better integration with key precincts like the Railway Lands. It aligns with the 'Mount Gambier 2035' community vision and the Council's 2024-2028 Strategic Plan.
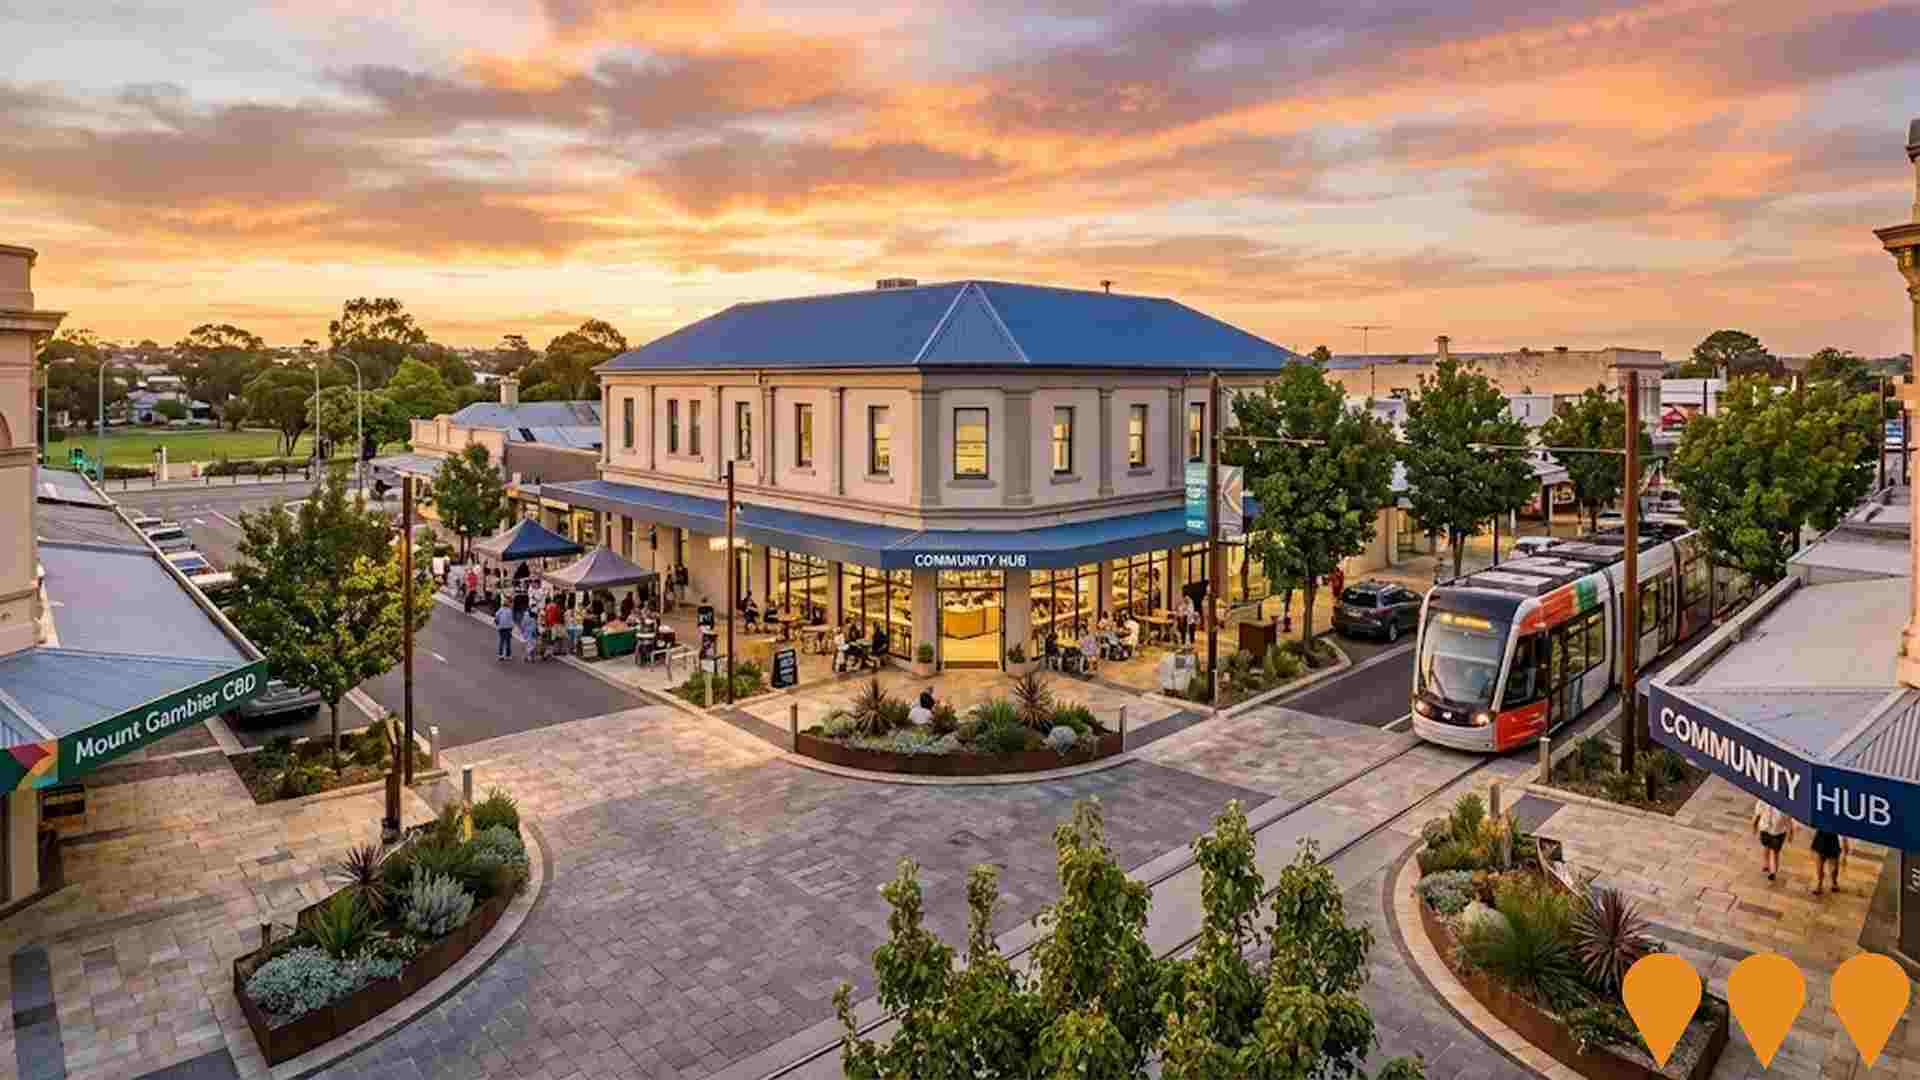
Mount Gambier Technical College & Research Education Training Precinct
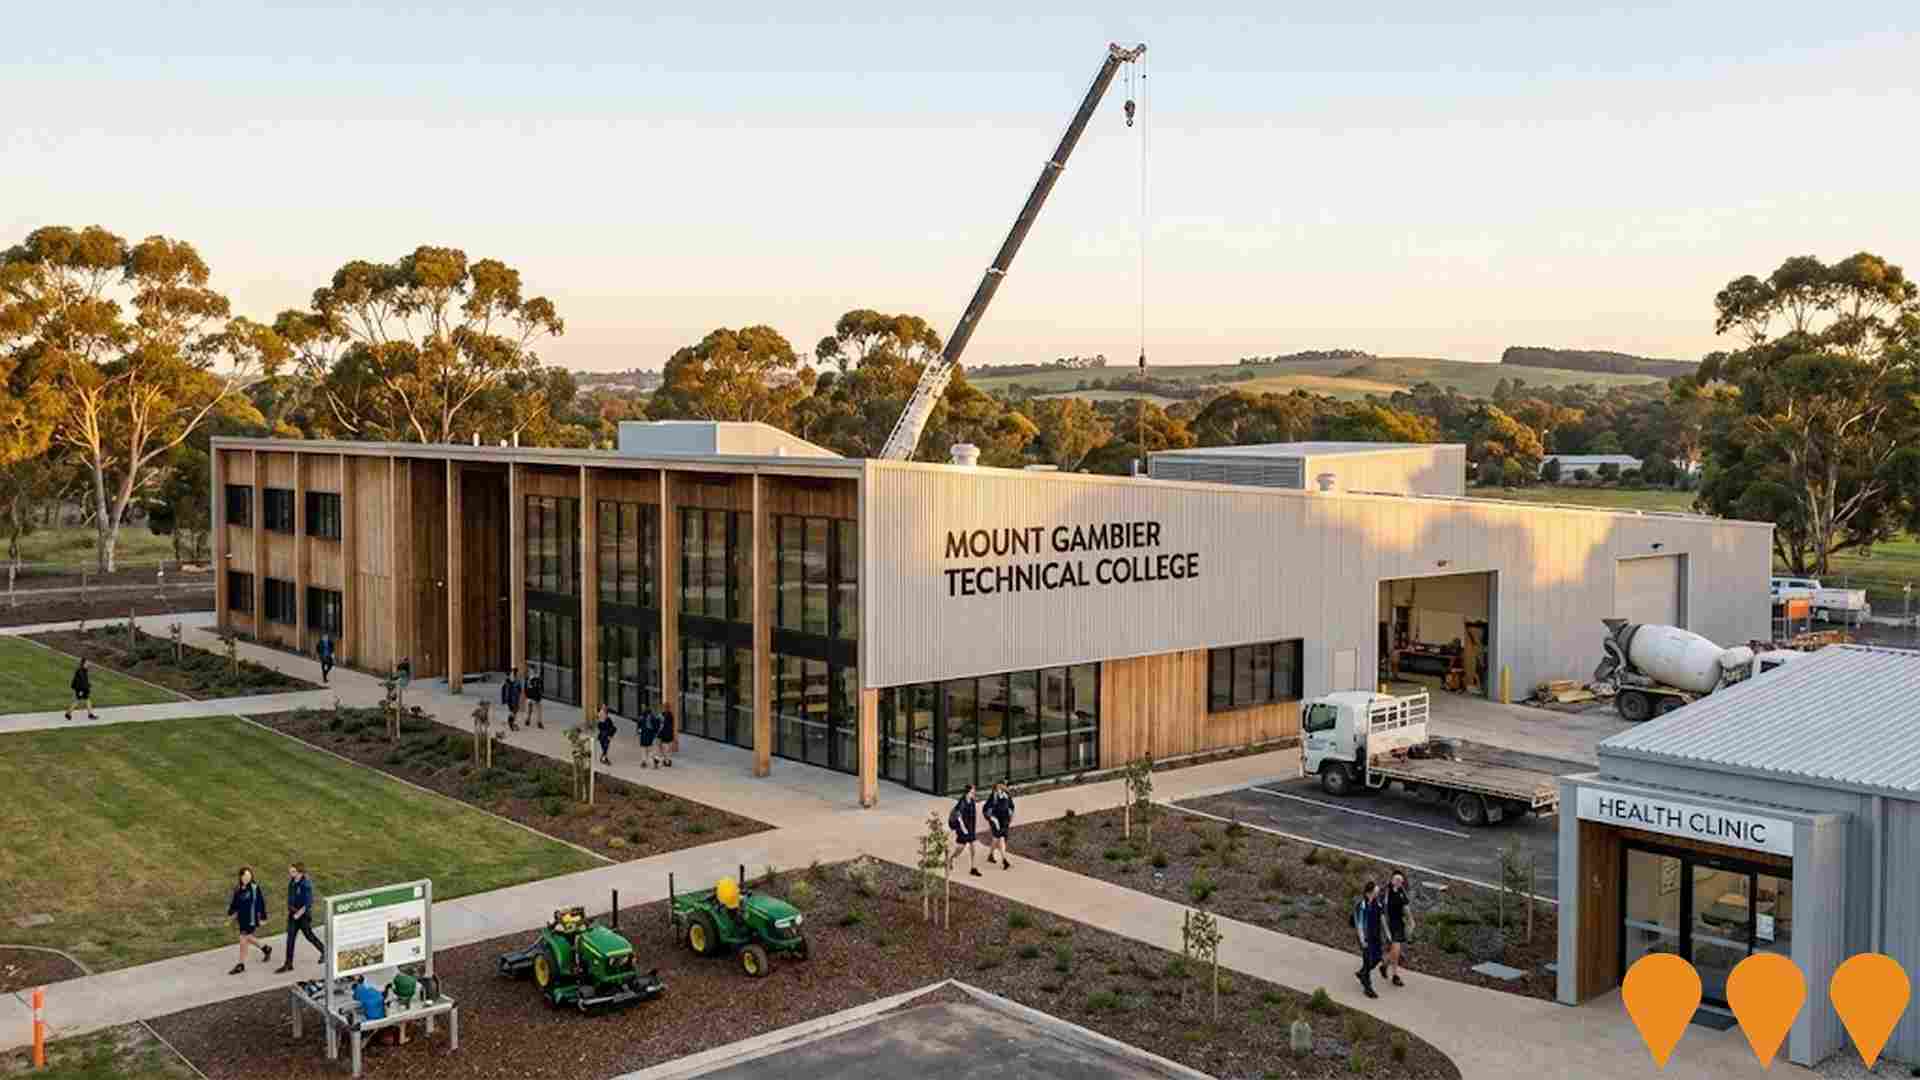
New $35 million purpose-built Technical College with short-stay accommodation for 40 students, featuring integrated industry-specific workshops for agri-tech, health, early childhood education and multi-trades. Part of $59 million Research, Education and Training Precinct.
Forestry Centre of Excellence
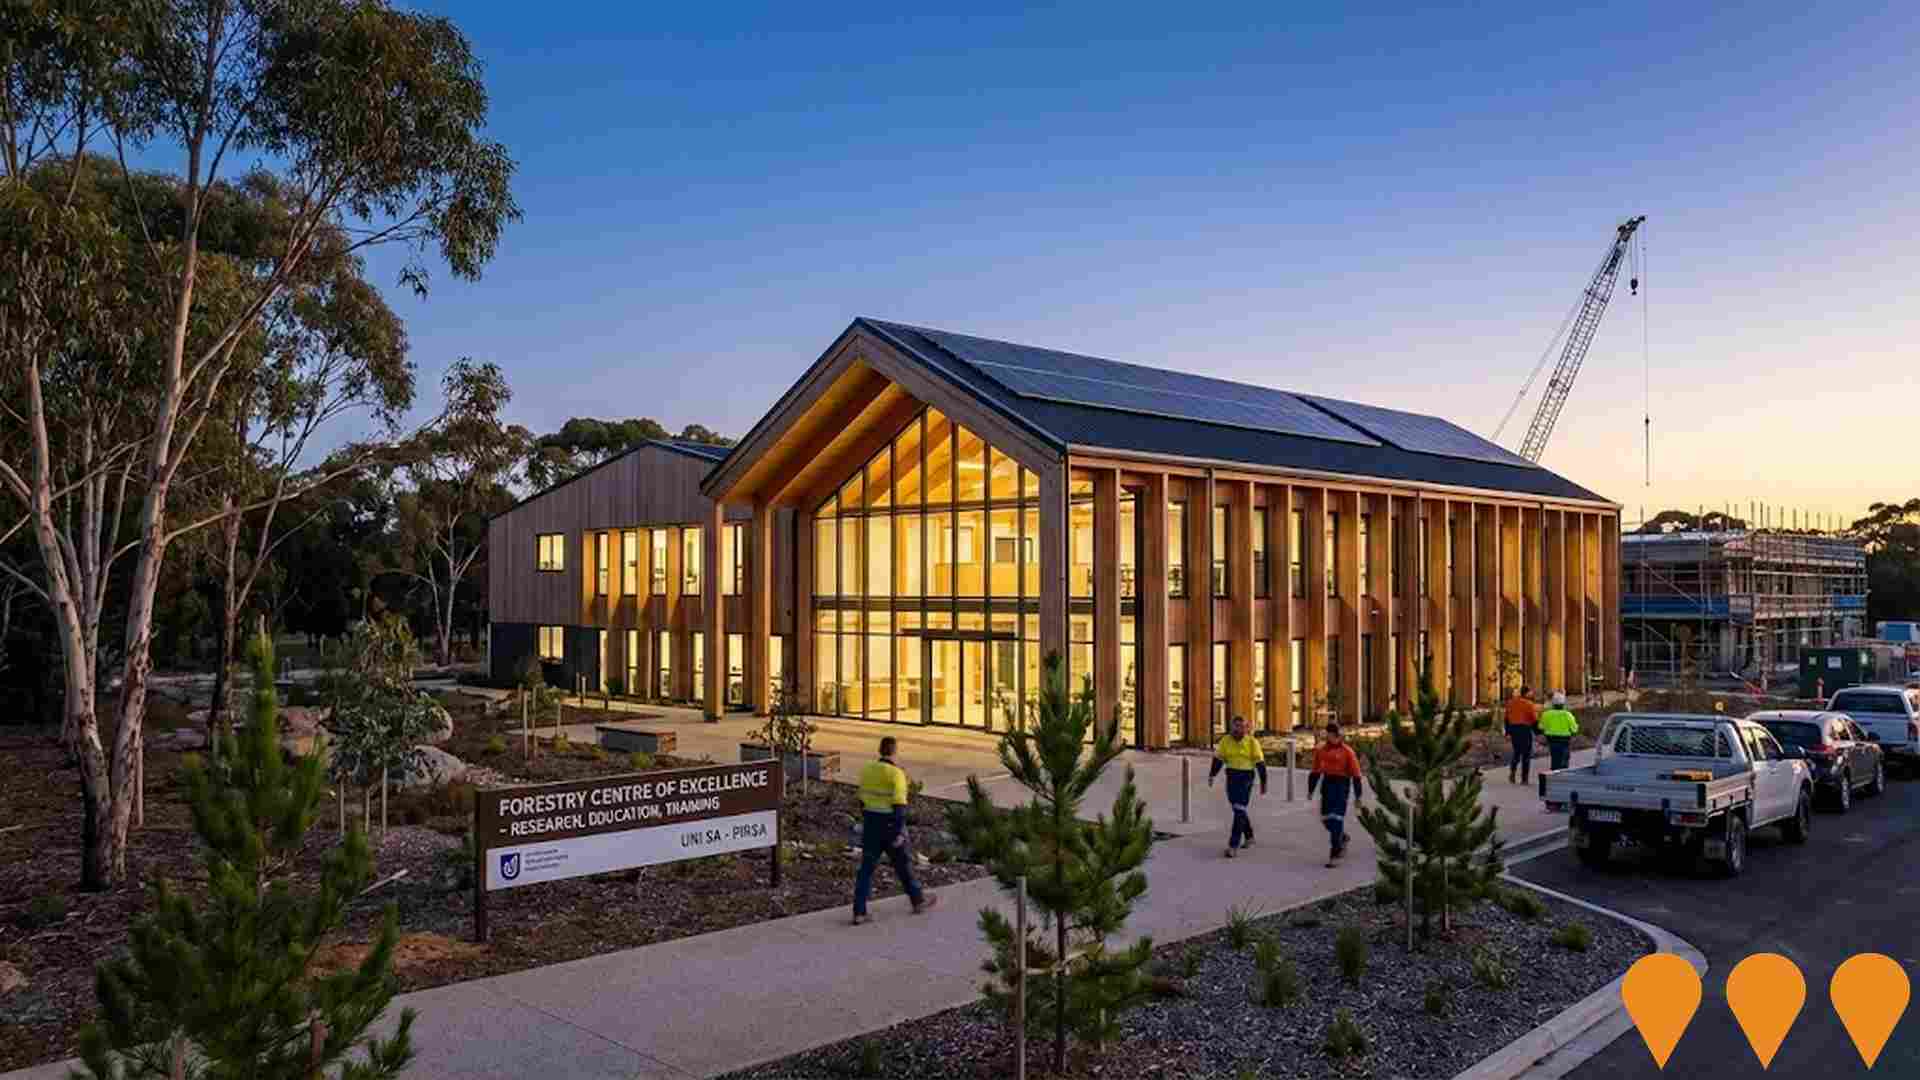
Construction of a $16 million world-class forestry research facility at the Mount Gambier Research, Education and Training Precinct. The Centre will focus on sustainable plantation management, fire detection, and timber processing innovation. It is a collaborative project between the State Government, UniSA, and the forestry industry, co-located with the new Mount Gambier Technical College.
Mount Gambier Marketplace Large Format Retail Expansion
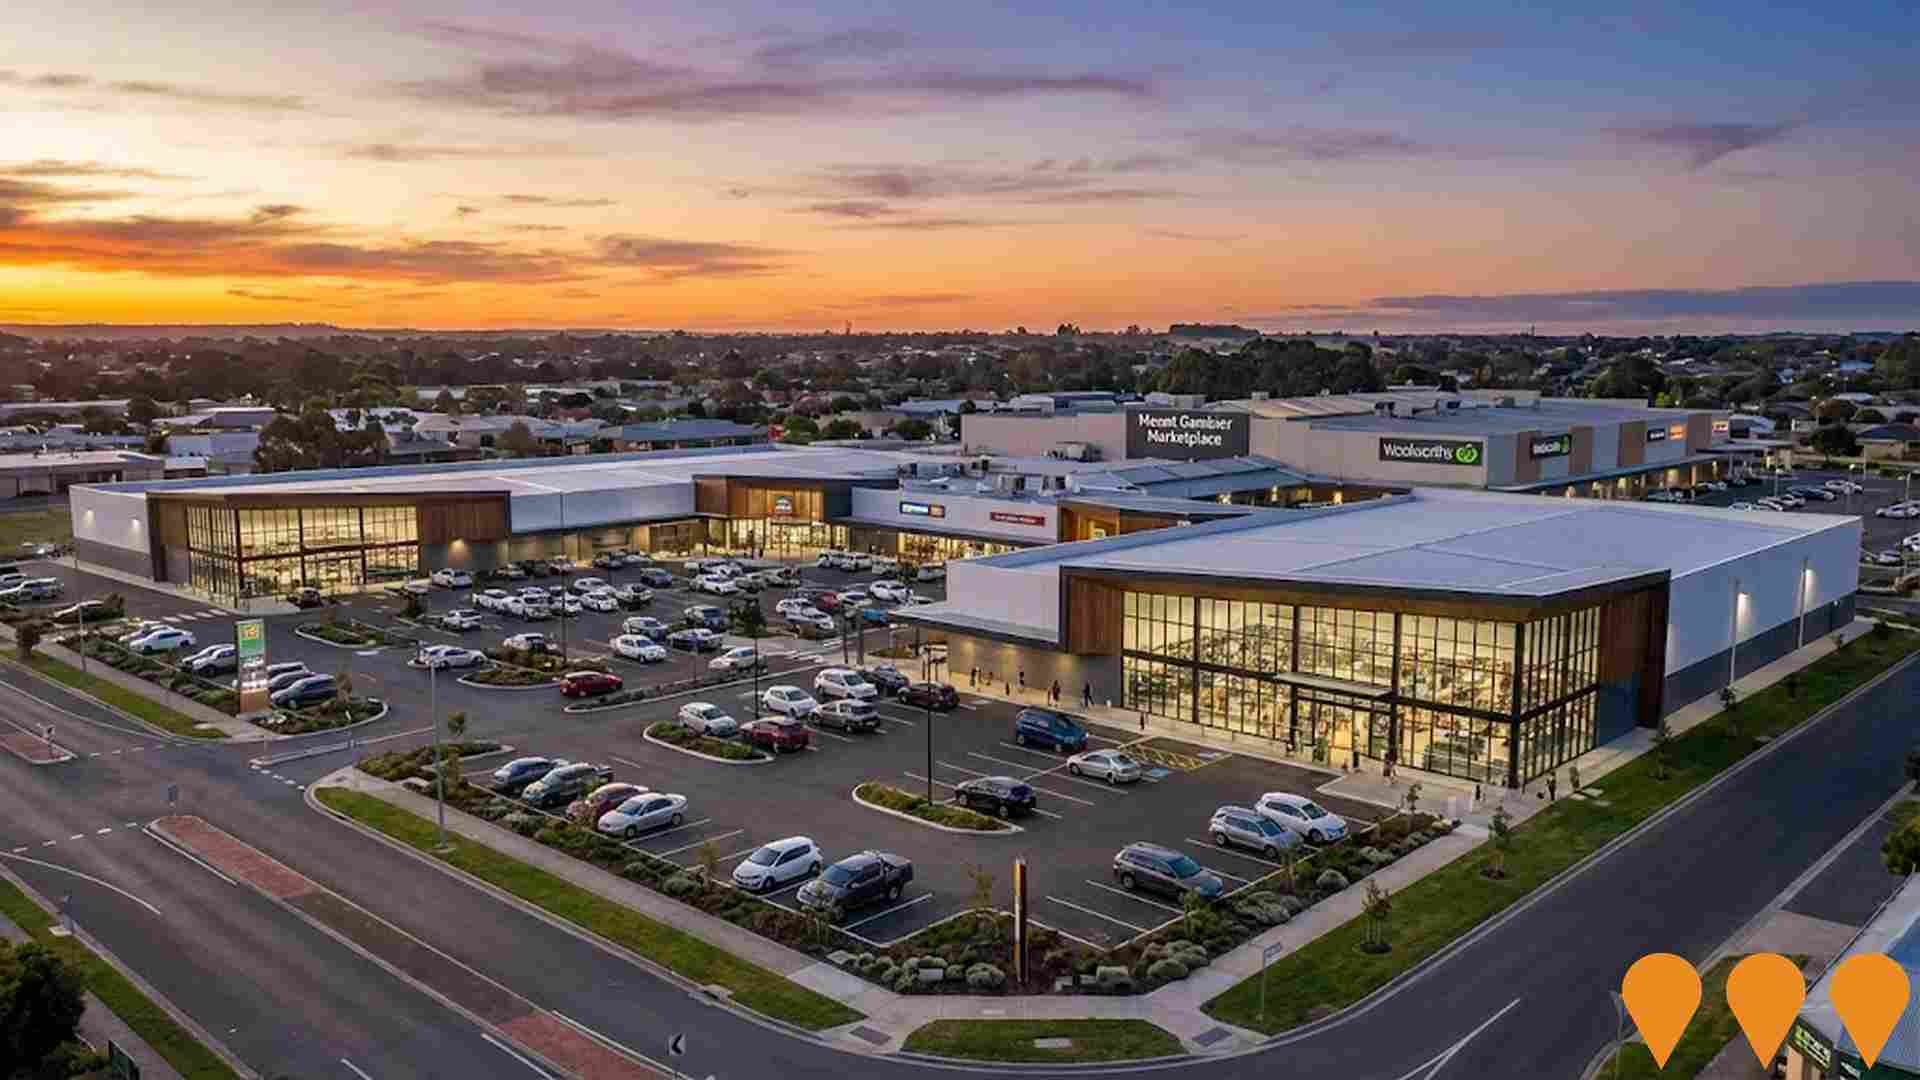
Axiom Properties has acquired 6.12 hectares of vacant land adjacent to Mount Gambier Marketplace for $9.2 million to develop up to 17,000 square metres of Large Format Retail space. The project includes two separate sites that will create the dominant retail offering in the catchment, with tenancies ranging from 596 sqm to 2,678 sqm. Development is conditional on securing approvals and sufficient leasing pre-commitments by late 2025.
Blue Lake Sports Park Master Plan Implementation
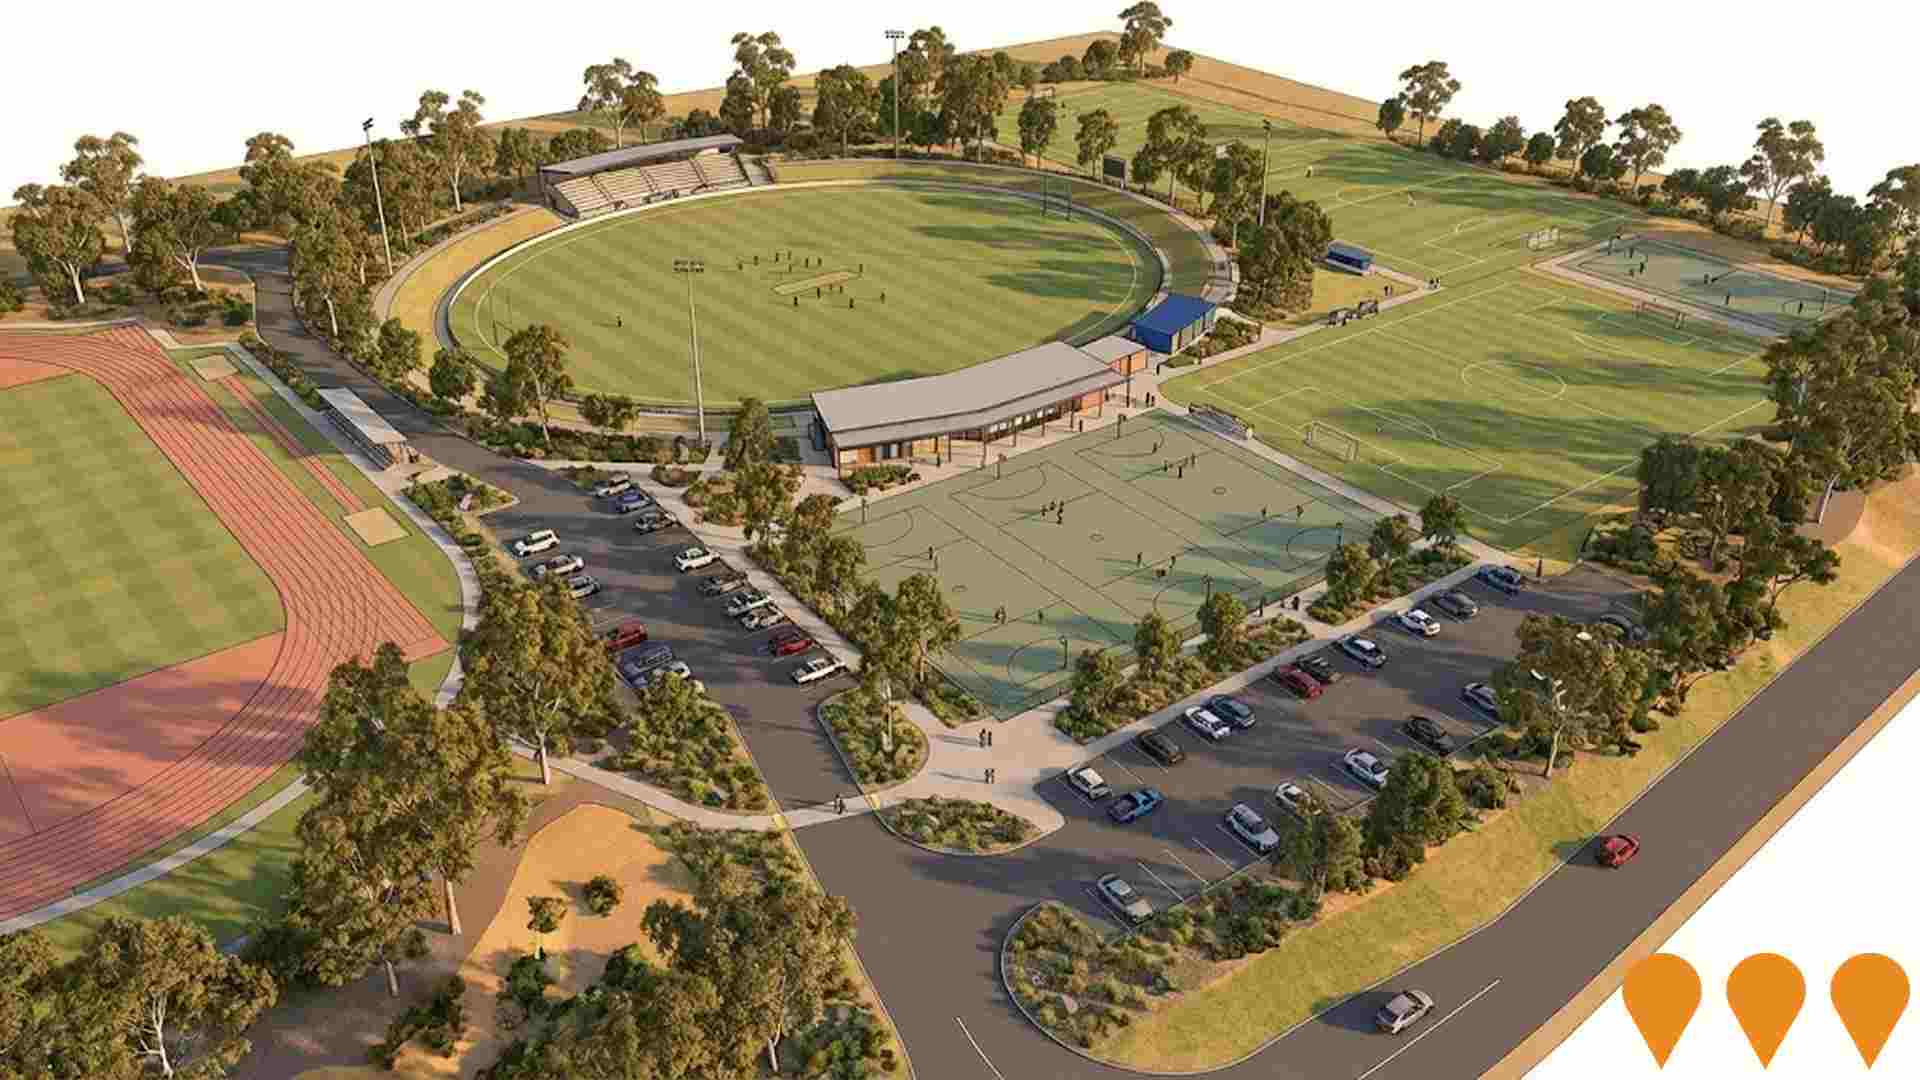
Development of regional sports complex featuring multi-use oval, athletics track, netball courts, pavilion facilities, and spectator amenities. Designed to host regional and state-level sporting events and community programs.
Limestone Estate Residential Development
One of the largest residential land division projects across Limestone Coast region, delivering 350+ residential allotments along with a commercial complex. Located on the western fringe of Mount Gambier, less than 5 minutes drive from CBD. Developed by Capital Investments & Developments (Melbourne).

Employment
Employment conditions in Mount Gambier - East remain below the national average according to AreaSearch analysis
Mount Gambier East has a balanced workforce with white and blue collar jobs, prominent essential services sectors. Its unemployment rate is 3.9%, lower than Rest of SA's 5.3%.
Employment stability is maintained over the past year. As of September 2025, 8,046 residents are employed, with an unemployment rate of 1.4% below Rest of SA's. Workforce participation is high at 60.6%, compared to Rest of SA's 54.1%. Key industries include health care & social assistance, retail trade, and manufacturing.
Retail trade has notable concentration, employing 1.3 times the regional average. Agriculture, forestry & fishing employs only 7.5% of local workers, below Rest of SA's 14.5%. Limited local employment opportunities are indicated by Census working population vs resident population comparison. Over a 12-month period ending September 2025, employment increased by 0.1%, labour force by 1.6%, causing unemployment rate to rise by 1.4 percentage points. Rest of SA had employment growth of 0.3% and labour force growth of 2.3%, with a 1.9 percentage point rise in unemployment rate. Jobs and Skills Australia's national employment forecasts for May-25 project overall employment growth of 6.6% over five years and 13.7% over ten years. Applying these projections to Mount Gambier East's employment mix suggests local employment should increase by 5.8% over five years and 12.6% over ten years, assuming constant population projections for illustrative purposes.
Frequently Asked Questions - Employment
Income
Income levels sit below national averages according to AreaSearch assessment
Mount Gambier - East SA2 had a median taxpayer income of $48,956 and an average of $58,375 in the financial year 2022, according to postcode level ATO data aggregated by AreaSearch. This is lower than national averages, with Rest of SA's median income being $46,889 and average income being $56,582. By September 2025, estimated incomes would be approximately $55,237 (median) and $65,865 (average), based on Wage Price Index growth of 12.83% since financial year 2022. Census data indicates that household, family, and personal incomes in Mount Gambier - East rank modestly, between the 23rd and 35th percentiles. The $1,500 - 2,999 earnings band captures 31.7% of the community (4,944 individuals), consistent with broader trends across the region showing 27.5% in the same category. While housing costs are modest, with 87.5% of income retained, total disposable income ranks at just the 28th percentile nationally.
Frequently Asked Questions - Income
Housing
Mount Gambier - East is characterized by a predominantly suburban housing profile, with a higher proportion of rental properties than the broader region
Mount Gambier - East's dwelling structure, as per the latest Census, consisted of 83.7% houses and 16.4% other dwellings (semi-detached, apartments, 'other' dwellings). This compared to Non-Metro SA's 87.6% houses and 12.5% other dwellings. Home ownership in Mount Gambier - East was at 32.9%, with mortgaged dwellings at 37.8% and rented ones at 29.3%. The median monthly mortgage repayment was $1,200, higher than Non-Metro SA's average of $1,083. The median weekly rent figure was recorded at $220, compared to Non-Metro SA's $205. Nationally, Mount Gambier - East's mortgage repayments were significantly lower than the Australian average of $1,863, while rents were substantially below the national figure of $375.
Frequently Asked Questions - Housing
Household Composition
Mount Gambier - East has a typical household mix, with a higher-than-average median household size
Family households constitute 67.9% of all households, including 25.5% couples with children, 28.9% couples without children, and 12.5% single parent families. Non-family households account for the remaining 32.1%, with lone person households at 29.6% and group households comprising 2.5%. The median household size is 2.4 people, larger than the Rest of SA average of 2.3.
Frequently Asked Questions - Households
Local Schools & Education
Mount Gambier - East faces educational challenges, with performance metrics placing it in the bottom quartile of areas assessed nationally
The area's university qualification rate is 14.6%, significantly lower than Australia's average of 30.4%. This presents both a challenge and an opportunity for targeted educational initiatives. Bachelor degrees are the most common, at 10.6%, followed by postgraduate qualifications (2.0%) and graduate diplomas (2.0%). Vocational credentials are prevalent, with 38.3% of residents aged 15+ holding them.
Advanced diplomas account for 8.2%, while certificates make up 30.1%. Educational participation is high, with 28.3% of residents currently enrolled in formal education. This includes 11.7% in primary education, 8.3% in secondary education, and 2.3% pursuing tertiary education.
Frequently Asked Questions - Education
Schools Detail
Nearby Services & Amenities
Transport
Transport servicing is very low compared to other areas nationally based on assessment of service frequency, route connectivity and accessibility
Mount Gambier - East has one operational public transport hub serving a mix of bus routes. Six distinct routes service this hub, offering 41 weekly passenger trips in total. Transport accessibility is limited, with residents located an average of 1602 meters from the nearest stop.
On average, services operate five times daily across all routes, resulting in approximately 41 weekly trips per individual stop.
Frequently Asked Questions - Transport
Transport Stops Detail
Health
Health performance in Mount Gambier - East is well below average with prevalence of common health conditions notable across both younger and older age cohorts
Mount Gambier - East faces significant health challenges, as indicated by health data. Common health conditions are prevalent across both younger and older age groups.
Private health cover is relatively low at approximately 49% of the total population (~7,626 people), compared to the national average of 55.3%. Mental health issues and asthma are the most common medical conditions in the area, affecting 9.0 and 8.9% of residents respectively. Approximately 63.7% of residents declare themselves completely clear of medical ailments, compared to 65.5% across Rest of SA. The area has 21.2% of residents aged 65 and over (3,306 people), which is lower than the 23.3% in Rest of SA. Health outcomes among seniors present some challenges, broadly aligning with the general population's health profile.
Frequently Asked Questions - Health
Cultural Diversity
Mount Gambier - East is considerably less culturally diverse than average when assessed alongside AreaSearch's national rankings for language and cultural background related metrics
Mount Gambier-East, found below average in cultural diversity, had 90.4% citizens, 88.7% born in Australia, and 93.8% speaking English only at home. Christianity was the main religion, comprising 41.5%. Judaism, at 0.1%, was overrepresented compared to Rest of SA's 0.0%.
Top ancestry groups were Australian (31.8%), English (31.1%), and Scottish (8.1%). Dutch (2.1%) was notably overrepresented versus regional 1.7%, German at 6.0% (versus 6.4%), and Polish at 0.7% (versus 0.4%).
Frequently Asked Questions - Diversity
Age
Mount Gambier - East's population is slightly older than the national pattern
Mount Gambier - East has a median age of 41 years, which is lower than Rest of SA's 47 but higher than Australia's national norm of 38. The 15-24 age group makes up 12.6% of the population in Mount Gambier - East, compared to the Rest of SA average, indicating over-representation. Conversely, the 65-74 year-olds are under-represented at 11.5%. Between 2021 and present, the 15-24 age group has increased from 11.5% to 12.6%, while the 5-14 cohort has decreased from 13.2% to 11.7%, and the 45-54 group has dropped from 13.2% to 12.2%. By 2041, demographic modeling projects significant growth in the 75-84 age cohort, expanding by 565 people (53%) from 1,069 to 1,635. Notably, the combined 65+ age groups will account for 87% of total population growth, reflecting the area's aging demographic profile. In contrast, population declines are projected for the 0-4 and 35-44 cohorts.
