Chart Color Schemes
This analysis uses ABS Statistical Areas Level 2 (SA2) boundaries, which can materially differ from Suburbs and Localities (SAL) even when sharing similar names.
SA2 boundaries are defined by the Australian Bureau of Statistics and are designed to represent communities for statistical reporting (e.g., census and ERP).
Suburbs and Localities (SAL) represent commonly-used suburb/locality names (postal-style areas) and may use different geographic boundaries. For comprehensive analysis, consider reviewing both boundary types if available.
est. as @ -- *
ABS ERP | -- people | --
2021 Census | -- people
Sales Activity
Curious about local property values? Filter the chart to assess the volume and appreciation (including resales) trends and regional comparisons, or scroll to the map below view this information at an individual property level.
Find a Recent Sale
Sales Detail
Population
An assessment of population growth drivers in Wattle Range reveals an overall ranking slightly below national averages considering recent, and medium term trends
Wattle Range's population is 3,687 as of November 2025. This shows an increase of 217 people since the 2021 Census, which reported a population of 3,470. The change was inferred from ABS's estimated resident population of 3,644 in June 2024 and additional validated new addresses since the Census date. This results in a density ratio of 1.6 persons per square kilometer. Wattle Range's growth of 6.3% since the 2021 census exceeded the SA3 area's growth of 5.4%. Population growth was primarily driven by interstate migration, contributing approximately 46.2% of overall population gains.
AreaSearch uses ABS/Geoscience Australia projections for each SA2 area, released in 2024 with a base year of 2022. For areas not covered and years post-2032, the SA State Government's Regional/LGA projections by age category are adopted, based on 2021 data and adjusted using weighted aggregation from LGA to SA2 levels. Considering projected demographic shifts, lower quartile growth of non-metropolitan areas nationally is anticipated. The area is expected to grow by 101 persons to 2041, reflecting a gain of 1.4% in total over the 17 years, based on the latest annual ERP population numbers.
Frequently Asked Questions - Population
Development
AreaSearch analysis of residential development drivers sees Wattle Range recording a relatively average level of approval activity when compared to local markets analysed countrywide
Wattle Range has seen approximately 16 new homes approved annually. Over the past five financial years, from FY-21 to FY-25, 81 homes were approved, with a further 6 approved in FY-26 so far. On average, 2.5 people moved to the area per new home constructed over these years, indicating robust demand that supports property values.
New homes are being built at an average expected construction cost of $271,000. This financial year, $2.3 million in commercial approvals have been registered, reflecting the area's residential nature. Compared to Rest of SA, Wattle Range has similar development levels per person, contributing to market stability aligned with regional trends.
All new constructions have been detached dwellings, maintaining the area's traditional low-density character focused on family homes. The location currently has approximately 295 people per dwelling approval, suggesting room for growth. According to AreaSearch's latest quarterly estimate, Wattle Range is forecasted to gain 50 residents by 2041. With current construction levels, housing supply should meet demand adequately, creating favorable conditions for buyers while potentially facilitating growth that exceeds current forecasts.
Frequently Asked Questions - Development
Infrastructure
Wattle Range has limited levels of nearby infrastructure activity, ranking in the 0thth percentile nationally
Changes in local infrastructure significantly affect an area's performance. AreaSearch has identified five projects likely to impact the region. Notable projects include Stringy Bark Drive Residential Subdivision, Wattle Range Council General Code Amendment, Limestone Coast Hydrogen Hub (LCH2), and Lower Limestone Coast Water Allocation Plan. The following details those most relevant:.
Professional plan users can use the search below to filter and access additional projects.
INFRASTRUCTURE SEARCH
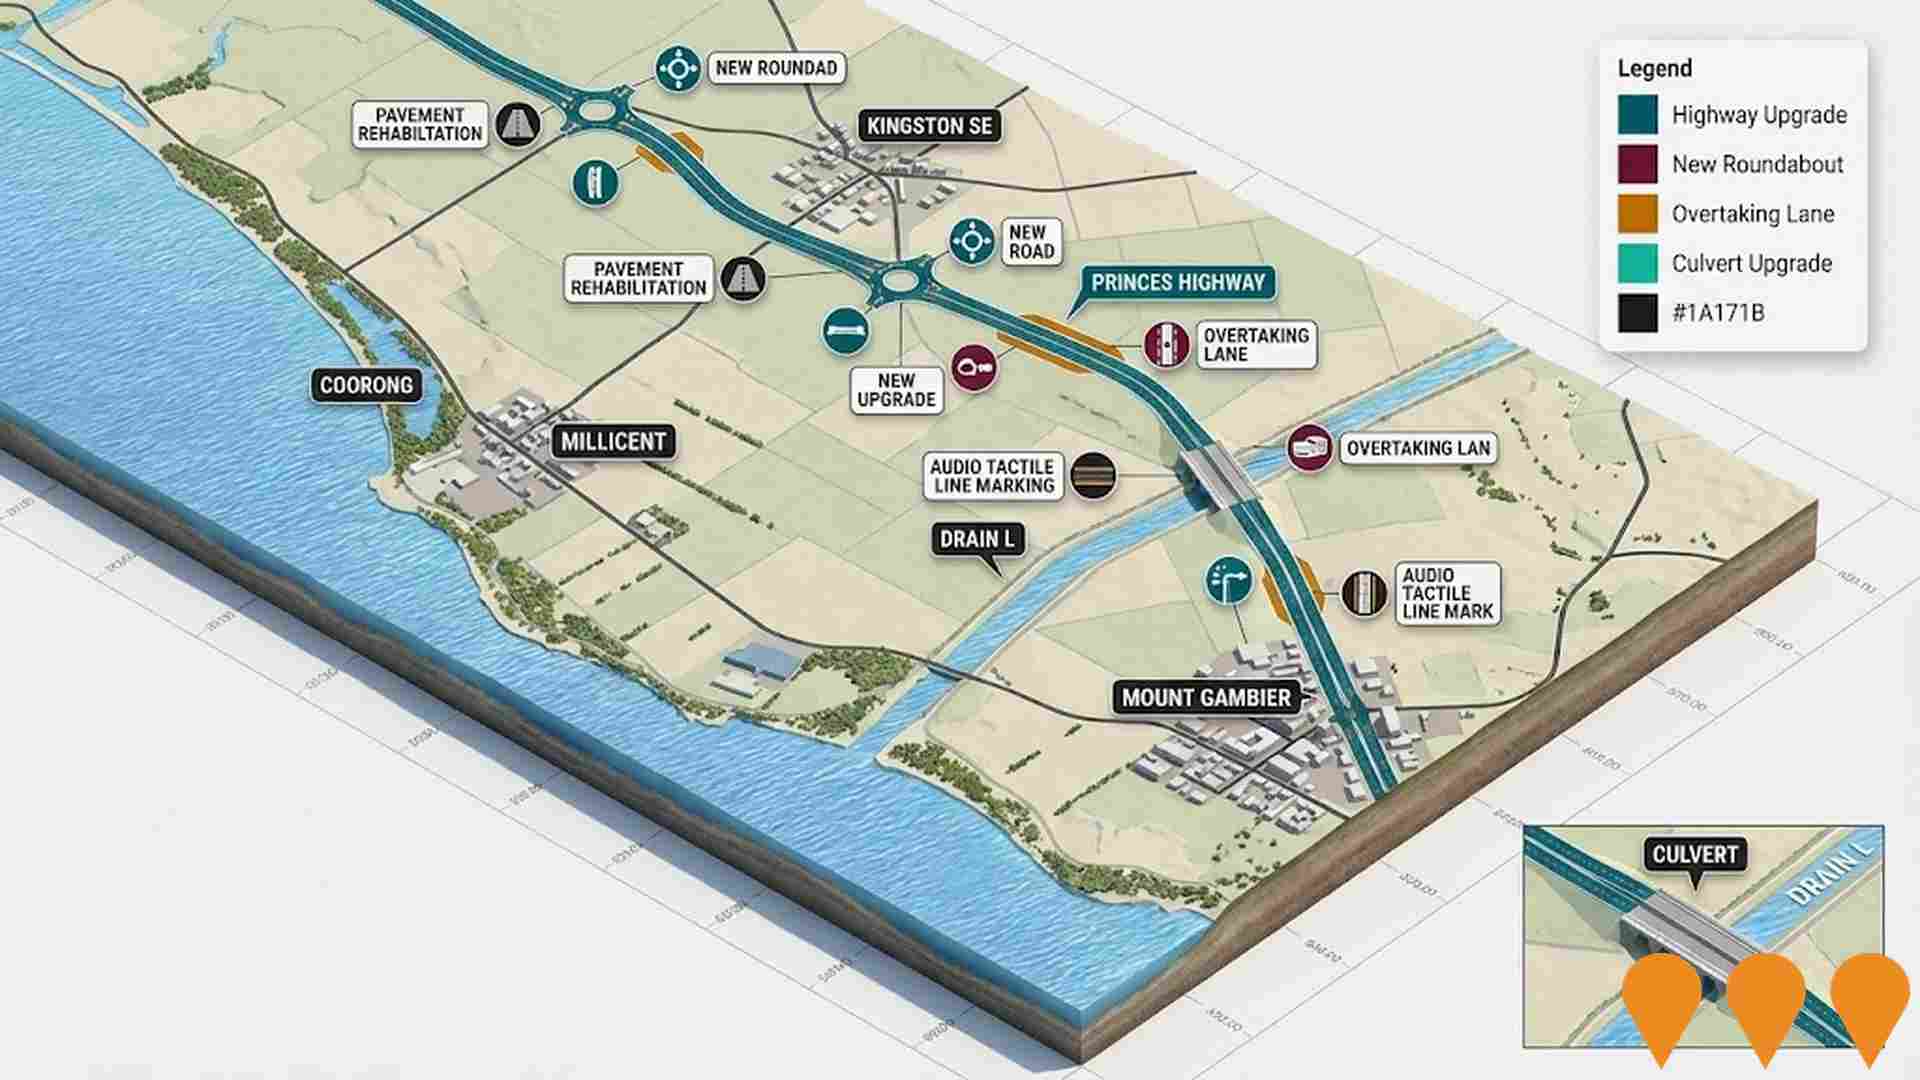
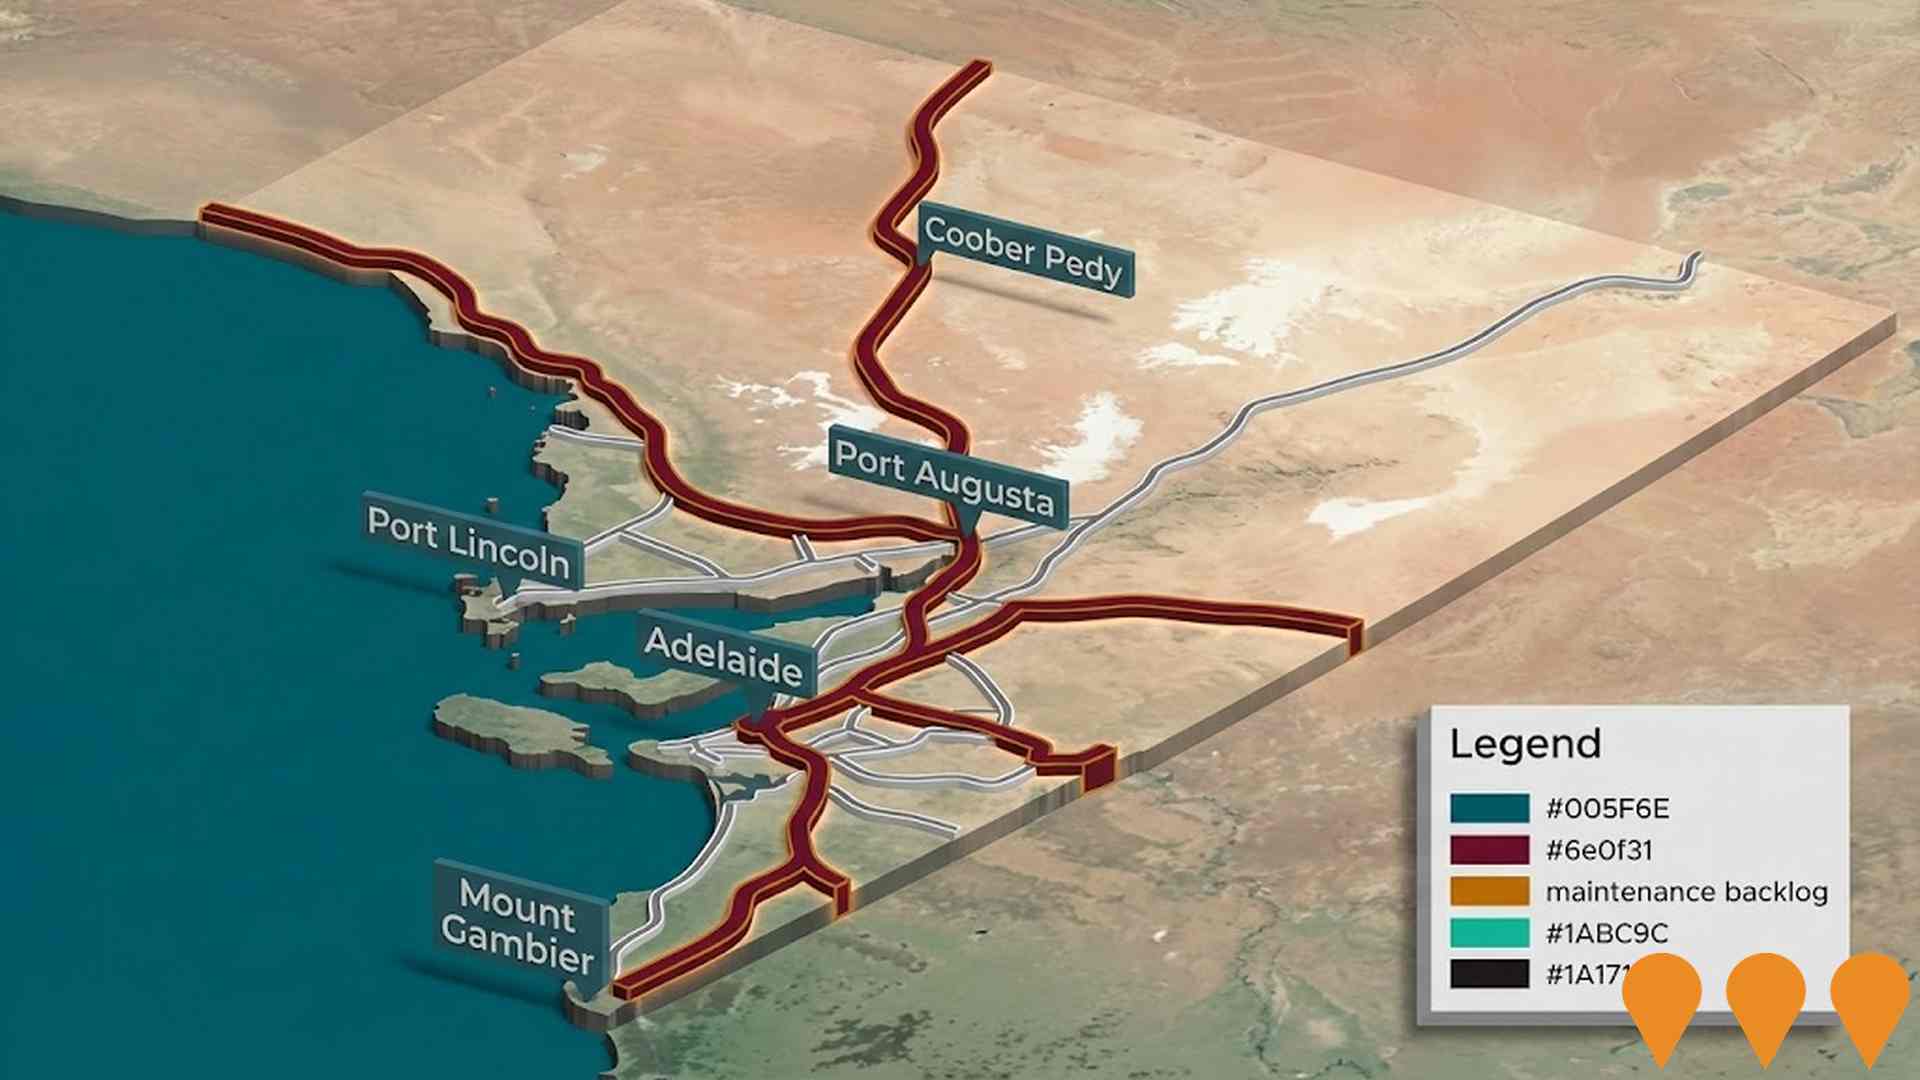
 Denotes AI-based impression for illustrative purposes only, not to be taken as definitive under any circumstances. Please follow links and conduct other investigations from the project's source for actual imagery. Developers and project owners wishing us to use original imagery please Contact Us and we will do so.
Frequently Asked Questions - Infrastructure
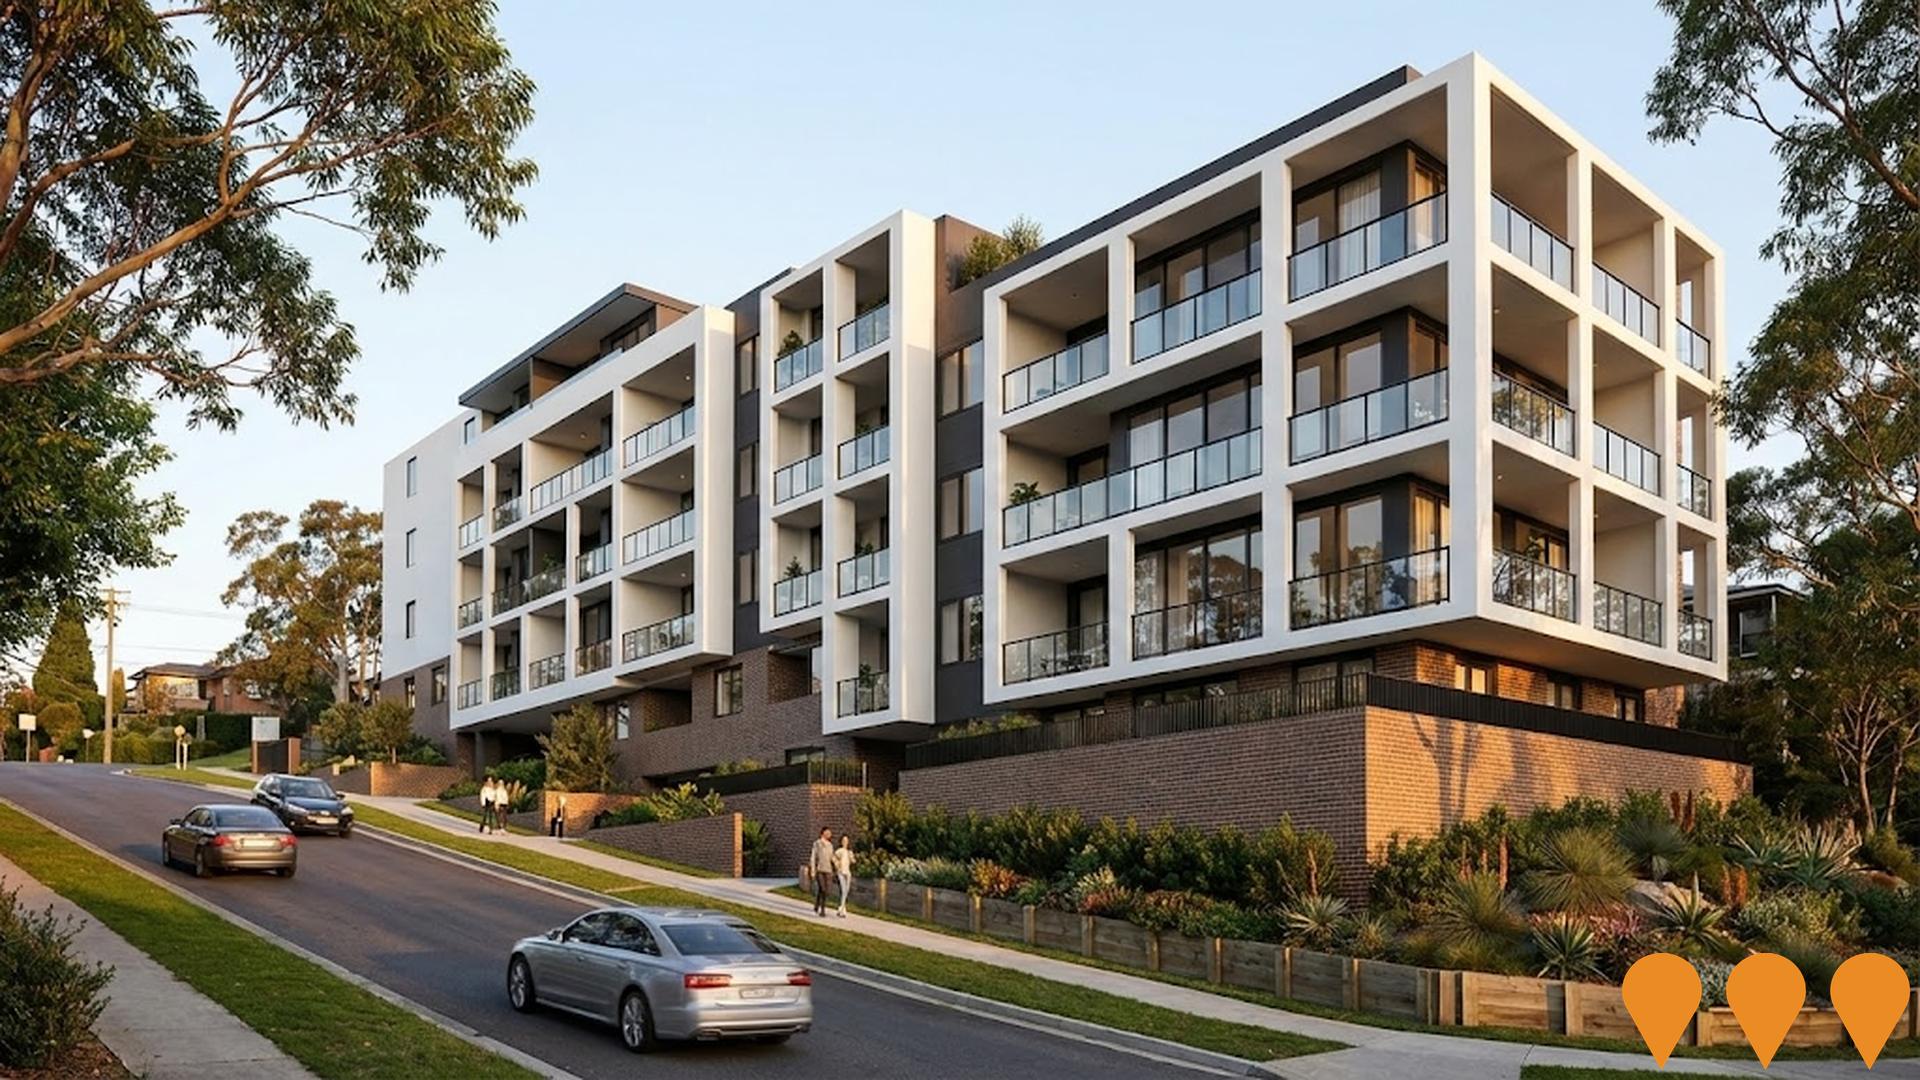
Low and Mid-Rise Housing Policy
State-wide NSW planning reforms via amendments to the State Environmental Planning Policy to enable more diverse low and mid-rise housing (dual occupancies, terraces, townhouses, manor houses and residential flat buildings up to 6 storeys) in well-located areas within 800 m of selected train, metro and light-rail stations and town centres. Stage 1 (dual occupancies in R2 zones statewide) commenced 1 July 2024. Stage 2 (mid-rise apartments, terraces and dual occupancies near stations) commenced 28 February 2025. Expected to facilitate up to 112,000 additional homes over the next five years.
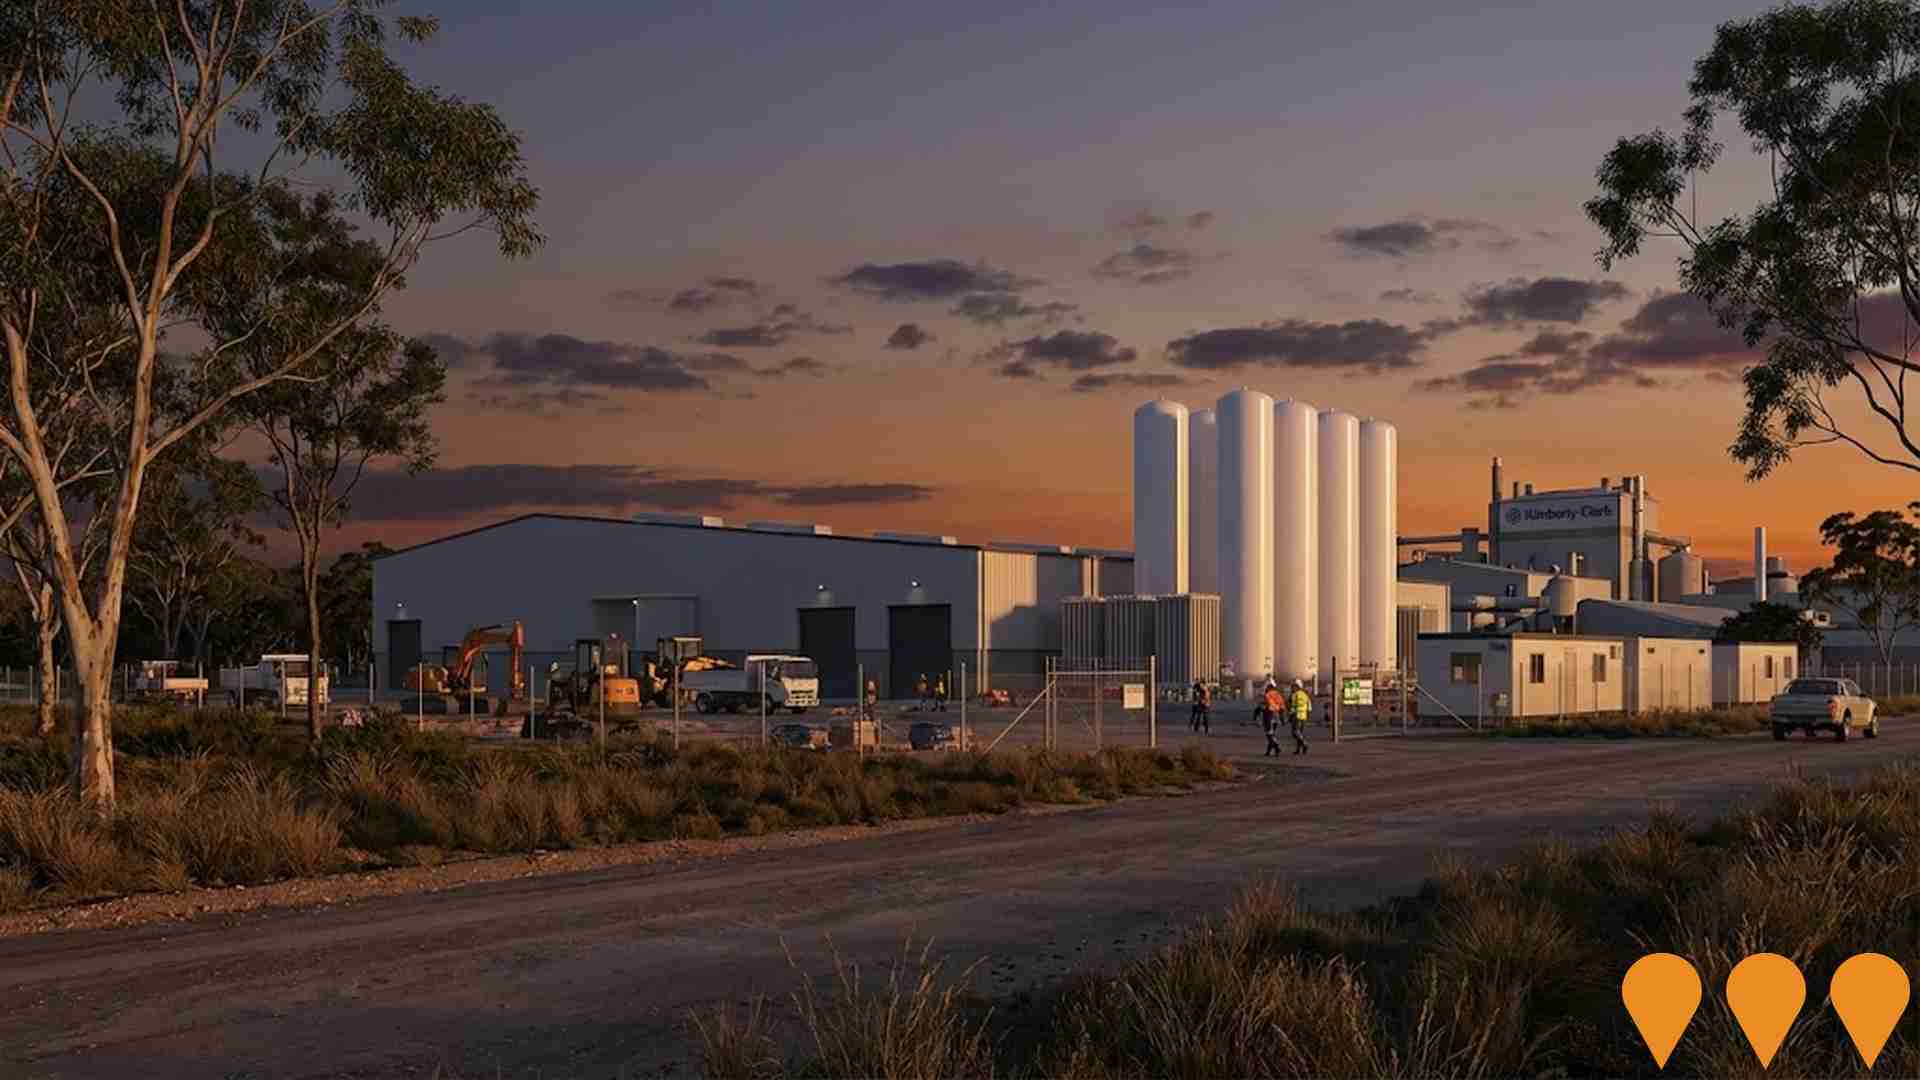
Limestone Coast Hydrogen Hub (LCH2)
A green hydrogen production facility co-located at the Kimberly-Clark Millicent Mill to decarbonize industrial operations. The project will be executed in two stages: Stage 1 (3.65 tonnes/day) involves blending 20% green hydrogen with natural gas by 2028, while Stage 2 (4.5 tonnes/day) targets a complete transition to 100% green hydrogen by 2029. The feasibility study was completed in August 2024 by WGA and Linde Engineering. Operating rights were acquired by energy south Pty Limited from entX Limited in April 2025, with the same management team continuing project development.
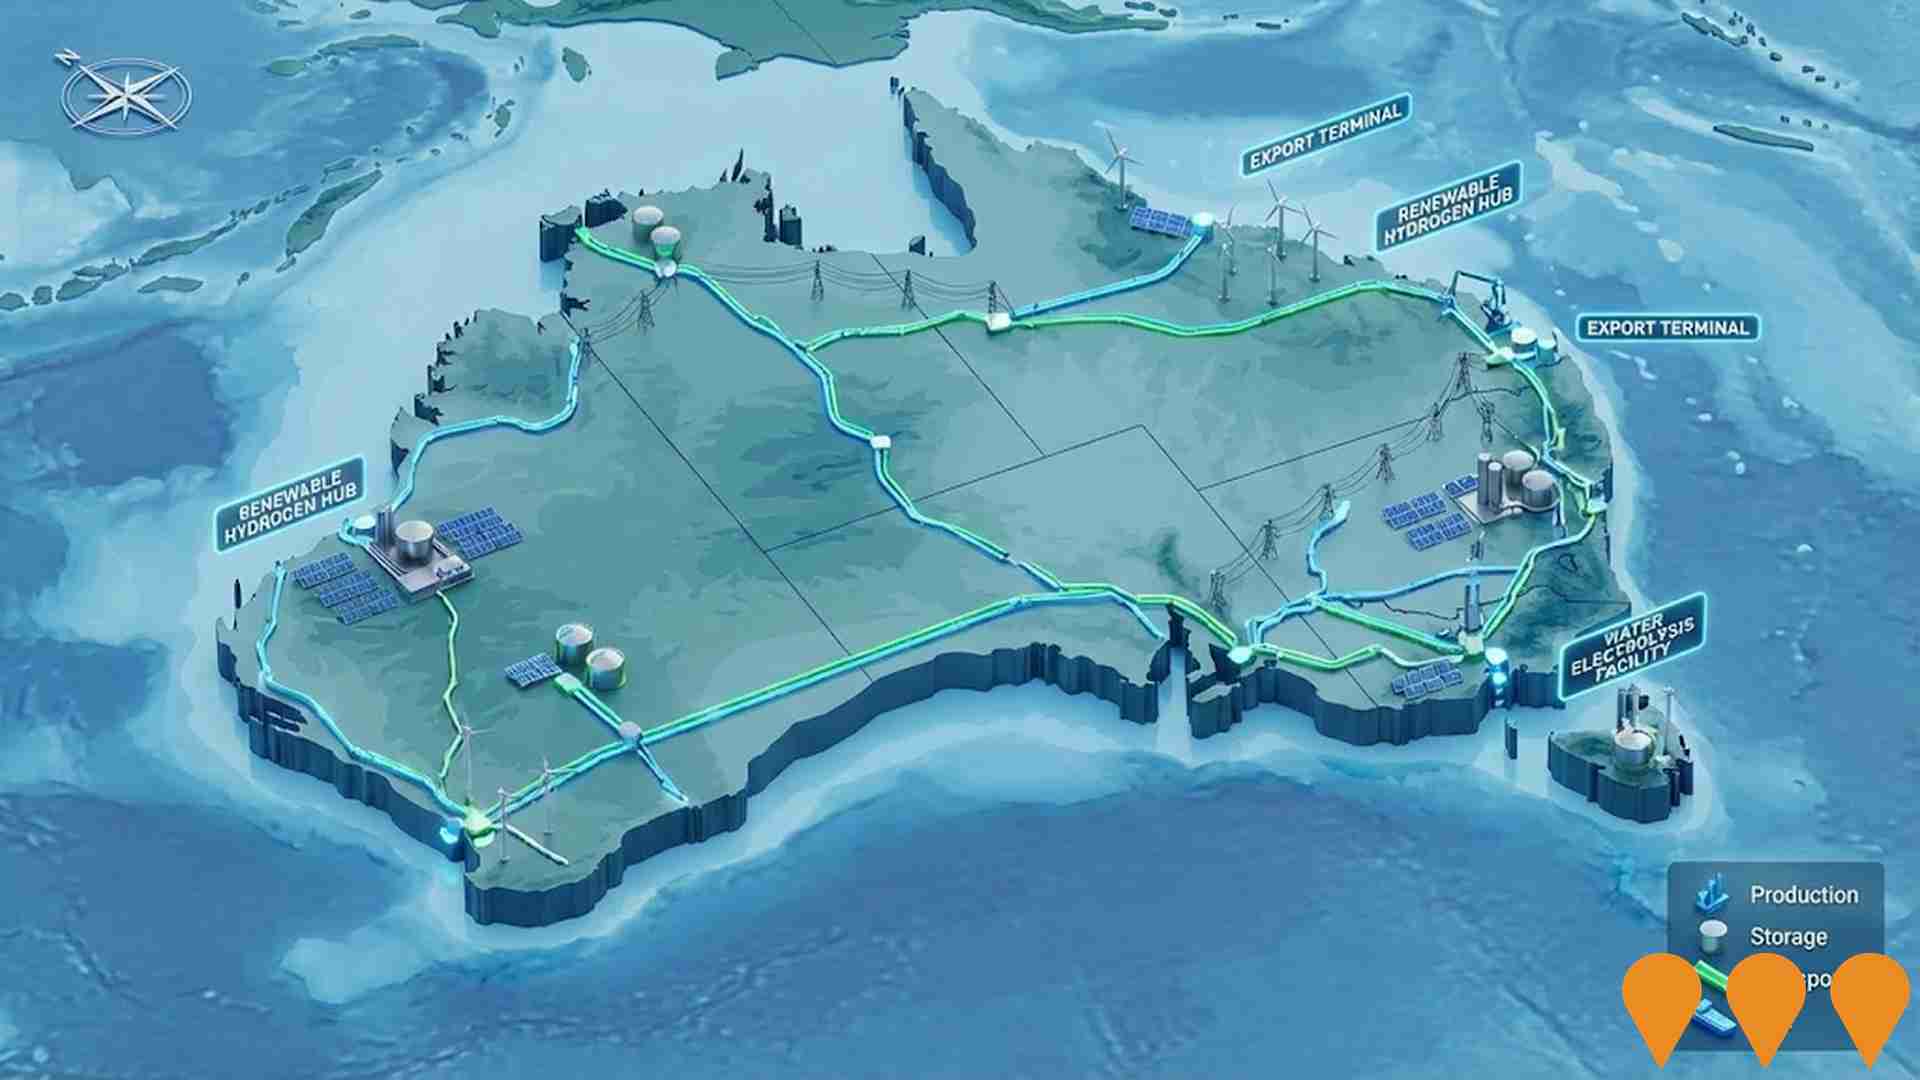
Enabling Infrastructure for Hydrogen Production
Australia has completed the National Hydrogen Infrastructure Assessment (NHIA) to 2050 and refreshed its National Hydrogen Strategy (2024). The programmatic focus has shifted to planning and enabling infrastructure through measures such as ARENA's Hydrogen Headstart and the Hydrogen Production Tax Incentive (from April 2025). Round 2 of Hydrogen Headstart consultation occurred in 2025. Collectively these actions aim to coordinate investment in transport, storage, water and electricity inputs linked to Renewable Energy Zones and priority hubs, supporting large-scale renewable hydrogen production and future export supply chains.
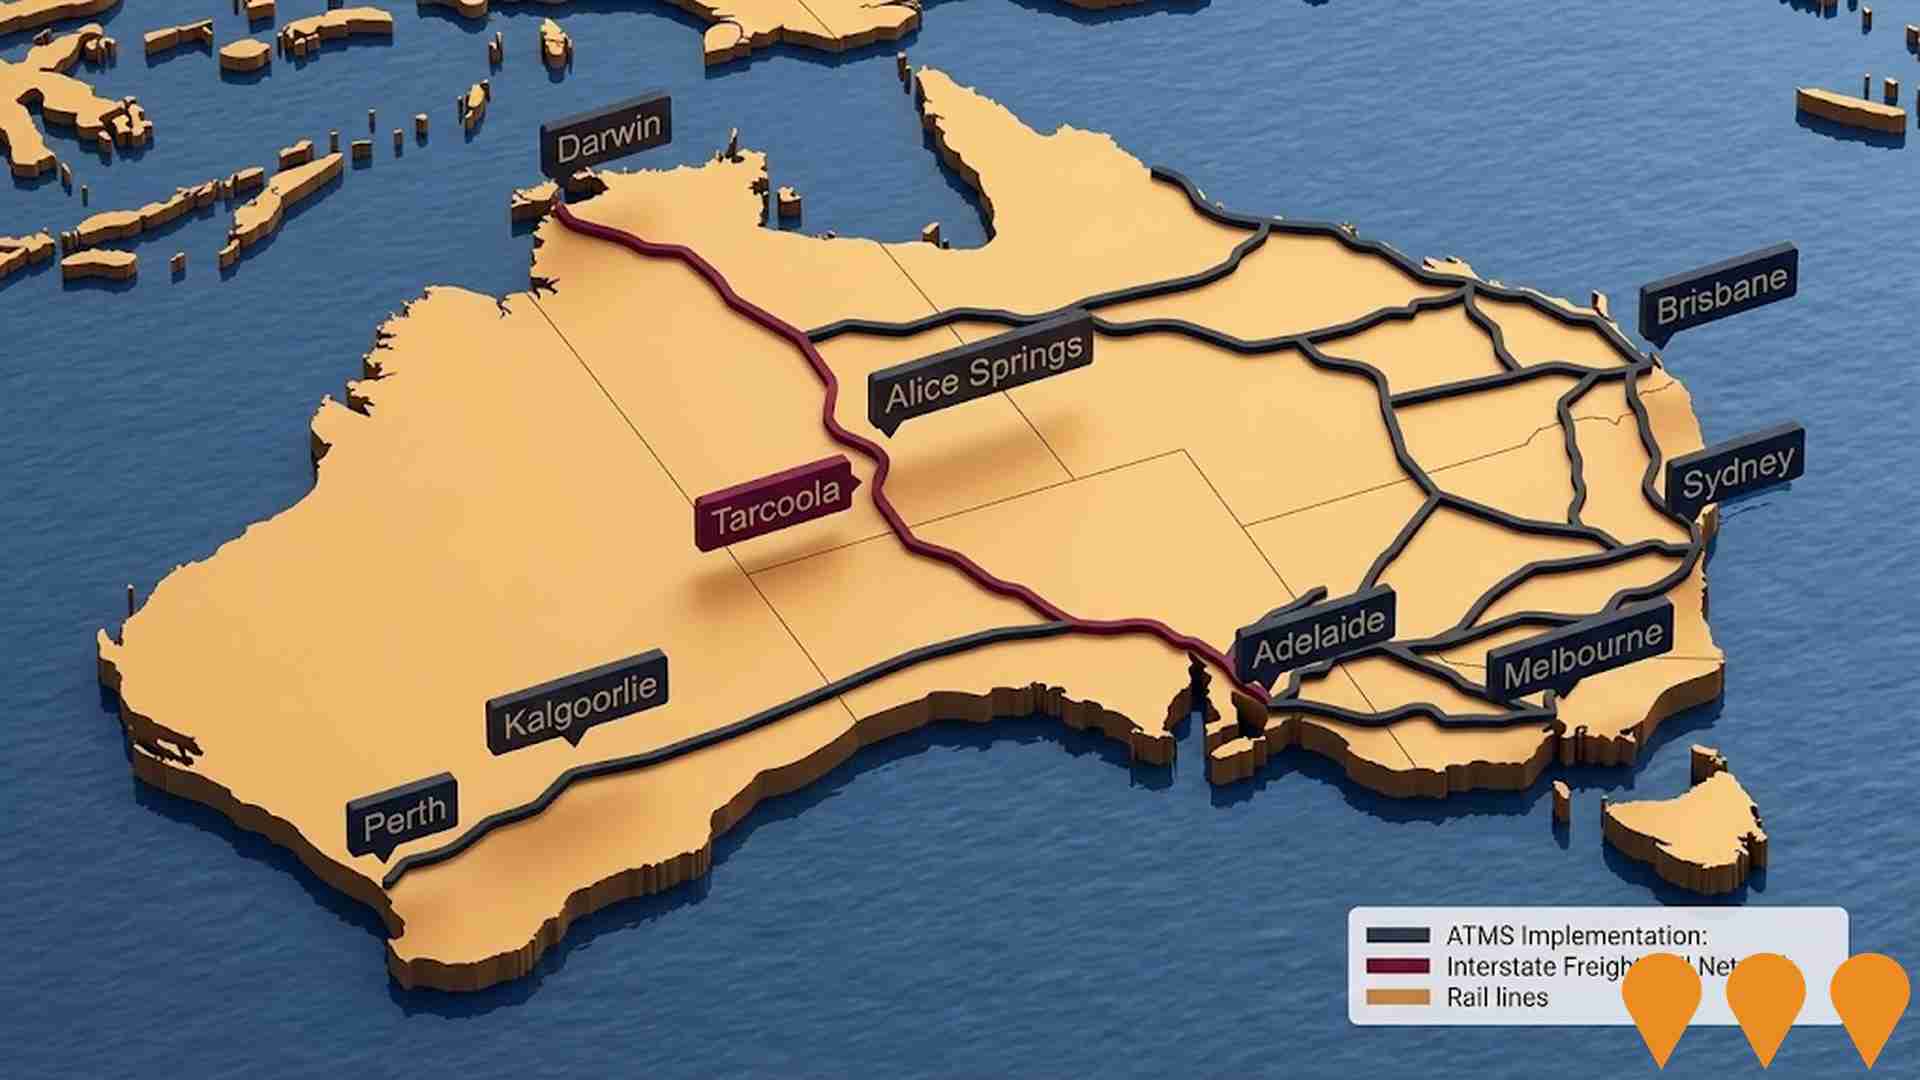
Bulk Water Supply Security
Nationwide program led by the National Water Grid Authority to improve bulk water security and reliability for non-potable and productive uses. Activities include strategic planning, science and business cases, and funding of state and territory projects such as storages, pipelines, dam upgrades, recycled water and efficiency upgrades to build drought resilience and support regional communities, industry and the environment.

Wattle Range Council General Code Amendment
Comprehensive rezoning initiative affecting 9 sites across Wattle Range Council area (originally 10, with Site 8 Beachport removed following community feedback). The amendment includes rezoning of the Railway Precinct, Southern Ports Highway, and Employment Zones on Mount Gambier Road in Millicent, plus sites in Penola, Beachport, and Glencoe. This code amendment aligns with the Council's 25-year Strategic Land Use Plan adopted in August 2022, designed to facilitate sustainable residential, employment, and neighbourhood development while protecting agricultural land. Public consultation opened on August 29, 2025, with community drop-in sessions held throughout September 2025.

Stringy Bark Drive Residential Subdivision
A 32-block rural living residential subdivision located west of Millicent racecourse between Stringybark Drive and Kent Drive. Stage 1 comprises 8 allotments of approximately 2.15 acres each, set for release in Spring 2025. Each lot features bitumen road frontage, full fencing with post and wire including farm gate, and power connection to the boundary. The development offers flexible settlement terms with no building encumbrance timelines, making it ideal for those seeking rural lifestyle living within minutes of Millicent township amenities.

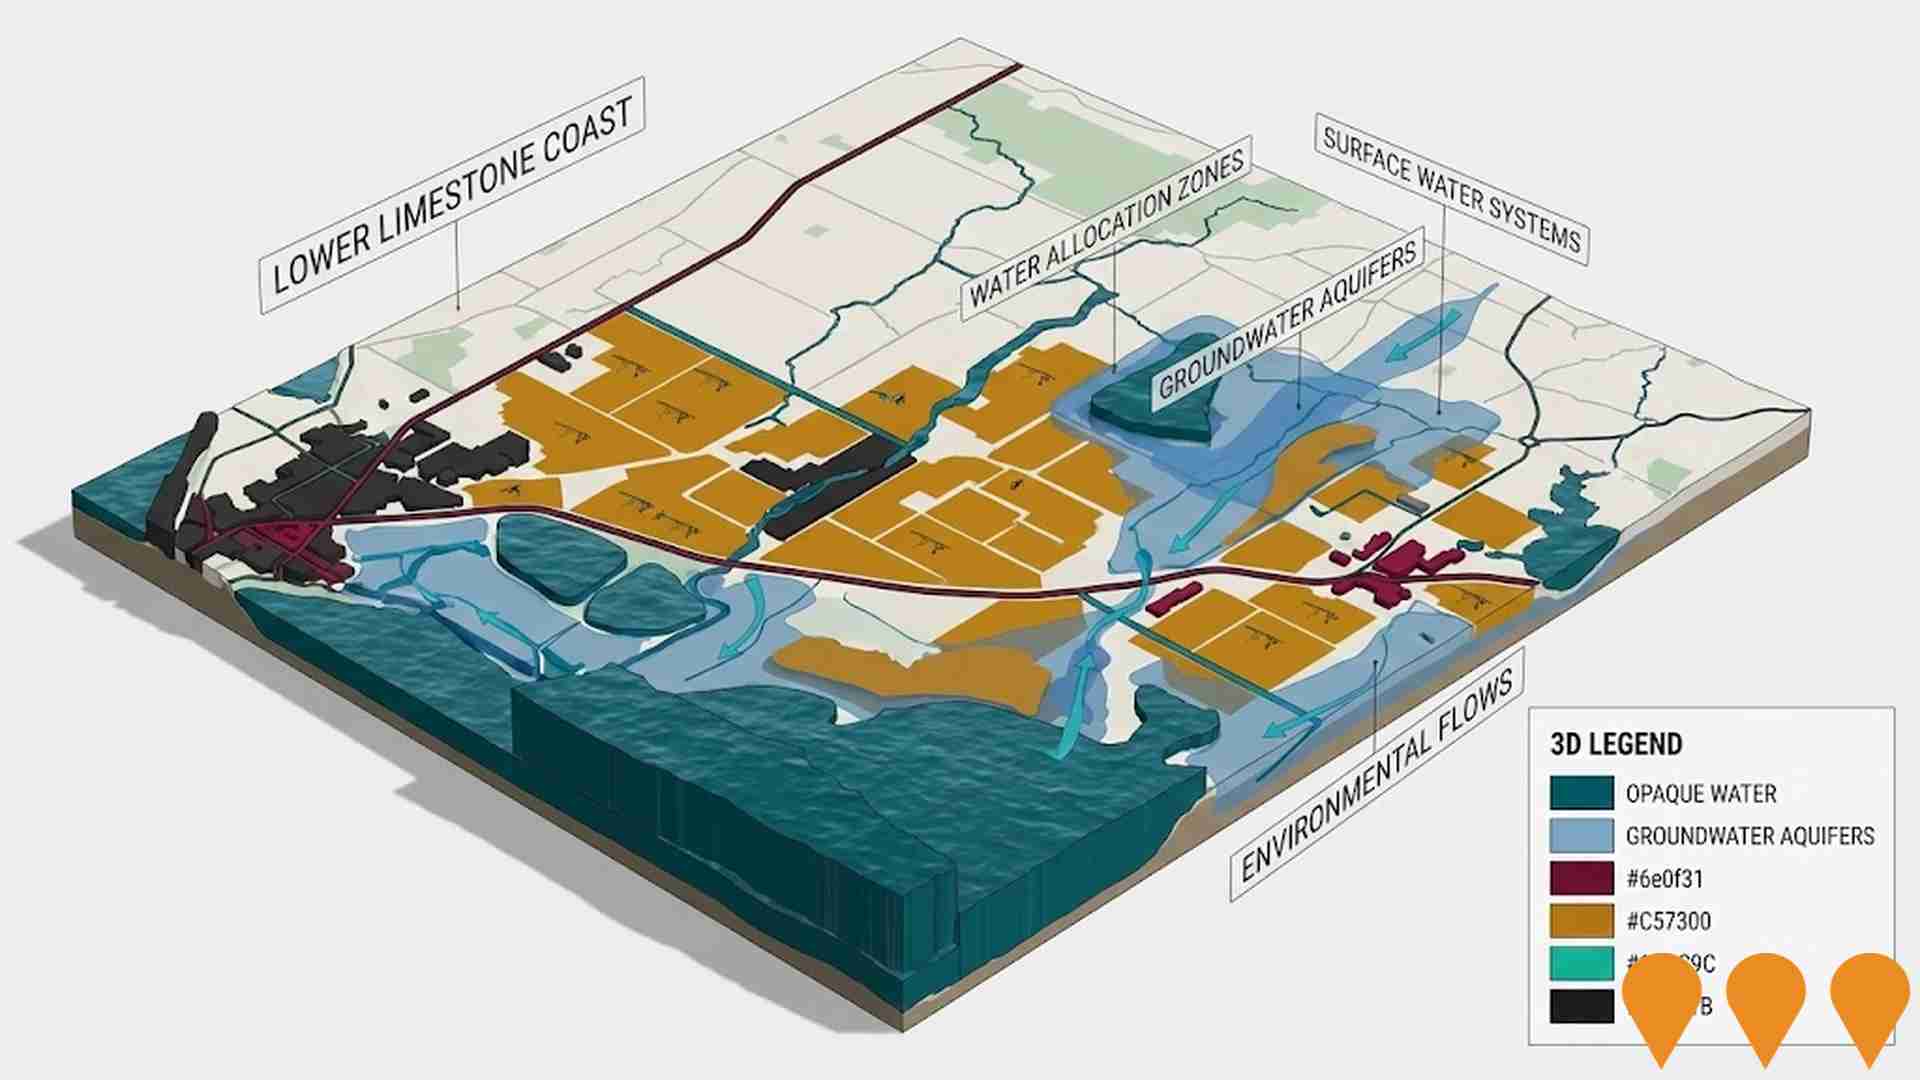
Lower Limestone Coast Water Allocation Plan
A water allocation plan setting rules for groundwater management in the Lower Limestone Coast, ensuring long-term sustainability and security of the water resource for environmental, social, cultural, and economic needs.
Limestone Coast Energy Park
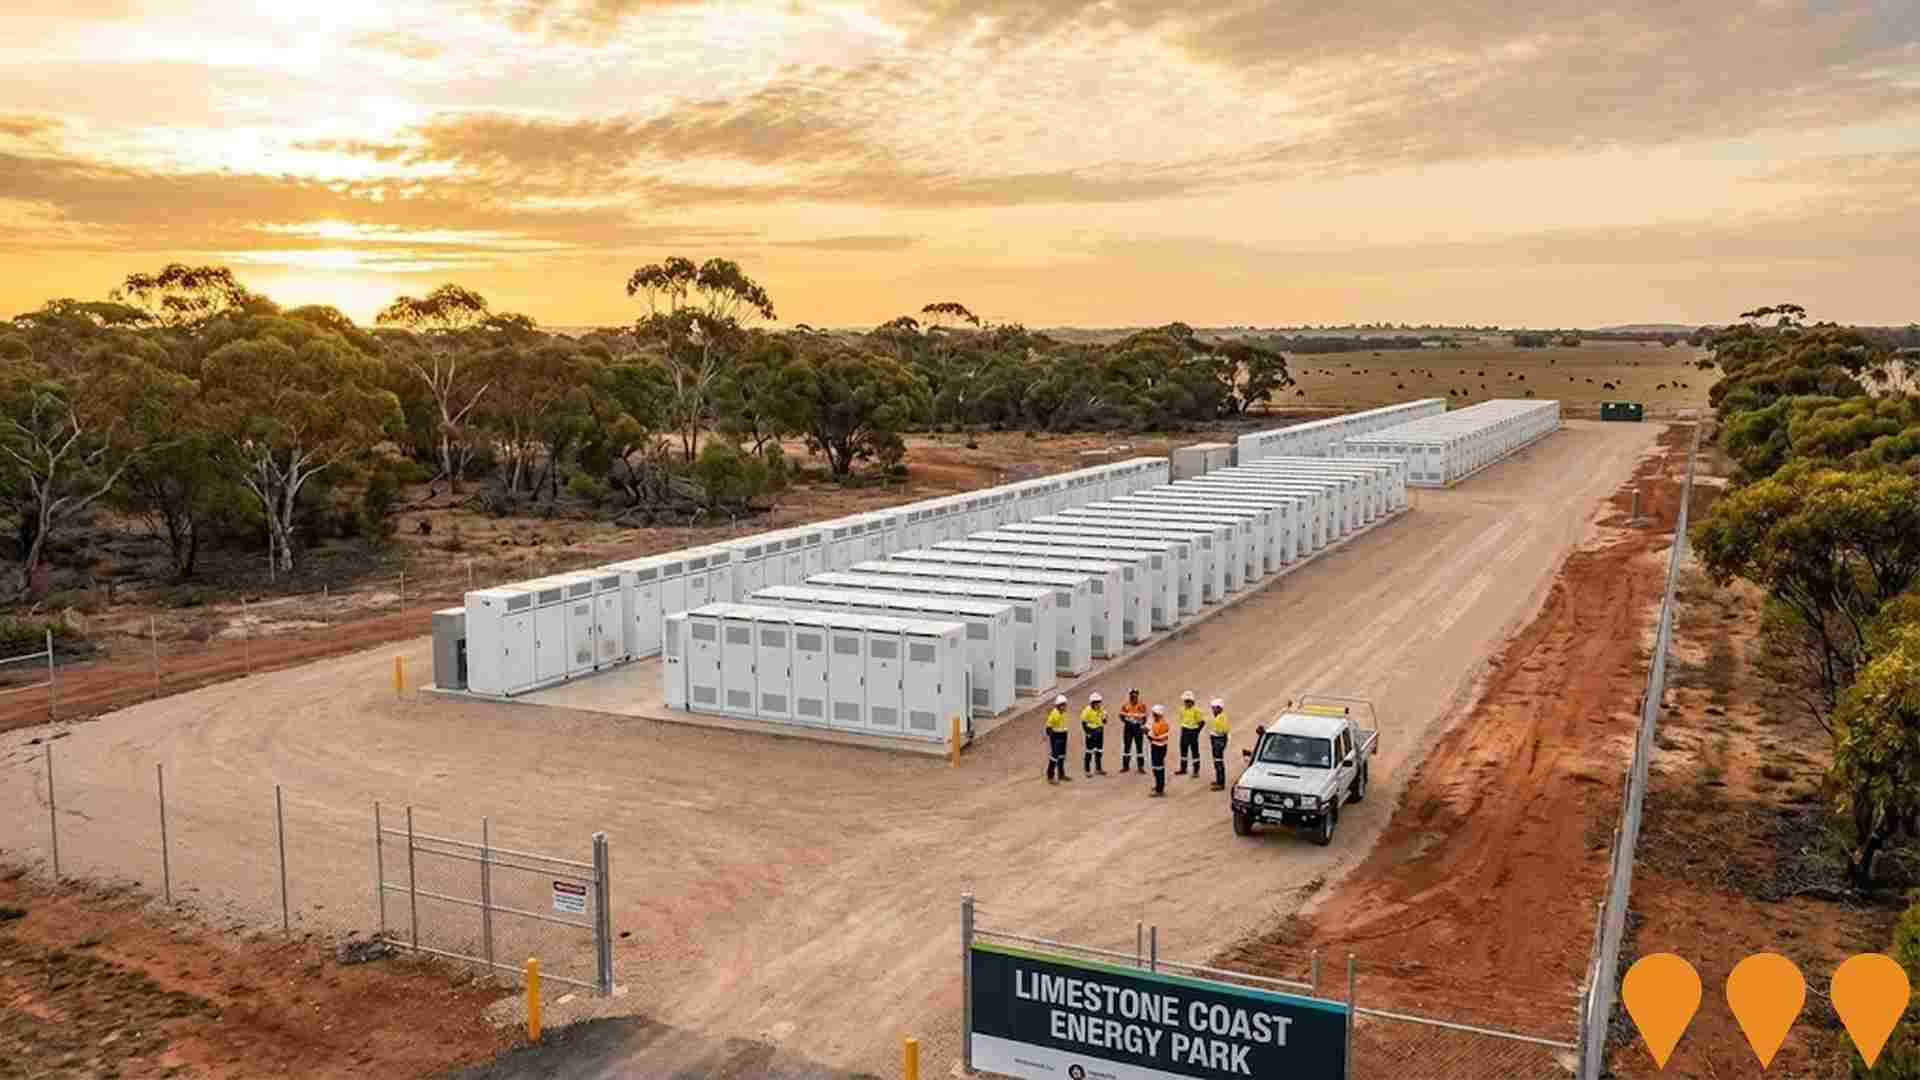
The Limestone Coast Energy Park includes two co-located batteries totaling 500 MW / 1,500 MWh in South Australia's Limestone Coast area.
Employment
Employment conditions in Wattle Range demonstrate strong performance, ranking among the top 35% of areas assessed nationally
Wattle Range has a balanced workforce with white and blue collar jobs, diverse sector representation, an unemployment rate of 1.9% as of September 2025, and estimated employment growth of 0.9% over the past year. It has 1,918 residents in work, with an unemployment rate of 3.5%, which is below Rest of SA's rate of 5.3%.
Workforce participation is 57.5%, similar to Rest of SA's 54.1%. Key industries include agriculture, forestry & fishing, health care & social assistance, and retail trade. The area specializes in agriculture, forestry & fishing, with an employment share 2.2 times the regional level. However, health care & social assistance is under-represented at 11.5% compared to Rest of SA's 13.9%.
Employment opportunities appear limited locally based on Census data analysis. Between September 2024 and September 2025, employment levels increased by 0.9%, labour force by 1.5%, leading to an unemployment rise of 0.5 percentage points. In comparison, Rest of SA had employment growth of 0.3%, labour force growth of 2.3%, with unemployment rising by 1.9 percentage points. National employment forecasts from Jobs and Skills Australia (May-25) project national employment growth at 6.6% over five years and 13.7% over ten years, but growth rates vary between sectors. Applying these projections to Wattle Range's employment mix suggests local employment should increase by 4.8% over five years and 11.1% over ten years, though this is a simple extrapolation for illustrative purposes only.
Frequently Asked Questions - Employment
Income
Income figures position the area below 75% of locations analysed nationally by AreaSearch
AreaSearch's latest postcode level ATO data for financial year 2022 shows that income in Wattle Range SA2 is lower than average nationally. The median income is $46,420 and the average is $57,285. This contrasts with Rest of SA's figures: median income of $46,889 and average income of $56,582. Based on Wage Price Index growth of 12.83% since financial year 2022, current estimates for September 2025 would be approximately $52,376 (median) and $64,635 (average). Census data reveals household, family, and personal incomes all rank modestly in Wattle Range, between the 24th and 26th percentiles. The data shows 31.1% of the population (1,146 individuals) fall within the $1,500 - 2,999 income range. Housing costs are manageable with 92.2% retained, but disposable income sits below average at the 35th percentile.
Frequently Asked Questions - Income
Housing
Wattle Range is characterized by a predominantly suburban housing profile, with above-average rates of outright home ownership
The dwelling structure in Wattle Range, as per the latest Census, consisted of 99.2% houses and 0.8% other dwellings (semi-detached, apartments, 'other' dwellings). This contrasts with Non-Metro SA's composition of 87.6% houses and 12.5% other dwellings. Home ownership in Wattle Range stood at 51.8%, with mortgaged dwellings at 36.8% and rented ones at 11.4%. The median monthly mortgage repayment was $1,006, lower than Non-Metro SA's average of $1,083. The median weekly rent in Wattle Range was $177, compared to Non-Metro SA's $205. Nationally, Wattle Range's mortgage repayments were significantly lower at $1,006 versus Australia's average of $1,863, and rents were substantially below the national figure of $375.
Frequently Asked Questions - Housing
Household Composition
Wattle Range has a typical household mix, with a higher-than-average median household size
Family households account for 72.2% of all households, including 26.8% couples with children, 37.8% couples without children, and 7.1% single parent families. Non-family households constitute the remaining 27.8%, with lone person households at 26.4% and group households comprising 1.2%. The median household size is 2.4 people, larger than the Rest of SA average of 2.3.
Frequently Asked Questions - Households
Local Schools & Education
Educational outcomes in Wattle Range fall within the lower quartile nationally, indicating opportunities for improvement in qualification attainment
The area's university qualification rate is 13.6%, significantly lower than the Australian average of 30.4%. This disparity presents both a challenge and an opportunity for targeted educational initiatives. Bachelor degrees are most common at 10.5%, followed by postgraduate qualifications (1.6%) and graduate diplomas (1.5%). Vocational credentials are prominent, with 39.7% of residents aged 15+ holding them, including advanced diplomas (8.6%) and certificates (31.1%).
Educational participation is high, with 26.5% of residents currently enrolled in formal education. This includes 12.2% in primary education, 7.7% in secondary education, and 1.4% pursuing tertiary education.
Frequently Asked Questions - Education
Schools Detail
Nearby Services & Amenities
Transport
No public transport data available for this catchment area.
Frequently Asked Questions - Transport
Transport Stops Detail
Health
Health performance in Wattle Range is lower than average with common health conditions somewhat prevalent across both younger and older age cohorts
Wattle Range faces significant health challenges with common health conditions prevalent across both younger and older age cohorts. The rate of private health cover is very low at approximately 48% of the total population (~1,780 people), compared to the national average of 55.3%.
The most common medical conditions in the area are arthritis and asthma, impacting 10.8 and 8.0% of residents respectively. A total of 65.6% of residents declare themselves completely clear of medical ailments, similar to the 65.5% across Rest of SA. The area has a higher proportion of residents aged 65 and over at 26.7% (984 people), compared to 23.3% in Rest of SA. Health outcomes among seniors in Wattle Range are particularly strong, performing better than the general population in health metrics.
Frequently Asked Questions - Health
Cultural Diversity
The latest Census data sees Wattle Range placing among the least culturally diverse areas in the country when compared across a range of language and cultural background related metrics
Wattle Range's cultural diversity was found to be below average. Its population was predominantly citizens, with 89.6% holding citizenship. Birthplace indicated Australian origins for 91.7%.
English was spoken exclusively at home by 97.3%. Christianity was the dominant religion, practiced by 40.1%. Islam's presence was overrepresented compared to regional averages, comprising 0.3% of Wattle Range's population versus 1.1% in Rest of SA. Ancestry-wise, English (33.9%), Australian (33.2%), and Scottish (9.5%) were the top three represented groups. Notably, German ancestry was overrepresented at 6.5%, compared to regional figures of 6.4%. Dutch ancestry also showed higher representation than average, at 2.0% versus 1.7%.
Frequently Asked Questions - Diversity
Age
Wattle Range hosts an older demographic, ranking in the top quartile nationwide
Wattle Range has a median age of 49, which is higher than the Rest of SA figure of 47 and substantially exceeds the national norm of 38. Compared to Rest of SA, Wattle Range has a higher concentration of residents aged 55-64 (18.0%) but fewer residents aged 25-34 (7.4%). This 55-64 concentration is well above the national figure of 11.2%. Between the 2021 Census and now, the population aged 15 to 24 has grown from 8.8% to 10.6%, while those aged 75 to 84 have increased from 6.4% to 7.6%. Conversely, the population aged 45 to 54 has declined from 13.7% to 11.7%. Looking ahead to 2041, demographic projections show significant shifts in Wattle Range's age structure. Notably, the 75 to 84 group is projected to grow by 46%, reaching 410 people from 280. The aging population trend is clear, with those aged 65 and above comprising 96% of the projected growth. Conversely, both the 45 to 54 and 15 to 24 age groups are expected to decrease in number.
