Chart Color Schemes
This analysis uses ABS Statistical Areas Level 2 (SA2) boundaries, which can materially differ from Suburbs and Localities (SAL) even when sharing similar names.
SA2 boundaries are defined by the Australian Bureau of Statistics and are designed to represent communities for statistical reporting (e.g., census and ERP).
Suburbs and Localities (SAL) represent commonly-used suburb/locality names (postal-style areas) and may use different geographic boundaries. For comprehensive analysis, consider reviewing both boundary types if available.
est. as @ -- *
ABS ERP | -- people | --
2021 Census | -- people
Sales Activity
Curious about local property values? Filter the chart to assess the volume and appreciation (including resales) trends and regional comparisons, or scroll to the map below view this information at an individual property level.
Find a Recent Sale
Sales Detail
Population
An assessment of population growth drivers in Wellington Point reveals an overall ranking slightly below national averages considering recent, and medium term trends
Wellington Point's population was approximately 12,340 as of November 2025. This figure represents a growth of 447 people since the 2021 Census, which recorded a population of 11,893. The increase is inferred from ABS data showing an estimated resident population of 12,324 in June 2024 and an additional 81 validated new addresses since the Census date. This results in a population density ratio of 1,312 persons per square kilometer, higher than the average found across national locations assessed by AreaSearch. Wellington Point's growth rate of 3.8% since the census is close to that of its SA3 area (4.6%), indicating strong growth fundamentals. Overseas migration contributed approximately 88.8% of overall population gains in recent periods.
AreaSearch uses ABS/Geoscience Australia projections for each SA2 area, released in 2024 with a base year of 2022. For areas not covered by this data and years post-2032, Queensland State Government's SA2 area projections are adopted, released in 2023 based on 2021 data. However, these state projections do not provide age category splits, so AreaSearch applies proportional growth weightings from ABS Greater Capital Region projections for each age cohort, released in 2023 with a base year of 2022. Future demographic trends suggest lower quartile growth for Australian statistical areas, with Wellington Point expected to grow by 291 persons to reach 2041 based on the latest annual ERP population numbers, reflecting an increase of approximately 2.2% over the 17-year period.
Frequently Asked Questions - Population
Development
AreaSearch analysis of residential development drivers sees Wellington Point recording a relatively average level of approval activity when compared to local markets analysed countrywide
Wellington Point has recorded approximately 51 residential properties granted approval per year over the past five financial years, totalling 256 homes. So far in FY-26, 12 approvals have been recorded. On average, 0.6 people per year moved to the area for each dwelling built between FY-21 and FY-25. This indicates that new supply is keeping pace with or exceeding demand, offering ample buyer choice and creating capacity for population growth beyond current forecasts.
The average construction value of new homes is $460,000, suggesting developers are targeting the premium market segment with higher-end properties. In this financial year, $10.5 million in commercial approvals have been registered, demonstrating moderate levels of commercial development. When compared to Greater Brisbane, Wellington Point records elevated construction activity, balancing buyer choice with support for current property values. New building activity consists of 68% standalone homes and 32% townhouses or apartments, reflecting a growing mix of housing types providing options across different price points.
This shows a considerable shift from the current housing mix, which is predominantly houses (89%). The location has approximately 295 people per dwelling approval, indicating a low density market. According to the latest AreaSearch quarterly estimate, Wellington Point is expected to grow by 275 residents through to 2041. At current development rates, new housing supply should comfortably meet demand, providing good conditions for buyers and potentially supporting growth beyond current population projections.
Frequently Asked Questions - Development
Infrastructure
Wellington Point has moderate levels of nearby infrastructure activity, ranking in the 41stth percentile nationally
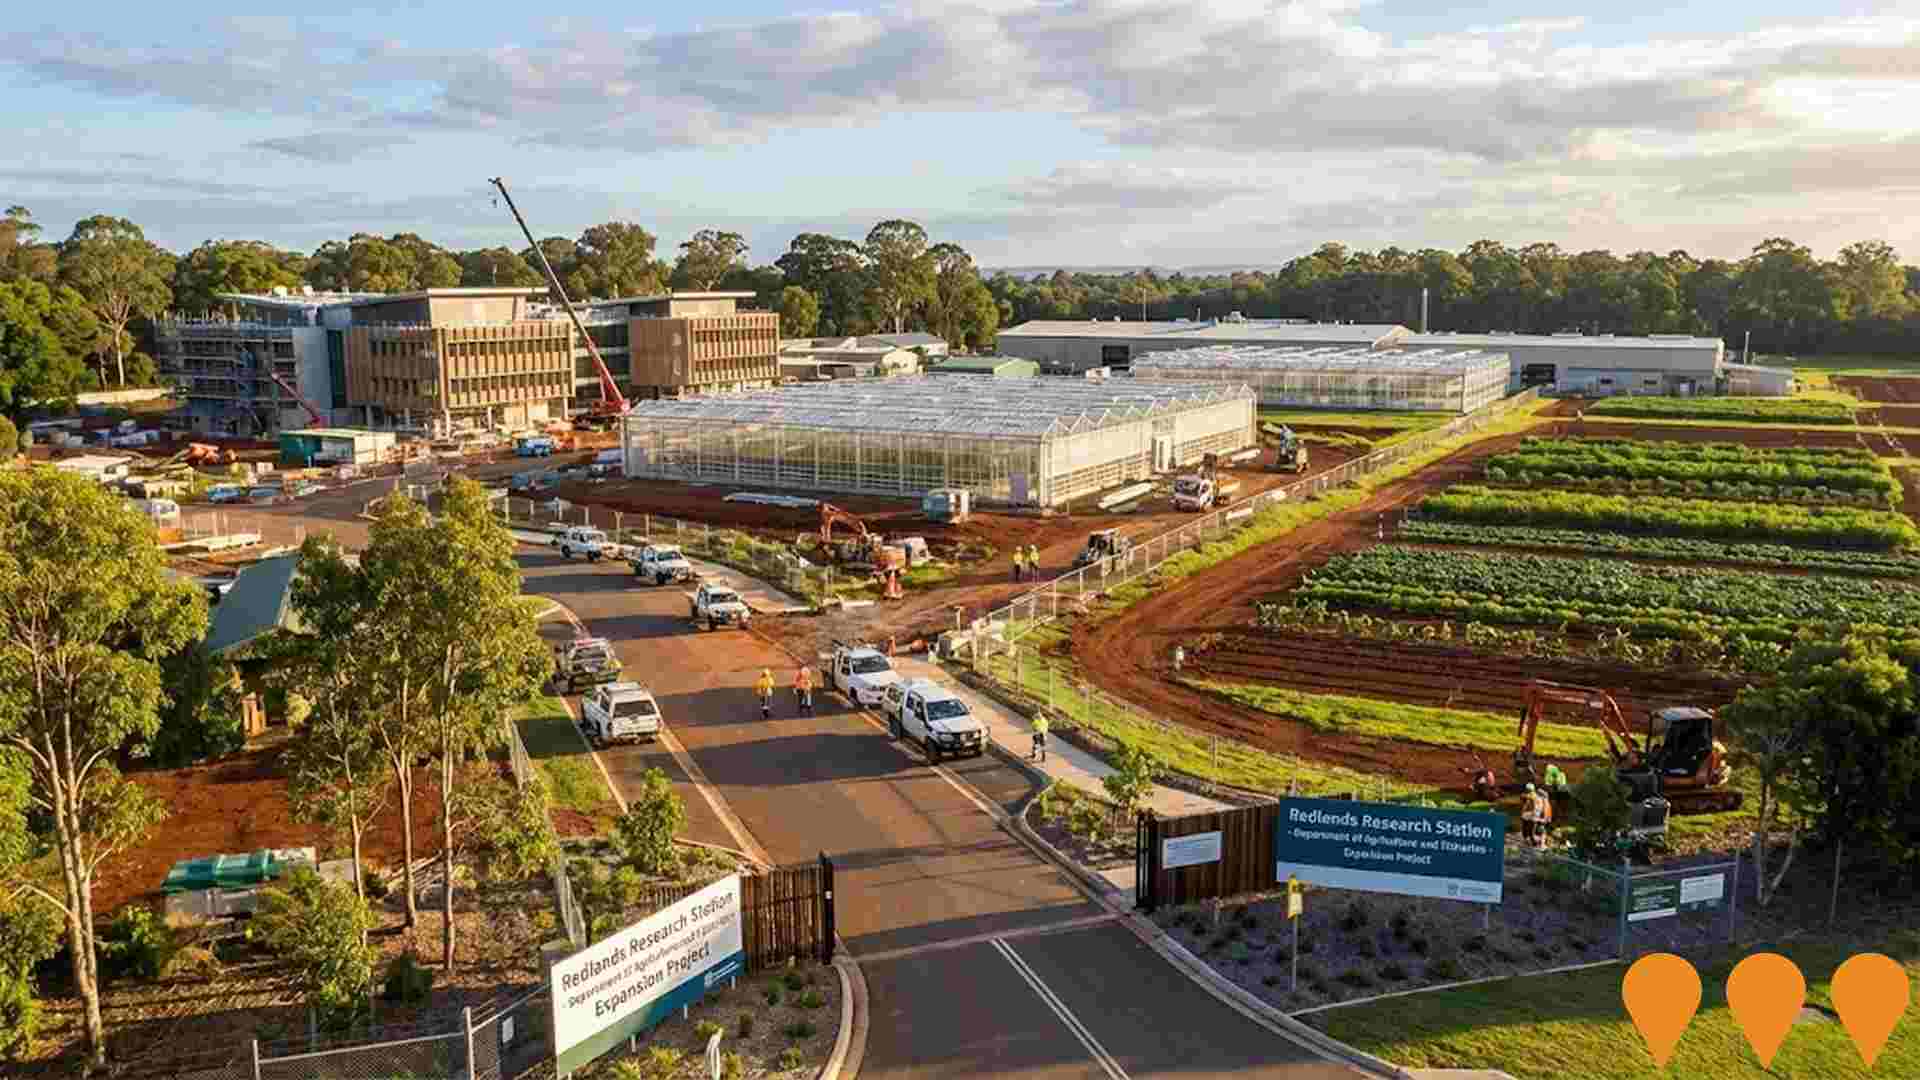
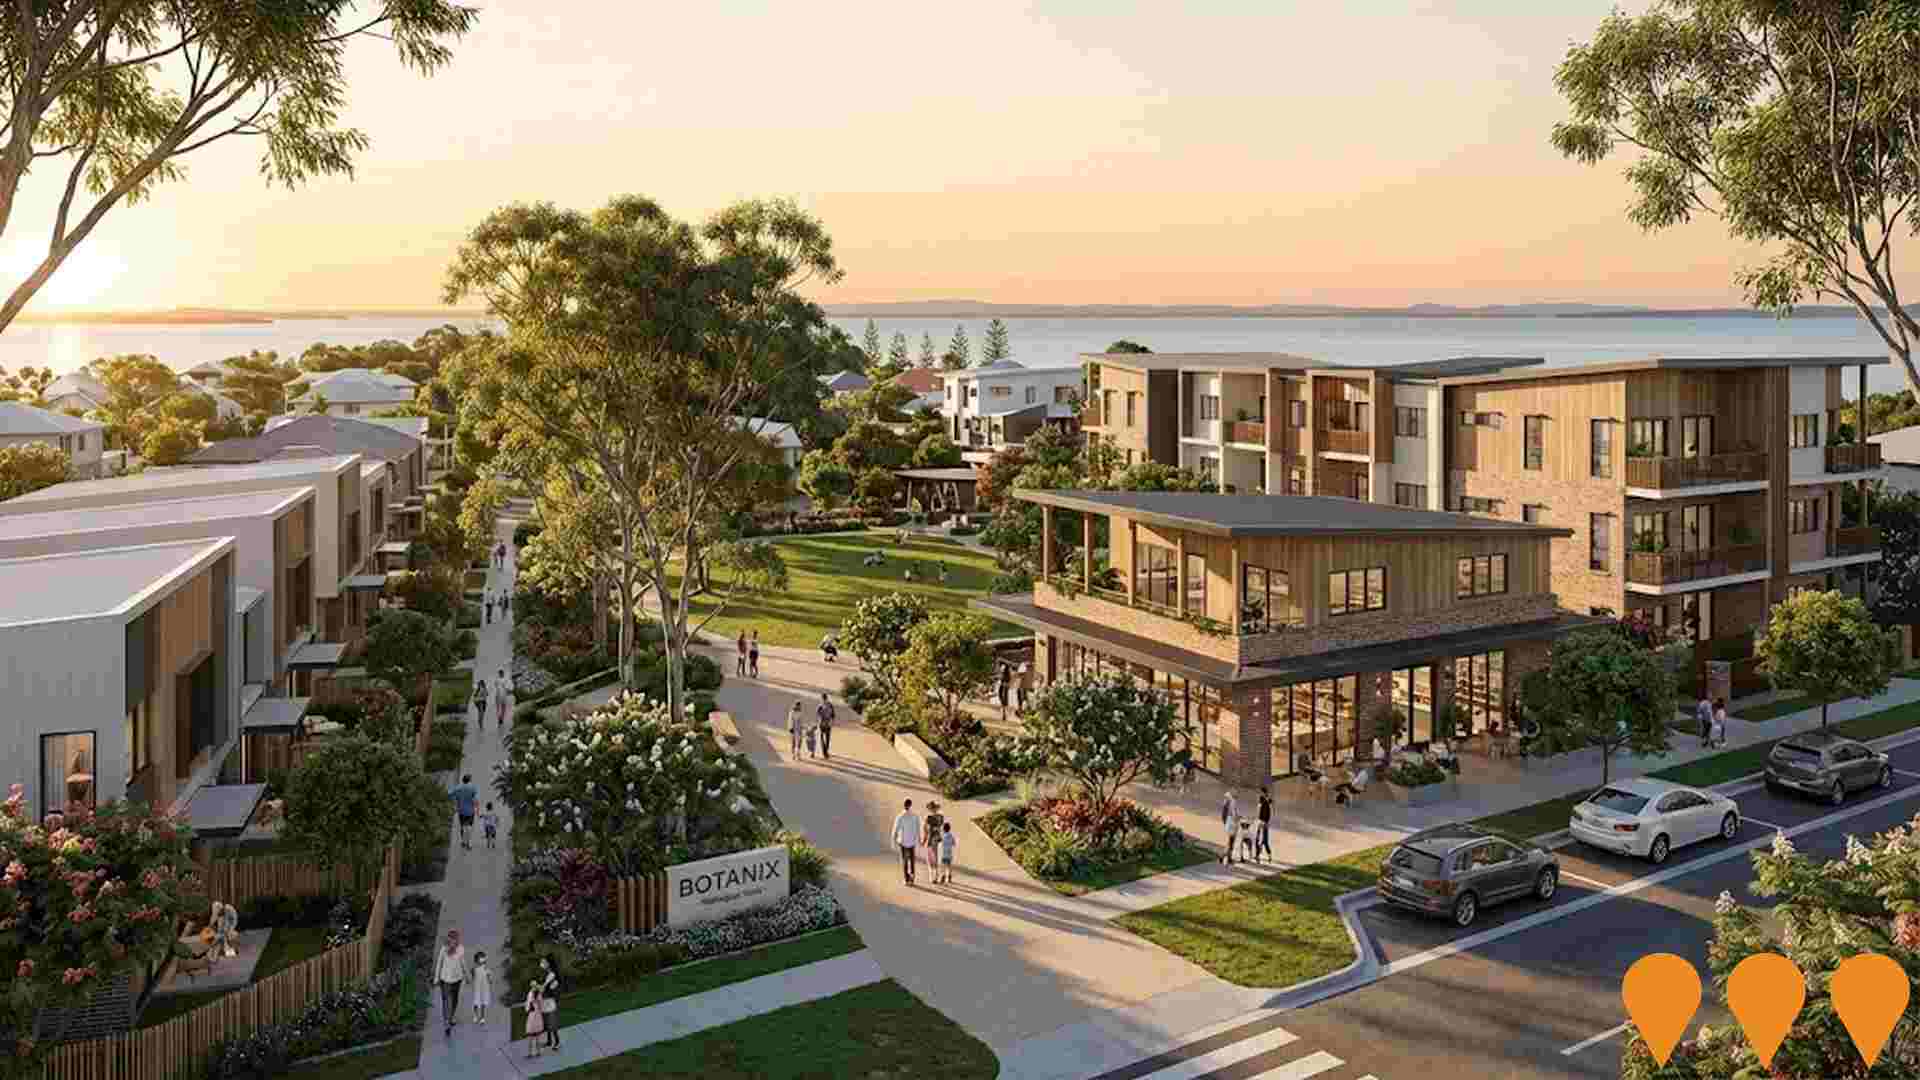
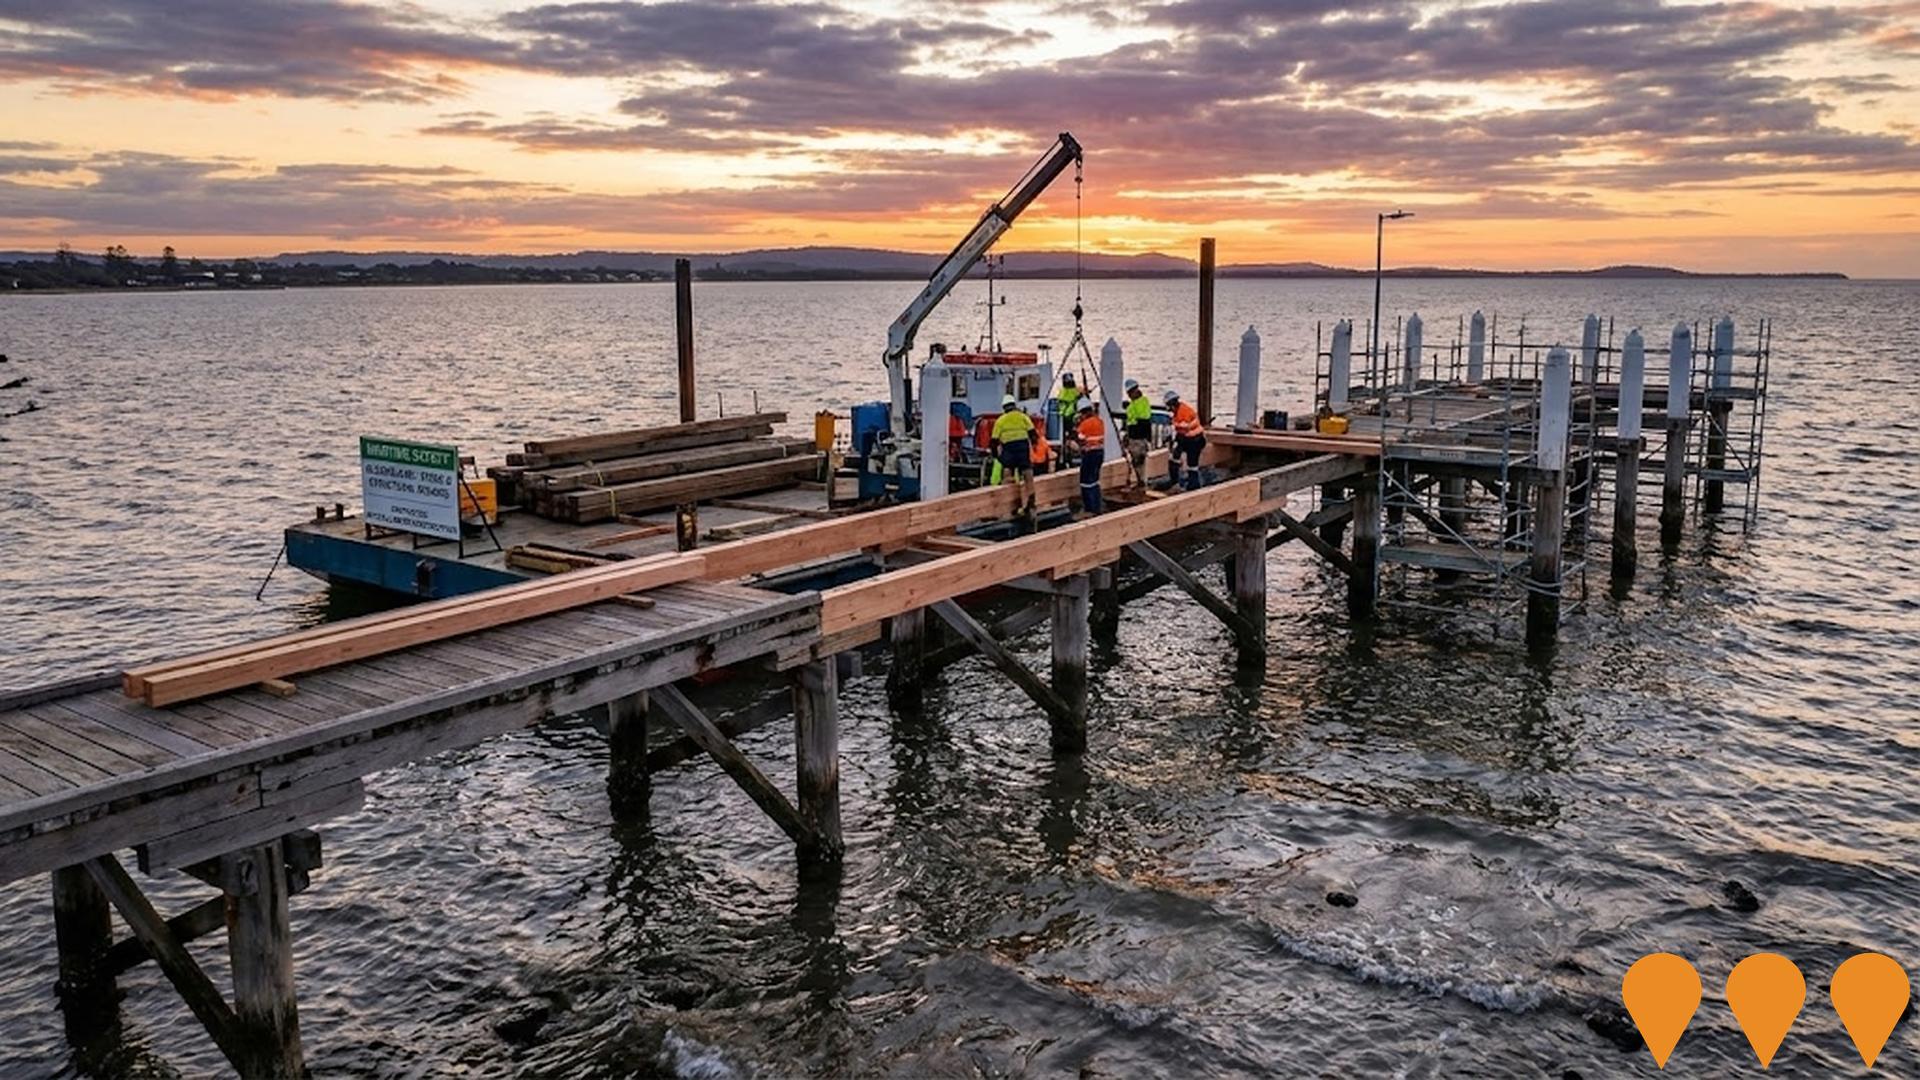
Changes to local infrastructure significantly affect an area's performance. AreaSearch has identified 14 projects likely to impact the area. Notable ones include Wellington Point Village Streetscape Revitalisation, Wellington Point Recreation Reserve Upgrade, Redland Hospital Expansion, and Ormiston College Master Plan Redevelopment. The following list details those most relevant.
Professional plan users can use the search below to filter and access additional projects.
INFRASTRUCTURE SEARCH
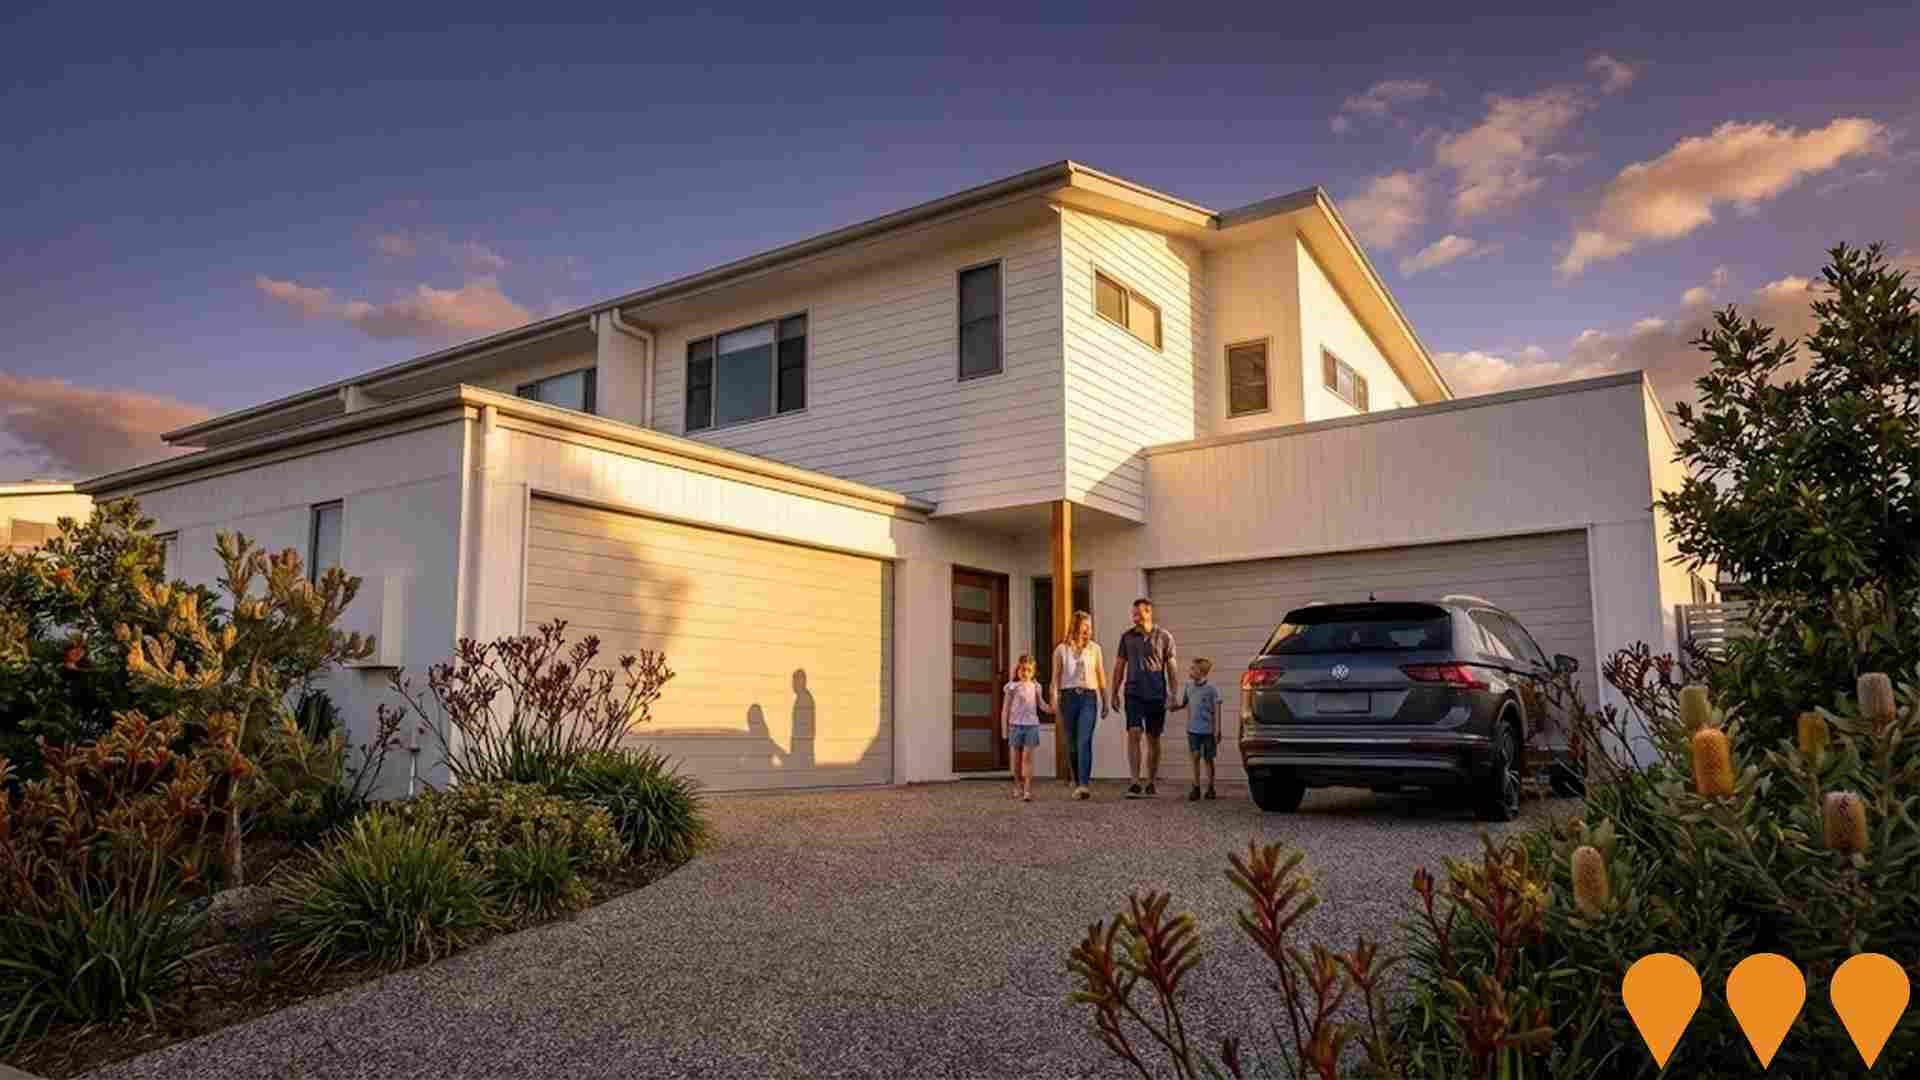
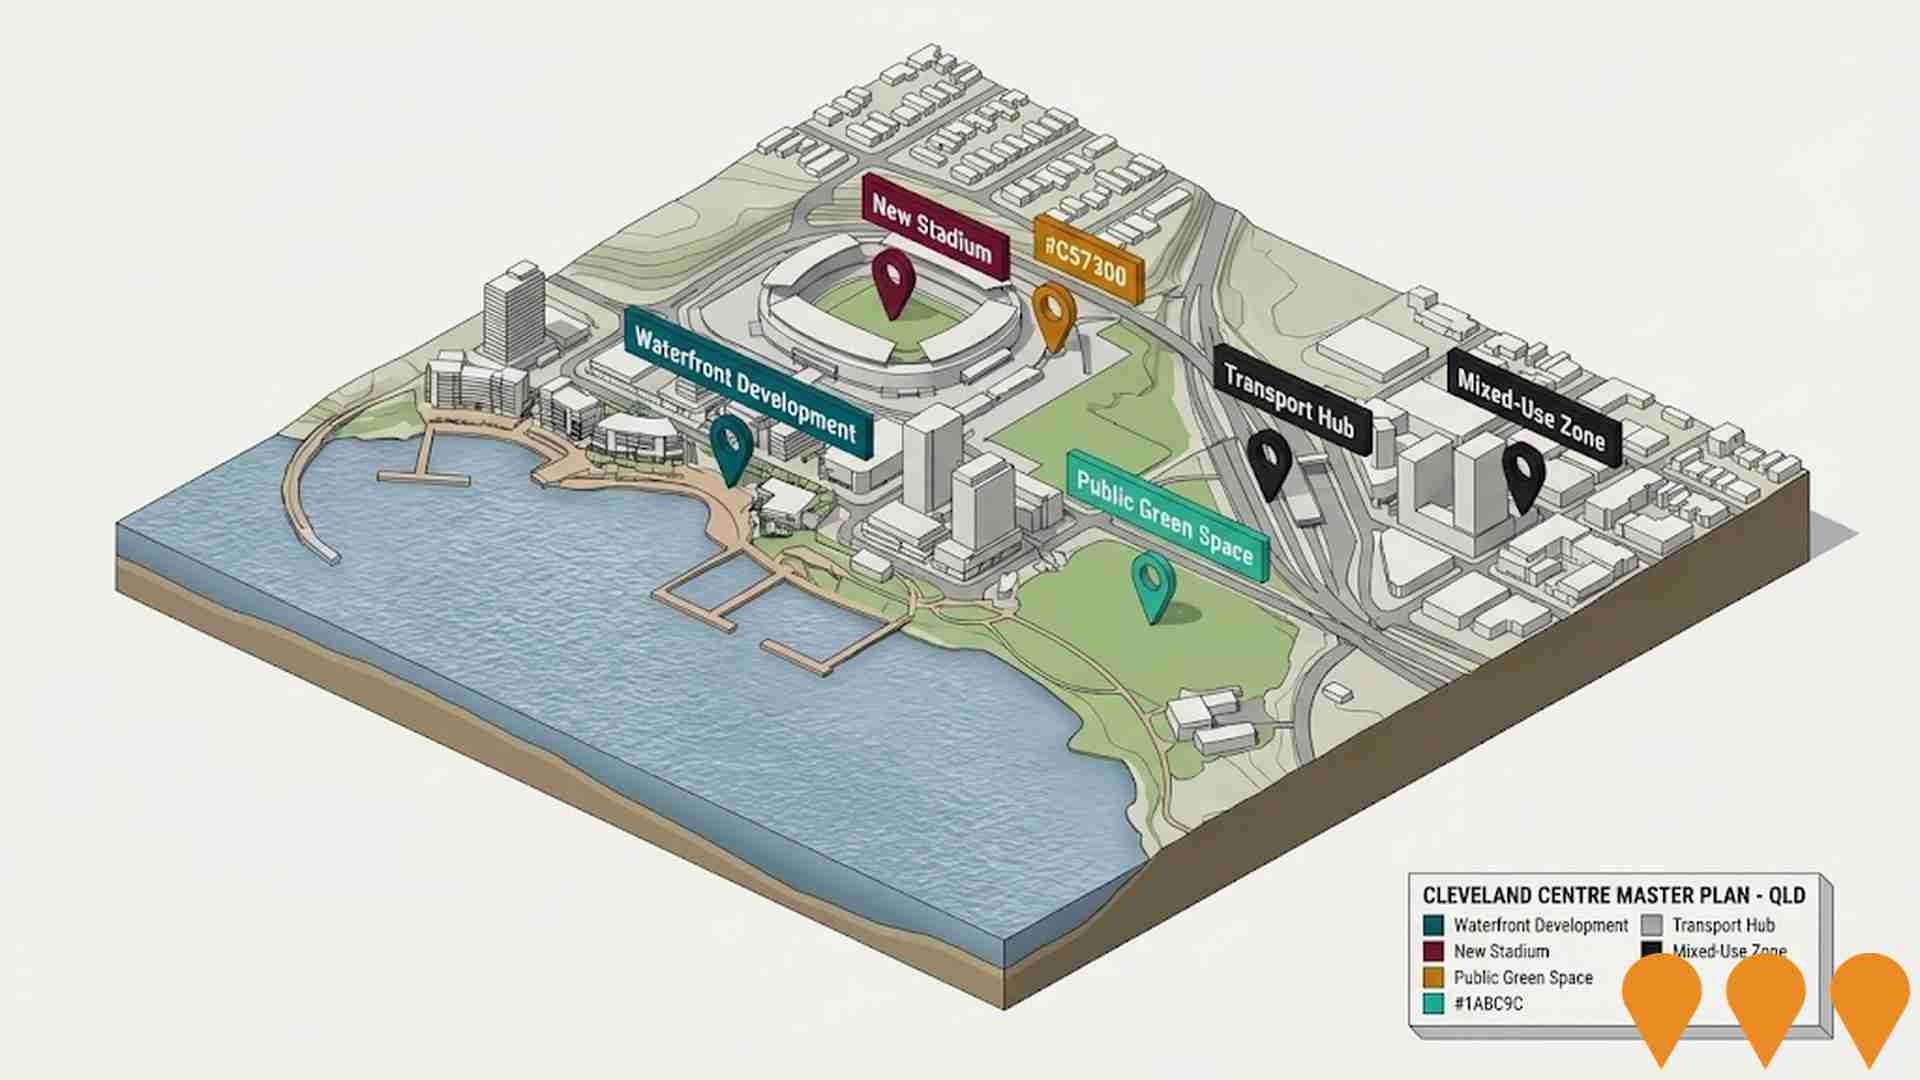
 Denotes AI-based impression for illustrative purposes only, not to be taken as definitive under any circumstances. Please follow links and conduct other investigations from the project's source for actual imagery. Developers and project owners wishing us to use original imagery please Contact Us and we will do so.
Frequently Asked Questions - Infrastructure
Redlands Health and Wellness Precinct
Master-planned health and wellness precinct centred on the expansion of Redland Hospital and integration with Mater Private Hospital. Includes new clinical services buildings, aged care, allied health, medical research and education facilities, wellness amenities, and supporting transport infrastructure. Delivered through partnership between Redland City Council, Metro South Hospital and Health Service, and Mater Health.
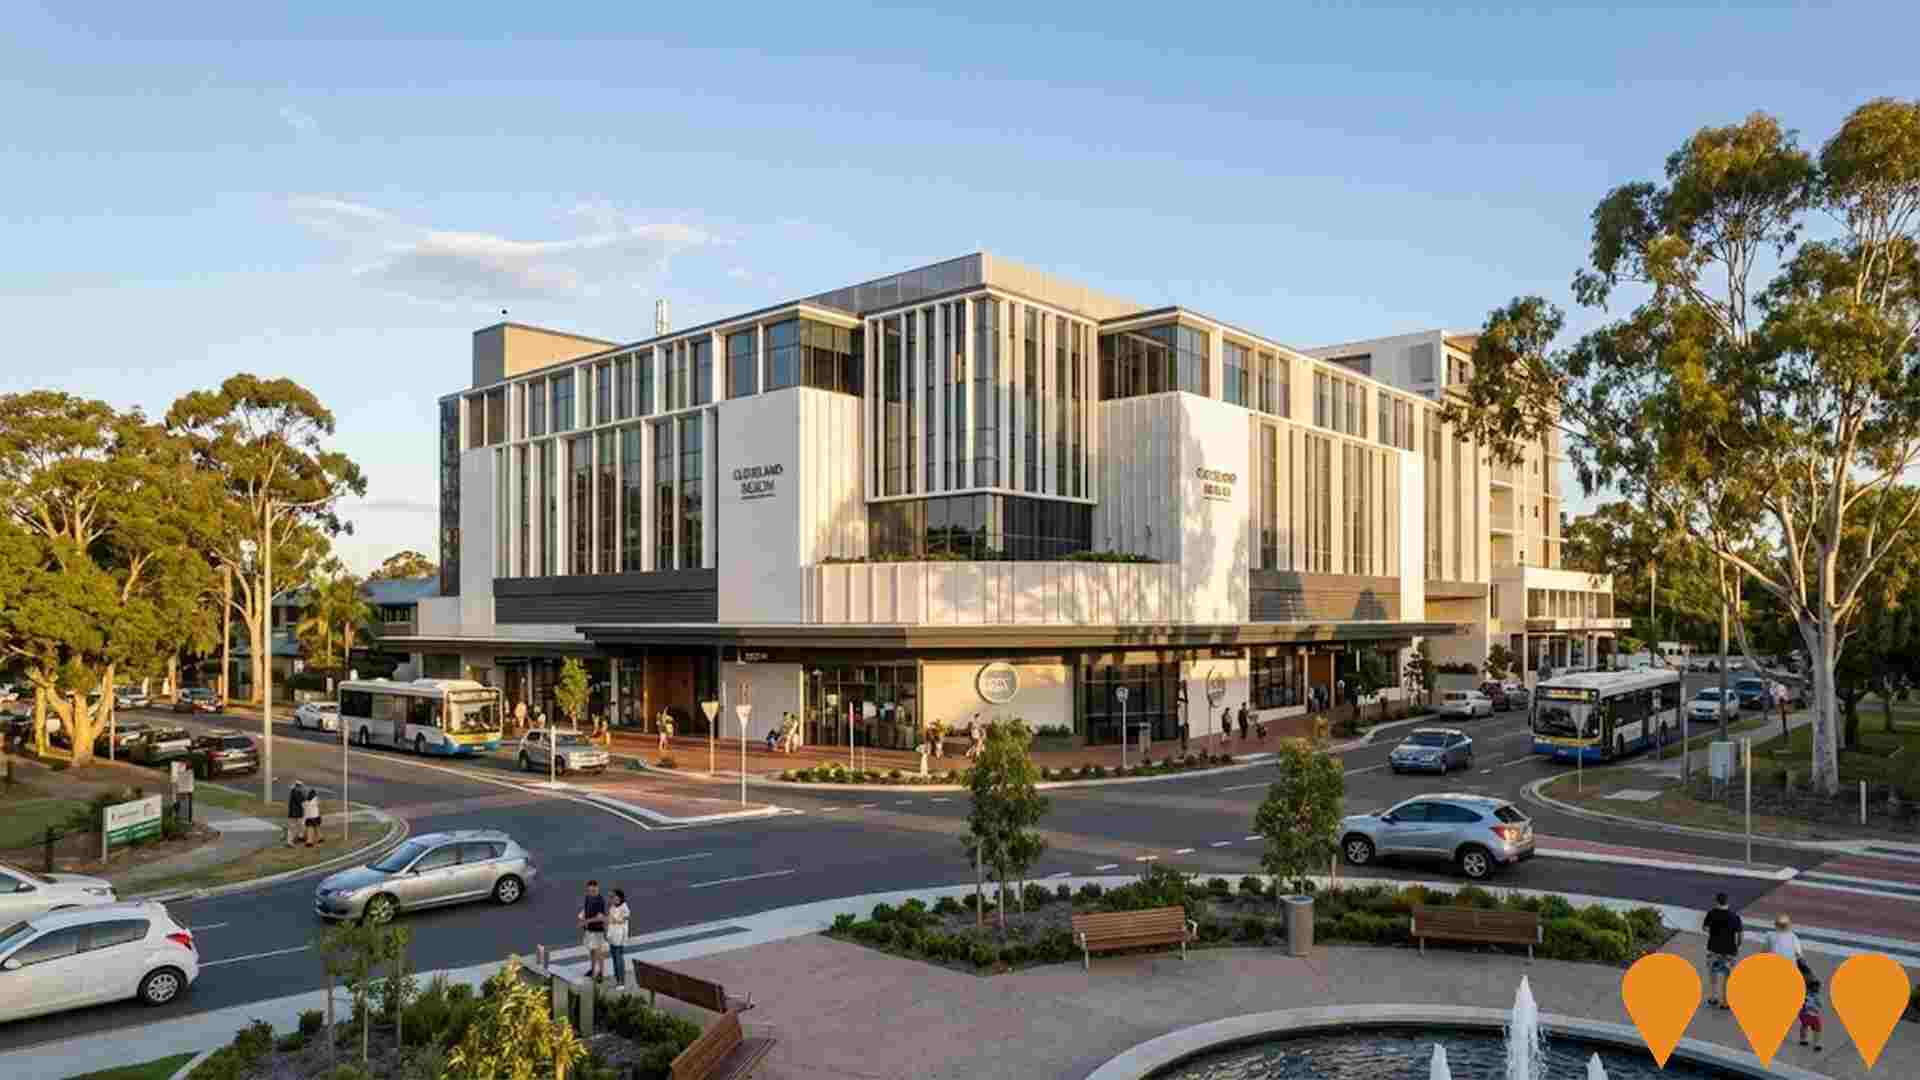
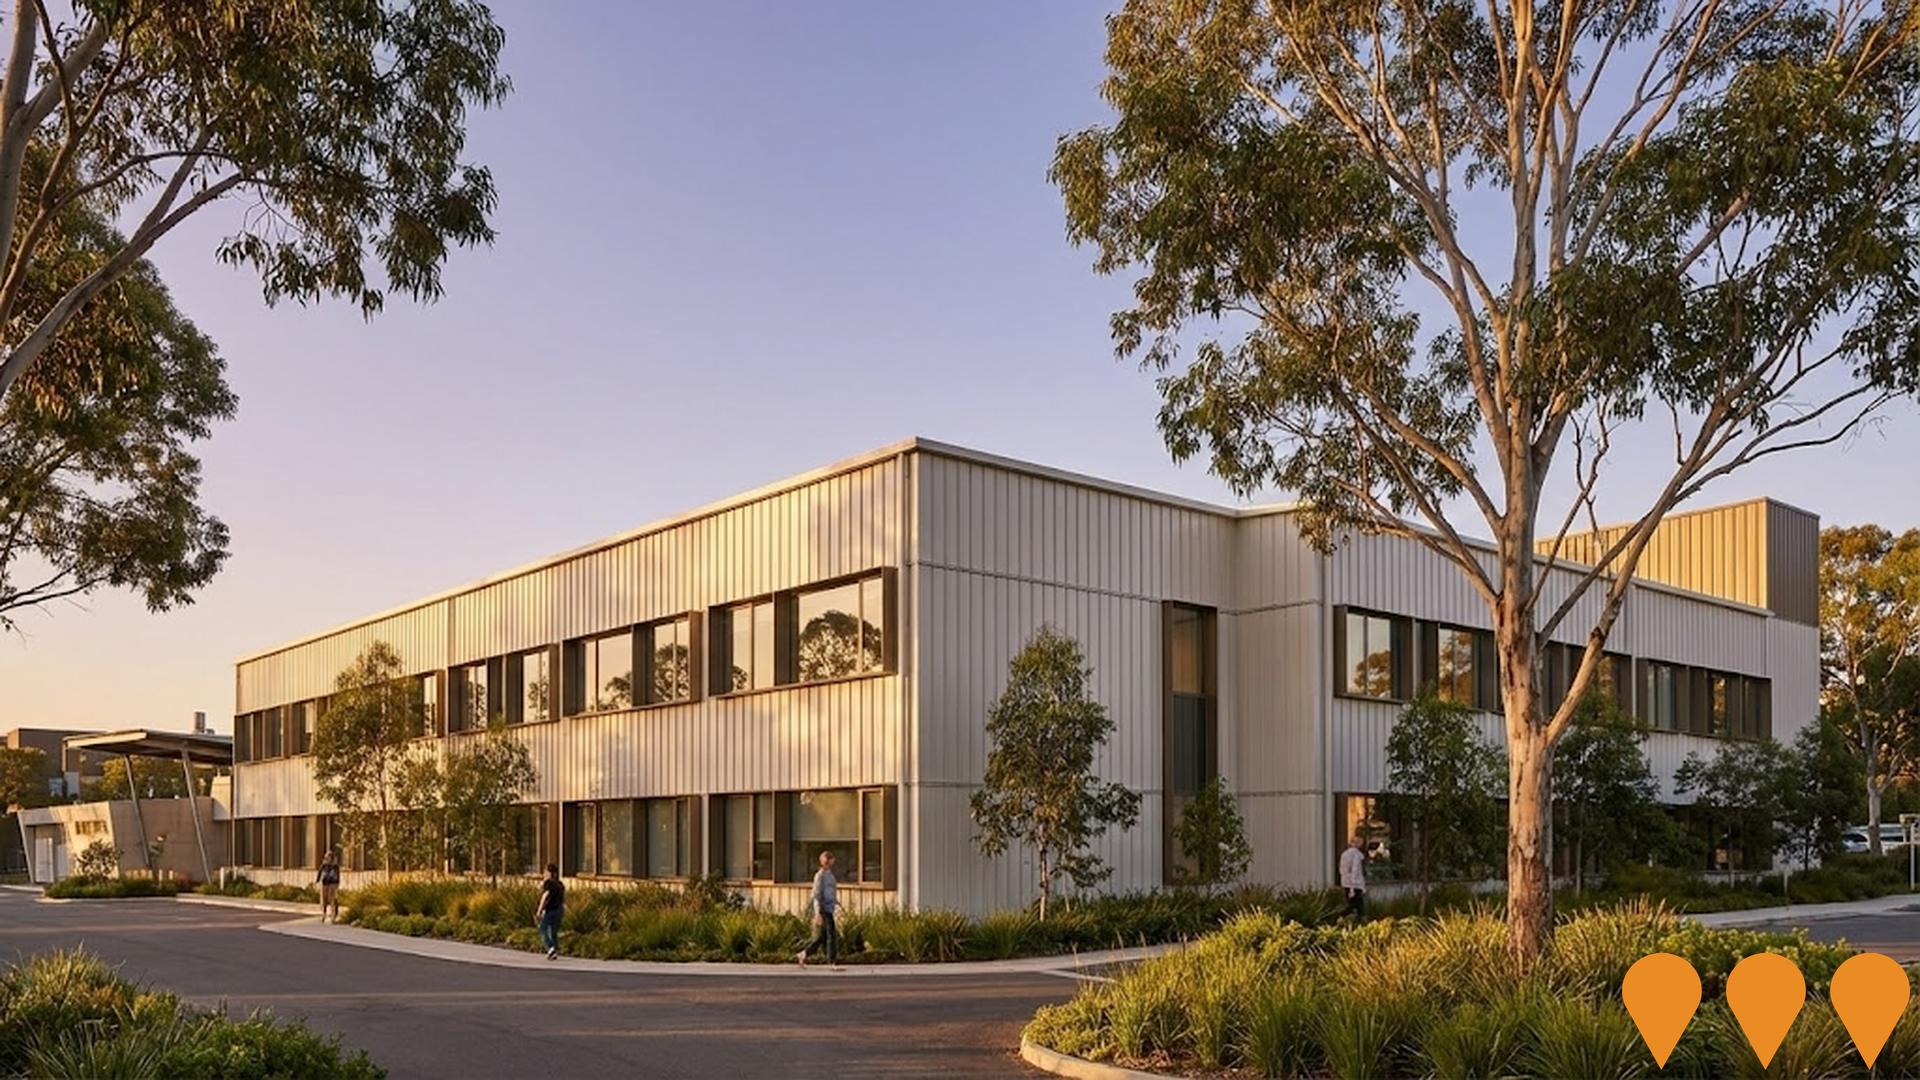
Redland Hospital Expansion
Multi-stage expansion of Redland Hospital in Cleveland to meet growing healthcare demand in Redlands Coast. Completed stages include multi-level car park (1,000+ spaces, 2023), Lagoon Ward (28 beds, 2023), upgraded birthing suite and ED (2020), and Stage 1 clinical services building with new ICU and 37 additional inpatient beds (opened early 2025). Current Stage 2 ($150M) is a new mental health and sub-acute/allied health building delivering 43 beds (20 net new) plus expanded outpatient services - under construction with completion expected mid-2027.
Cleveland Line Duplication (Park Road to Cleveland)
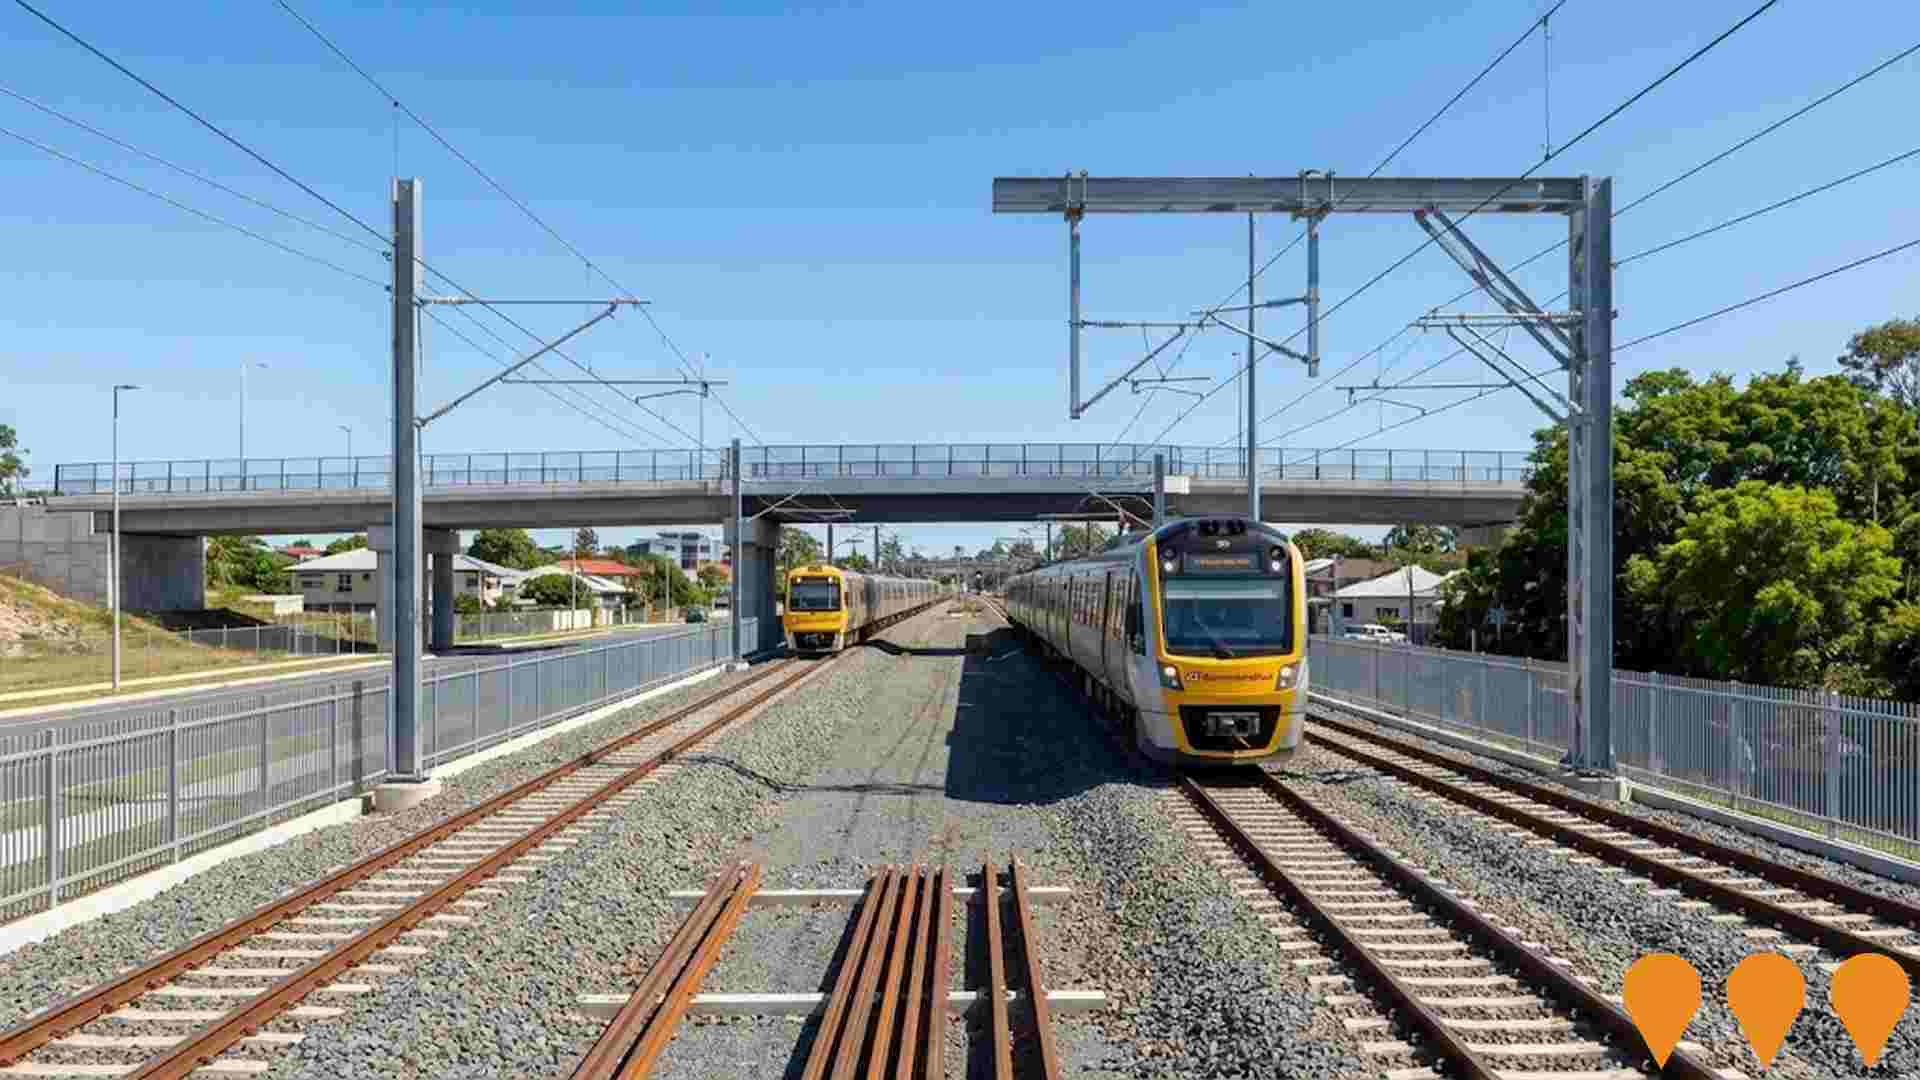
Major upgrade and partial duplication of the Cleveland Line between Park Road and Cleveland stations to increase capacity, improve reliability and enable higher frequency services in preparation for Cross River Rail and the Brisbane 2032 Olympic and Paralympic Games. Works include track duplication (particularly between Lindum and Cleveland), station upgrades, level crossing removals and signalling improvements.
Wellington Point Village Streetscape Revitalisation
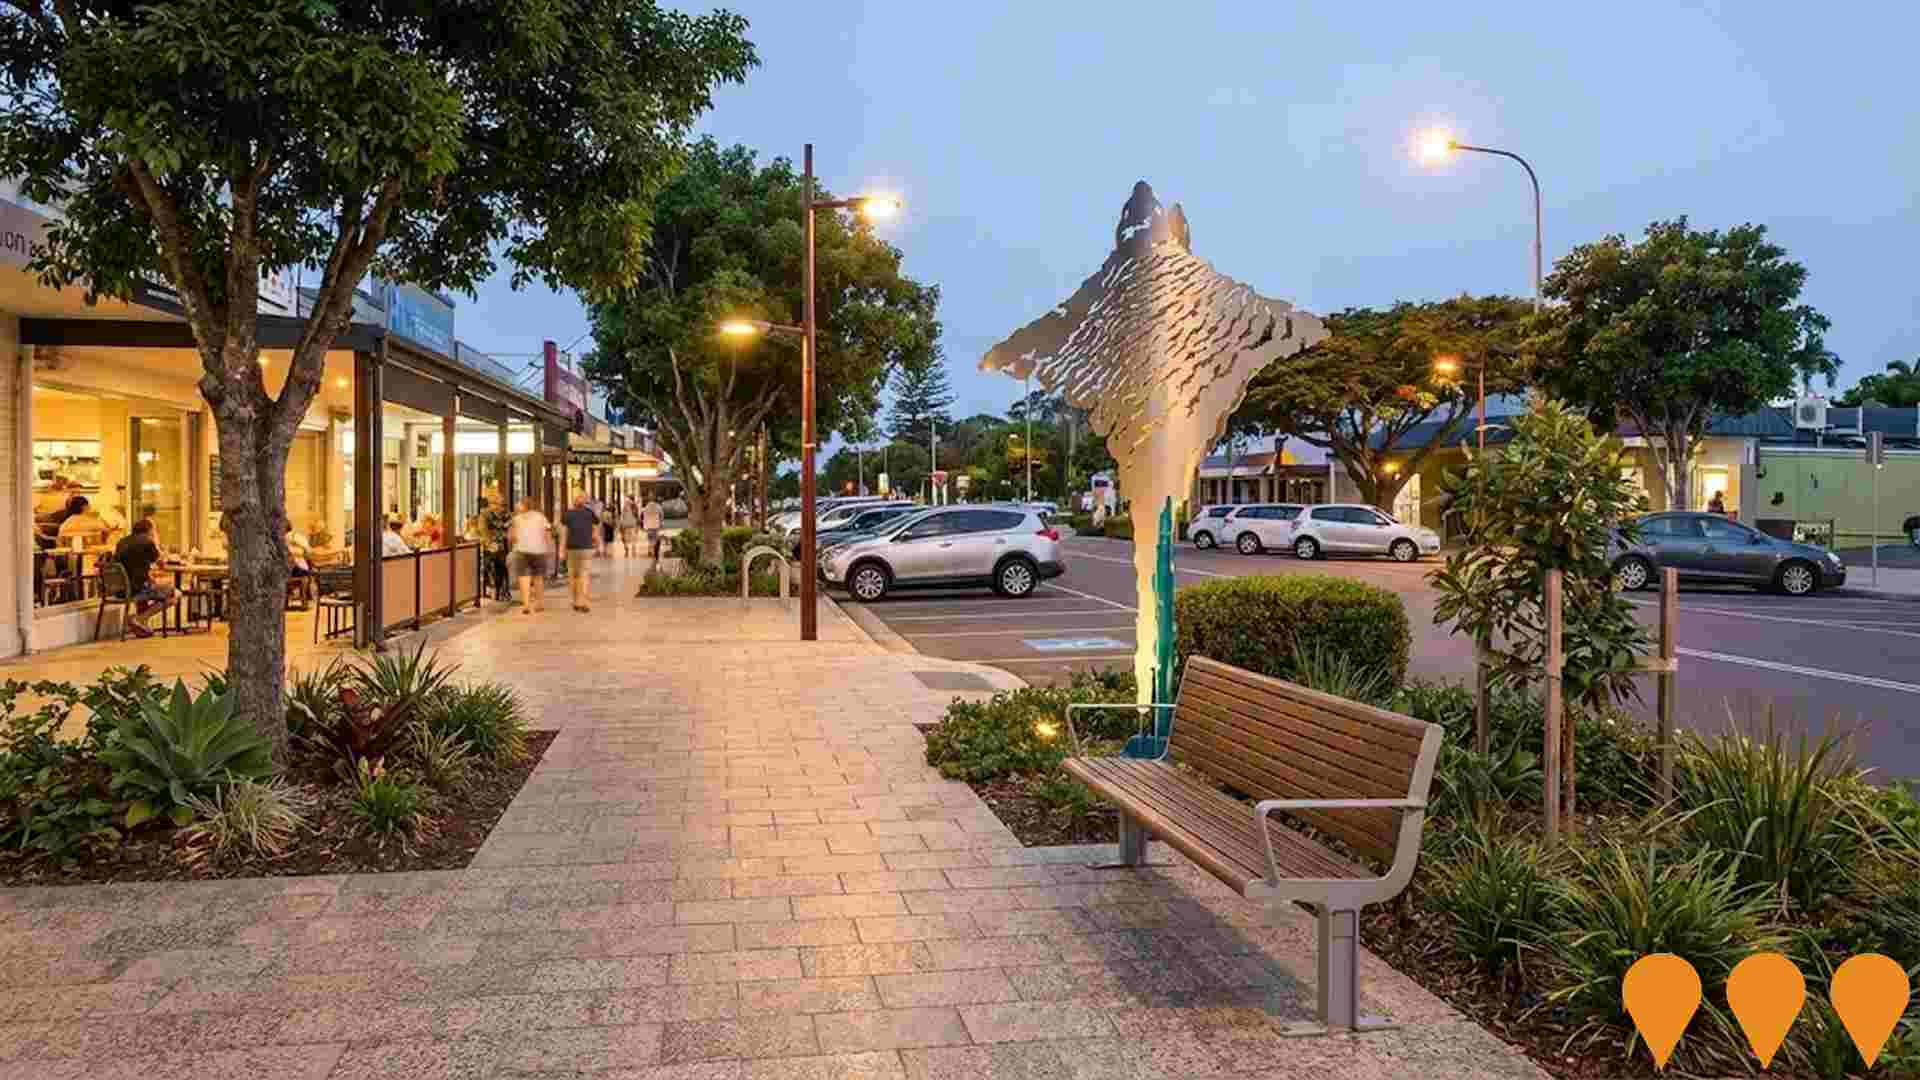
Redland City Council's streetscape upgrade of Wellington Point Village centre, delivering improved pedestrian pathways, new parking, public realm enhancements, landscaping, seating and shading to support local businesses and create a more vibrant, walkable village heart.
Wellington Point Commercial Development
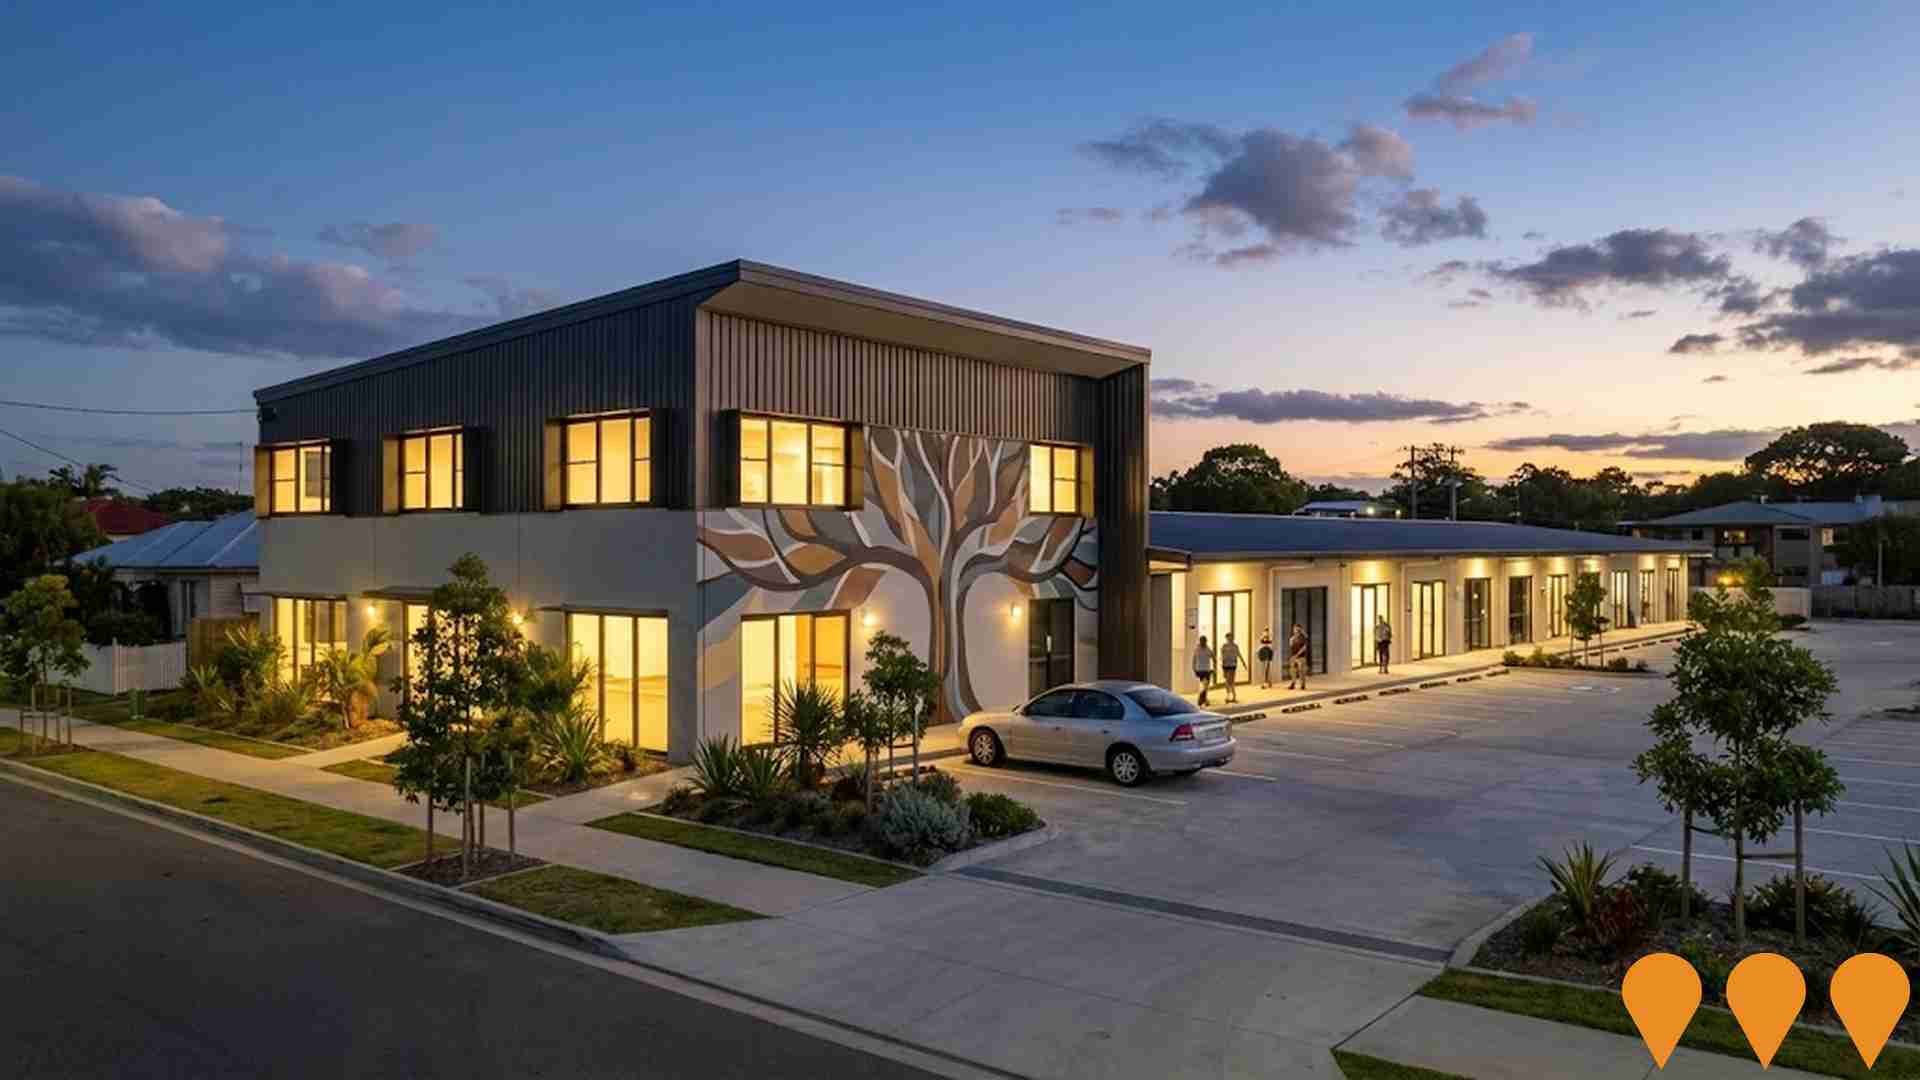
New base build retail development delivering four shop tenancies. Works included civil earthworks, detailed excavation, block and structural steel superstructure, and base build fit out with infrastructure services.
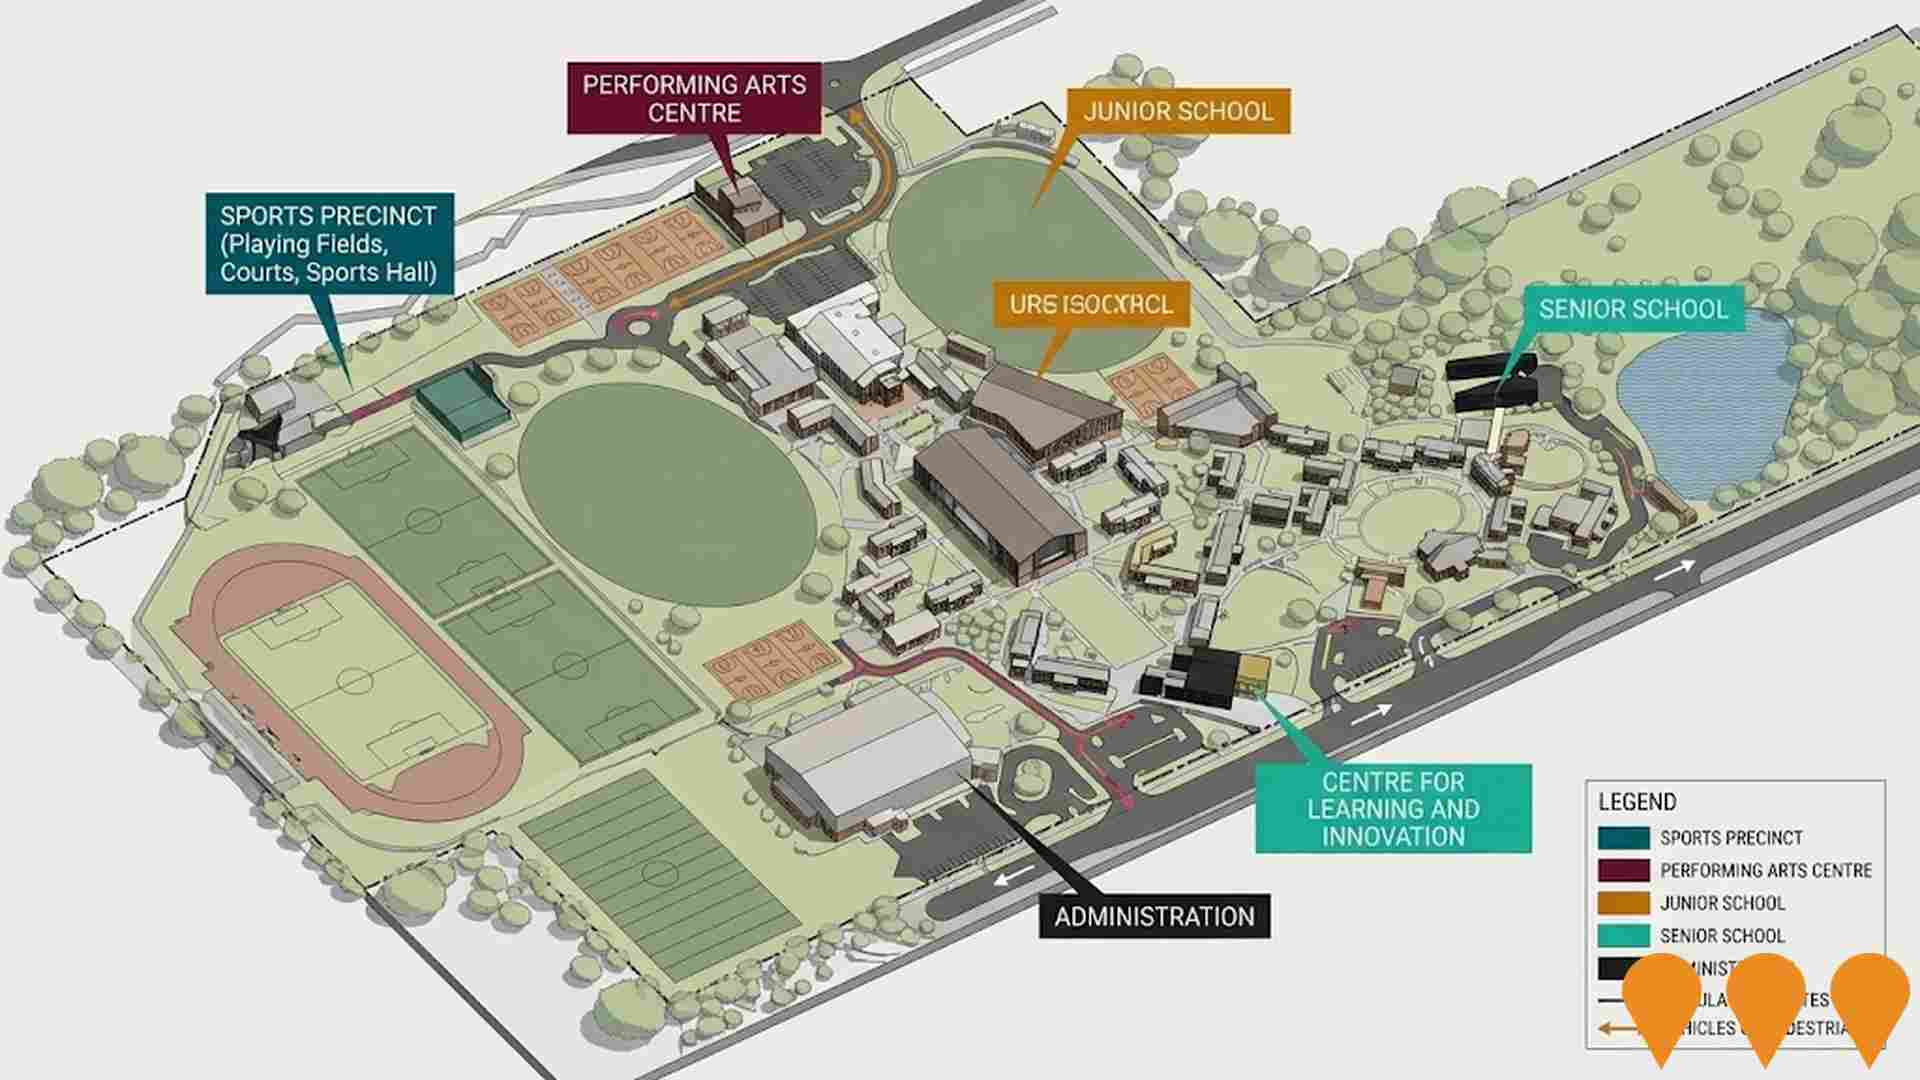
Ormiston College Master Plan Redevelopment
Multi-stage campus expansion including new Performing Arts Centre, STEM facilities and sports precinct upgrades, currently under construction.
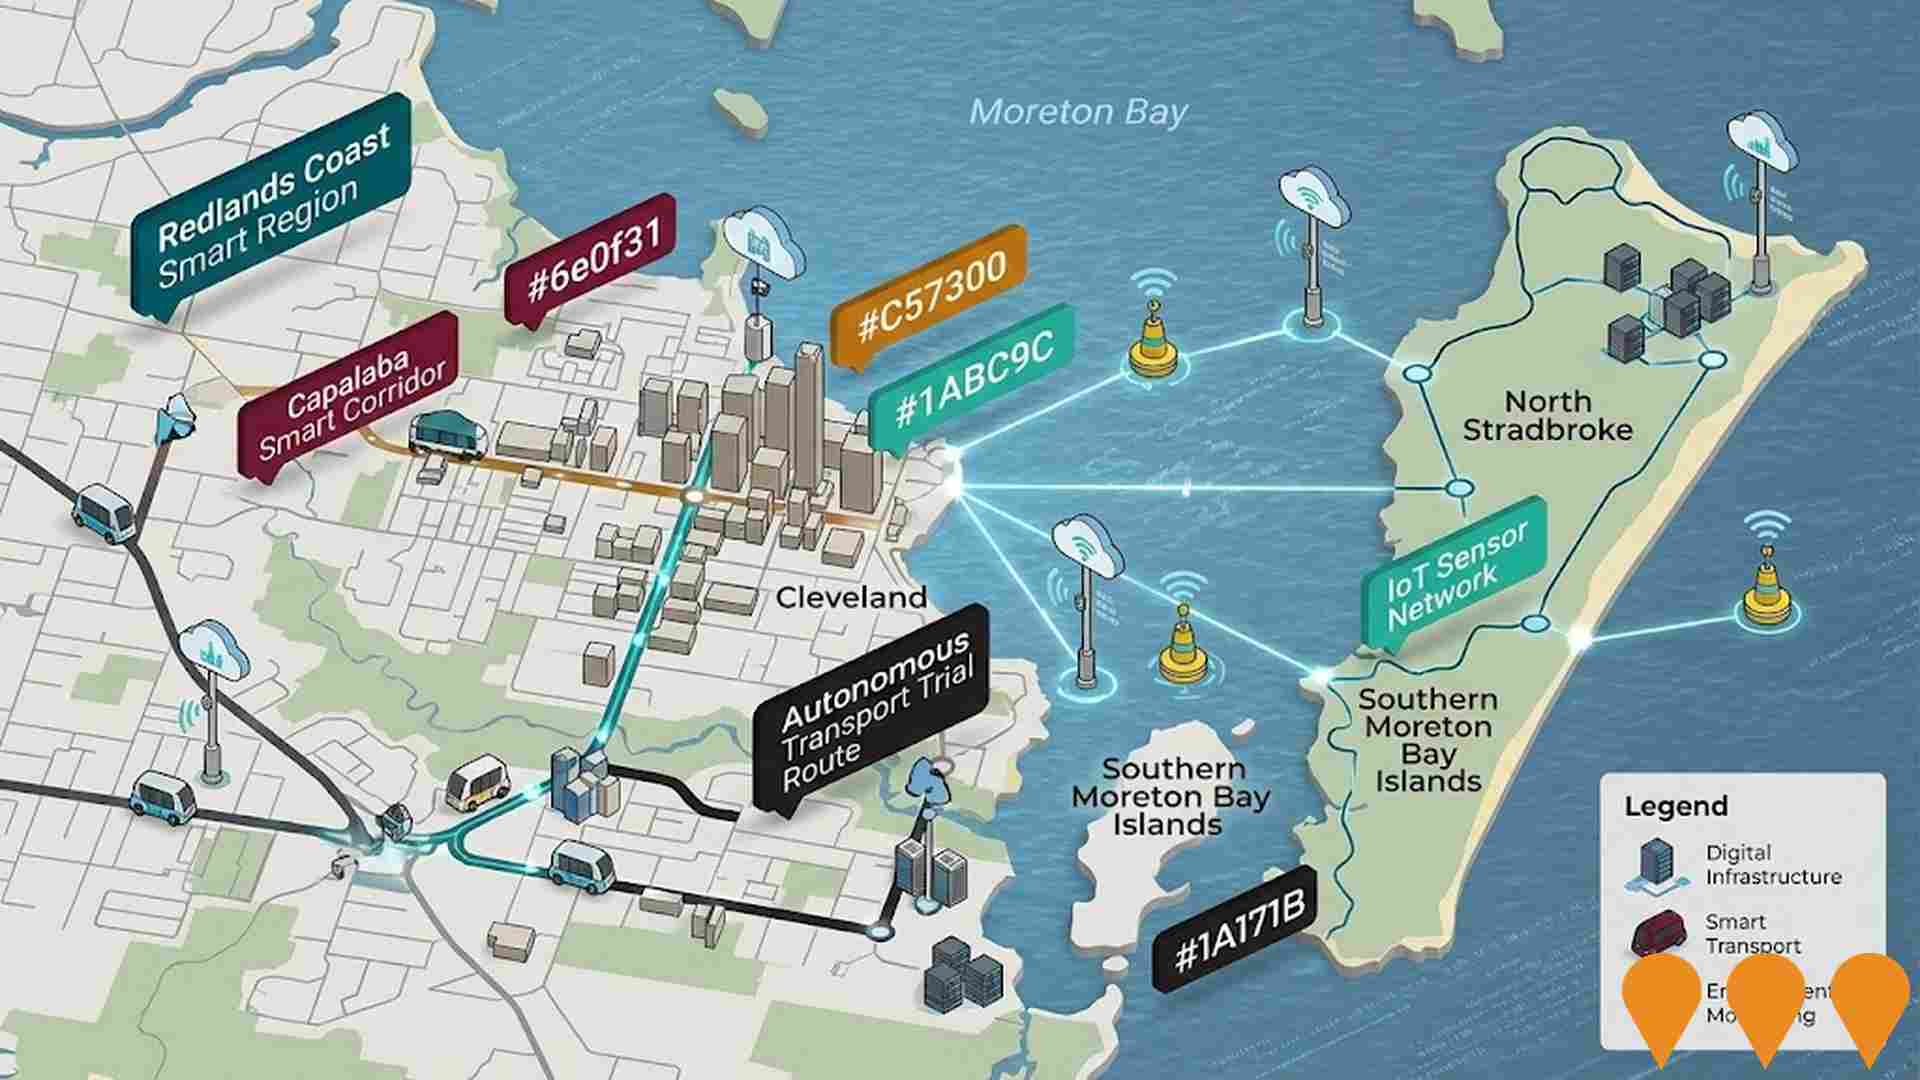
Redlands Coast Smart and Connected City Strategy
Ongoing multi-year initiative by Redland City Council to enhance liveability, prosperity, and sustainability through smart solutions, including digital infrastructure, IoT sensors, smart traffic systems, and data-driven management. Focus areas include liveability, productivity, innovation, sustainability, and governance. Examples of initiatives: RACQ Smart Shuttle driverless bus trial, smart koala monitoring, and intelligent water monitoring programs. The strategy supports regional collaboration, such as the SEQ Smart Region Digital Plan.
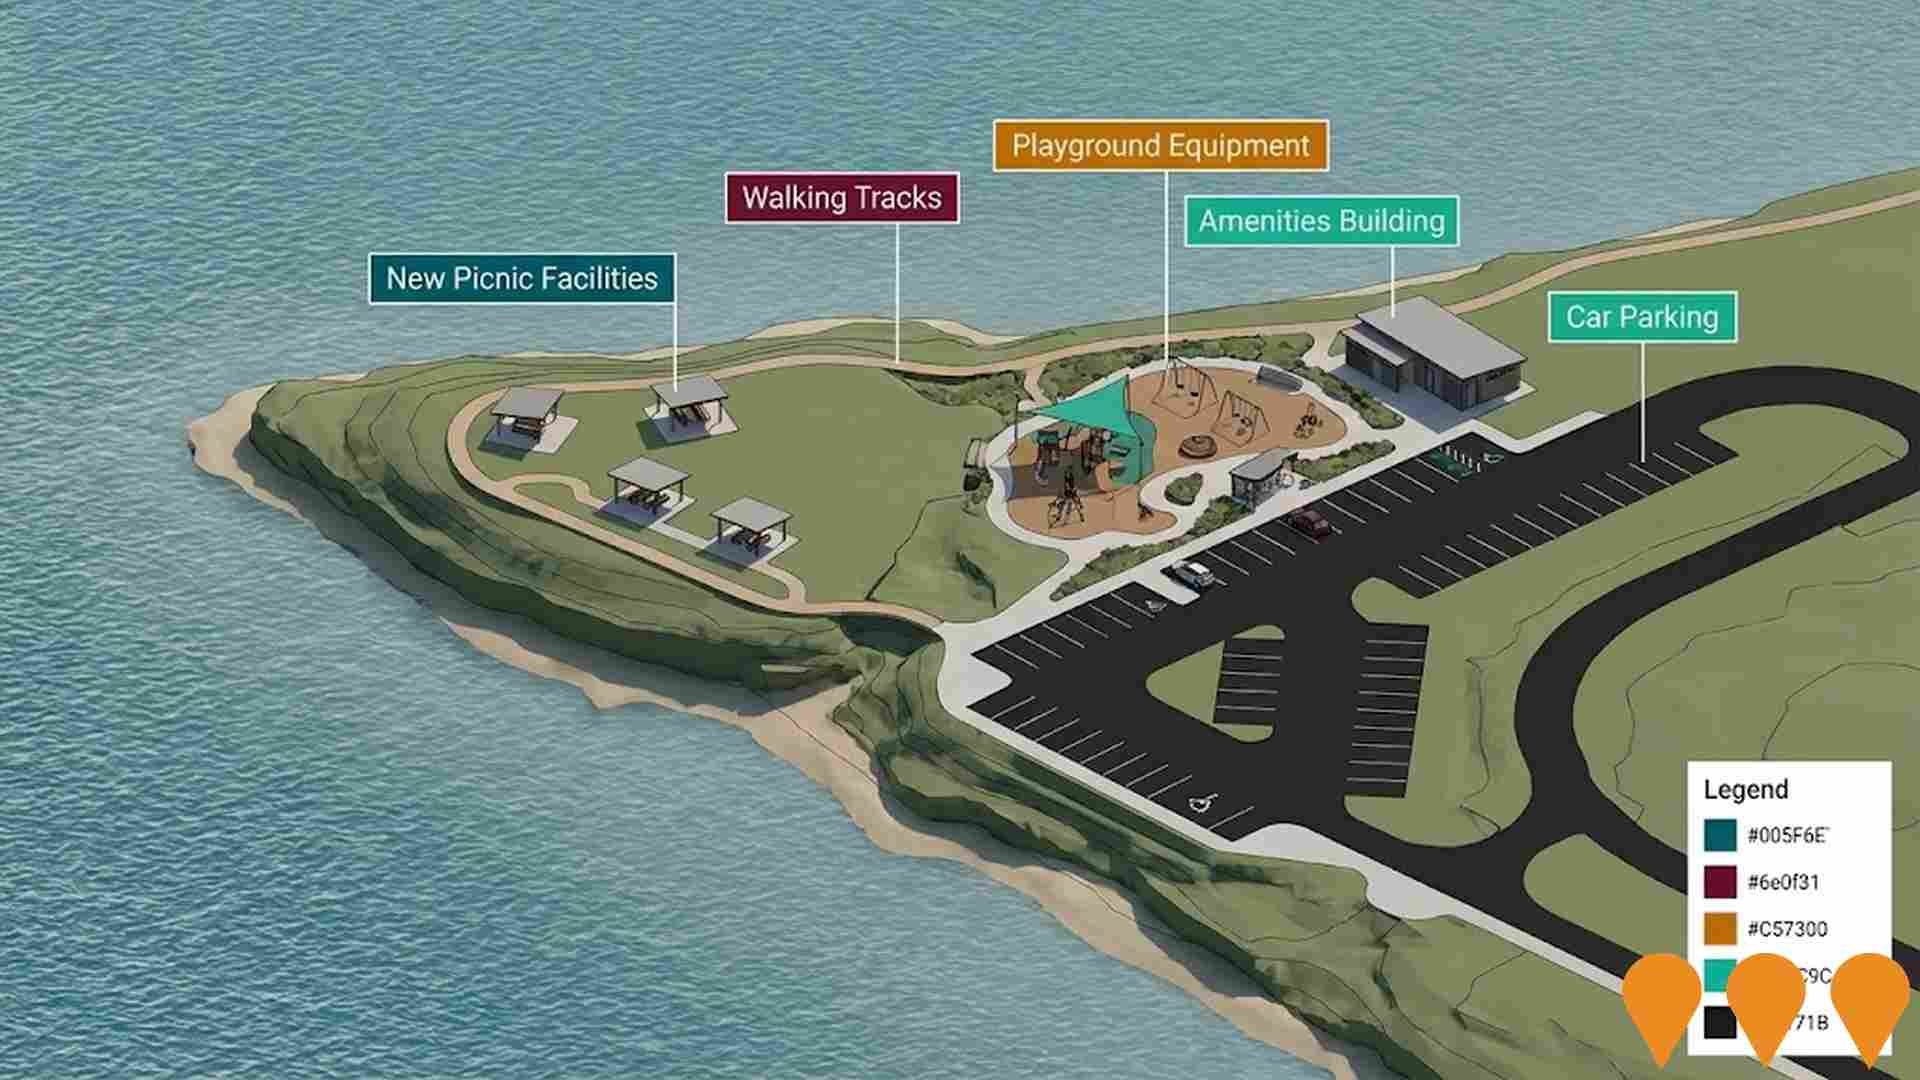
Wellington Point Recreation Reserve Upgrade
$3 million upgrade to Wellington Point Recreation Reserve providing new picnic facilities, walking tracks, playground equipment, amenities building, car parking and landscaping. Enhances foreshore recreation opportunities for families.
Employment
The exceptional employment performance in Wellington Point places it among Australia's strongest labour markets
Wellington Point has a skilled workforce with essential services sectors well represented. The unemployment rate was 1.9% in the past year, with an estimated employment growth of 5.9%.
As of September 2025, there are 7,472 residents employed, and the unemployment rate is 2.1%, lower than Greater Brisbane's rate of 4.0%. Workforce participation is at 66.7%, compared to Greater Brisbane's 64.5%. Key industries include health care & social assistance, construction, and education & training. Construction employment levels are notably high at 1.2 times the regional average.
Conversely, professional & technical services show lower representation at 7.0% versus the regional average of 8.9%. The area offers limited local employment opportunities, as indicated by Census data on working population versus resident population. Between September 2024 and September 2025, employment levels increased by 5.9%, while labour force increased by 5.7%, leading to a decrease in unemployment of 0.2 percentage points. In comparison, Greater Brisbane recorded employment growth of 3.8% over the same period. State-level data from November 25 shows Queensland's employment contracted by 0.01%, with an unemployment rate of 4.2%. Nationally, employment is forecast to expand by 6.6% over five years and 13.7% over ten years. Applying these projections to Wellington Point's employment mix suggests local employment should increase by 6.5% over five years and 13.5% over ten years.
Frequently Asked Questions - Employment
Income
Income metrics indicate excellent economic conditions, with the area achieving higher performance than 75% of national locations assessed by AreaSearch
Wellington Point SA2 has a high national income level according to latest ATO data aggregated by AreaSearch for financial year 2022. The median income among taxpayers is $56,553 and the average income stands at $76,601. These figures compare to Greater Brisbane's median of $55,645 and average of $70,520 respectively. Based on Wage Price Index growth of 13.99% since financial year 2022, current estimates would be approximately $64,465 (median) and $87,317 (average) as of September 2025. According to 2021 Census figures, household, family and personal incomes in Wellington Point cluster around the 69th percentile nationally. Distribution data shows that 31.5% of residents (3,887 people) fall within the $1,500 - 2,999 income bracket, mirroring regional levels where 33.3% occupy this bracket. Wellington Point demonstrates considerable affluence with 33.6% earning over $3,000 per week. Housing accounts for 13.5% of income while strong earnings rank residents within the 79th percentile for disposable income. The area's SEIFA income ranking places it in the 7th decile.
Frequently Asked Questions - Income
Housing
Wellington Point is characterized by a predominantly suburban housing profile, with above-average rates of outright home ownership
Wellington Point's dwelling structure, as per the latest Census, consisted of 88.6% houses and 11.4% other dwellings (semi-detached, apartments, 'other' dwellings), compared to Brisbane metro's 85.0% houses and 15.1% other dwellings. Home ownership in Wellington Point stood at 36.3%, with mortgaged dwellings at 42.9% and rented ones at 20.8%. The median monthly mortgage repayment was $2,013, higher than Brisbane metro's average of $1,950. The median weekly rent in Wellington Point was $450, compared to Brisbane metro's $405. Nationally, Wellington Point's mortgage repayments exceeded the Australian average of $1,863, and rents were substantially above the national figure of $375.
Frequently Asked Questions - Housing
Household Composition
Wellington Point features high concentrations of family households, with a higher-than-average median household size
Family households account for 82.0% of all households, including 38.8% that are couples with children, 30.1% that are couples without children, and 11.9% that are single parent families. Non-family households make up the remaining 18.0%, with lone person households at 16.3% and group households comprising 1.6%. The median household size is 2.8 people, which is larger than the Greater Brisbane average of 2.7.
Frequently Asked Questions - Households
Local Schools & Education
The educational profile of Wellington Point exceeds national averages, with above-average qualification levels and academic performance metrics
University qualification levels in Wellington Point are at 25.9%, slightly below the Greater Brisbane average of 30.5%. Bachelor degrees are most common at 17.5%, followed by postgraduate qualifications (5.2%) and graduate diplomas (3.2%). Vocational credentials are held by 38.8% of residents aged 15+, with advanced diplomas at 14.2% and certificates at 24.6%.
Educational participation is high, with 29.0% currently enrolled in formal education. This includes secondary education (10.2%), primary education (9.3%), and tertiary education (4.8%).
Frequently Asked Questions - Education
Schools Detail
Nearby Services & Amenities
Transport
Transport servicing is moderate compared to other areas nationally based on assessment of service frequency, route connectivity and accessibility
Wellington Point has 41 active public transport stops, serving a mix of train and bus routes. These stops are covered by 26 individual routes, which together facilitate 1,952 weekly passenger trips. The area's transport accessibility is rated as good, with residents on average being located 242 meters from the nearest stop.
Service frequency across all routes averages 278 trips per day, equating to approximately 47 weekly trips per individual stop.
Frequently Asked Questions - Transport
Transport Stops Detail
Health
Wellington Point's residents are healthier than average in comparison to broader Australia with a fairly standard level of common health conditions seen across both young and old age cohorts
Wellington Point's health data shows positive results, with common conditions seen equally across young and older residents. Private health cover is high at approximately 58%, compared to 55.1% in Greater Brisbane.
The most prevalent conditions are asthma (8.1%) and arthritis (7.9%). About 68.3% of residents report no medical ailments, slightly higher than the 66.8% in Greater Brisbane. Residents aged 65 and over comprise 21.4%, compared to 20.0% in Greater Brisbane. Health outcomes among seniors are above average, outperforming the general population in health metrics.
Frequently Asked Questions - Health
Cultural Diversity
In terms of cultural diversity, Wellington Point records figures broadly comparable to the national average, as found in AreaSearch's assessment of a number of language and cultural background related metrics
Wellington Point's population, born in Australia, is 74.6%, with 89.9% being citizens and 93.3% speaking English only at home. Christianity is the predominant religion, practiced by 57.3% of Wellington Point residents, compared to 53.3% across Greater Brisbane. The top three ancestral groups are English (32.6%), Australian (24.2%), and Irish (9.6%).
Notably, Welsh ancestry is higher at 0.9%, New Zealand at 1.3%, and South African at 1.2%, compared to regional averages of 0.5%, 1.2%, and 0.7% respectively.
Frequently Asked Questions - Diversity
Age
Wellington Point's median age exceeds the national pattern
The median age in Wellington Point is 43 years, which is significantly higher than Greater Brisbane's average of 36 years, and also older than Australia's median age of 38 years. The 55-64 age group constitutes 14.5% of the population in Wellington Point, compared to a lower percentage in Greater Brisbane. Meanwhile, the 25-34 age group makes up only 6.8%. According to post-2021 Census data, the 75 to 84 age group has increased from 5.3% to 7.4%, while the 15 to 24 cohort has risen from 13.0% to 14.2%. Conversely, the 5 to 14 age group has decreased from 13.8% to 12.3%, and the 25 to 34 group has dropped from 8.2% to 6.8%. Population forecasts for the year 2041 indicate substantial demographic changes in Wellington Point. The 75 to 84 age group is projected to grow by 55% (adding 496 people), reaching a total of 1,405 from its previous number of 908. Notably, the combined age groups of 65 and above will account for 93% of the total population growth in Wellington Point, reflecting the area's aging demographic trend. In contrast, the 0 to 4 and 15 to 24 age cohorts are expected to experience population declines.
