Chart Color Schemes
This analysis uses ABS Statistical Areas Level 2 (SA2) boundaries, which can materially differ from Suburbs and Localities (SAL) even when sharing similar names.
SA2 boundaries are defined by the Australian Bureau of Statistics and are designed to represent communities for statistical reporting (e.g., census and ERP).
Suburbs and Localities (SAL) represent commonly-used suburb/locality names (postal-style areas) and may use different geographic boundaries. For comprehensive analysis, consider reviewing both boundary types if available.
est. as @ -- *
ABS ERP | -- people | --
2021 Census | -- people
Sales Activity
Curious about local property values? Filter the chart to assess the volume and appreciation (including resales) trends and regional comparisons, or scroll to the map below view this information at an individual property level.
Find a Recent Sale
Sales Detail
Population
Thornlands lies within the top quartile of areas nationally for population growth performance according to AreaSearch analysis of recent, and medium to long-term trends
Thornlands' population was approximately 21,829 as of November 2025. This represented an increase of 2,566 people from the 2021 Census figure of 19,263, reflecting a growth rate of 13.3%. The estimated resident population in June 2024 was 21,476, with an additional 402 validated new addresses since the Census date contributing to this increase. This resulted in a population density ratio of 1,008 persons per square kilometer. Thornlands' growth rate exceeded both the SA4 region's 7.7% and the national average during this period. Interstate migration accounted for approximately 52.7% of overall population gains.
AreaSearch uses ABS/Geoscience Australia projections released in 2024 with a base year of 2022 for each SA2 area. For areas not covered by this data, and years post-2032, Queensland State Government's SA2 area projections from 2023 based on 2021 data are adopted, with proportional growth weightings applied for age cohorts. Future population trends project an above median growth for the area, with an expected increase of 3,792 persons to 2041, reflecting a total gain of 15.8% over the 17-year period.
Frequently Asked Questions - Population
Development
The level of residential development activity in Thornlands was found to be higher than 90% of real estate markets across the country
Thornlands has averaged approximately 128 new dwelling approvals annually over the past five financial years, totalling 644 homes. As of FY-26, 59 approvals have been recorded. Over these five years (FY-21 to FY-25), an average of 5.7 new residents has arrived per year for each dwelling constructed, indicating demand outstripping supply and potentially driving price growth and increased buyer competition. The average construction cost of new properties is $256,000, which is below the regional average, suggesting more affordable housing options.
In FY-26, commercial approvals have totalled $9.6 million, showing moderate levels of commercial development. Compared to Greater Brisbane, Thornlands has around two-thirds the rate of new dwelling approvals per person and ranks in the 72nd percentile nationally for areas assessed. New developments consist of 68.0% detached houses and 32.0% medium and high-density housing, with a growing mix of townhouses and apartments offering options across different price points. This shift marks a departure from existing housing patterns, which are currently 87.0% houses, suggesting diminishing developable land availability and responding to evolving lifestyle preferences and affordability needs.
With around 180 people per approval, Thornlands reflects a developing area. By 2041, population forecasts indicate an increase of 3,439 residents (based on the latest AreaSearch quarterly estimate). Current construction levels should meet demand adequately, creating favourable conditions for buyers while potentially enabling growth that exceeds current forecasts.
Frequently Asked Questions - Development
Infrastructure
Thornlands has emerging levels of nearby infrastructure activity, ranking in the 24thth percentile nationally
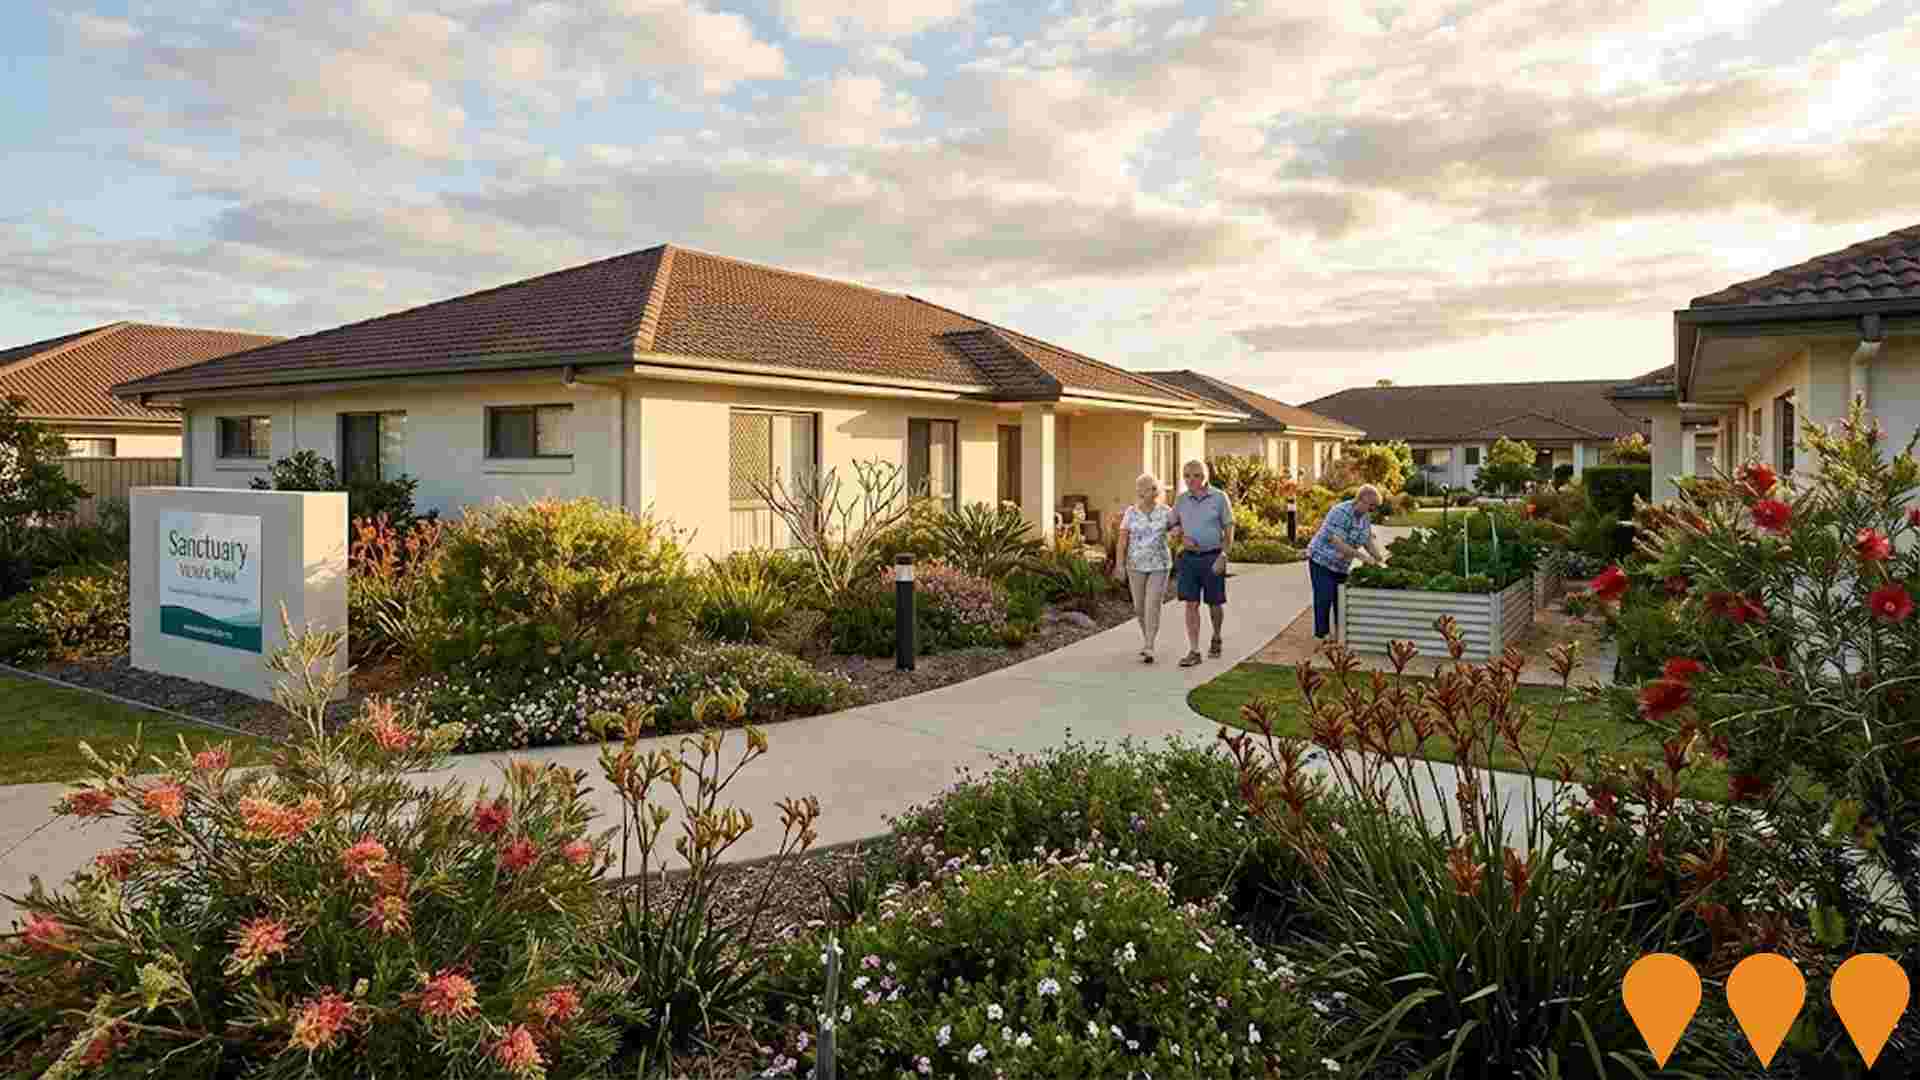
Changes in local infrastructure significantly impact an area's performance. AreaSearch has identified 14 projects that could affect this region. Notable ones include Retirement Facility on Redland Bay Road, Paradise Garden Shopping Village, Cleveland-Redland Bay Road Duplication, and Wellington Street / Panorama Drive Road Upgrade Program. The following list details those most likely to be relevant.
Professional plan users can use the search below to filter and access additional projects.
INFRASTRUCTURE SEARCH
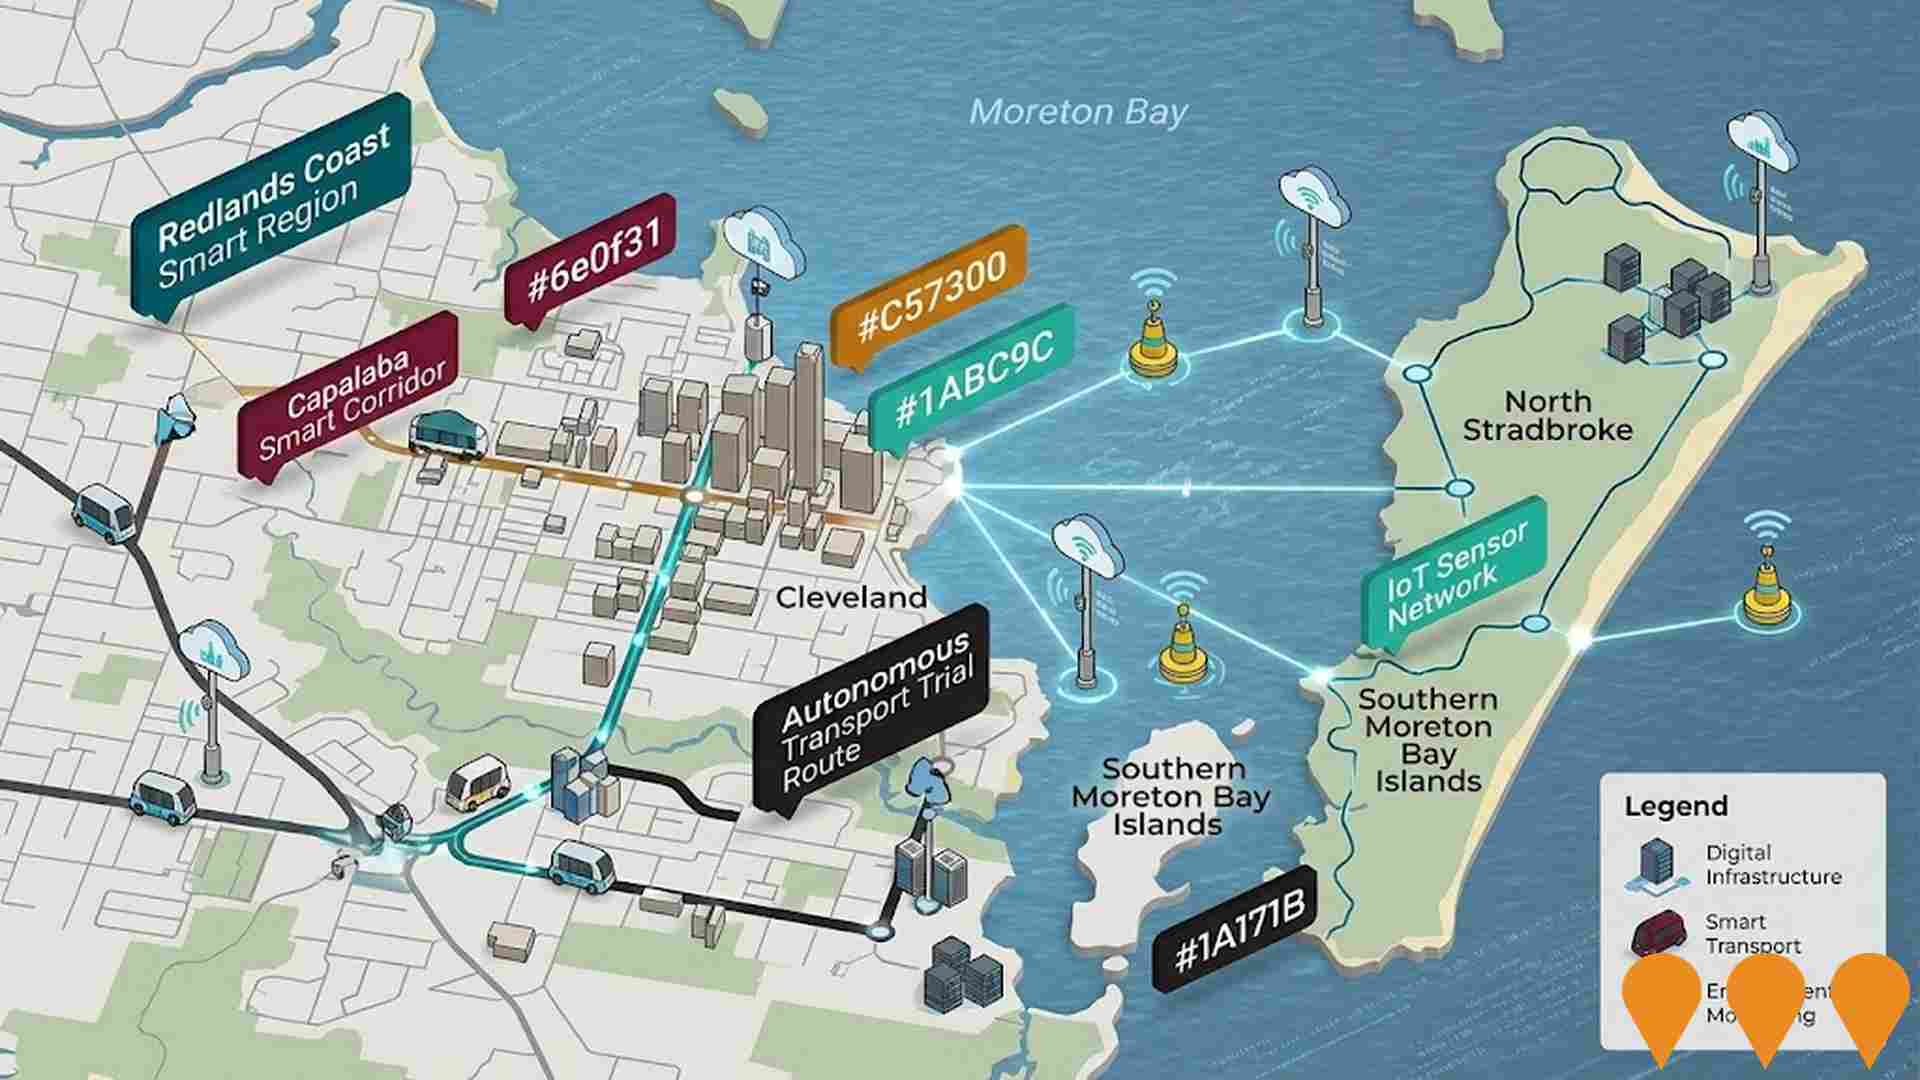
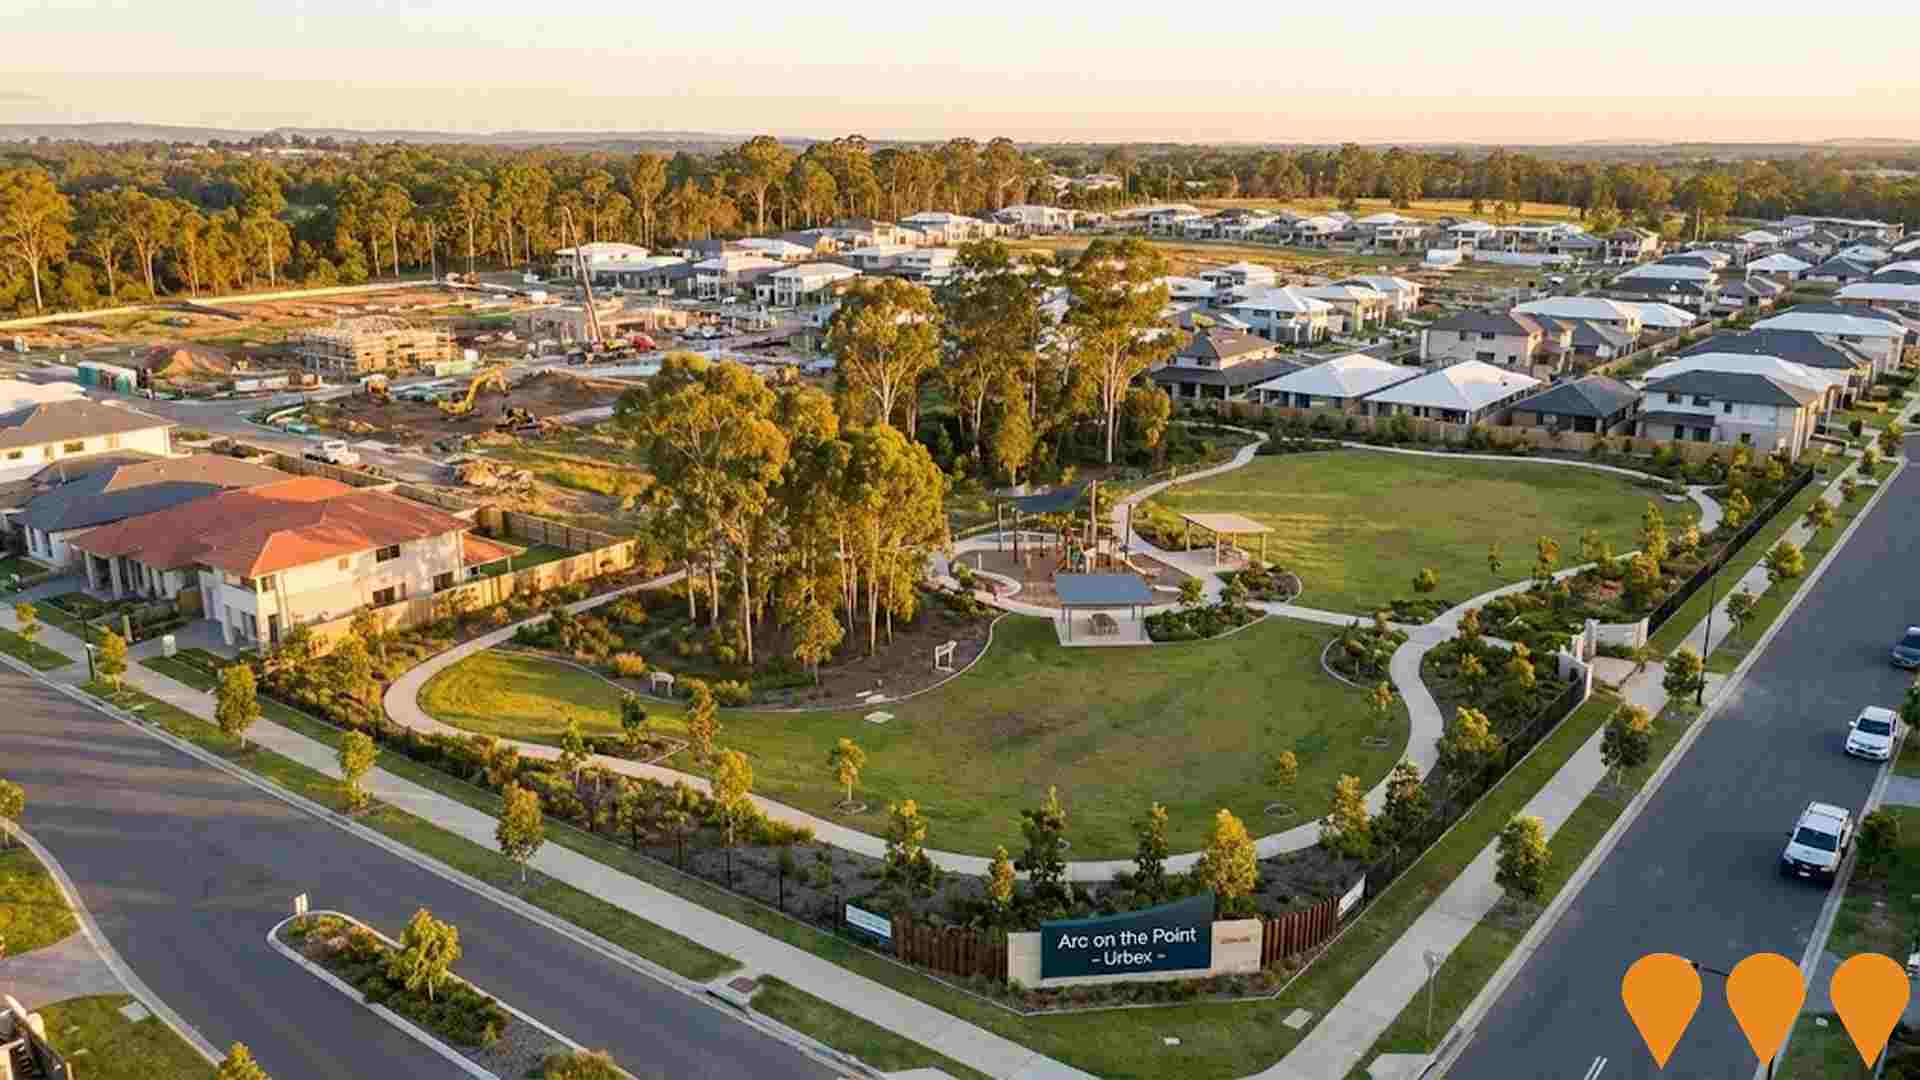
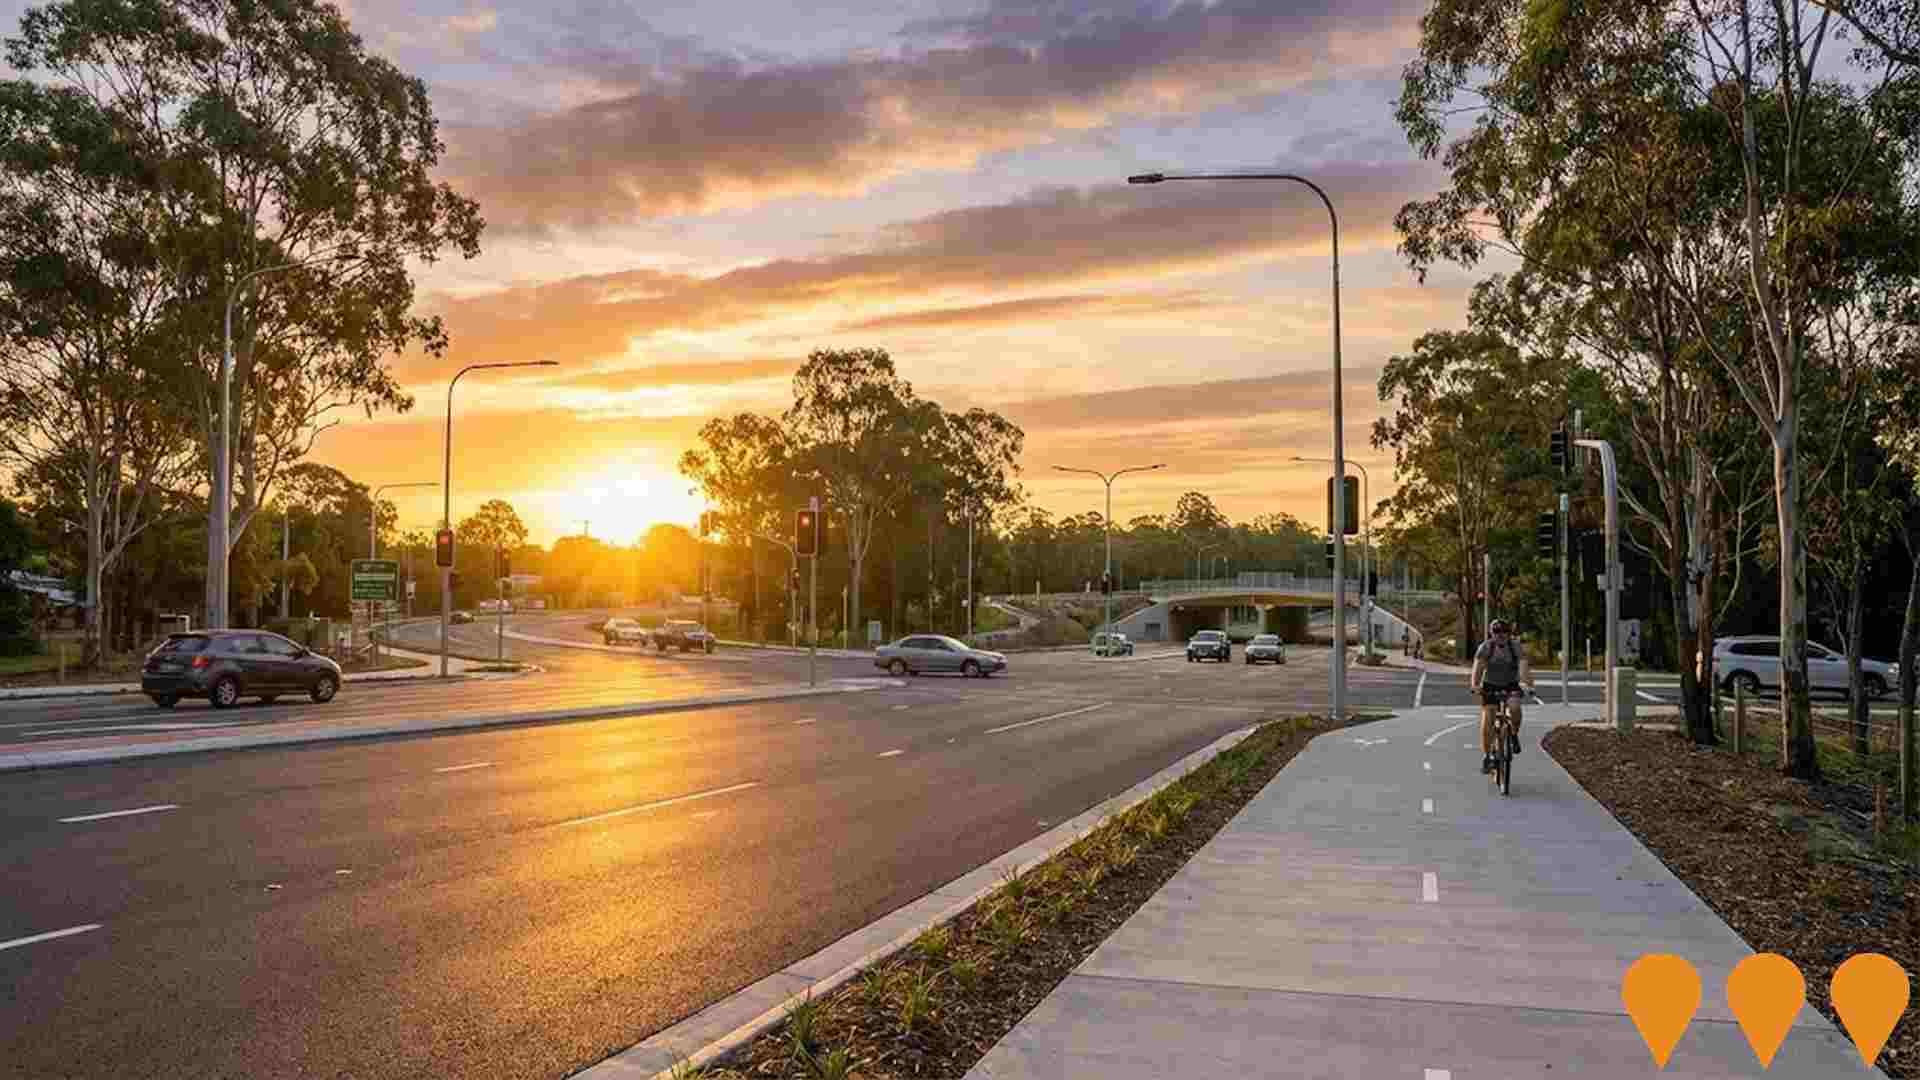
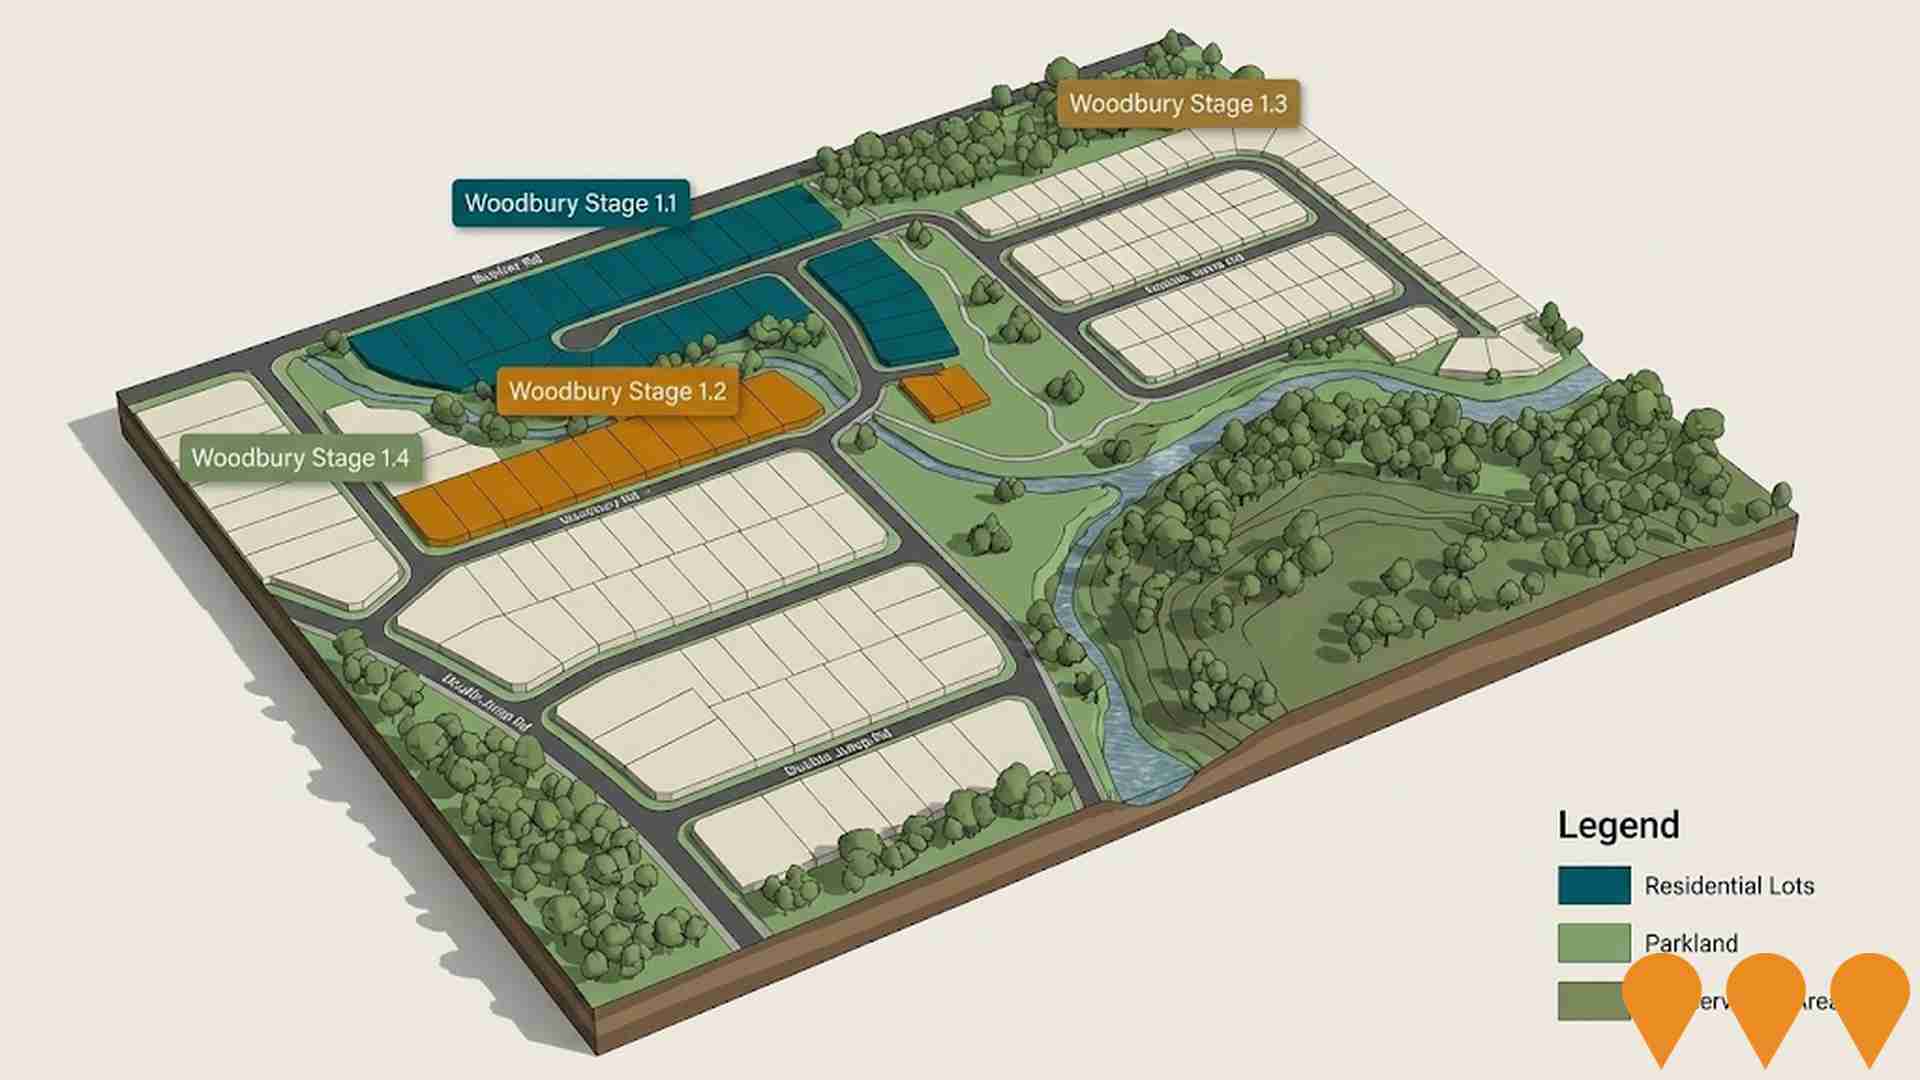
 Denotes AI-based impression for illustrative purposes only, not to be taken as definitive under any circumstances. Please follow links and conduct other investigations from the project's source for actual imagery. Developers and project owners wishing us to use original imagery please Contact Us and we will do so.
Frequently Asked Questions - Infrastructure
Redland Hospital Expansion
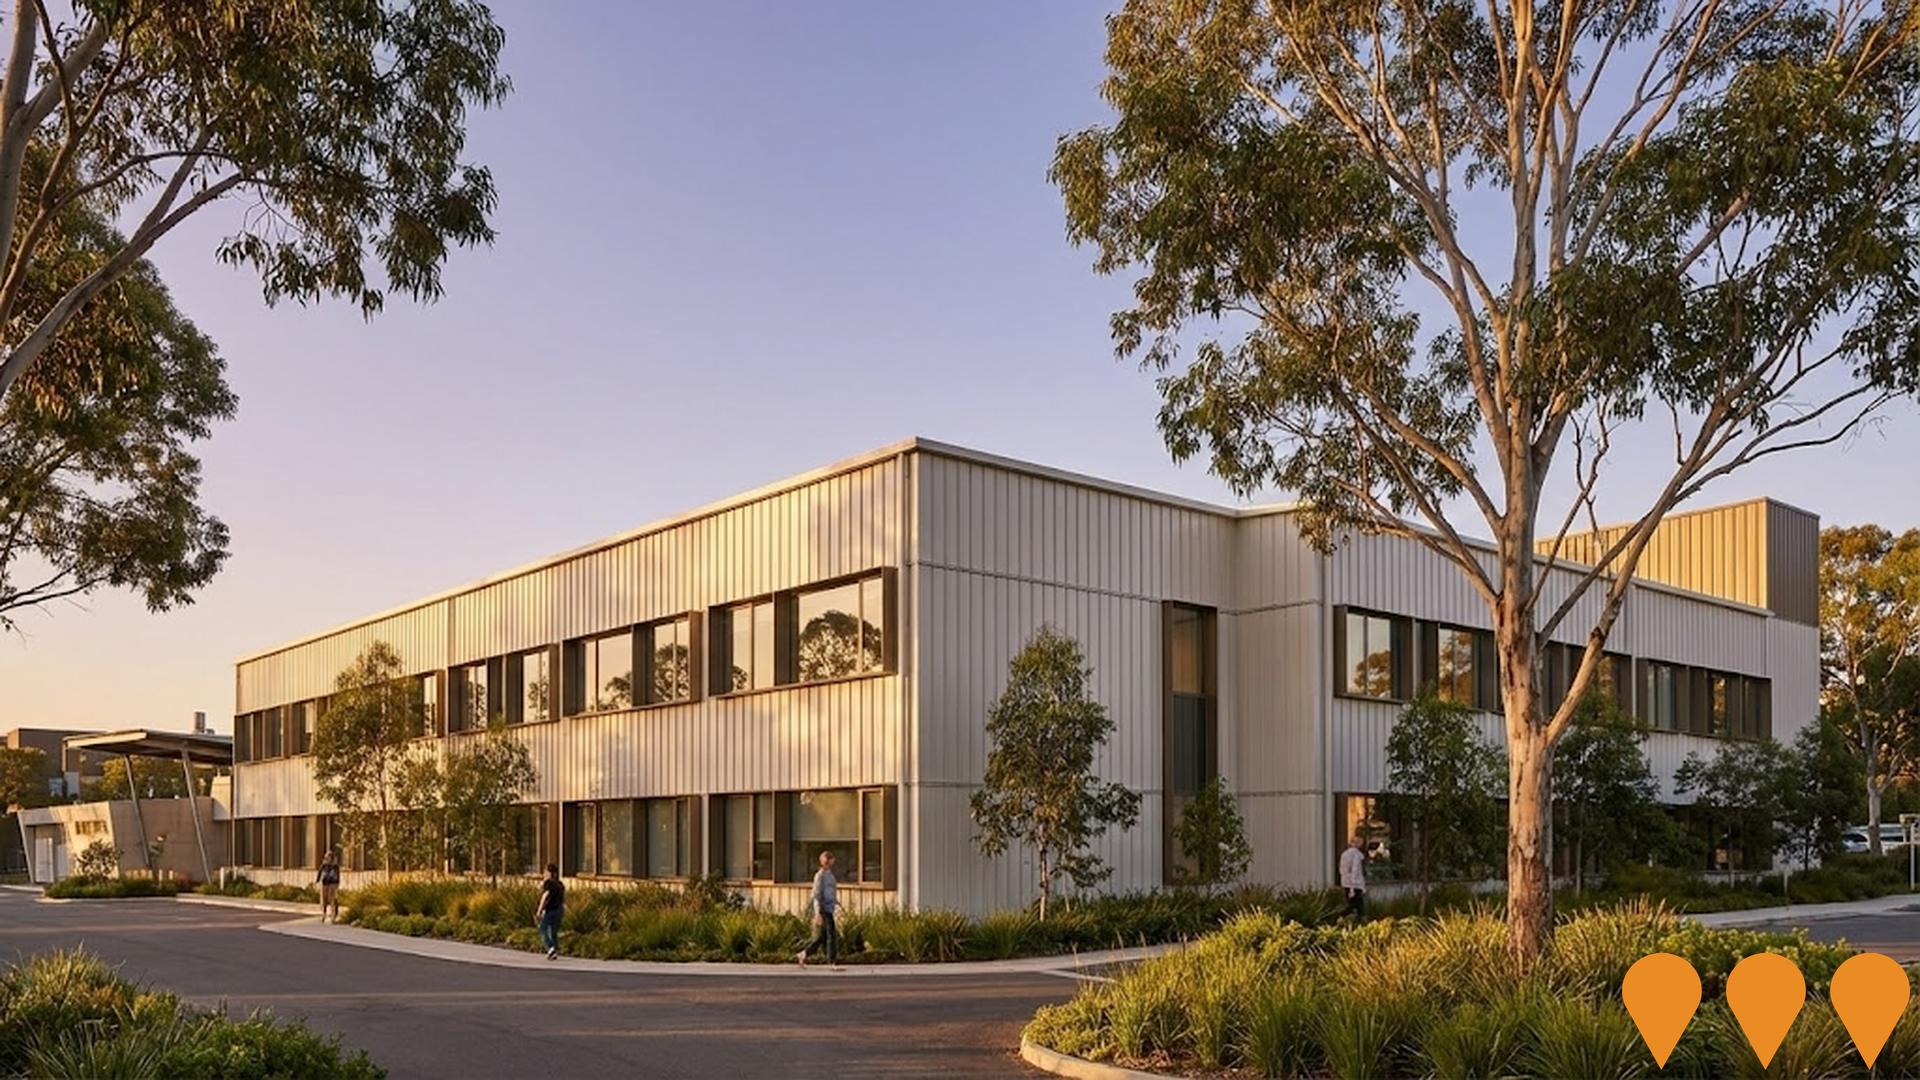
Multi-stage expansion of Redland Hospital in Cleveland to meet growing healthcare demand in Redlands Coast. Completed stages include multi-level car park (1,000+ spaces, 2023), Lagoon Ward (28 beds, 2023), upgraded birthing suite and ED (2020), and Stage 1 clinical services building with new ICU and 37 additional inpatient beds (opened early 2025). Current Stage 2 ($150M) is a new mental health and sub-acute/allied health building delivering 43 beds (20 net new) plus expanded outpatient services - under construction with completion expected mid-2027.
Redlands Health and Wellness Precinct
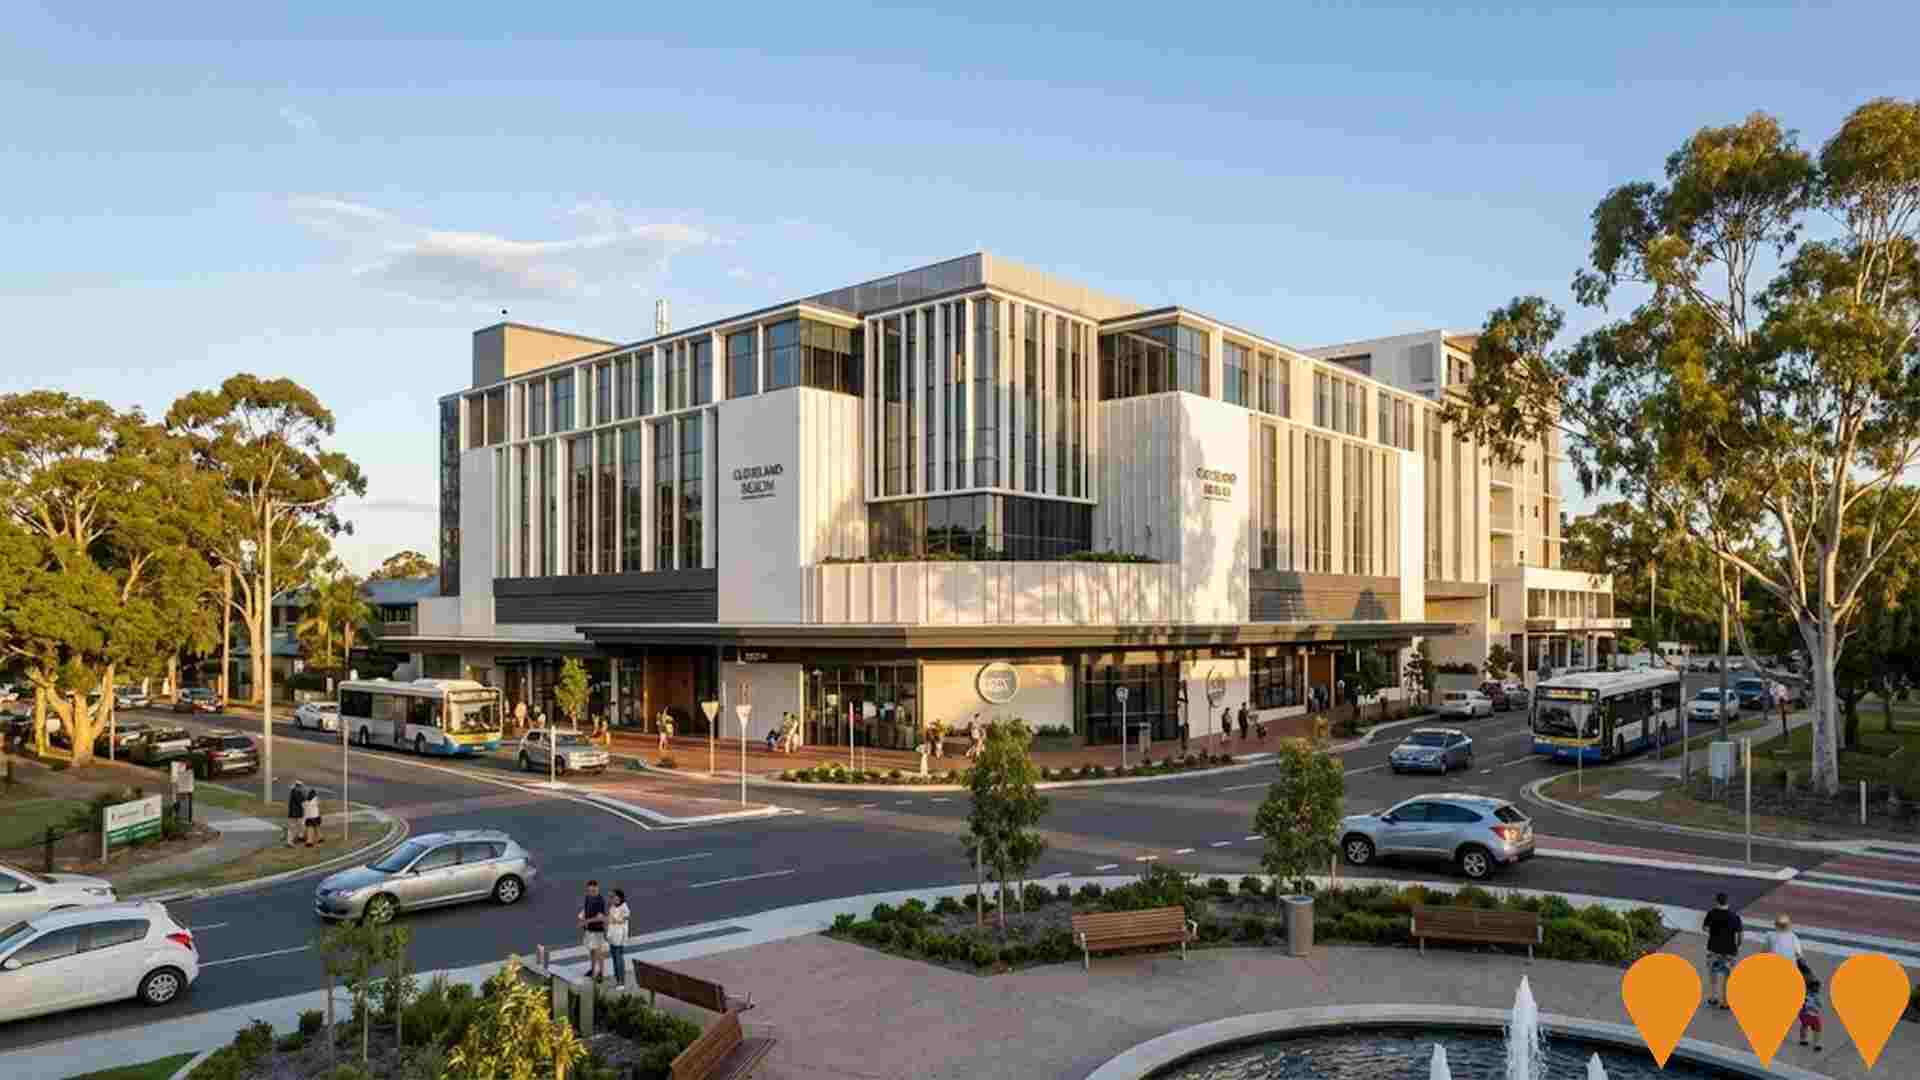
Master-planned health and wellness precinct centred on the expansion of Redland Hospital and integration with Mater Private Hospital. Includes new clinical services buildings, aged care, allied health, medical research and education facilities, wellness amenities, and supporting transport infrastructure. Delivered through partnership between Redland City Council, Metro South Hospital and Health Service, and Mater Health.
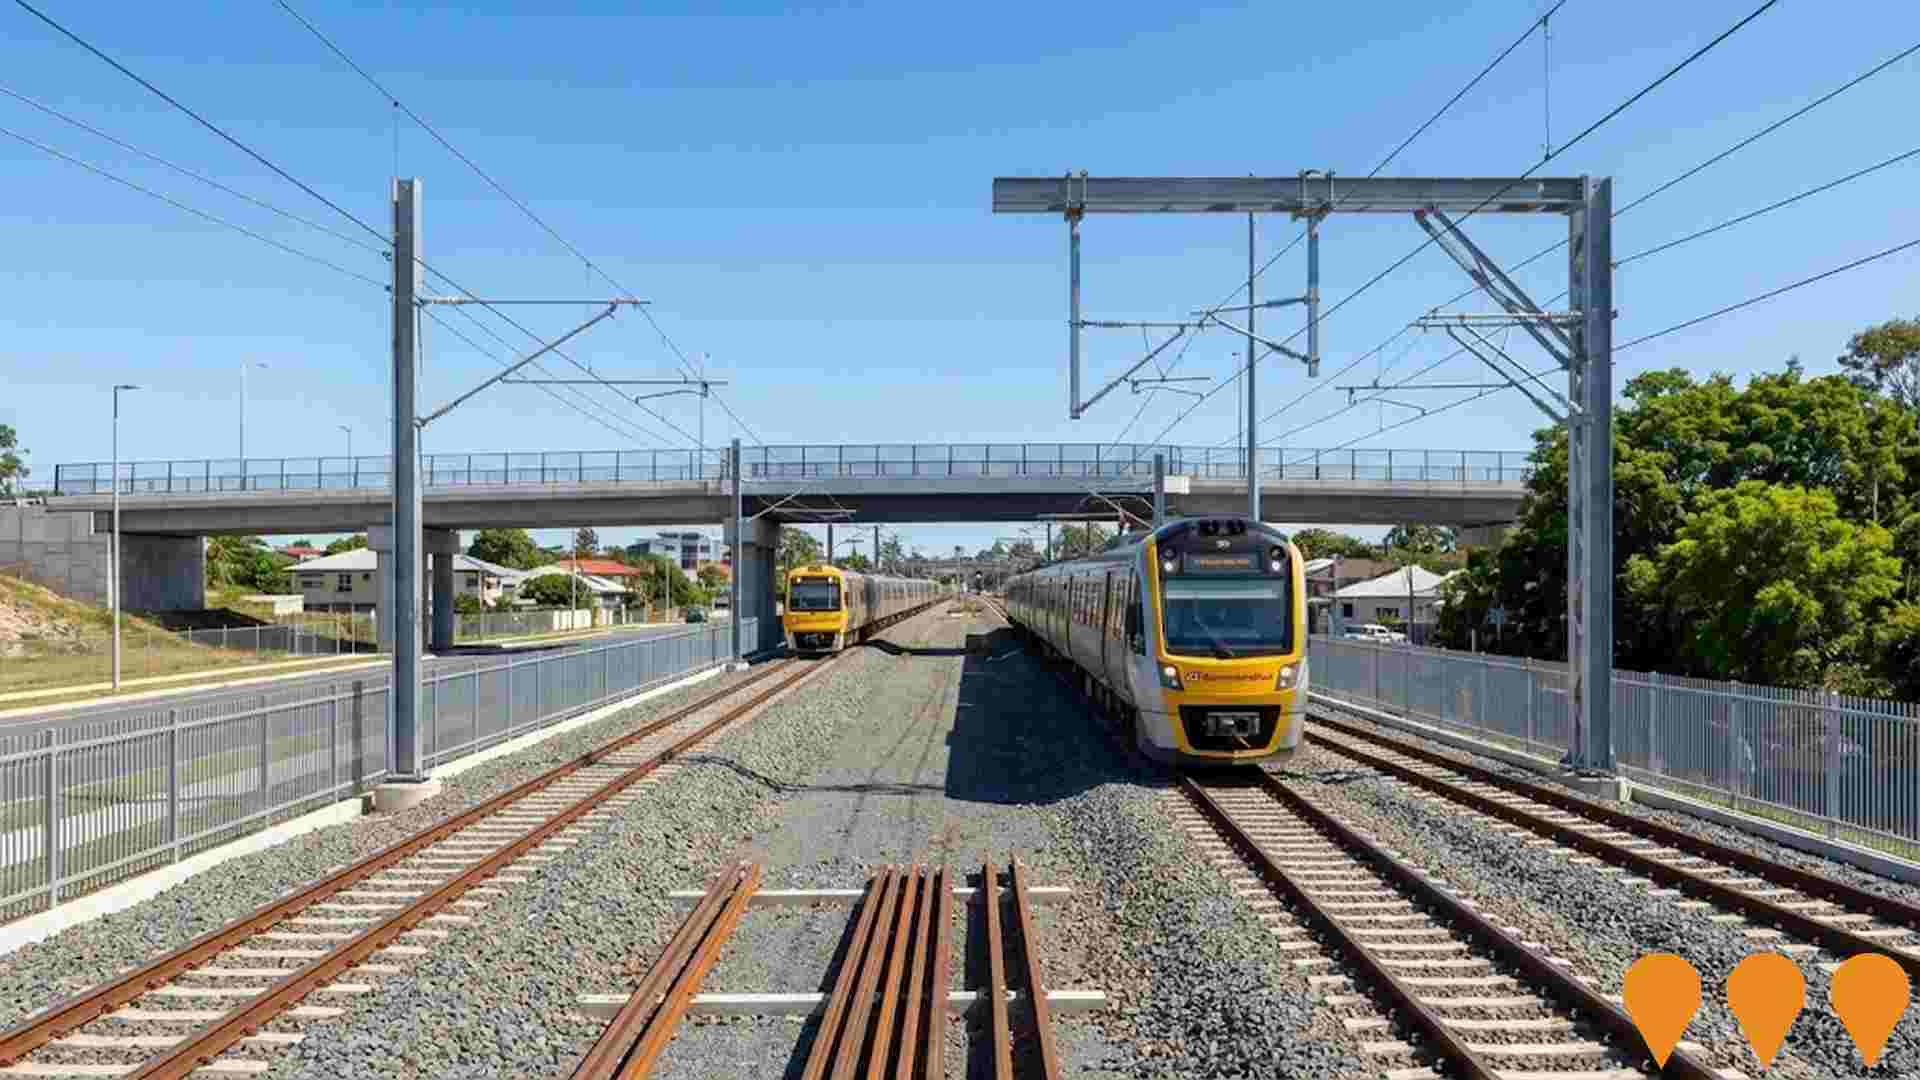
Cleveland Line Duplication (Park Road to Cleveland)
Major upgrade and partial duplication of the Cleveland Line between Park Road and Cleveland stations to increase capacity, improve reliability and enable higher frequency services in preparation for Cross River Rail and the Brisbane 2032 Olympic and Paralympic Games. Works include track duplication (particularly between Lindum and Cleveland), station upgrades, level crossing removals and signalling improvements.
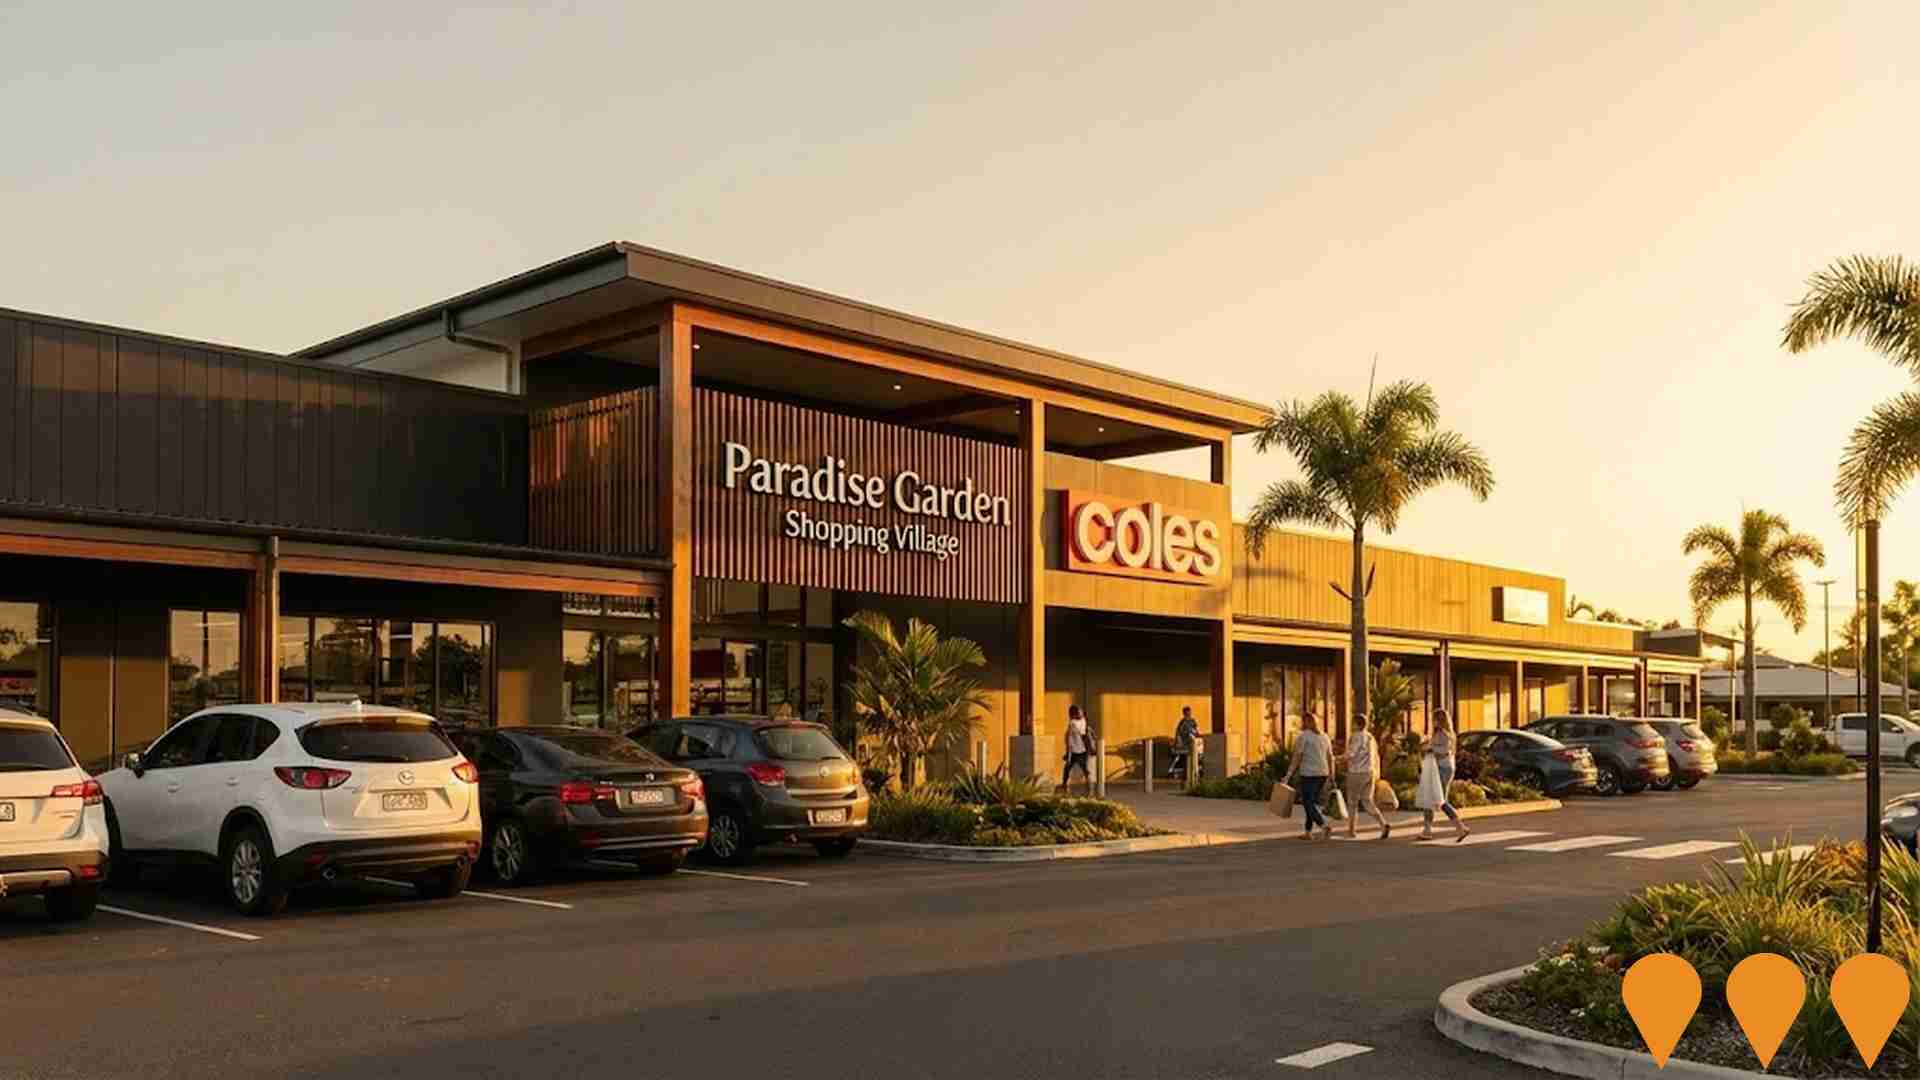
Paradise Garden Shopping Village
A completed Coles-anchored neighbourhood shopping centre with 8,000sqm GFA featuring specialty stores, dining options, medical facilities, BP service station, and 1.4 hectares of green space parkland, serving as a thriving community retail and leisure hub that officially opened May 3, 2024.
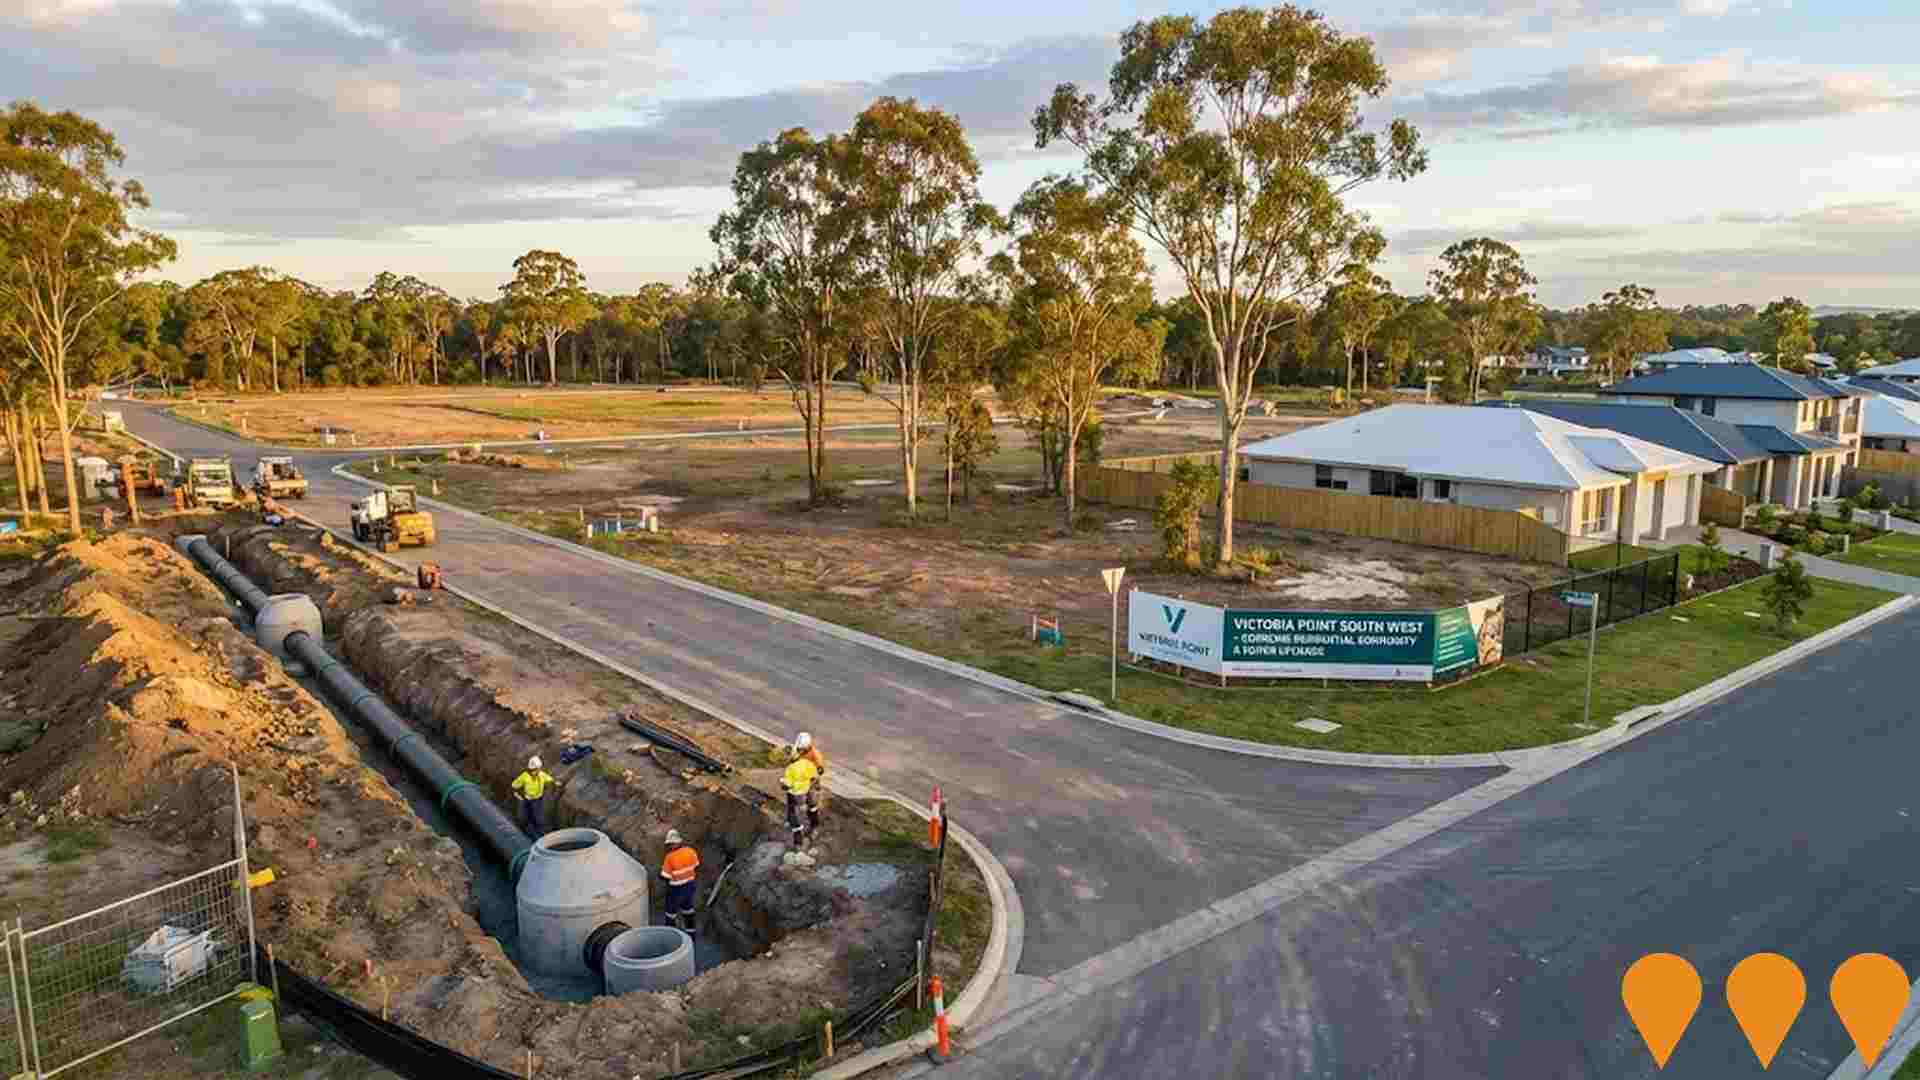
Victoria Point South West Local Plan
Council-adopted local plan guiding future urban development in southwest Victoria Point. The plan supports an emerging residential community with enabling sewer trunk infrastructure already funded and under construction. The local plan is scheduled for incorporation into the next full review of Redland City Plan, targeted for completion by 2028.
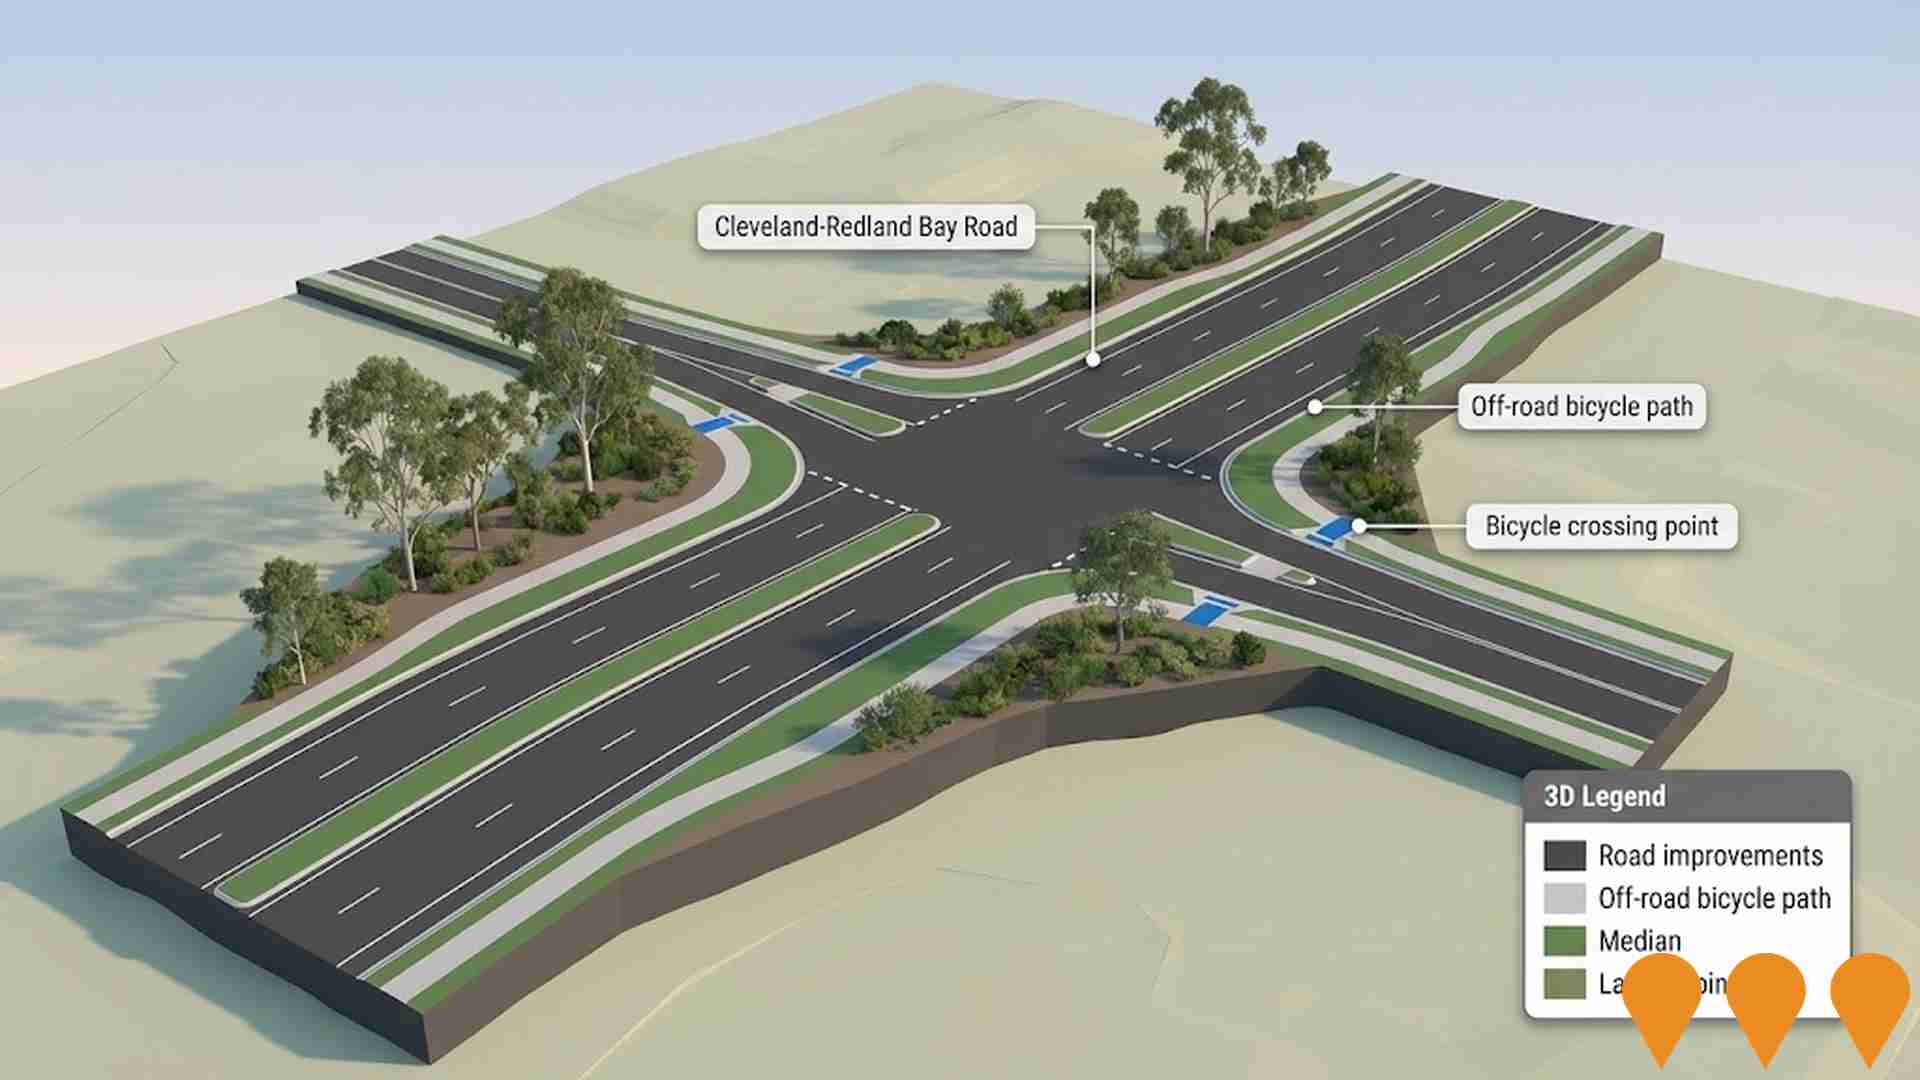
Cleveland-Redland Bay Road Duplication
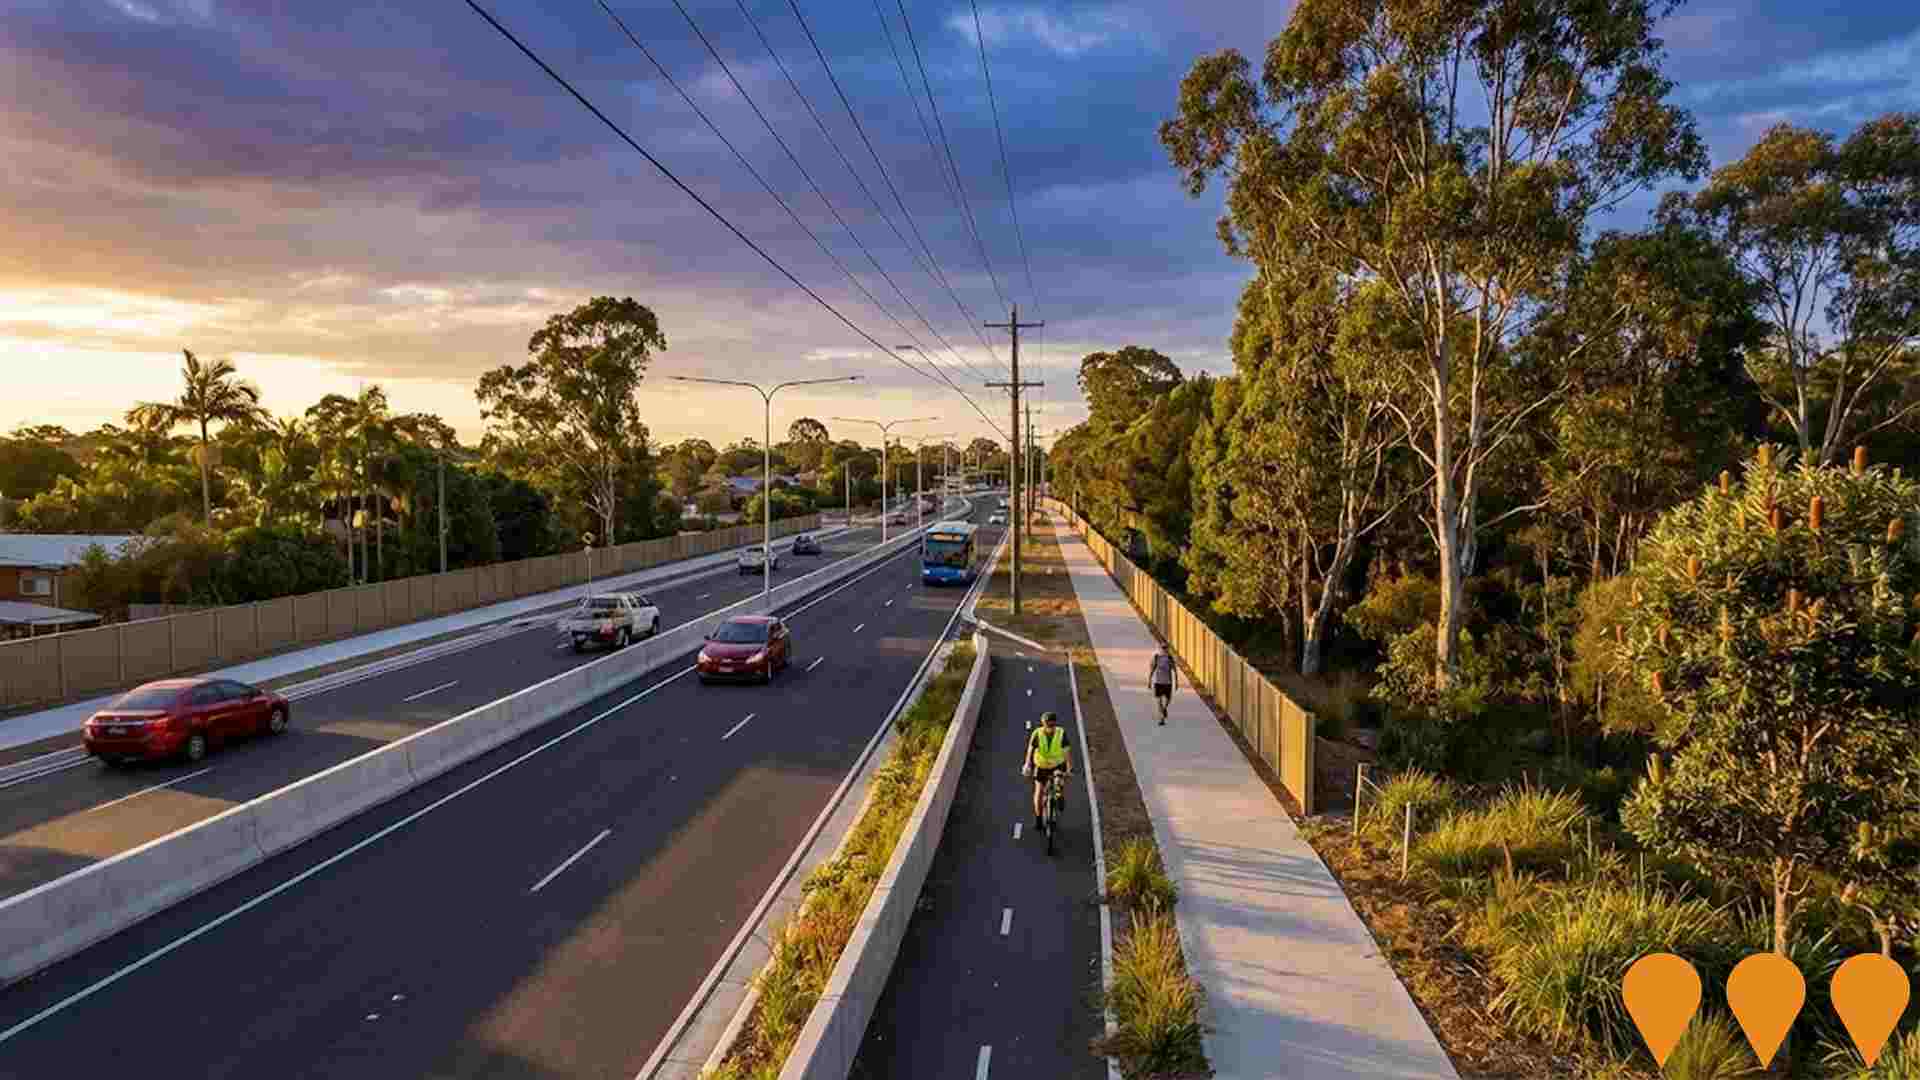
A $110 million road infrastructure project duplicating Cleveland-Redland Bay Road from two to four lanes between Anita Street and Magnolia Parade. Includes intersection upgrades, new pedestrian and cycling infrastructure, improved safety features, noise barriers, and koala fencing to reduce congestion and enhance connectivity. Construction is underway with completion expected by 2026.
Redlands Coast Regional Sport and Recreation Precinct
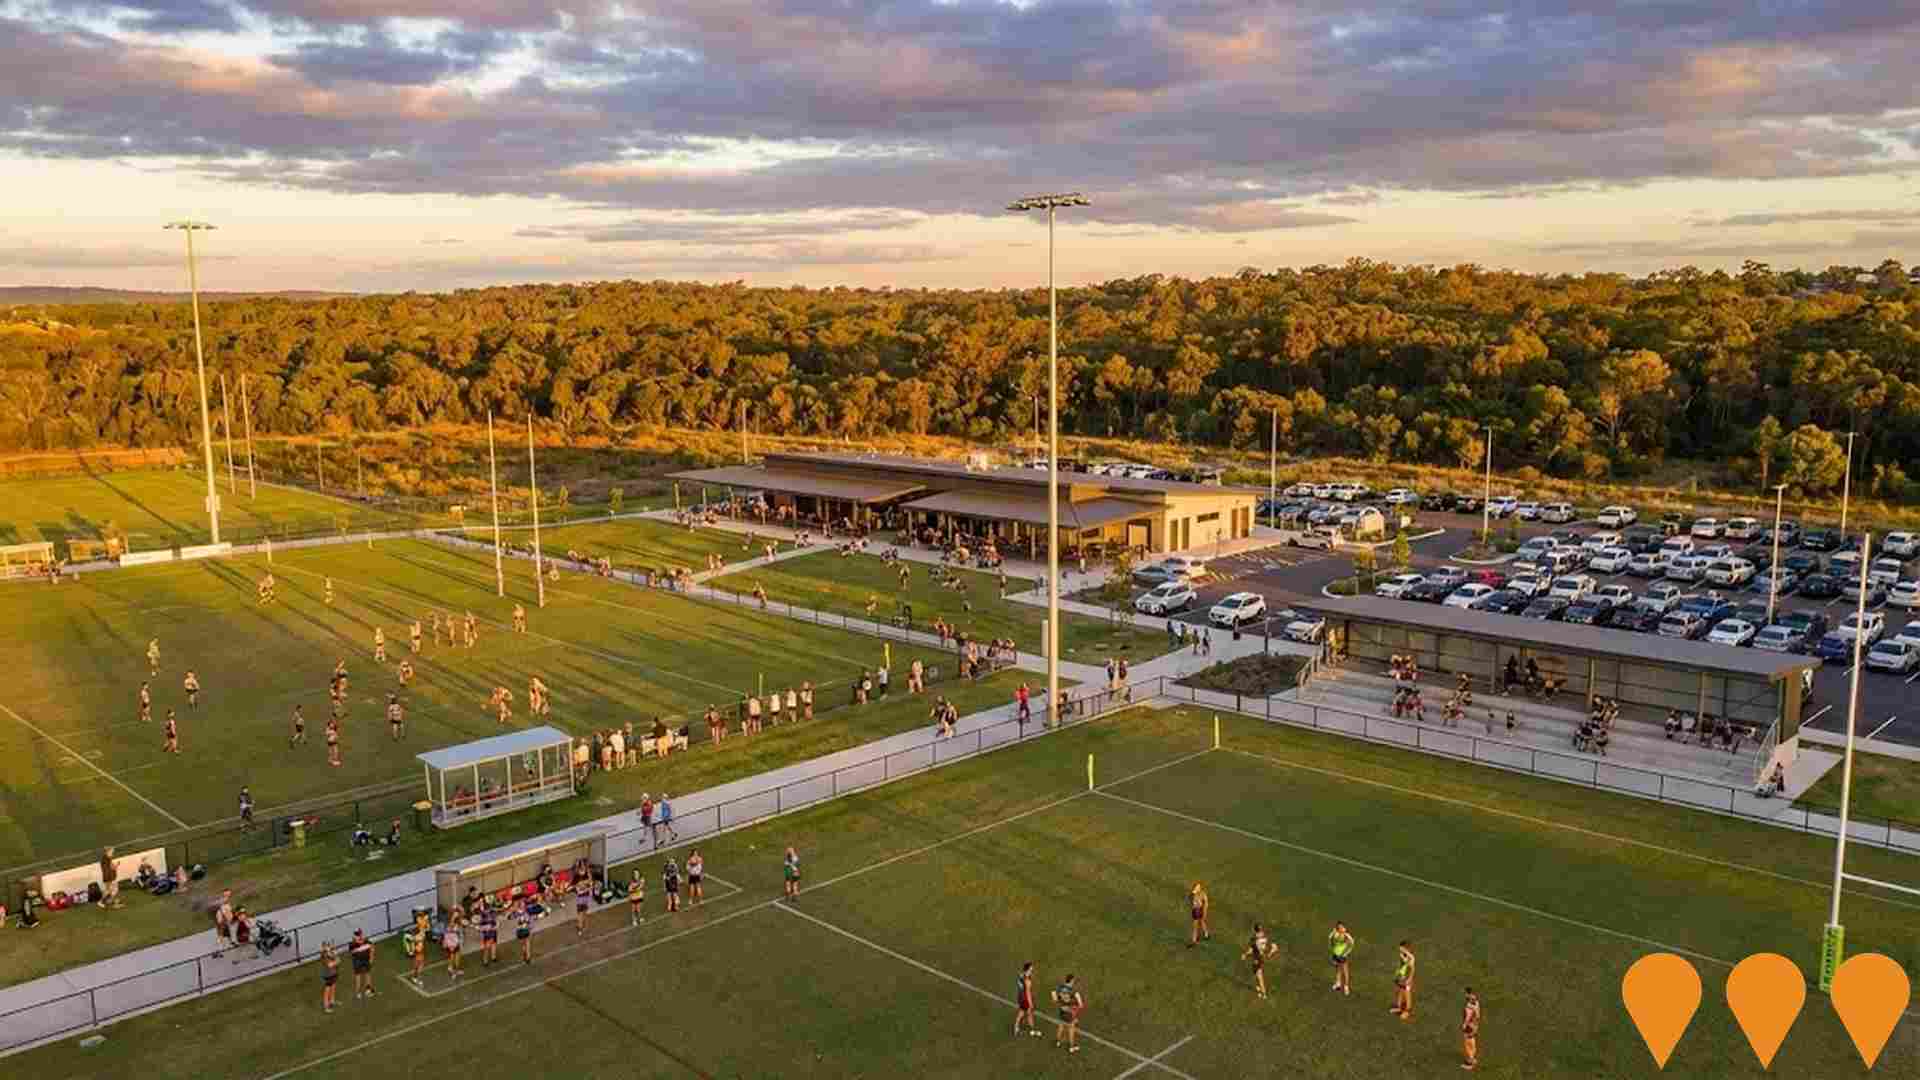
Council-led regional sport and recreation precinct on a 159 ha site at Mount Cotton. The Revised 2023 Master Plan protects about 80% of the site as natural area and focuses Stage 1 on 13 touch football fields, 3 rugby league fields, two clubhouses and ~800 car parks, with spaces reserved for future recreation elements such as play, pump tracks and picnicking. Following an EPBC Act 'controlled action' determination in 2023, the project remains under Federal environmental assessment. Council endorsed a Significant Contracting Plan in Dec 2024 and dissolved its 2022/23 construction contract with Alder Constructions pending approvals. Road upgrades along Heinemann Road are planned outside the EPBC referral area.
Redland Whitewater Centre
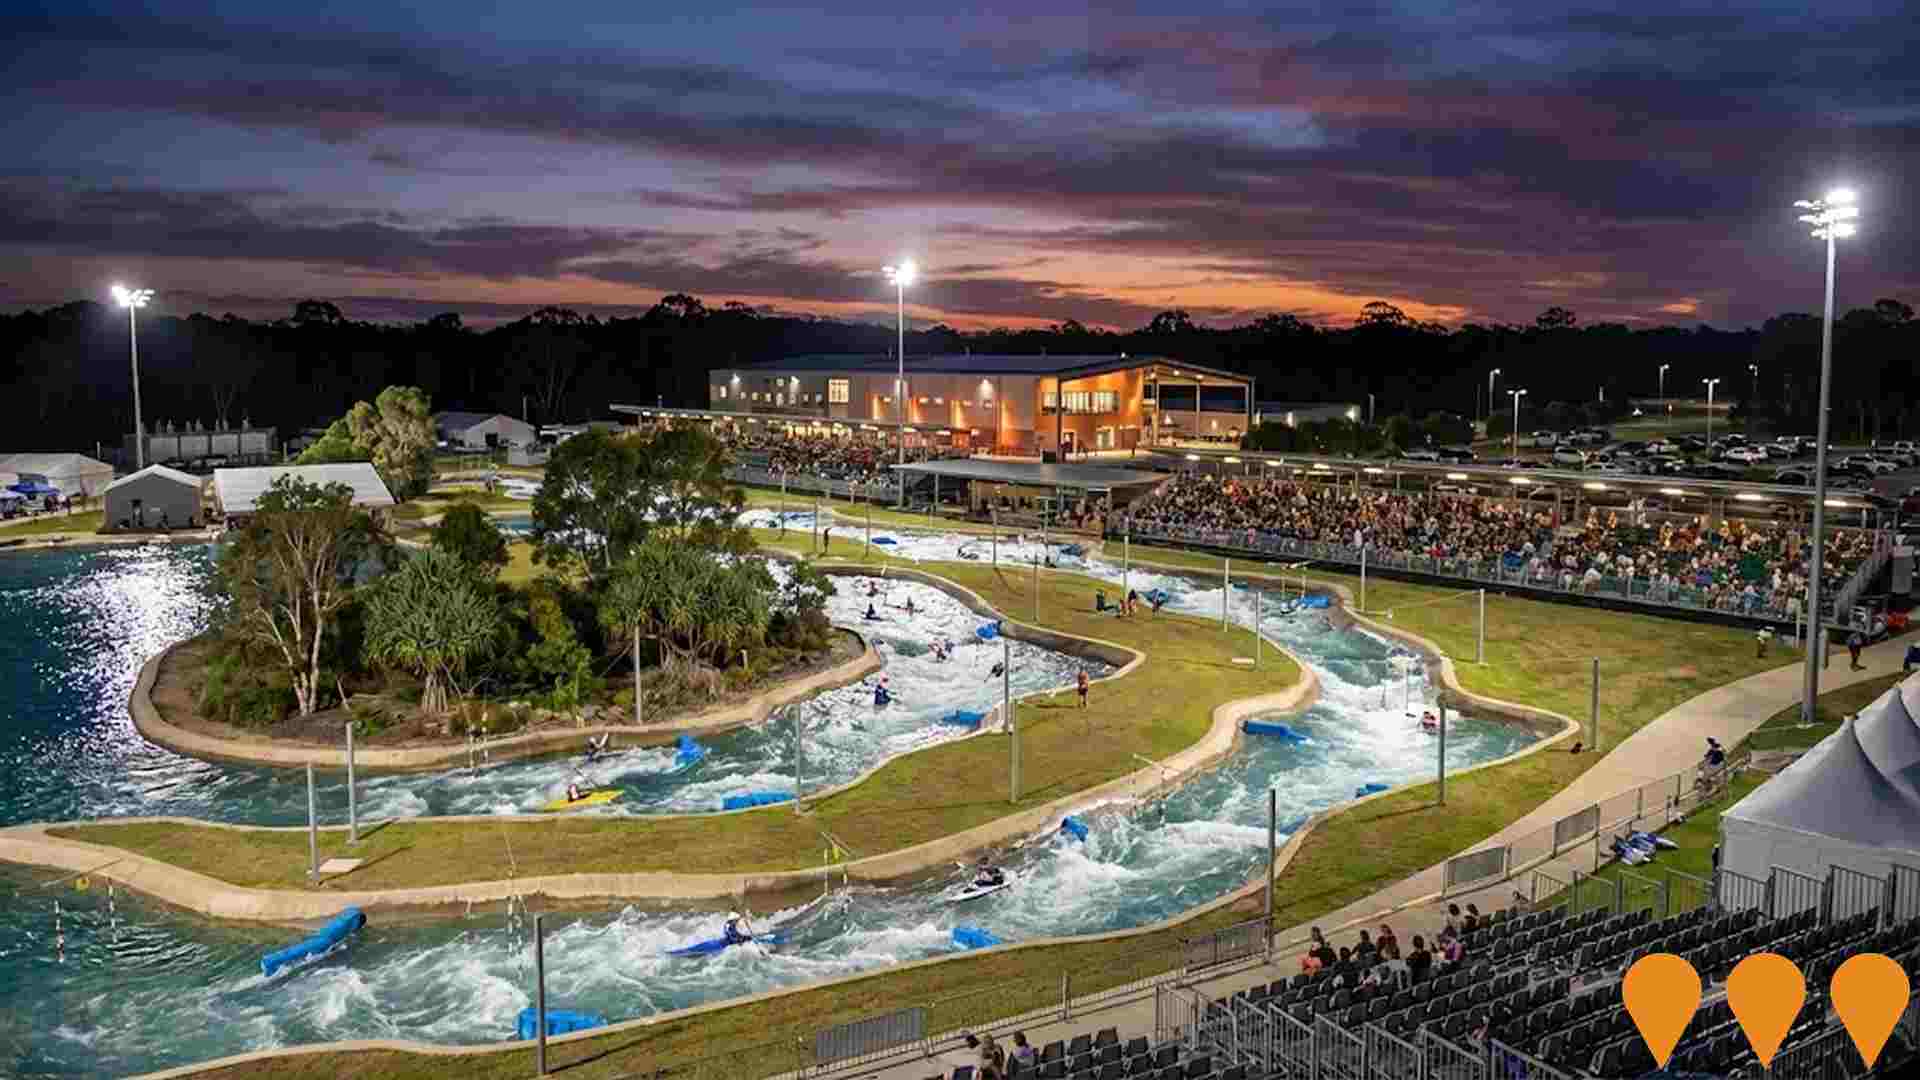
Olympic-standard whitewater venue integrated within the Birkdale Community Precinct to host Canoe Slalom for Brisbane 2032. Legacy-first design with ~8,000 temporary seats and an integrated warm-up channel, year-round community recreation, athlete training and swift-water rescue training for emergency services. Owned and operated by Redland City Council, with planning and delivery led by the Queensland Government (GIICA).
Employment
Employment conditions in Thornlands rank among the top 10% of areas assessed nationally
Thornlands has a skilled workforce with essential services sectors well represented. The unemployment rate was 1.6% in the past year, with an estimated employment growth of 6.2%.
As of September 2025, 13,322 residents were employed, and the unemployment rate was 2.4% lower than Greater Brisbane's rate of 4.0%. Workforce participation was higher at 70.3%, compared to Greater Brisbane's 64.5%. Employment is concentrated in health care & social assistance, construction, and retail trade. Construction employment levels are particularly high, at 1.4 times the regional average.
Professional & technical services have a limited presence with 6.5% employment compared to 8.9% regionally. The area offers limited local employment opportunities, as indicated by Census data on working population vs resident population. Between September 2024 and September 2025, employment levels increased by 6.2%, and the labour force grew by 6.0%, keeping the unemployment rate stable at 1.6%. In contrast, Greater Brisbane saw employment rise by 3.8% and a 0.5 percentage point drop in unemployment. State-level data from 25-Nov-25 shows Queensland's employment contracted by 0.01%, with an unemployment rate of 4.2%, closely matching the national rate of 4.3%. Jobs and Skills Australia forecasts national employment growth of 6.6% over five years and 13.7% over ten years, but growth varies significantly between sectors. Applying these projections to Thornlands' employment mix suggests local employment should increase by 6.5% over five years and 13.5% over ten years, assuming population projections remain constant for illustrative purposes.
Frequently Asked Questions - Employment
Income
Income metrics indicate excellent economic conditions, with the area achieving higher performance than 75% of national locations assessed by AreaSearch
AreaSearch's latest postcode level ATO data for financial year 2022 shows Thornlands SA2 had a median income among taxpayers of $57,898 and an average of $71,035. This was above the national average, with Greater Brisbane having a median of $55,645 and an average of $70,520. Based on Wage Price Index growth of 13.99% since financial year 2022, current estimates for Thornlands would be approximately $65,998 (median) and $80,973 (average) as of September 2025. Census data indicates household, family, and personal incomes in Thornlands cluster around the 74th percentile nationally. The earnings profile shows that 36.9% of residents (8,054 people) earn between $1,500 and $2,999 per week, reflecting patterns seen in the surrounding region where 33.3% occupy this range. The area demonstrates considerable affluence with 31.3% earning over $3,000 per week, supporting premium retail and service offerings. High housing costs consume 16.5% of income, but strong earnings still place disposable income at the 77th percentile nationally. Thornlands' SEIFA income ranking places it in the 7th decile.
Frequently Asked Questions - Income
Housing
Thornlands is characterized by a predominantly suburban housing profile, with a higher proportion of rental properties than the broader region
Thornlands' dwelling structure, as per the latest Census, consisted of 87.4% houses and 12.6% other dwellings (semi-detached, apartments, 'other' dwellings), compared to Brisbane metro's 83.9% houses and 16.1% other dwellings. Home ownership in Thornlands stood at 25.3%, with mortgaged dwellings at 48.0% and rented ones at 26.6%. The median monthly mortgage repayment was $2,167, higher than Brisbane metro's average of $2,000. Median weekly rent in Thornlands was recorded at $470, compared to Brisbane metro's $425. Nationally, Thornlands' median monthly mortgage repayments were significantly higher at $2,167 versus the Australian average of $1,863, and rents were substantially above the national figure of $375.
Frequently Asked Questions - Housing
Household Composition
Thornlands features high concentrations of family households, with a higher-than-average median household size
Family households constitute 84.2% of all households, including 43.3% couples with children, 28.0% couples without children, and 12.0% single parent families. Non-family households comprise the remaining 15.8%, with lone person households at 13.9% and group households comprising 1.9%. The median household size is 2.9 people, larger than the Greater Brisbane average of 2.6.
Frequently Asked Questions - Households
Local Schools & Education
The educational profile of Thornlands exceeds national averages, with above-average qualification levels and academic performance metrics
Thornlands' residents aged 15+ have a university degree rate of 21.9%, compared to Greater Brisbane's 30.5%. Bachelor degrees are the most common at 15.5%, followed by postgraduate qualifications (4.0%) and graduate diplomas (2.4%). Vocational credentials are held by 42.0% of residents, with advanced diplomas at 13.8% and certificates at 28.2%. Educational participation is high, with 30.4% currently enrolled in formal education: primary (10.5%), secondary (9.8%), and tertiary (4.6%).
Educational participation is notably high, with 30.4% of residents currently enrolled in formal education. This includes 10.5% in primary education, 9.8% in secondary education, and 4.6% pursuing tertiary education.
Frequently Asked Questions - Education
Schools Detail
Nearby Services & Amenities
Transport
Transport servicing is low compared to other areas nationally based on assessment of service frequency, route connectivity and accessibility
Thornlands has 70 active public transport stops, all of which are bus stops. These stops are served by 11 different routes that together facilitate 1,028 weekly passenger trips. The accessibility of the transport system is considered good, with residents living an average distance of 346 meters from their nearest stop.
On average, there are 146 trips per day across all routes, which translates to approximately 14 weekly trips per individual stop.
Frequently Asked Questions - Transport
Transport Stops Detail
Health
Thornlands's residents are healthier than average in comparison to broader Australia with prevalence of common health conditions quite low among the general population though higher than the nation's average across older, at risk cohorts
Thornlands' health data shows positive outcomes overall.
Common health conditions have a relatively low prevalence among its general population, but are higher than national averages for older and at-risk groups. Approximately 55% (~12,005 people) of Thornlands residents have private health cover, the highest rate recorded. Mental health issues and asthma were found to be the most common medical conditions, affecting 8.1 and 8.0% of residents respectively. A total of 71.1% of residents reported no medical ailments, compared to 64.6% in Greater Brisbane. Thornlands has a lower proportion of seniors aged 65 and over at 15.7% (3,420 people), compared to Greater Brisbane's 25.3%. While health outcomes among seniors require more attention than the broader population, they present some challenges.
Frequently Asked Questions - Health
Cultural Diversity
In terms of cultural diversity, Thornlands records figures broadly comparable to the national average, as found in AreaSearch's assessment of a number of language and cultural background related metrics
Thornlands' cultural diversity is above average, with 9.2% speaking a language other than English at home and 26.3% born overseas. Christianity is the predominant religion in Thornlands, comprising 52.4%, slightly lower than Greater Brisbane's 52.8%. The top three ancestry groups are English (31.8%), Australian (25.4%), and Scottish (8.6%).
Notably, New Zealanders comprise 1.3% of Thornlands' population, higher than the regional average of 1.2%, while South Africans make up 1.2% compared to 1.0% regionally, and Maori people constitute 1.1% versus 0.9%.
Frequently Asked Questions - Diversity
Age
Thornlands's population is slightly younger than the national pattern
Thornlands' median age is 36 years, equal to Greater Brisbane's but younger than the national average of 38 years. The 5-14 age group comprises 14.4%, higher than Greater Brisbane, while the 25-34 cohort stands at 10.7%. Between 2021 and present, the 75-84 age group has grown from 4.2% to 5.4%. Conversely, the 25-34 cohort has decreased from 12.0% to 10.7%. By 2041, population forecasts indicate significant demographic shifts in Thornlands. The 45-54 age group is projected to increase by 890 people (29%), from 3,023 to 3,914. Notably, the combined 65+ age groups will account for 50% of total population growth, reflecting the area's aging demographic profile. Meanwhile, both the 35-44 and 0-4 age groups are expected to decrease in number.
