Chart Color Schemes
This analysis uses ABS Statistical Areas Level 2 (SA2) boundaries, which can materially differ from Suburbs and Localities (SAL) even when sharing similar names.
SA2 boundaries are defined by the Australian Bureau of Statistics and are designed to represent communities for statistical reporting (e.g., census and ERP).
Suburbs and Localities (SAL) represent commonly-used suburb/locality names (postal-style areas) and may use different geographic boundaries. For comprehensive analysis, consider reviewing both boundary types if available.
est. as @ -- *
ABS ERP | -- people | --
2021 Census | -- people
Sales Activity
Curious about local property values? Filter the chart to assess the volume and appreciation (including resales) trends and regional comparisons, or scroll to the map below view this information at an individual property level.
Find a Recent Sale
Sales Detail
Population
Redland Bay lies within the top quartile of areas nationally for population growth performance according to AreaSearch analysis of recent, and medium to long-term trends
Redland Bay's population is 20,568 as of November 2025, reflecting a 15.8% increase from the 2021 Census figure of 17,765 people. This growth was inferred from the ABS estimated resident population of 19,594 in June 2024 and an additional 827 validated new addresses since the Census date. The population density is 438 persons per square kilometer. Redland Bay's growth exceeded the SA4 region (7.7%) and the national average. Interstate migration contributed approximately 45.1% of overall population gains, with all drivers being positive factors. AreaSearch adopts ABS/Geoscience Australia projections for each SA2 area released in 2024 using 2022 as the base year.
For areas not covered by this data and years post-2032, Queensland State Government's SA2 area projections released in 2023 based on 2021 data are used, with proportional growth weightings applied for age cohorts. Forecasts indicate a significant population increase in the top quartile of statistical areas nationwide, with Redland Bay expected to increase by 5,085 persons to 2041, reflecting a total increase of 20.0% over the 17 years.
Frequently Asked Questions - Population
Development
The level of residential development activity in Redland Bay was found to be higher than 90% of real estate markets across the country
Redland Bay has seen approximately 204 new homes approved annually over the past five financial years, totalling 1,022 homes. As of FY-26145 approvals have been recorded. On average, 1.9 new residents arrive per year for each new home built between FY-21 and FY-25, indicating a balanced supply and demand market that supports stable conditions. The average expected construction cost value for new dwellings is $368,000.
In FY-26, there have been $34.9 million in commercial approvals, reflecting high levels of local commercial activity. Compared to Greater Brisbane, Redland Bay shows moderately higher building activity, with 13.0% above the regional average per person over the five-year period. This level is significantly higher than the national average, suggesting robust developer interest in the area. New building activity comprises 82.0% detached dwellings and 18.0% medium and high-density housing, maintaining Redland Bay's traditional low density character with a focus on family homes.
With approximately 76 people per approval, Redland Bay reflects a developing area. According to AreaSearch's latest quarterly estimate, the population is expected to grow by 4,111 residents through to 2041. At current development rates, new housing supply should comfortably meet demand, providing good conditions for buyers and potentially supporting growth beyond current population projections.
Frequently Asked Questions - Development
Infrastructure
Redland Bay has moderate levels of nearby infrastructure activity, ranking in the 42ndth percentile nationally
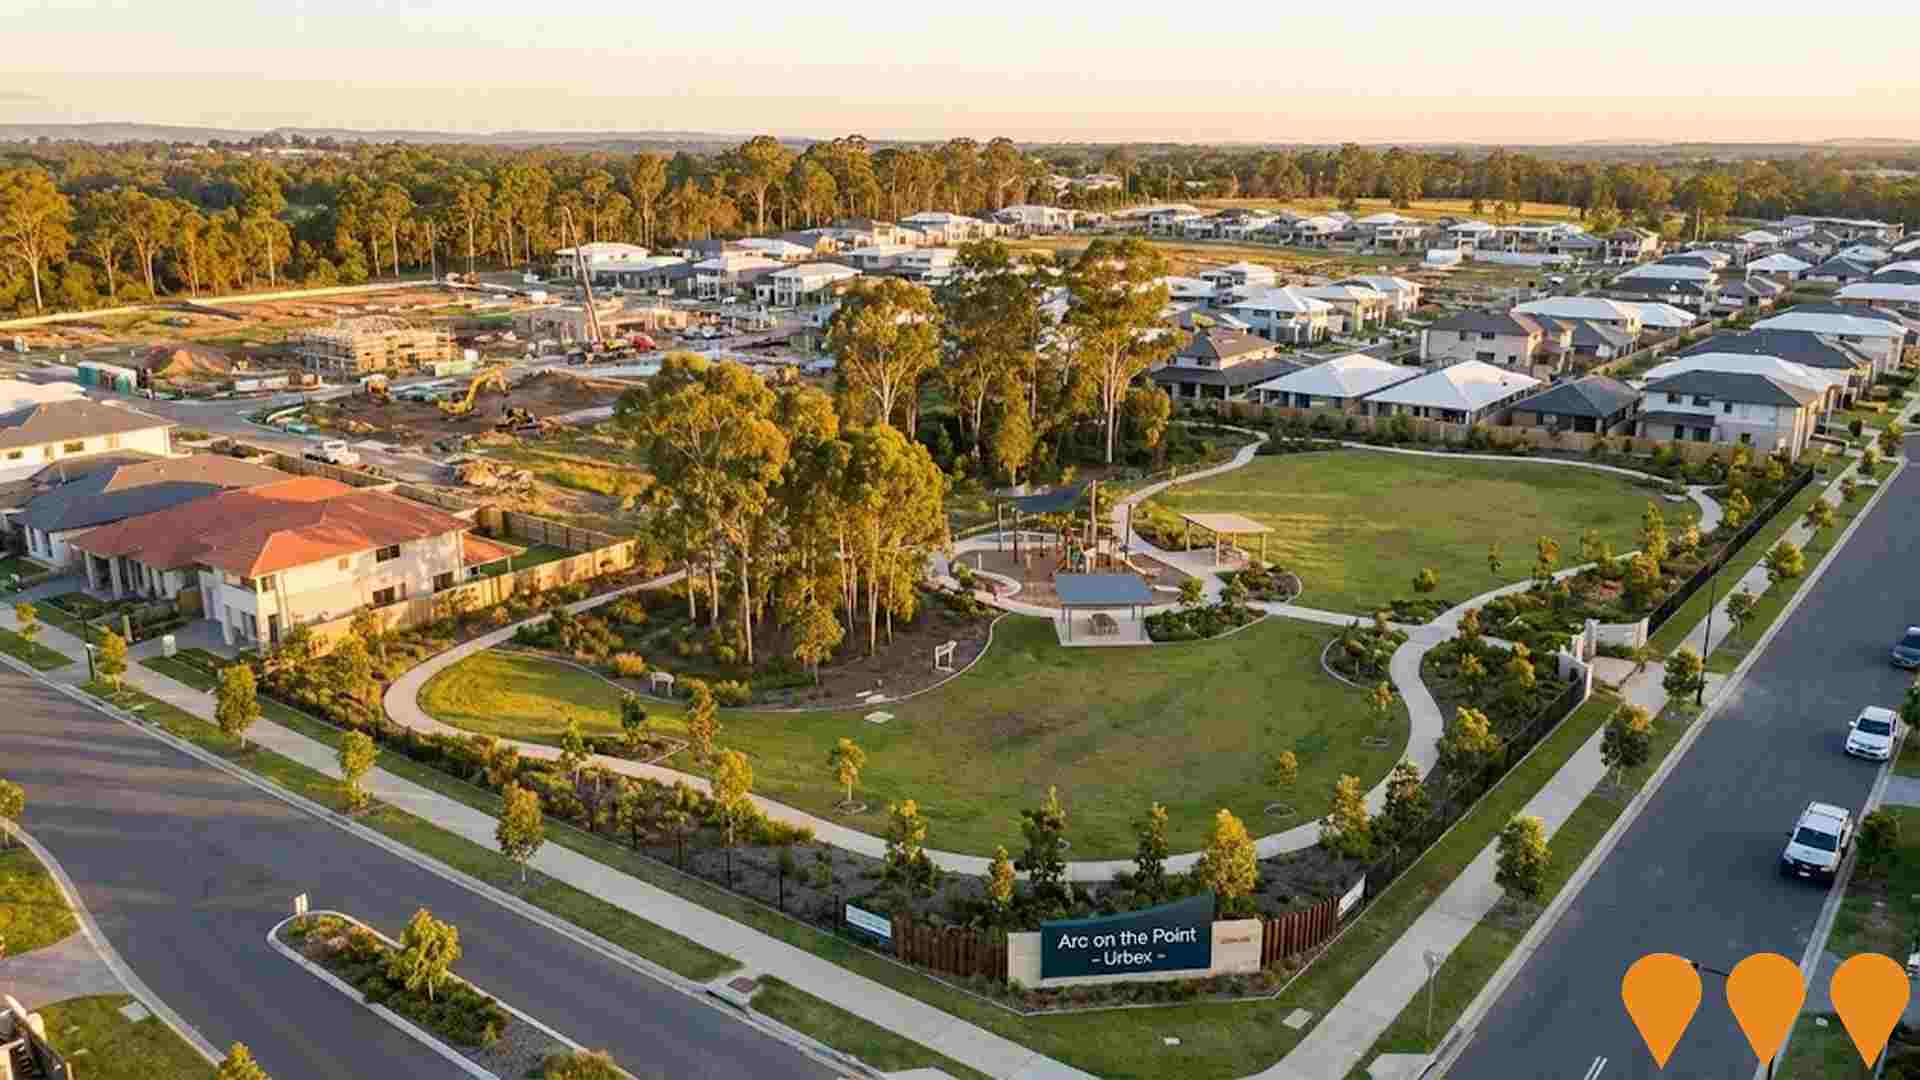
Changes in local infrastructure significantly affect an area's performance. AreaSearch has identified 12 projects that may impact this region. Notable projects include Weinam Creek Priority Development Area, Marina Redland Bay, Baya by Villawood Properties, and Shoreline Master Planned Community. The following list details those most likely to be relevant.
Professional plan users can use the search below to filter and access additional projects.
INFRASTRUCTURE SEARCH
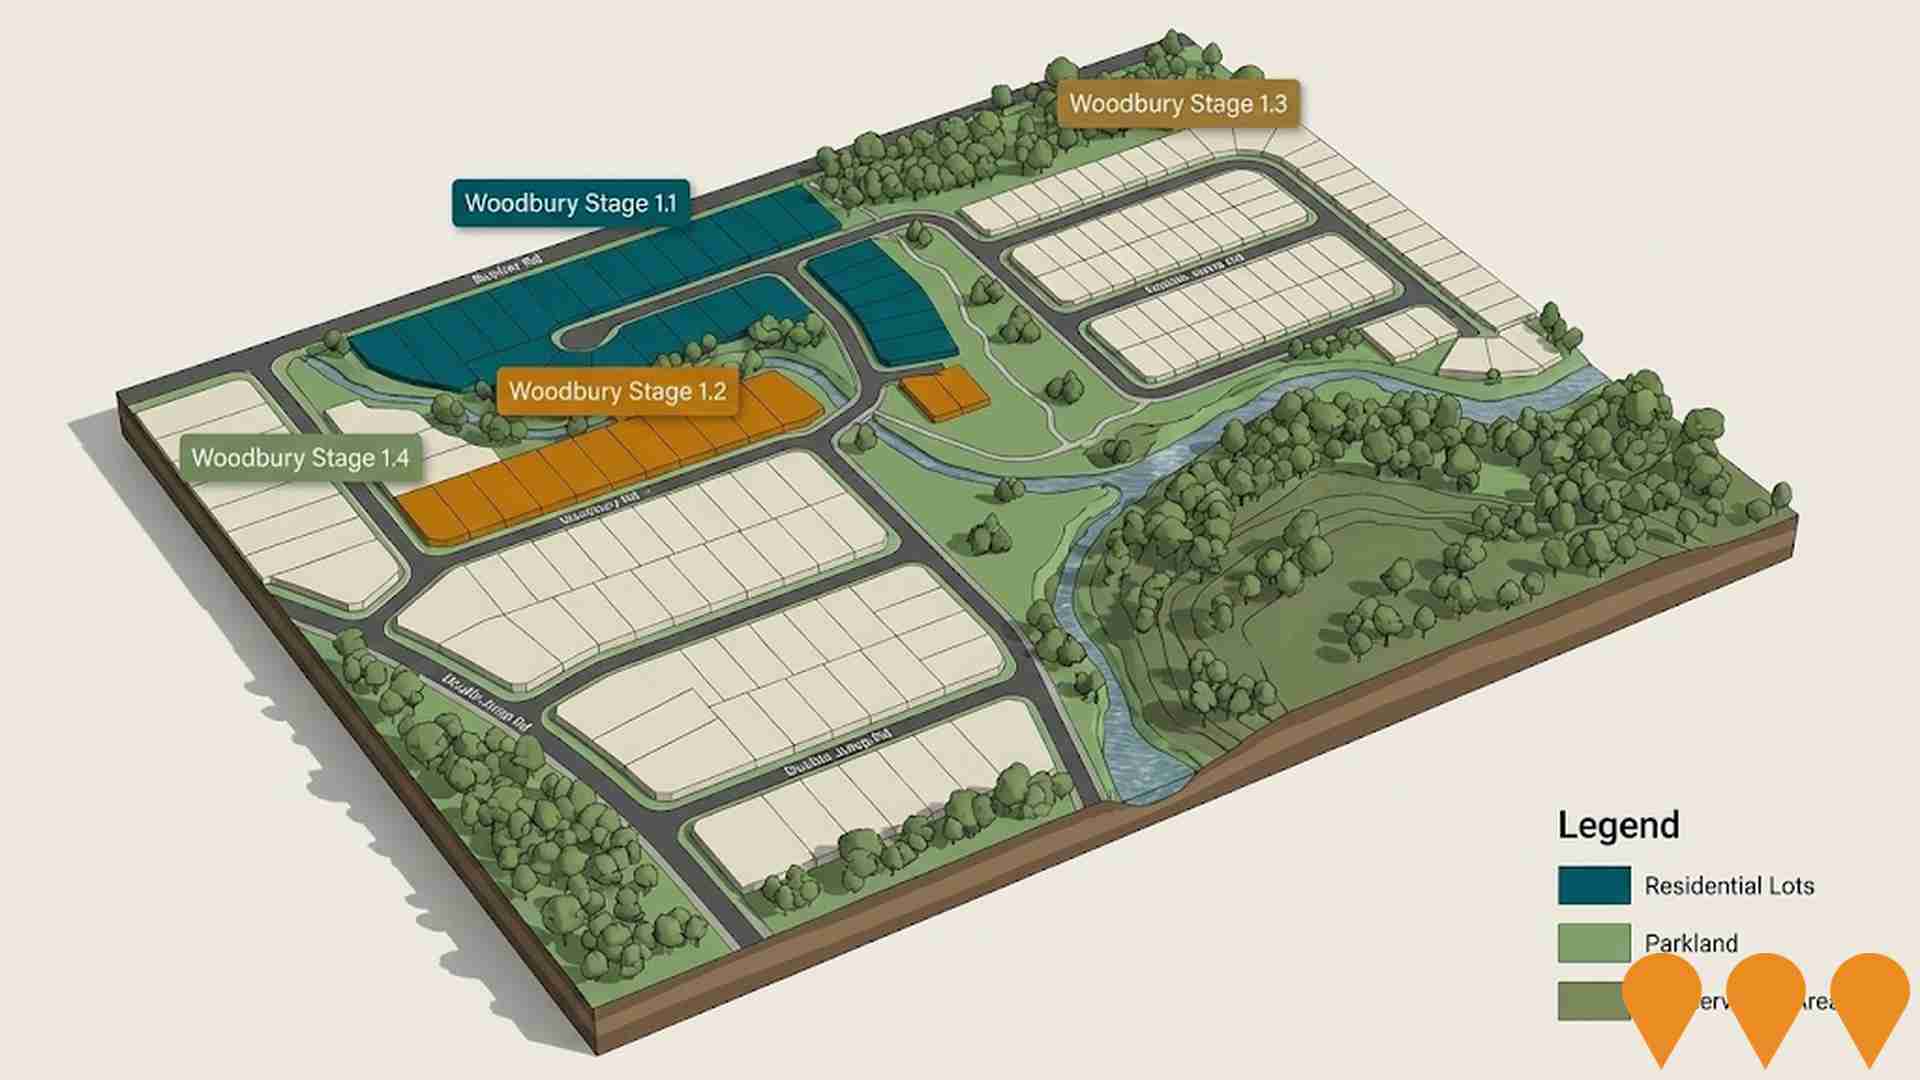
 Denotes AI-based impression for illustrative purposes only, not to be taken as definitive under any circumstances. Please follow links and conduct other investigations from the project's source for actual imagery. Developers and project owners wishing us to use original imagery please Contact Us and we will do so.
Frequently Asked Questions - Infrastructure
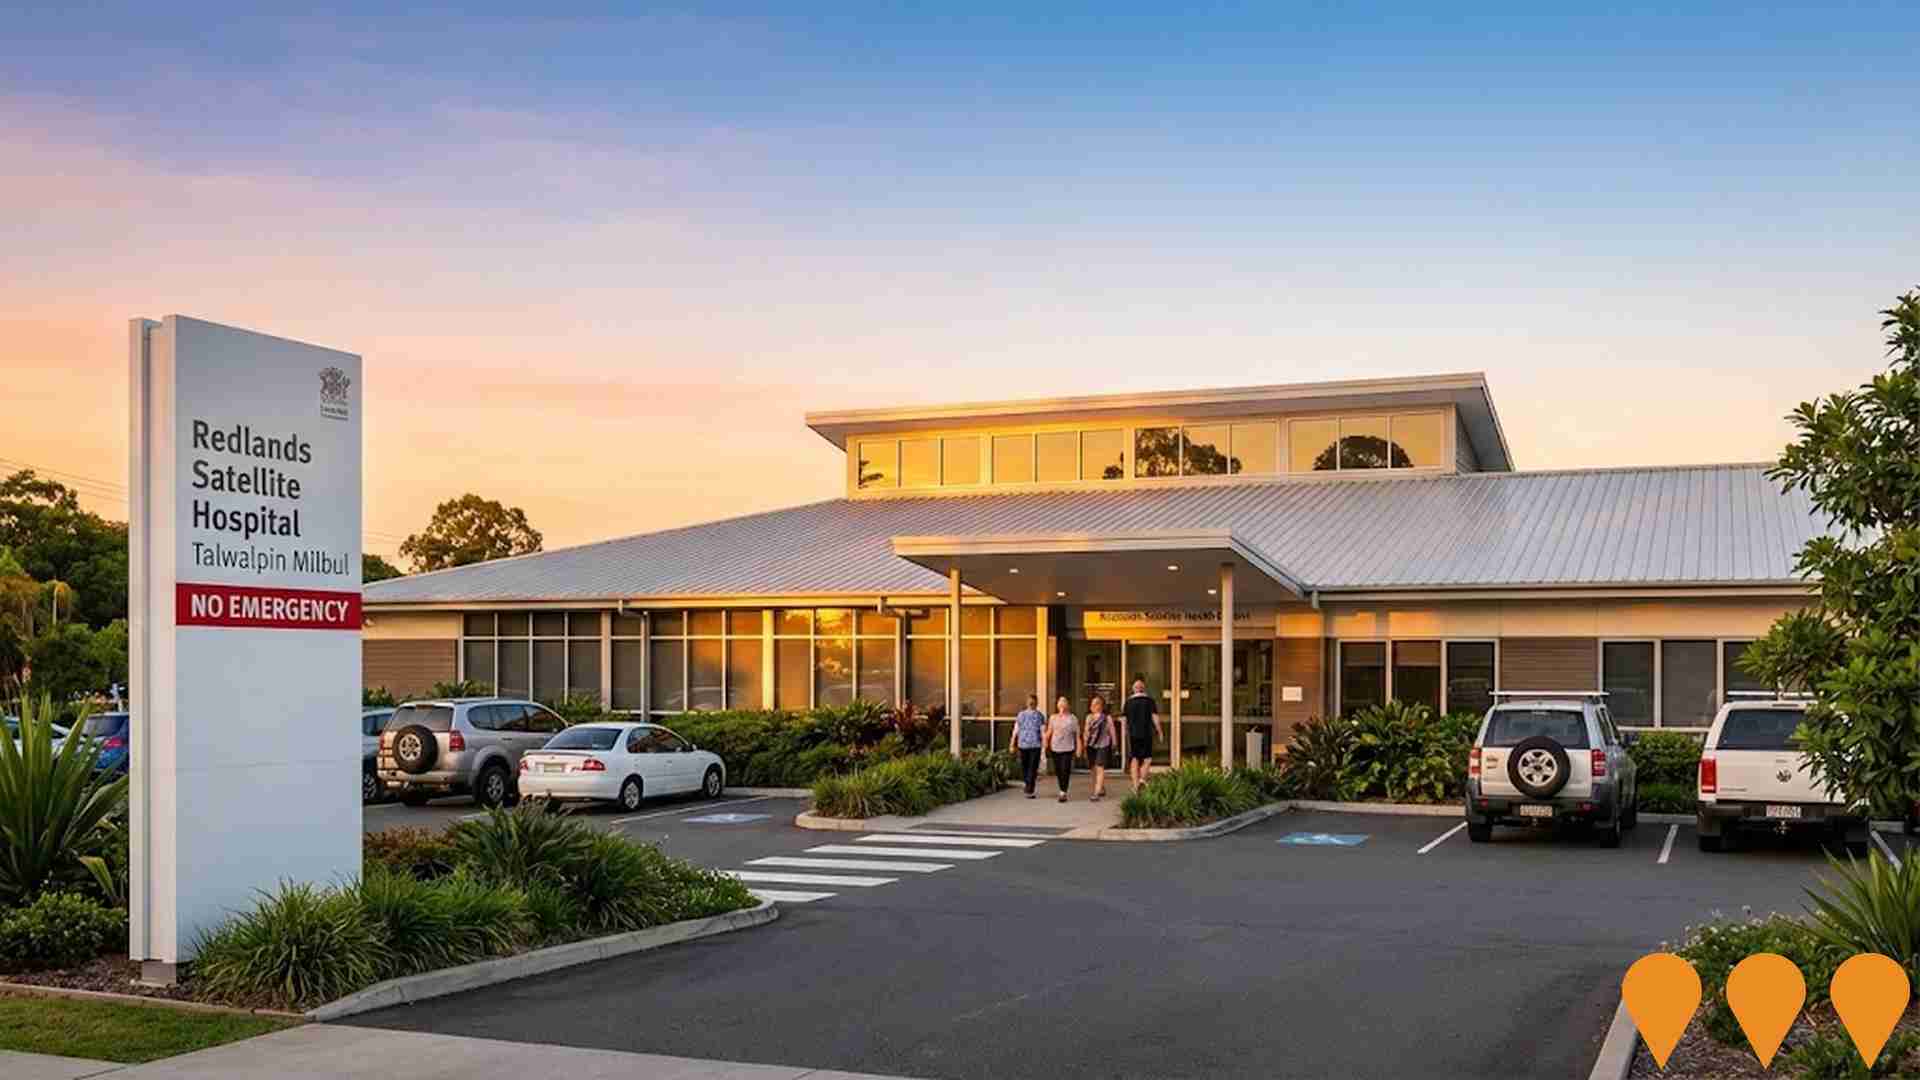
Redlands Satellite Health Centre (Talwalpin Milbul)
The Redlands Satellite Health Centre, co-named Talwalpin Milbul meaning 'Redland Bay Alive/Active' in Jandai language, provides walk-in care for minor injuries and illnesses, specialist outpatient services including renal dialysis and cancer day therapy, diagnostic facilities. It operates from 8am to 10pm daily, serving the Redlands Coast and Bay Islands communities. Opened on 28 August 2023 and renamed from Satellite Hospital to Health Centre in March 2025 to clarify services.
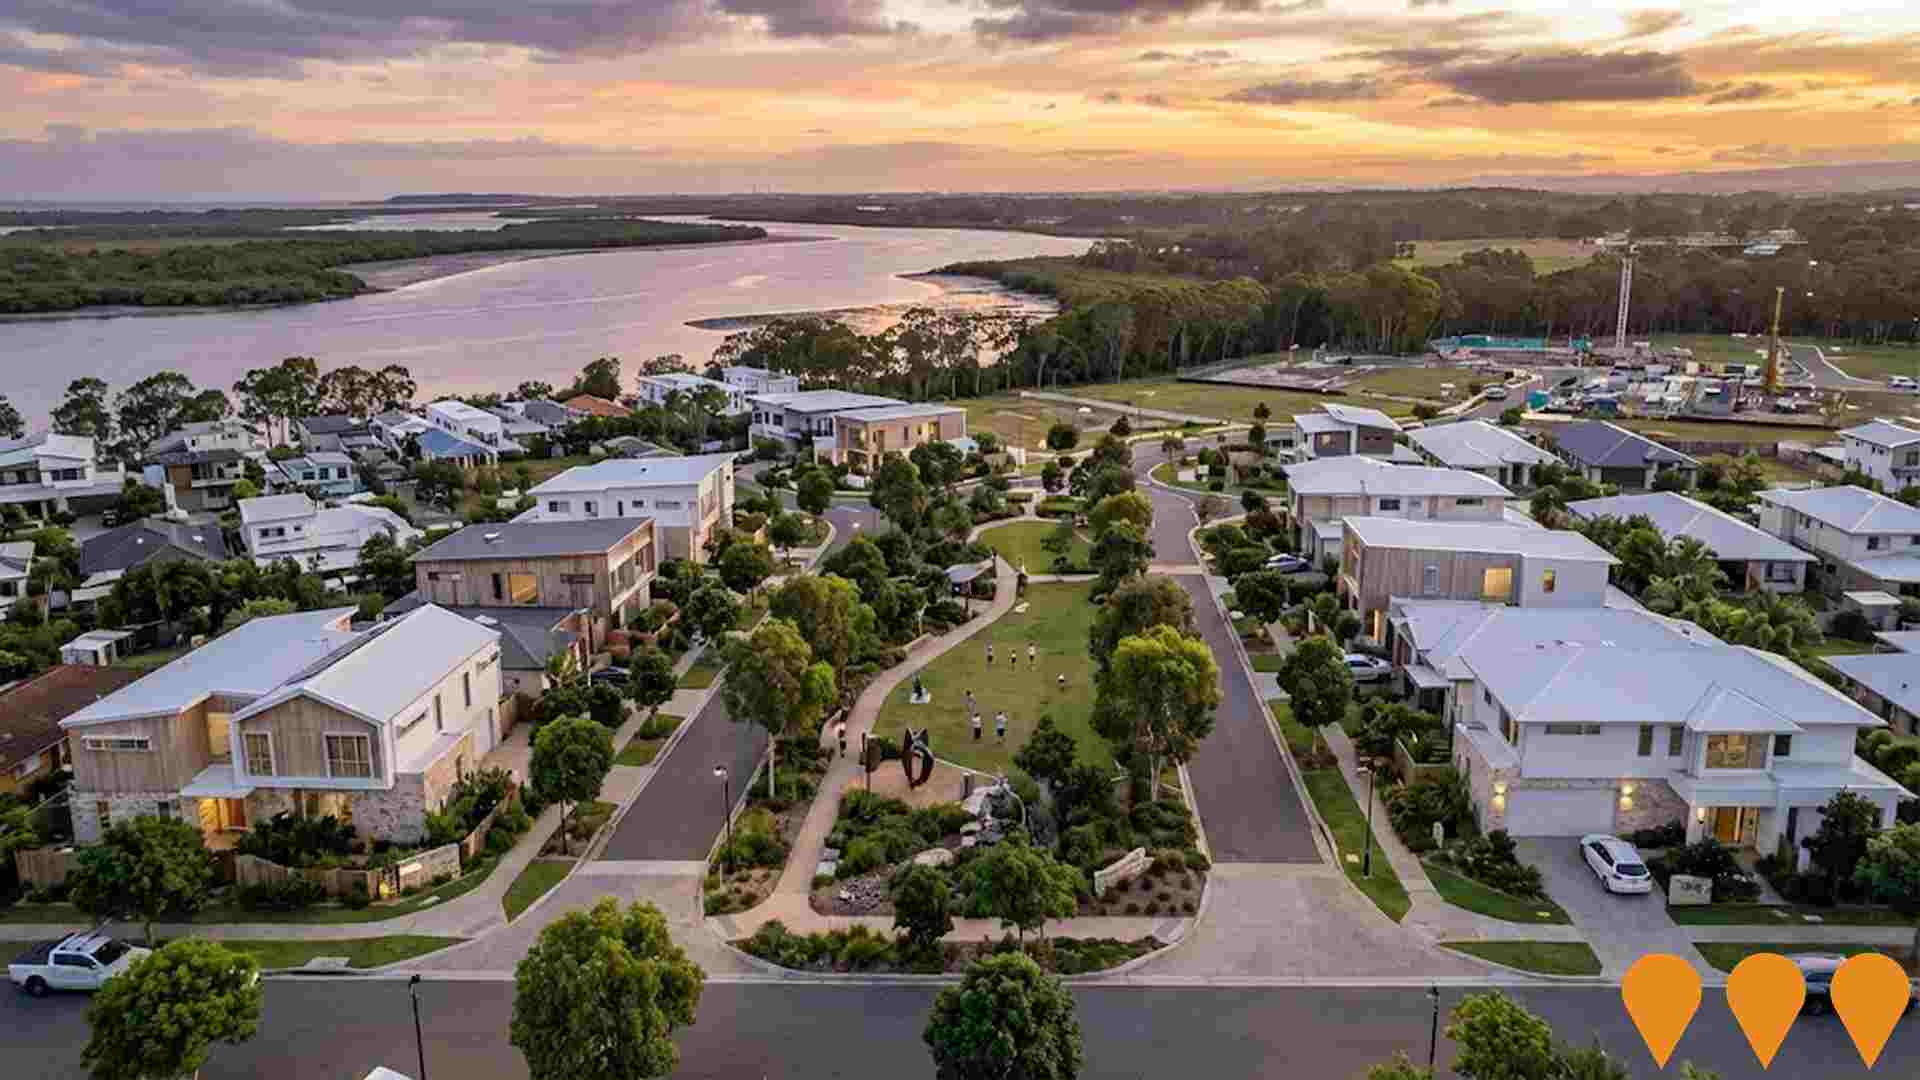
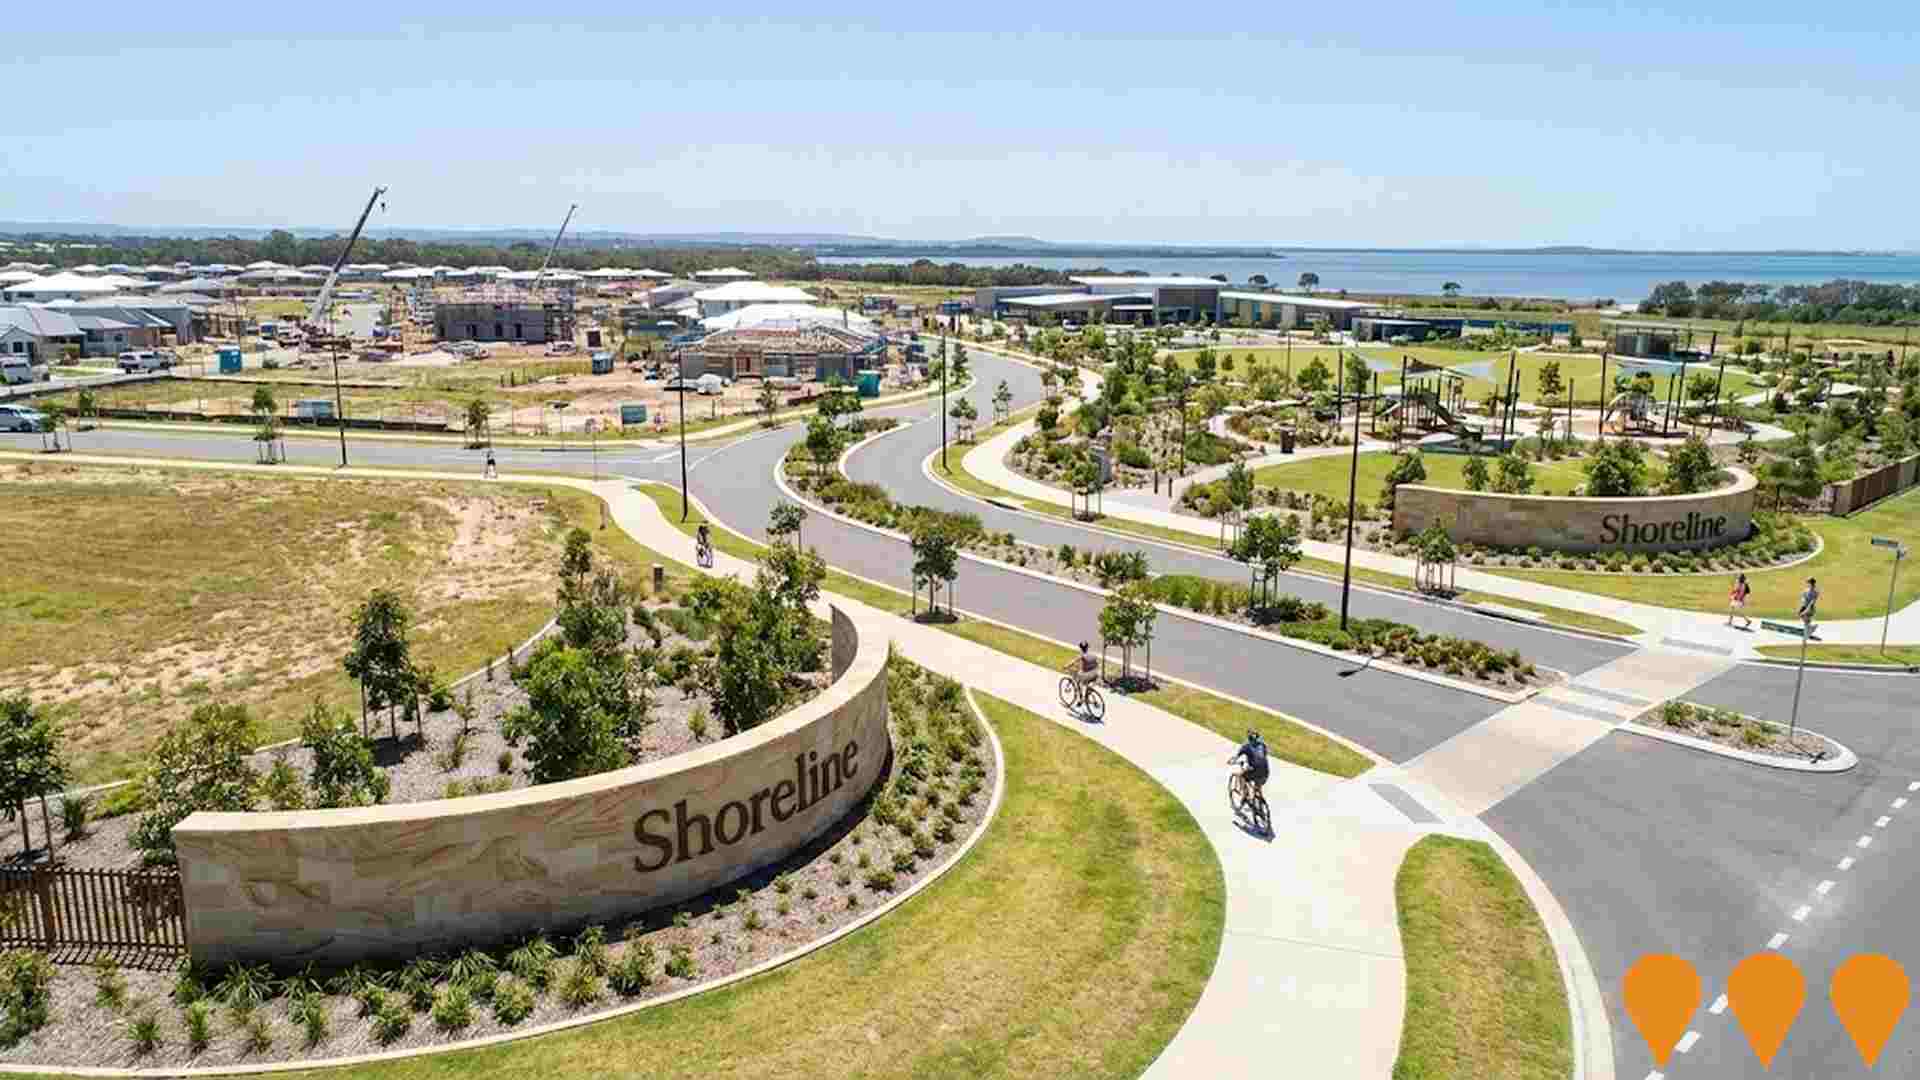
Shoreline Master Planned Community
A $2.3 billion master-planned community at Redland Bay spanning 279 hectares, delivering approximately 3,000 residential lots for around 10,000 residents. Jointly developed by Stockland and Supalai Australia (acquisition completed November 2024). Features include a future town centre, retail and commercial precincts, two schools (Scenic Shores State School now open), 70 hectares of parks and open space (25% of site), 2.8 km of foreshore parkland, marina precinct, and on-site recycled water treatment plant. Construction is well underway with multiple stages released, civil works progressing, linear park and BMX facilities completed, and first residents expected mid-2025. Full build-out targeted by approximately 2035-2040.
Weinam Creek Priority Development Area
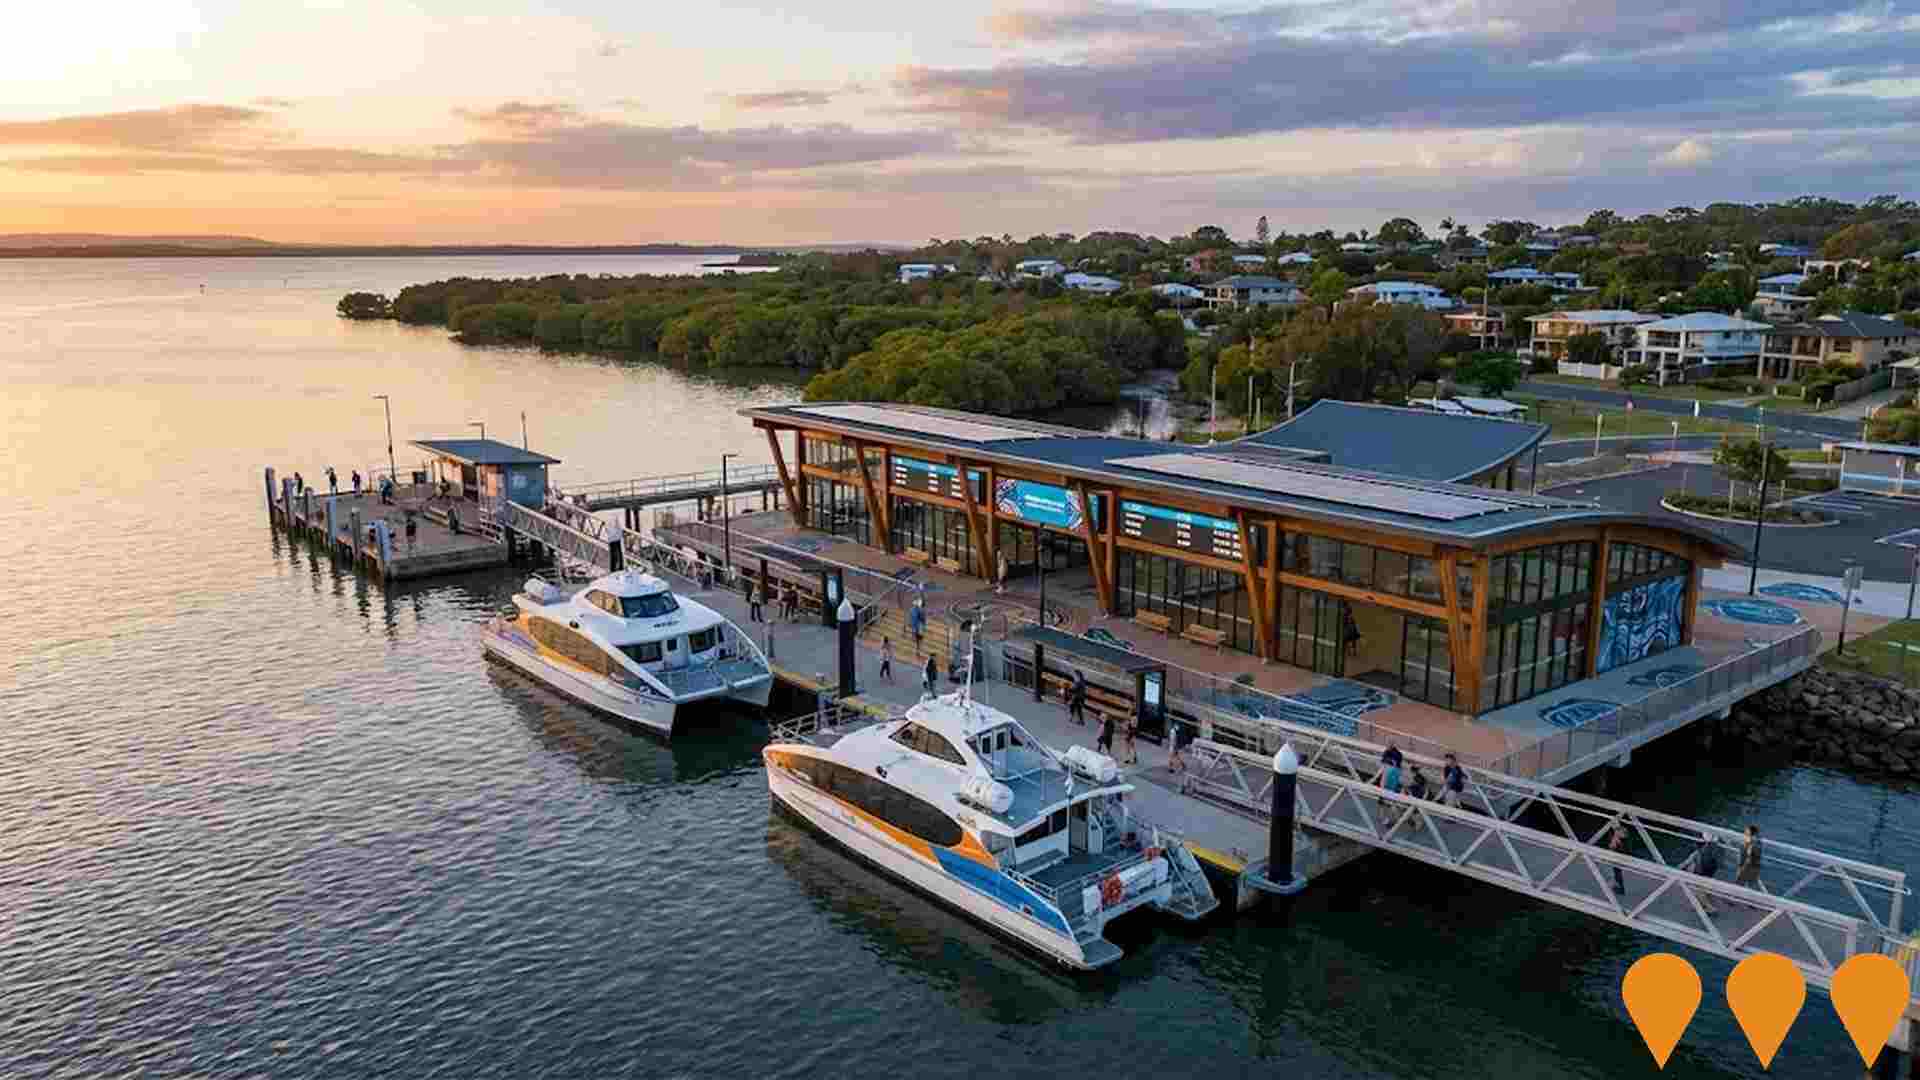
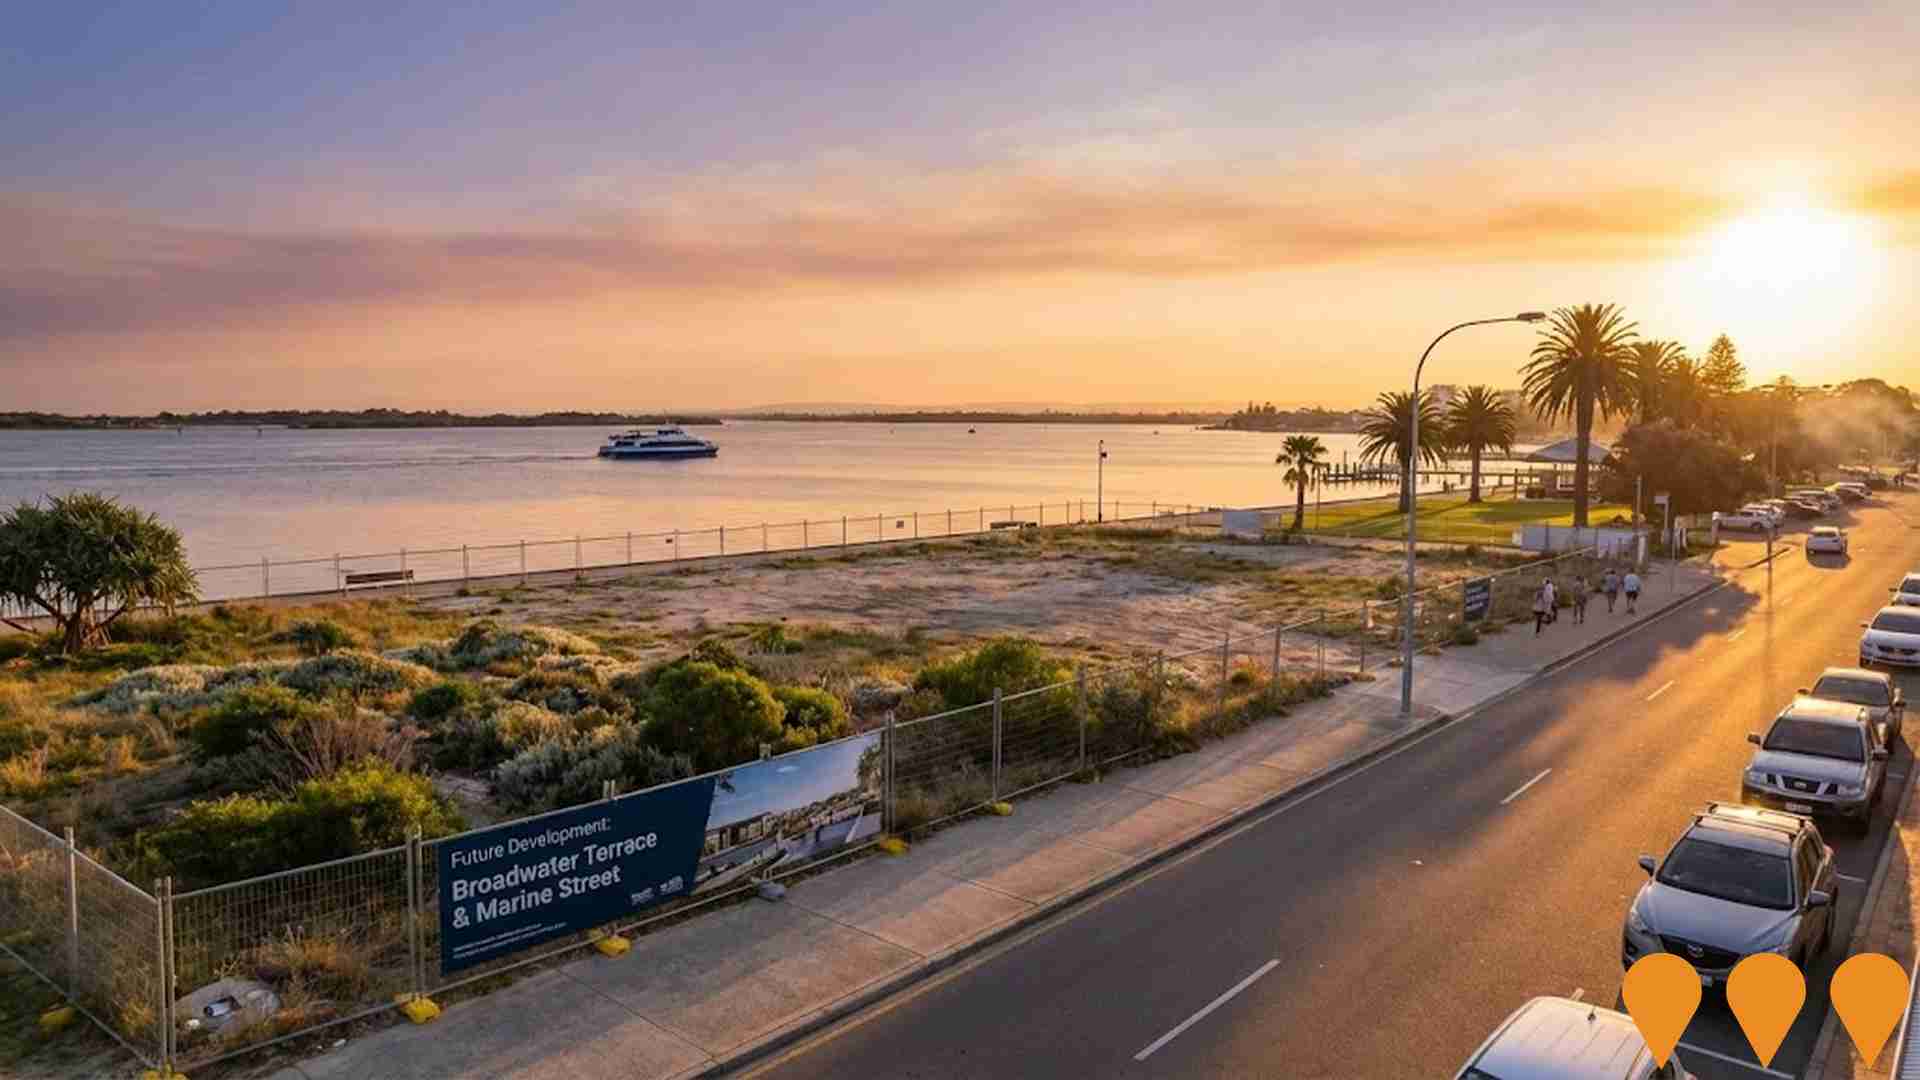
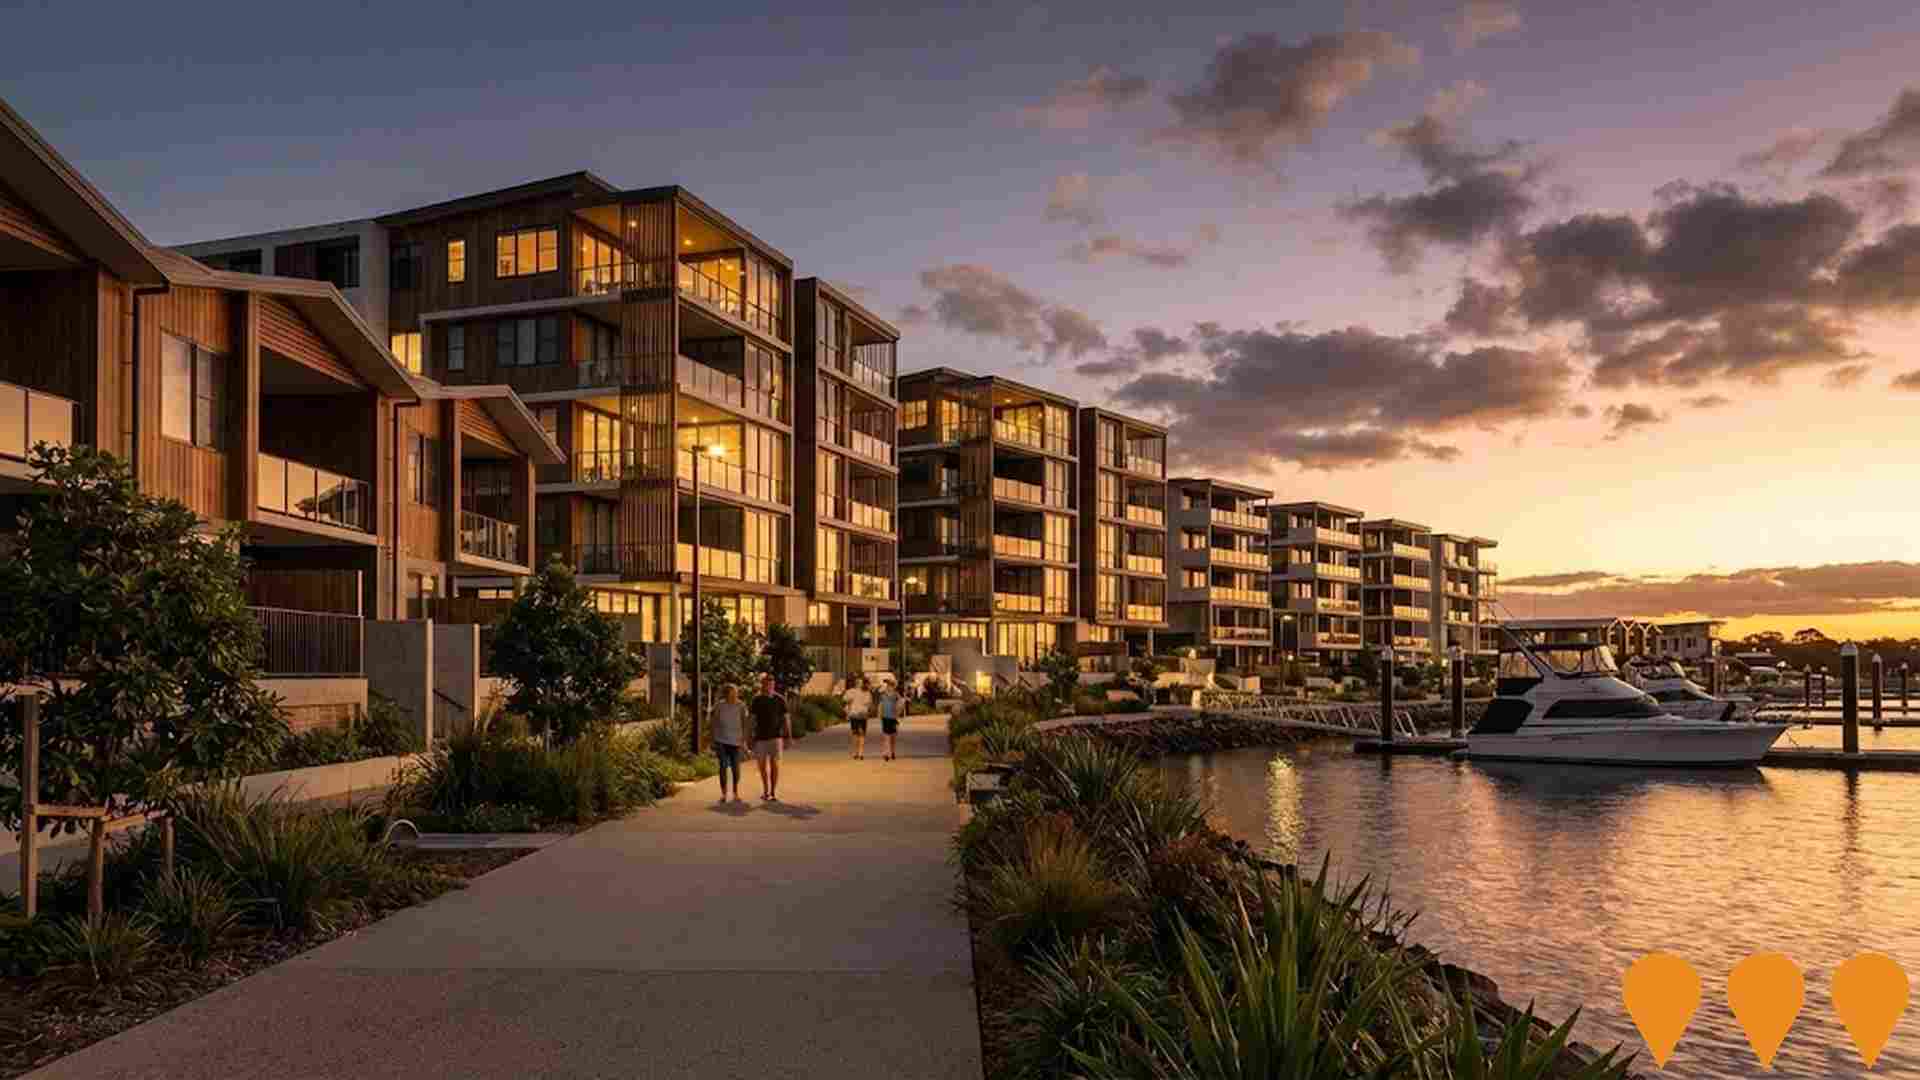
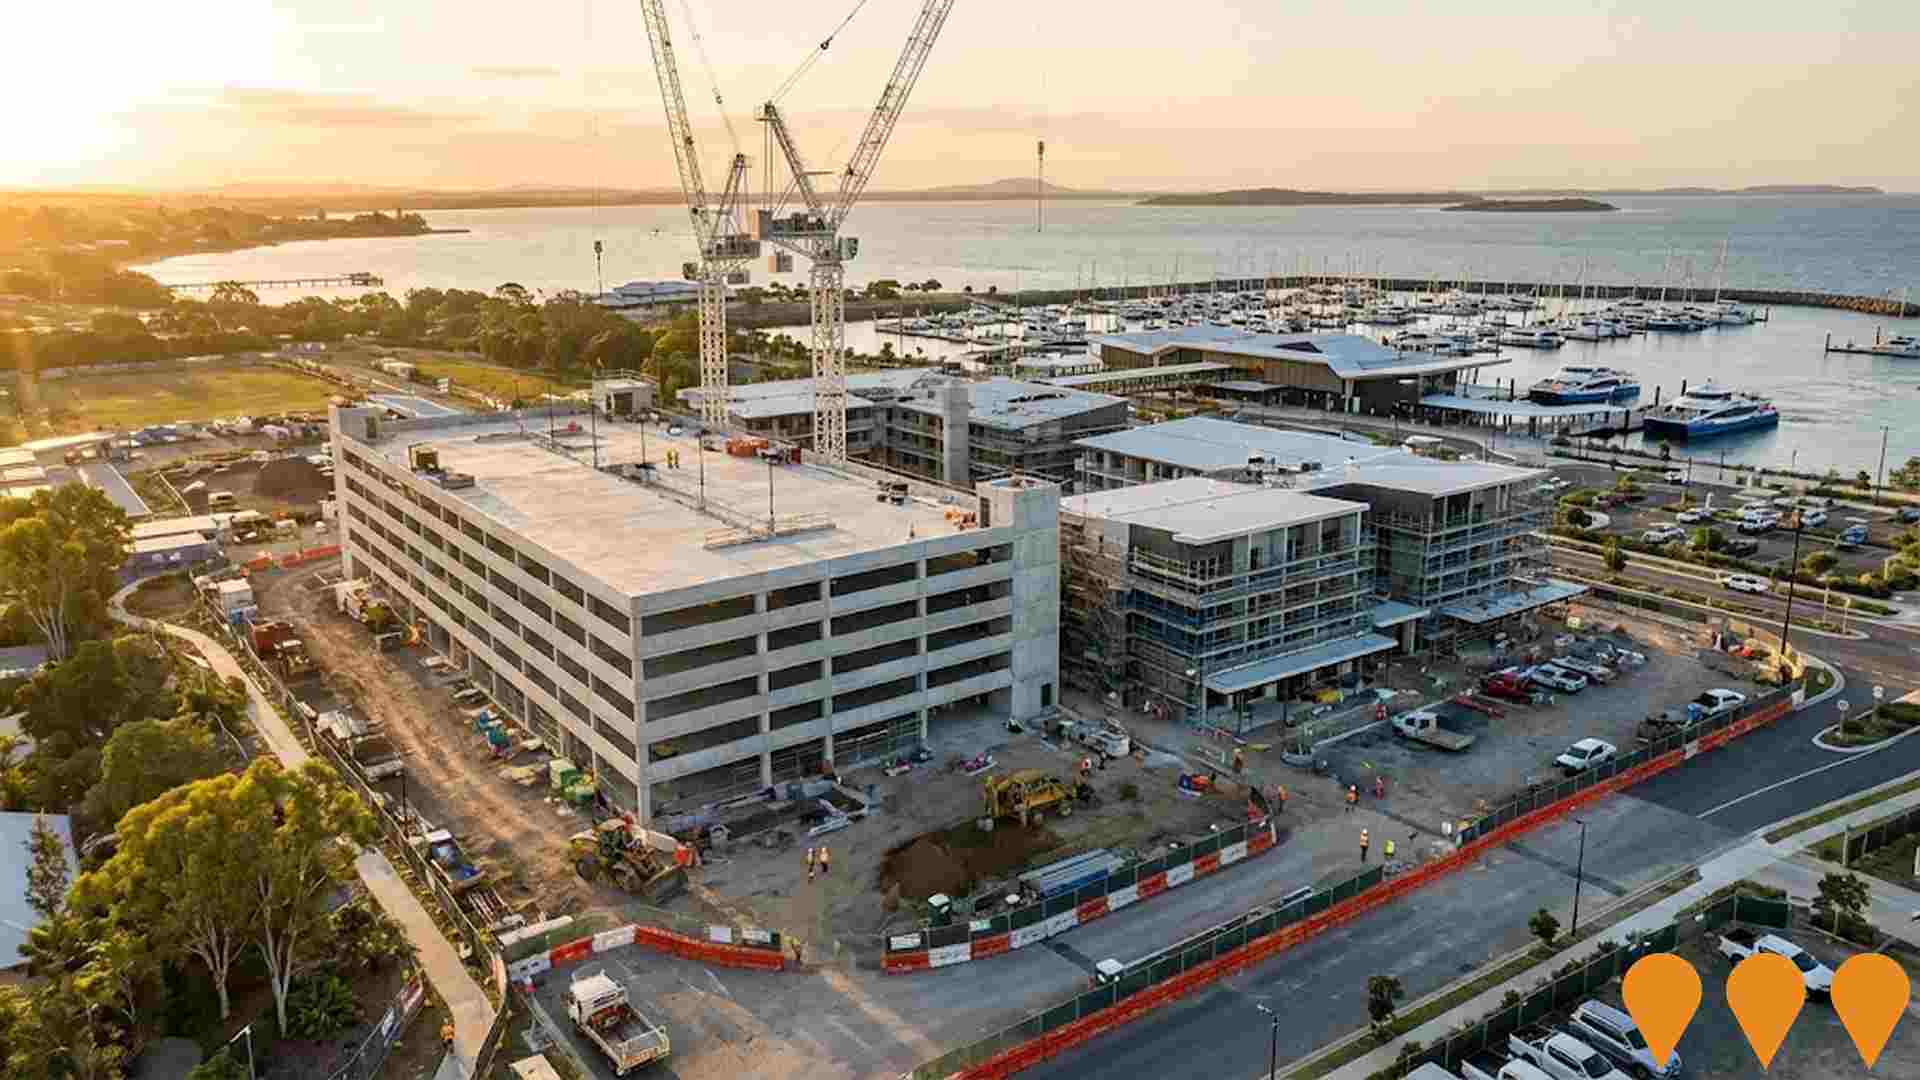
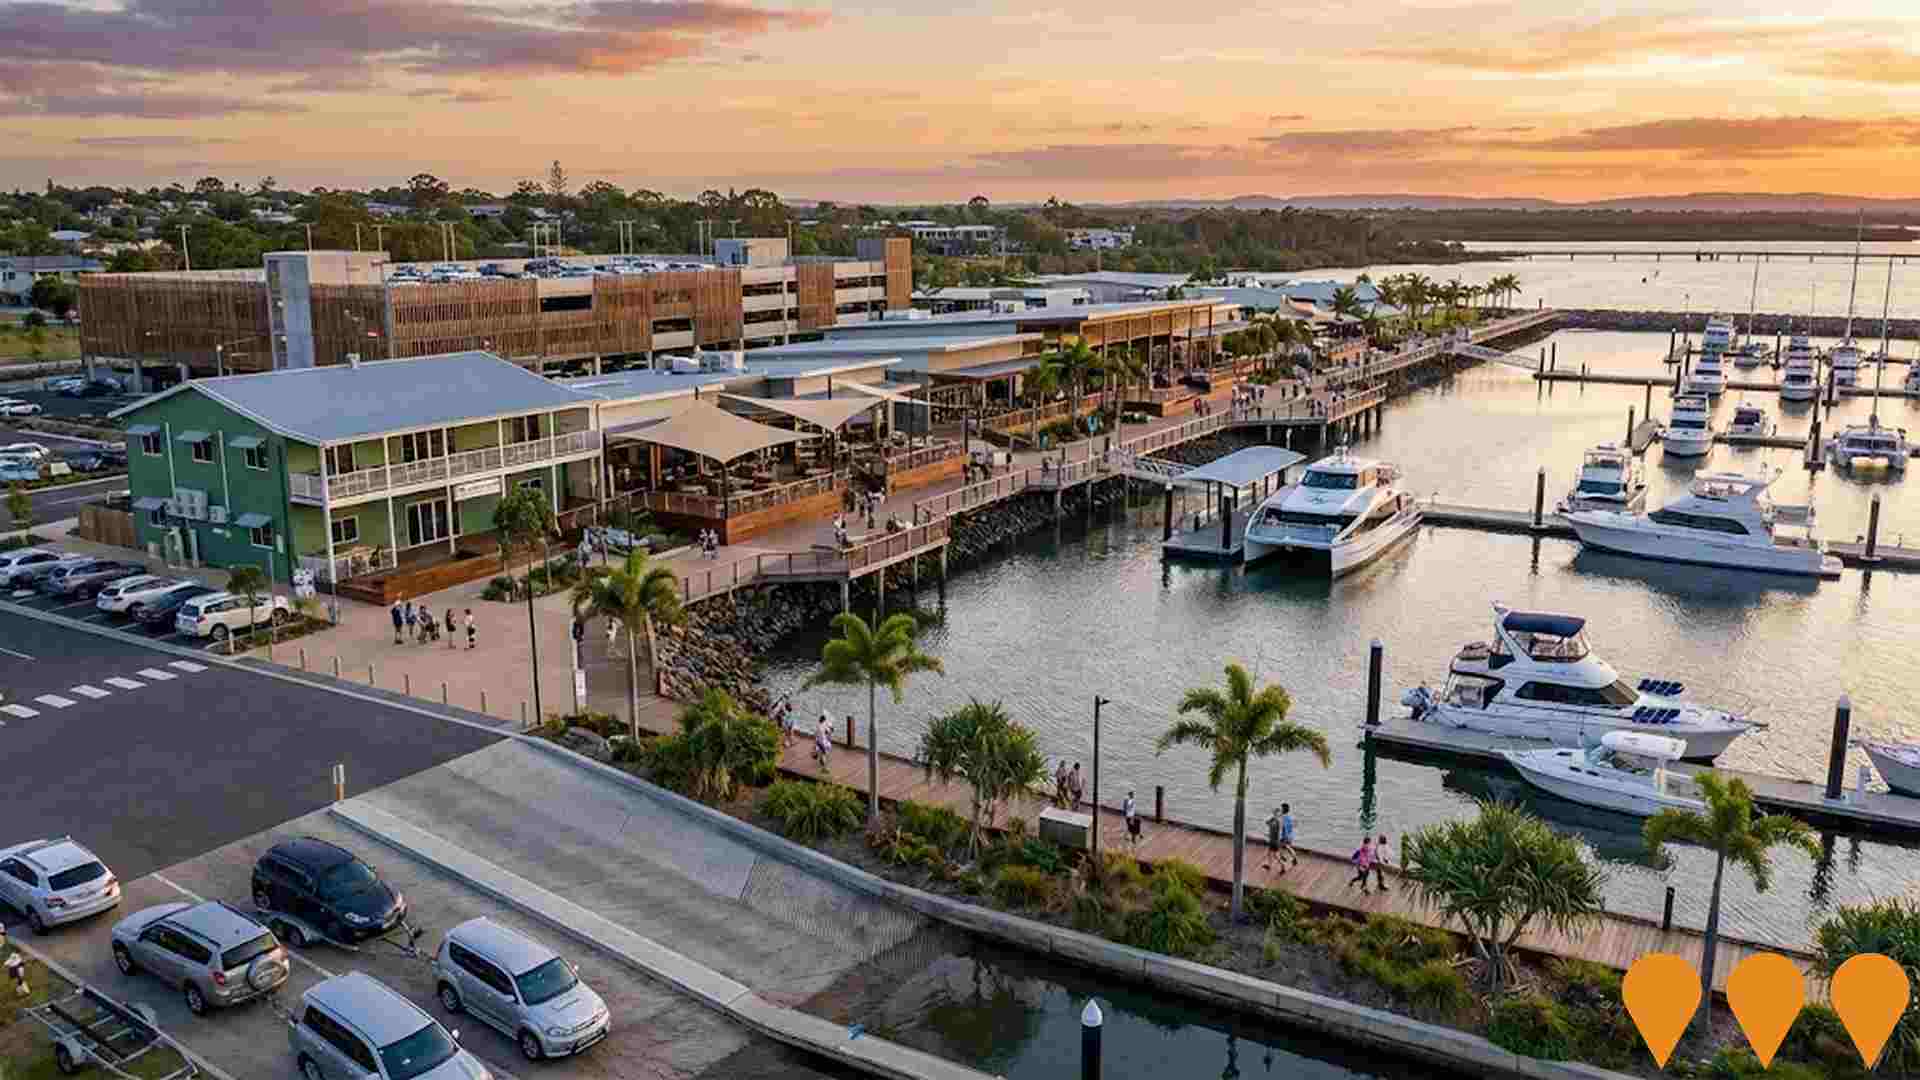
42-hectare waterfront Priority Development Area at Redland Bay transforming Weinam Creek into a regional transport gateway for Southern Moreton Bay Islands. Key features include a new multi-storey car park (2,200+ spaces), upgraded ferry terminal with increased services, marina expansion, commercial marine facilities, retail and dining precinct, public spaces and recreational areas. Delivered via public-private partnership between Economic Development Queensland, Redland City Council, Redland Investment Corporation (RIC) and Consolidated Properties Group. Stage 1 works (marine infrastructure and public realm) are complete; multi-storey car park and mixed-use precinct under construction as of 2025.
Southern Thornlands Priority Development Area
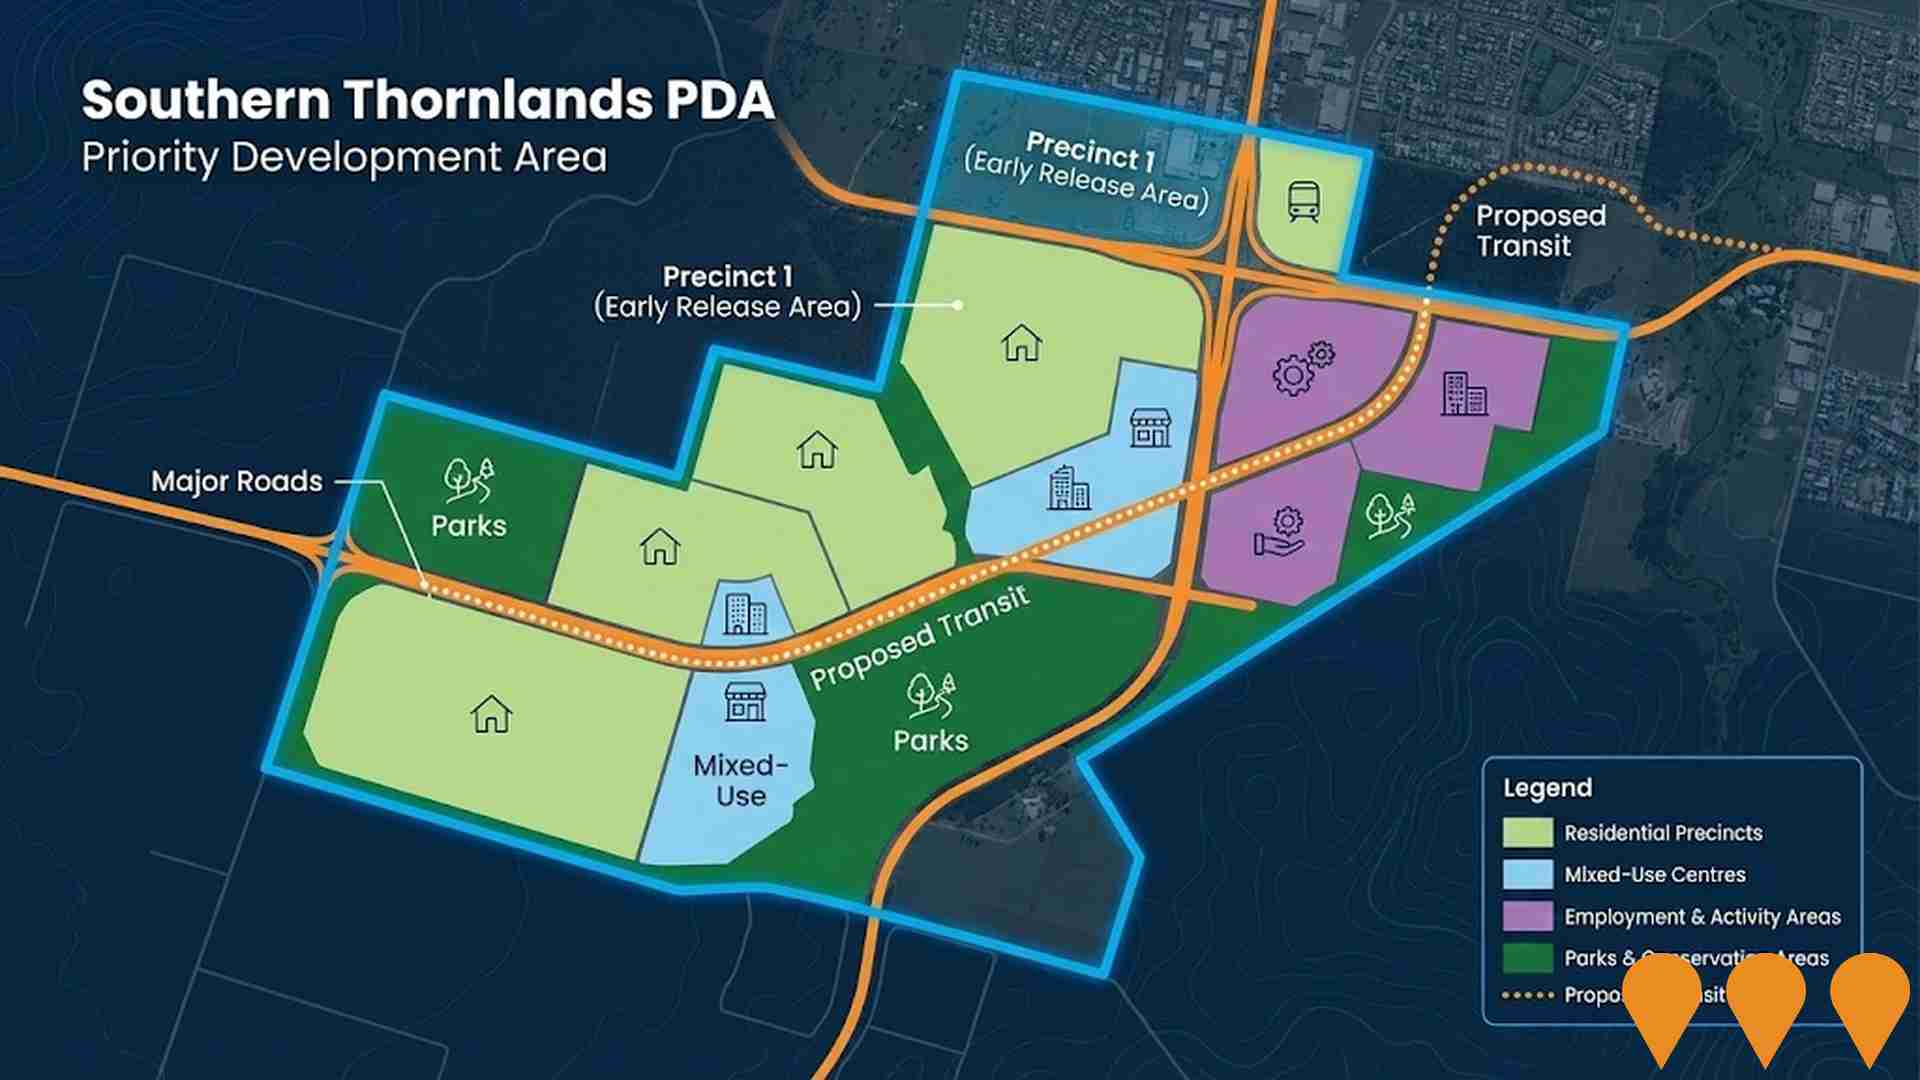
The Southern Thornlands Priority Development Area (PDA) is an 890-hectare site declared on 4 April 2025 by the Queensland Government. It is anticipated to deliver approximately 8,000 new dwellings and accommodate up to 20,000 new residents by 2046. The project will include mixed-use centres, employment areas, activity centres, diverse housing (including up to 20% social and affordable housing in the Early Release Area), and integrated infrastructure for transport, education, community facilities, and stormwater management. The PDA is operating under an Interim Land Use Plan (ILUP) while the full Development Scheme is prepared. Public notification is currently open for the first development application (DEV2025/1656) in Precinct 1 (Early Release Area) which is set to deliver approximately 900 homes.
Cleveland Line Duplication (Park Road to Cleveland)
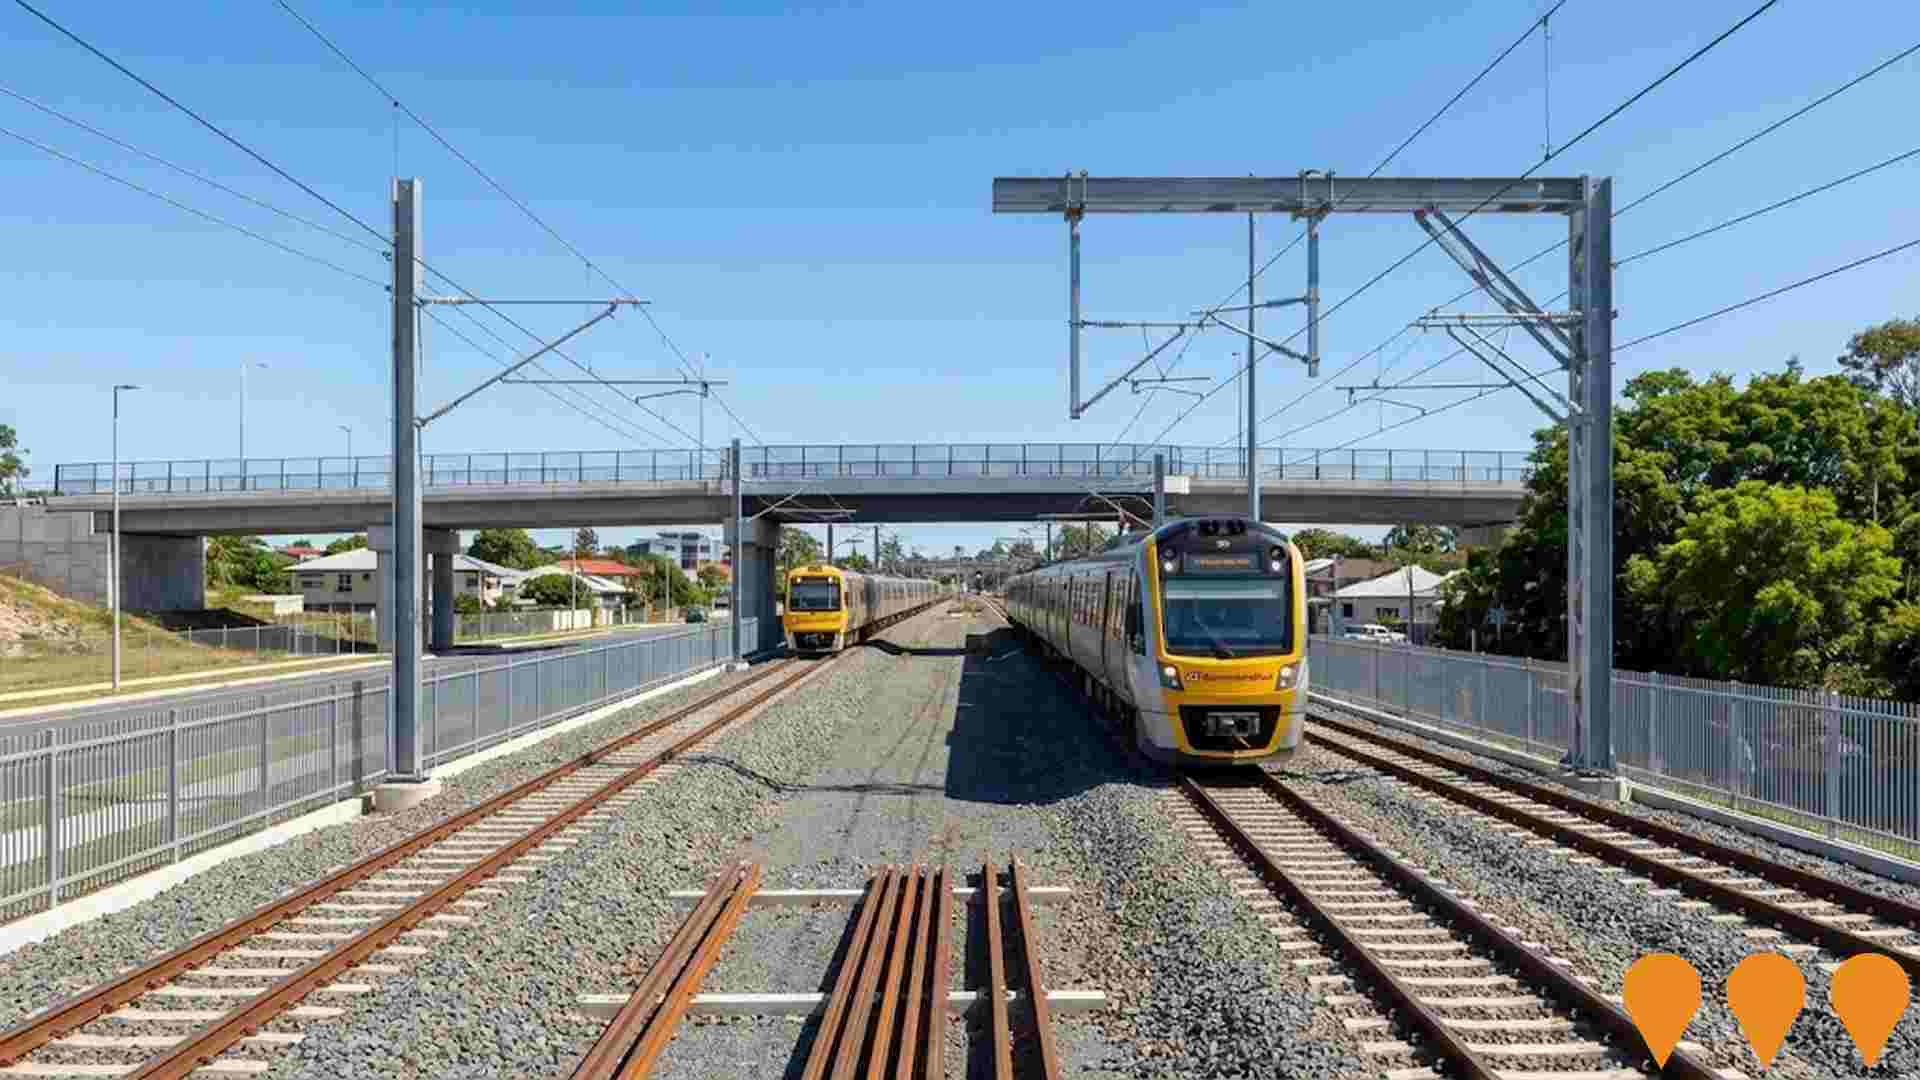
Major upgrade and partial duplication of the Cleveland Line between Park Road and Cleveland stations to increase capacity, improve reliability and enable higher frequency services in preparation for Cross River Rail and the Brisbane 2032 Olympic and Paralympic Games. Works include track duplication (particularly between Lindum and Cleveland), station upgrades, level crossing removals and signalling improvements.
Victoria Point South West Local Plan
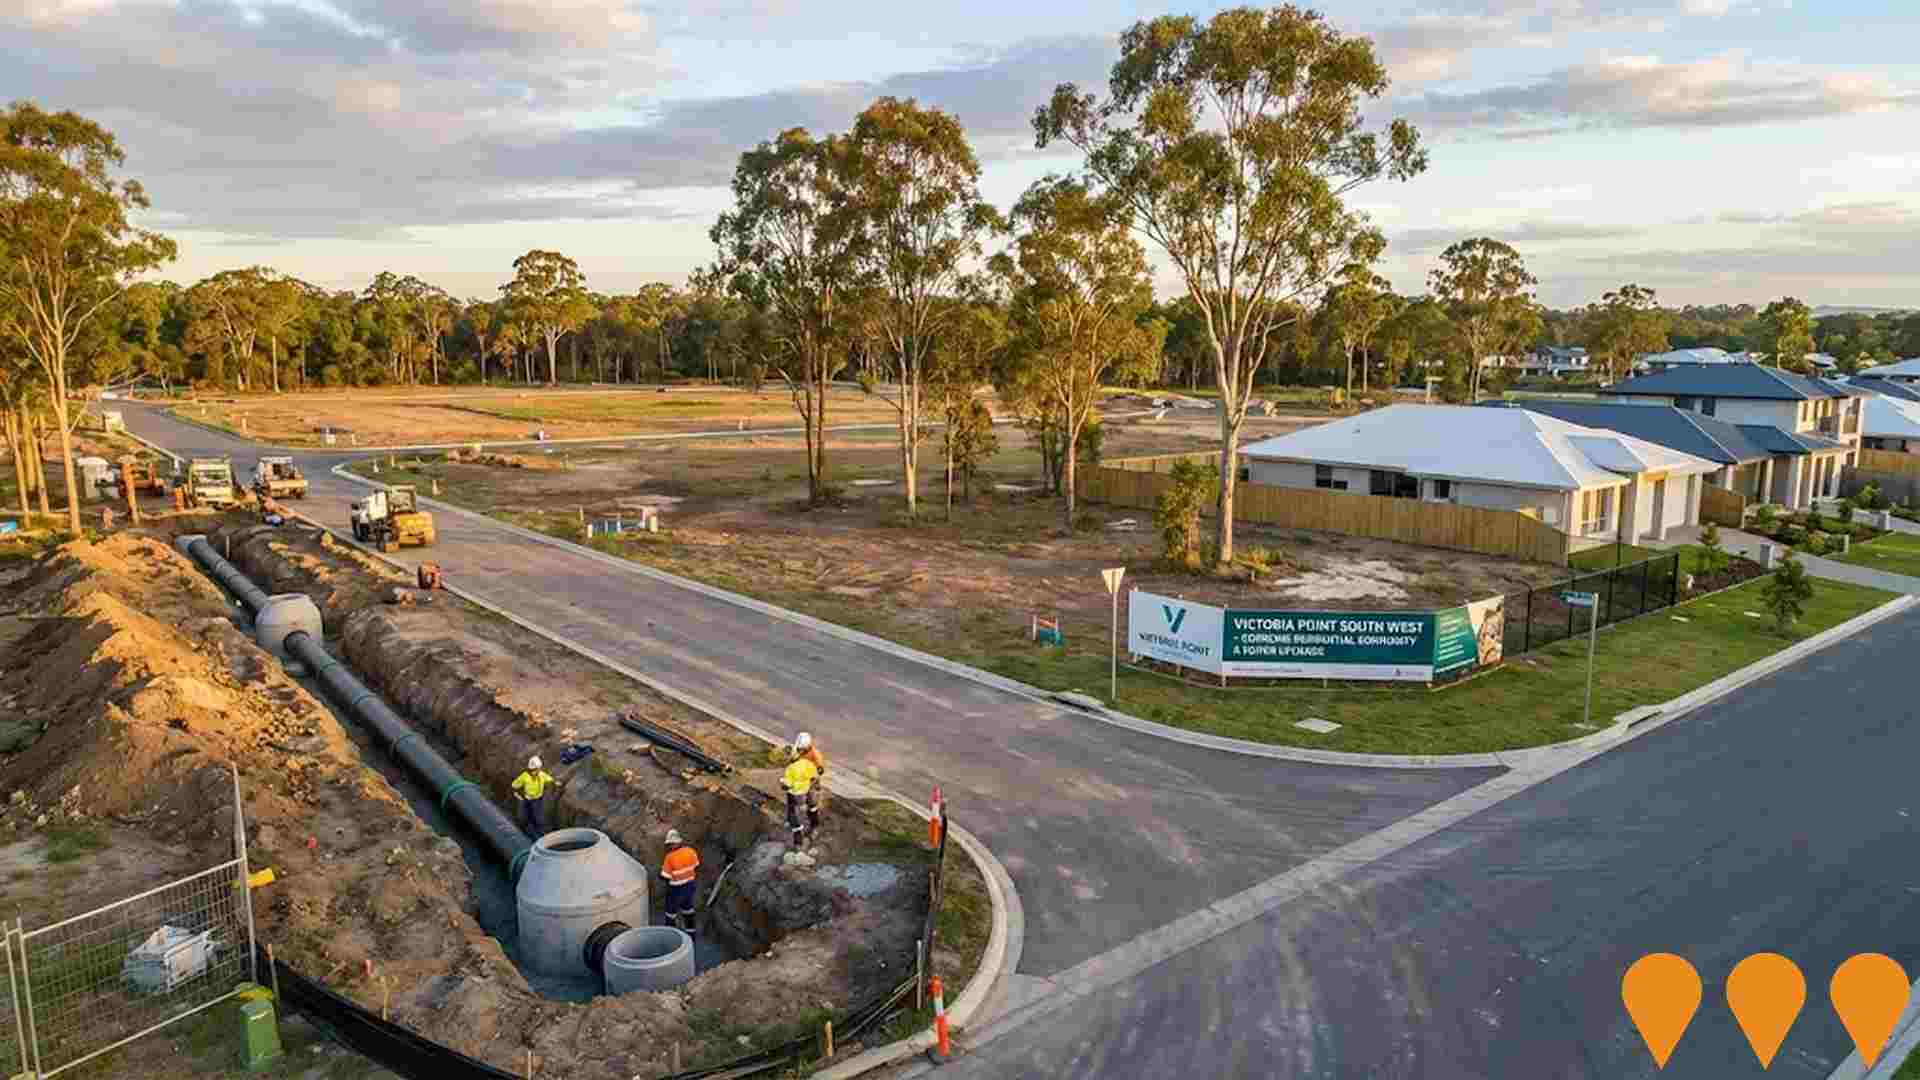
Council-adopted local plan guiding future urban development in southwest Victoria Point. The plan supports an emerging residential community with enabling sewer trunk infrastructure already funded and under construction. The local plan is scheduled for incorporation into the next full review of Redland City Plan, targeted for completion by 2028.
Marina Redland Bay
The Marina Redland Bay project within the Weinam Creek Priority Development Area involves expanding the marina to increase capacity for private boats and ferries, including additional berths, a new boat ramp, upgraded facilities, multi-storey car parking, retail precinct, and improved access for ferry services to Southern Moreton Bay Islands, boosting tourism, recreational boating, and local economy.
Redlands Coast Smart and Connected City Strategy
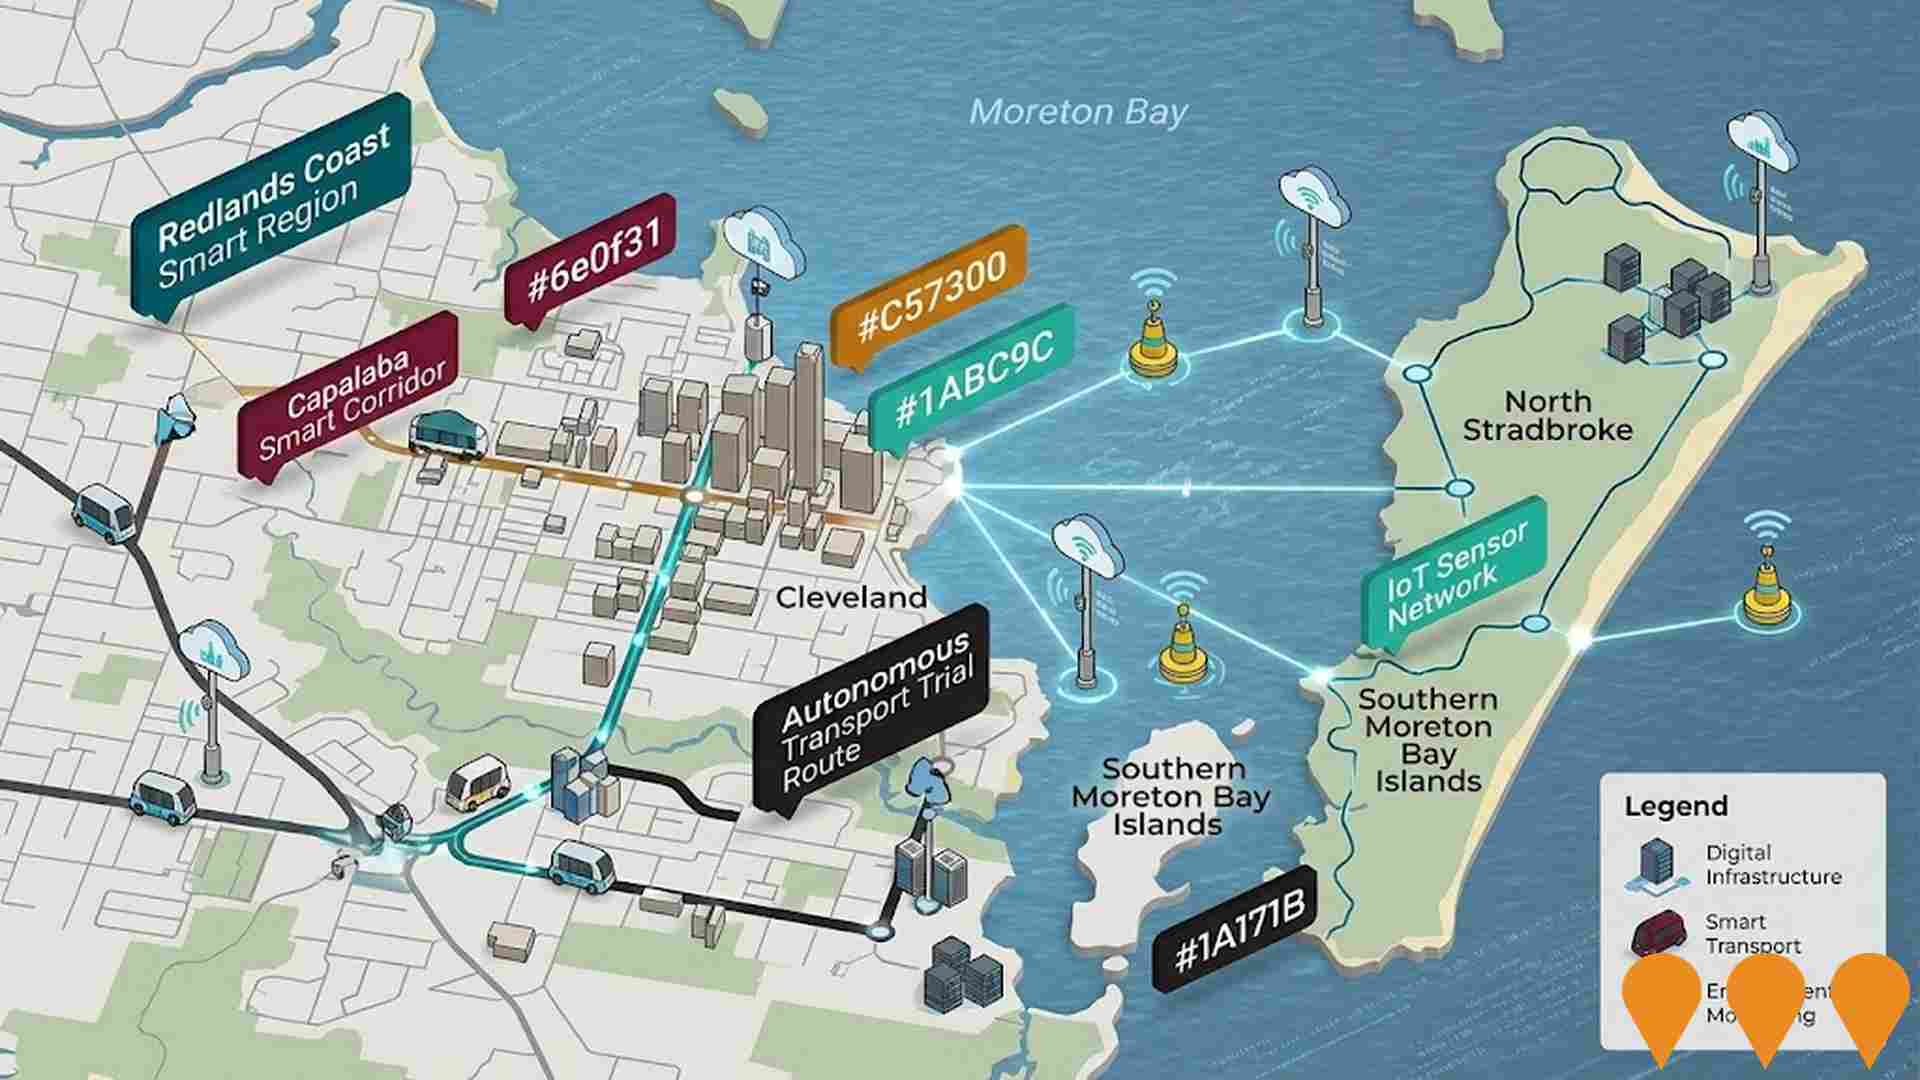
Ongoing multi-year initiative by Redland City Council to enhance liveability, prosperity, and sustainability through smart solutions, including digital infrastructure, IoT sensors, smart traffic systems, and data-driven management. Focus areas include liveability, productivity, innovation, sustainability, and governance. Examples of initiatives: RACQ Smart Shuttle driverless bus trial, smart koala monitoring, and intelligent water monitoring programs. The strategy supports regional collaboration, such as the SEQ Smart Region Digital Plan.
Employment
AreaSearch analysis of employment trends sees Redland Bay performing better than 90% of local markets assessed across Australia
Redland Bay has a skilled workforce with notable representation in the construction sector. Its unemployment rate was 2.2% as of September 2025, lower than Greater Brisbane's 4.0%.
Employment growth over the past year was estimated at 6.7%. As of September 2025, 11,481 residents were employed with a workforce participation rate similar to Greater Brisbane's 64.5%. Key industries include construction, health care & social assistance, and retail trade. The area specializes in construction employment, which is 1.7 times the regional level.
However, professional & technical services are under-represented at 5.0%, compared to Greater Brisbane's 8.9%. Employment opportunities locally appear limited based on Census data analysis. Between September 2024 and September 2025, employment levels increased by 6.7% while the labour force grew by 6.4%, reducing the unemployment rate by 0.3 percentage points. In contrast, Greater Brisbane experienced 3.8% employment growth and a 0.5 percentage point drop in unemployment. As of 25-November-25, Queensland's employment had contracted by 0.01% (losing 1,210 jobs), with the state unemployment rate at 4.2%, closely aligned with the national rate of 4.3%. National employment forecasts from May-25 project a 6.6% increase over five years and 13.7% over ten years. Applying these projections to Redland Bay's employment mix suggests local employment should grow by 6.3% over five years and 13.0% over ten years, based on simple weighting extrapolation for illustrative purposes.
Frequently Asked Questions - Employment
Income
Income metrics indicate excellent economic conditions, with the area achieving higher performance than 75% of national locations assessed by AreaSearch
The Redland Bay SA2 had a median taxpayer income of $60,354 and an average of $72,429 in financial year 2022, according to postcode level ATO data aggregated by AreaSearch. This was higher than the national averages of $55,645 (median) and $70,520 (average) for Greater Brisbane. By September 2025, estimated incomes would be approximately $68,798 (median) and $82,562 (average), based on a 13.99% growth in wages since financial year 2022. Census data indicates that Redland Bay's household, family, and personal incomes cluster around the 64th percentile nationally. Income distribution shows that 37.4% of the population, equating to 7,692 individuals, fall within the $1,500 - $2,999 income range. This is consistent with broader trends in the surrounding region, where 33.3% of the population falls into the same income category. High housing costs consume 16.1% of income in Redland Bay, but strong earnings place disposable income at the 70th percentile nationally. The area's SEIFA income ranking places it in the 6th decile.
Frequently Asked Questions - Income
Housing
Redland Bay is characterized by a predominantly suburban housing profile, with ownership patterns similar to the broader region
Redland Bay's dwellings, as per the latest Census, consisted of 94.6% houses and 5.4% other types (semi-detached, apartments, 'other' dwellings), contrasting with Brisbane metro's 83.9% houses and 16.1% other dwellings. Home ownership in Redland Bay stood at 29.9%, lower than Brisbane metro, with mortgaged dwellings at 47.1% and rented ones at 23.0%. The median monthly mortgage repayment was $2,076, above the Brisbane metro average of $2,000, while median weekly rent was $470, higher than Brisbane metro's $425. Nationally, Redland Bay's mortgage repayments were significantly higher than the Australian average of $1,863, with rents substantially above the national figure of $375.
Frequently Asked Questions - Housing
Household Composition
Redland Bay features high concentrations of family households, with a higher-than-average median household size
Family households account for 84.2% of all households, including 40.1% couples with children, 32.3% couples without children, and 11.2% single parent families. Non-family households constitute the remaining 15.8%, with lone person households at 13.6% and group households comprising 2.0%. The median household size is 2.8 people, larger than the Greater Brisbane average of 2.6.
Frequently Asked Questions - Households
Local Schools & Education
Educational attainment in Redland Bay aligns closely with national averages, showing typical qualification patterns and performance metrics
The area's university qualification rate is 17.5%, significantly lower than Greater Brisbane's average of 30.5%. Bachelor degrees are most common at 12.5%, followed by postgraduate qualifications (3.1%) and graduate diplomas (1.9%). Vocational credentials are prevalent, with 44.0% of residents aged 15+ holding them, including advanced diplomas (12.5%) and certificates (31.5%). Educational participation is high at 28.7%, comprising primary education (10.6%), secondary education (8.9%), and tertiary education (3.4%).
Educational participation is notably high, with 28.7% of residents currently enrolled in formal education. This includes 10.6% in primary education, 8.9% in secondary education, and 3.4% pursuing tertiary education.
Frequently Asked Questions - Education
Schools Detail
Nearby Services & Amenities
Transport
Transport servicing is low compared to other areas nationally based on assessment of service frequency, route connectivity and accessibility
The analysis of public transport in Redland Bay shows that there are 51 active transport stops currently operating. These stops offer a mix of ferry and bus services. Six individual routes service these stops, collectively facilitating 1,810 weekly passenger trips.
The accessibility of transport is rated as good, with residents typically located approximately 366 meters from the nearest transport stop. On average, across all routes, there are 258 trips per day, which equates to around 35 weekly trips per individual stop.
Frequently Asked Questions - Transport
Transport Stops Detail
Health
Health outcomes in Redland Bay are marginally below the national average with common health conditions slightly more prevalent than average across both younger and older age cohorts
Redland Bay shows below-average health outcomes, with common conditions slightly more prevalent among both younger and older residents compared to average.
Private health cover is very high at approximately 55%, covering about 11,374 people. The most frequent medical issues are asthma (8.8%) and mental health concerns (8.5%). A higher proportion of residents, 67.3%, report no medical ailments compared to Greater Brisbane's 64.6%. Residents aged 65 and over make up 19.2% of the population, totaling 3,955 people, which is lower than Greater Brisbane's 25.3%. Overall, Redland Bay's health profile aligns broadly with that of the general population.
Frequently Asked Questions - Health
Cultural Diversity
Redland Bay ranks below the Australian average when compared to other local markets across a number of language and cultural background related metrics
Redland Bay had a cultural diversity index below the average, with 79.3% of its population born in Australia, 89.8% being citizens, and 94.5% speaking English only at home. Christianity was the predominant religion in Redland Bay, comprising 51.1% of the population, compared to 52.8% across Greater Brisbane. The top three ancestry groups were English (32.5%), Australian (26.9%), and Scottish (8.5%).
Notably, New Zealanders were overrepresented at 1.4%, South Africans were equally represented at 1.0%, and Maori were also overrepresented at 0.9%.
Frequently Asked Questions - Diversity
Age
Redland Bay's population aligns closely with national norms in age terms
The median age in Redland Bay is 39 years, slightly higher than Greater Brisbane's average of 36 years and close to Australia's median of 38 years. Compared to Greater Brisbane, Redland Bay has a higher percentage of residents aged 65-74 (11.0%) but fewer residents aged 25-34 (10.2%). Between the 2016 Census and the 2021 Census, the proportion of residents aged 75 to 84 increased from 5.2% to 6.3%, while the proportion of residents aged 5 to 14 decreased from 14.4% to 13.2%. By 2041, Redland Bay's age composition is projected to change significantly. The number of residents aged 75 to 84 is expected to grow by 85%, increasing from 1,295 to 2,393. This growth will contribute to the overall increase in the proportion of residents aged 65 and above, who are projected to comprise 63% of the population growth. Conversely, population declines are projected for the age groups 35 to 44 and 0 to 4 years.
